Phase lines in mean-field models with nonuniform external forces
Abstract
We look at the influence of external fields on systems described by generic free energy functional of the order parameter. The external force may have arbitrary spatial dependence, and the order parameter coupling may be nonlinear. The treatment generalizes seemingly disparate works, such as pure fluids, liquid and polymer mixtures, lipid monolayers, and colloidal suspensions in electric fields, fluids, and nematics in gravity, solutions in an ultracentrifuge, and liquid mixtures in laser radiation. The phase lines and thermodynamic behavior are calculated at the mean-field level. We find a “surface” critical point that can be shifted to higher or lower temperatures than the bulk critical point. Below this point, the transition from a “gas” phase to a “liquid” phase is first-order, while above it, the transition is second-order. The second-order line is affected by the spatial dependence of the force, while the first-order line is universal. Moreover, the susceptibility may diverge at a finite location . Several analytical expressions are given in the limit where a Landau expansion of the free energy is valid.
I Introduction
The influence of external fields, such as electric Landau and Lifshitz (1957) or magnetic fields Kittel and Kroemer (1998), gravity Moldover et al. (1979), shear Larson (1999), compression and deformation fields Landau et al. (1986), on given systems has been studied extensively over the decades both theoretically and experimentally. A microscopic picture of local and global forces enables one to obtain the dynamical and thermodynamic behavior on a sufficiently large scale using a coarse-grained order-parameter Brini et al. (2013); Müller-Plathe (2002). While a small field may change the system’s state slightly, the interesting cases occur when the field is large enough to induce a phase transition. In most studies, the external field is assumed to be (i) constant in space, and (ii) the coupling between field and order-parameter is bilinear, e.g., a term in classical magnetic (Ising) models Huang (2008) ( is magnetization and is the field amplitude), or a term in gravity ( is a fluid’s density, the acceleration on Earth, and a height above an arbitrary reference) Moldover et al. (1979).
The influence of Earth’s gravity on pure fluids and liquid mixtures has been studied thoroughly, and gravity was shown to cause small changes in the behavior close to the critical point Hohenberg and Barmatz (1972); Dickinson et al. (1975); Greer et al. (1975); Leung and Miller (1975); Moldover et al. (1979). Electric fields have been the subject of equally extensive study. Strain due to electrostriction is well documented in solids and fluids Zimmerli et al. (1999a, b). Even in the absence of electrostriction, Landau and Lifshitz showed that when a simple fluid is subject to a uniform electric field , if the constitutive relation between permittivity and density is nonlinear, the critical temperature may shift by a small amount, proportional to Landau and Lifshitz (1957).
The field affects the system’s state as it couples to its mass or charge densities, magnetic or electrical dipoles, etc. In equilibrium, the system’s order parameter is given by an equation expressing energy minimization. In general, the field itself obeys another equation, and thus, variations in the order parameter affect the field self-consistently. In many cases, though, this back-action on the field, manifest in the electrostatic case by the existence of Laplace or Poisson’s equations, can be solved, and the field can be expressed explicitly as a function of the order parameter.
In recent years, several studies have stressed the importance of spatially nonuniform fields on the state of simple fluids Tsori et al. (2004); Tsori (2009); Vink and Archer (2012). When an initially homogeneous system is subject to a smoothly varying field, the density, composition, magnetization, etc., changes smoothly with coordinate. If the fluid is inherently bistable, then a sufficiently strong external field can lead to phase separation Samin and Tsori (2011), nucleation Kroll and Tsori (2021), wetting-like behavior Tsori and Leibler (2007a); Tsori (2021), or filling transitions Samin and Tsori (2016). Similar behavior has been reported in colloidal suspensions Sullivan et al. (2006) and lipid monolayers Lee et al. (1994); McConnell et al. (1984) in electric fields, in mixtures in laser radiation Delville et al. (1999); Nishioka et al. (2000); Tran-Cong-Miyata et al. (2004); Walton and Wynne (2018), in nematic rods in gravity Baulin and Khokhlov (1999), in pumped magnetic systems Ben Dor et al. (2022), and in molecular solutions in an ultracentrifuge Rossen et al. (1986).
Here we investigate the thermodynamics of systems exposed to a spatially nonuniform external field. The system is described by a generic free energy functional depending on the coarse-grained order-parameter . The expression for the field is quite general: the spatial dependence can be arbitrary and the coupling to the order-parameter is nonlinear. The current framework thus unifies previous works on seemingly disparate systems.
II Model
The starting point of our treatment is the following mean-field free energy density,
| (1) |
where is a bulk energy depending on the order-parameter and on temperature ; it has specific forms for liquid-liquid, liquid-vapor, magnetic, or other systems, but we leave it here in a general form. The gradient-squared term is essential for describing interfacial and wetting phenomena Bonn et al. (2009); Nakanishi and Fisher (1982); Leger and Joanny (1992); Andelman et al. (1988), with being proportional to a characteristic molecular scale. is the chemical potential. We are interested in looking at the shift to the phase lines at all values of and especially close to the bulk critical temperature . is assumed to be convex at all values of when and concave at a certain “window” of when . is a function that contains the influence of the external field. The coordinate is a dimensionless distance in effective one-dimensional systems, i.e., in systems with Cartesian, cylindrical, or spherical symmetries. There is a location where the external force attains its maximum. For the monotonic forces considered below, this point can be thought of as being a “surface” even in the absence of a physical surface.
The bulk critical point is classically obtained as a solution to the two coupled equations: for the two variables and . A nonuniform force leads to a nonuniform profile . One may then ask: what is the bulk point for which the composition and temperature at the “surface” obey the critical-point conditions?
We focus on external fields that can be written in the form
| (2) |
For simplicity in the analysis, we assume that is a monotonically decreasing or increasing function of and is independent of . In addition, monotonically decreases, e.g., with . The dimensionless distance is in the range ( is the “surface”). Without loss of generality and .
III Three equations for surface critical point and phase diagram
The equilibrium profile obeys the Euler–Lagrange equation
| (3) |
At large distances, , the external force vanishes and we retrieve a bulk system at composition ; the bulk chemical potential is . In contrast to classical wetting phenomena Cahn (1977); Leger and Joanny (1992); Bonn et al. (2009), Eq. (3) cannot be integrated because of the -dependence. It is instructive to consider cases where is characterized by a spatial scale much larger than the typical interfacial length . In this sharp-kink approximation, the gradient-squared term in can be neglected and the free energy is governed by bulk effects. We denote by the surface composition, i.e. . When satisfies the critical-point conditions it obeys the following three equations:
| (4) | |||
| (5) | |||
| (6) |
We now solve these equations with as follows: We solve Eqs. (4) and (5) simultaneously: Eq. (5) gives ; when substituted in Eq. (4), the bulk value for the given temperature can be found from the definition of . Similarly, we solve Eqs. (4) and (6) simultaneously: that solves Eq. (6) can be used in Eq. (4) to give the corresponding bulk value .
III.1 Solutions of Eqs. (4)-(6)
Direct solution of equations (4)-(6) is straightforward; however, to emphasize the general aspects of the solution and to increase the physical insight, we present here a graphical construction.
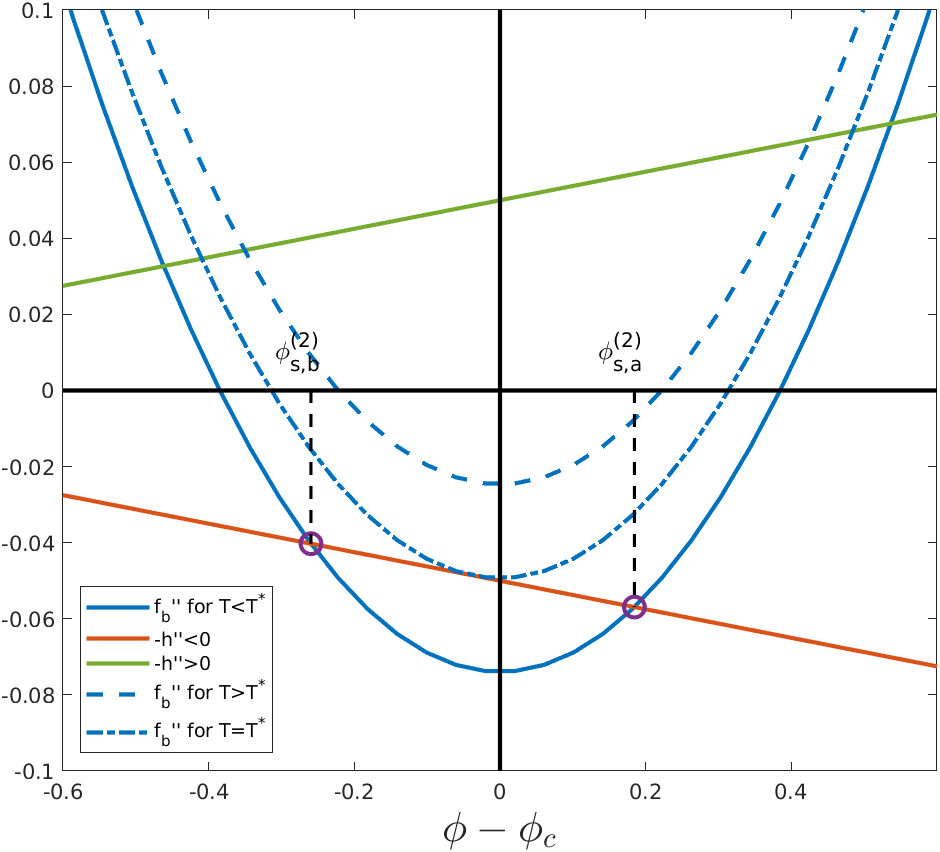
Graphical solution of Eq. (5) and definition of . Figure 1 shows when is sufficiently small (large , solid blue line) and (red line). The intersection of the two curves is the solution to Eq. (5) when . The curves intersect at two compositions, denoted and . We define . The subscript a or b denotes either solution; the superscript signifies that they are solutions of the second derivative of . Each of the two solutions (i = a, b) has a different bulk value of , obtained when it is substituted in Eq. (4). We call these values and .
A different behavior occurs if the temperature is not low enough (alternatively, if the strength of the external force , is too large), as indicated by the dashed blue line – in this case, the curves do not intersect, hence there is no solution to Eq. (5). We now define as the temperature at which and are equal, see dashed-dot line in Fig. 1.
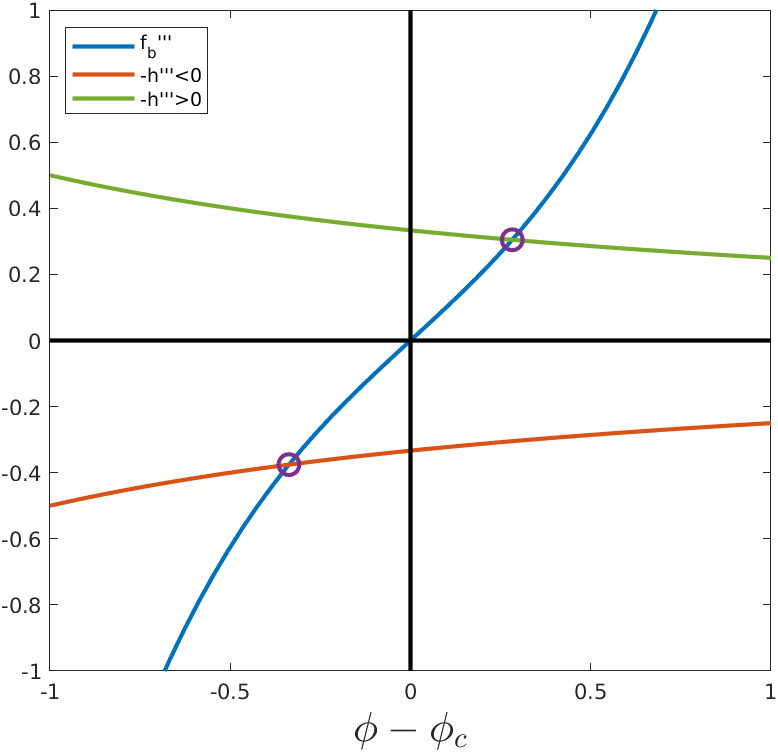
Graphical solution of Eq. (6). The graphical solution is shown in Fig. 2. Here, it is easy to see that one solution always exists. Once this root is known, it can be substituted in Eq. (4) to yield the corresponding bulk value .
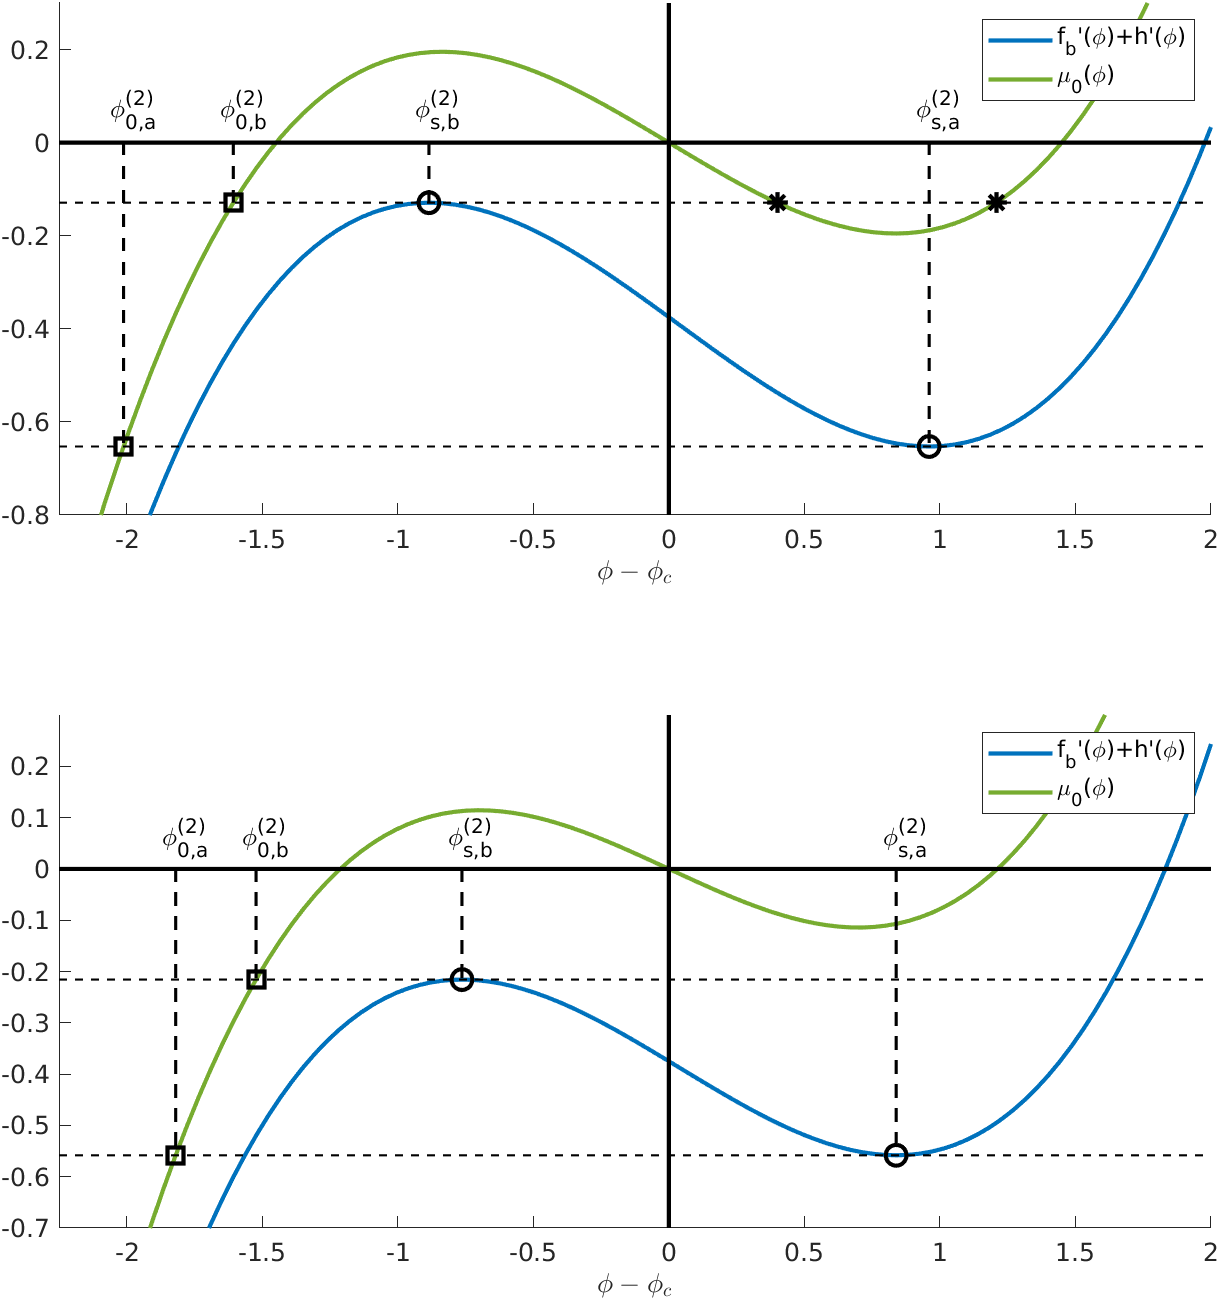
Graphical solution of Eq. (4). Figure 3 shows the graphical construction for finding the value of and . The figure has two parts, for two different temperatures – top panel is for low and the bottom is for higher (both smaller than ). There are two curves in each part, representing two parts of Eq. (4). The blue curve is and the green curve is . The two circles mark the values of and . The solution to Eq. (4) is obtained as the intersection of the horizontal line at each of these points with the green curve. At the low temperature, there are three possible values of . The correct solutions are marked with squares, the two other solutions are marked with “*”. At the higher temperature (bottom panel), there is only one possible value of .
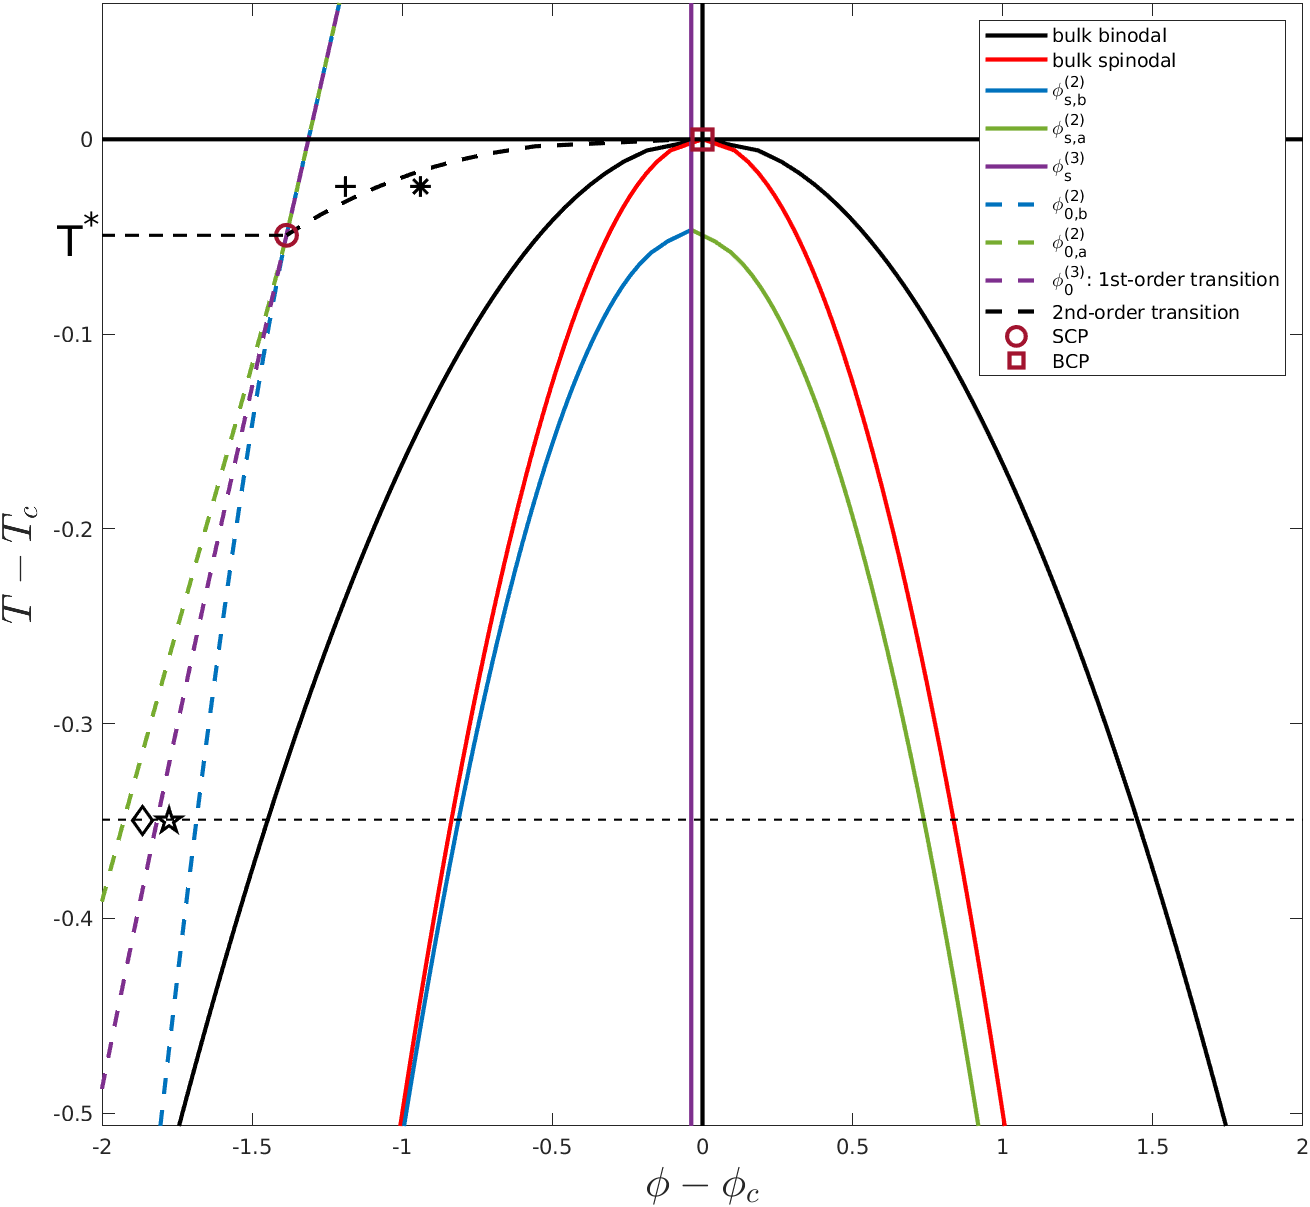
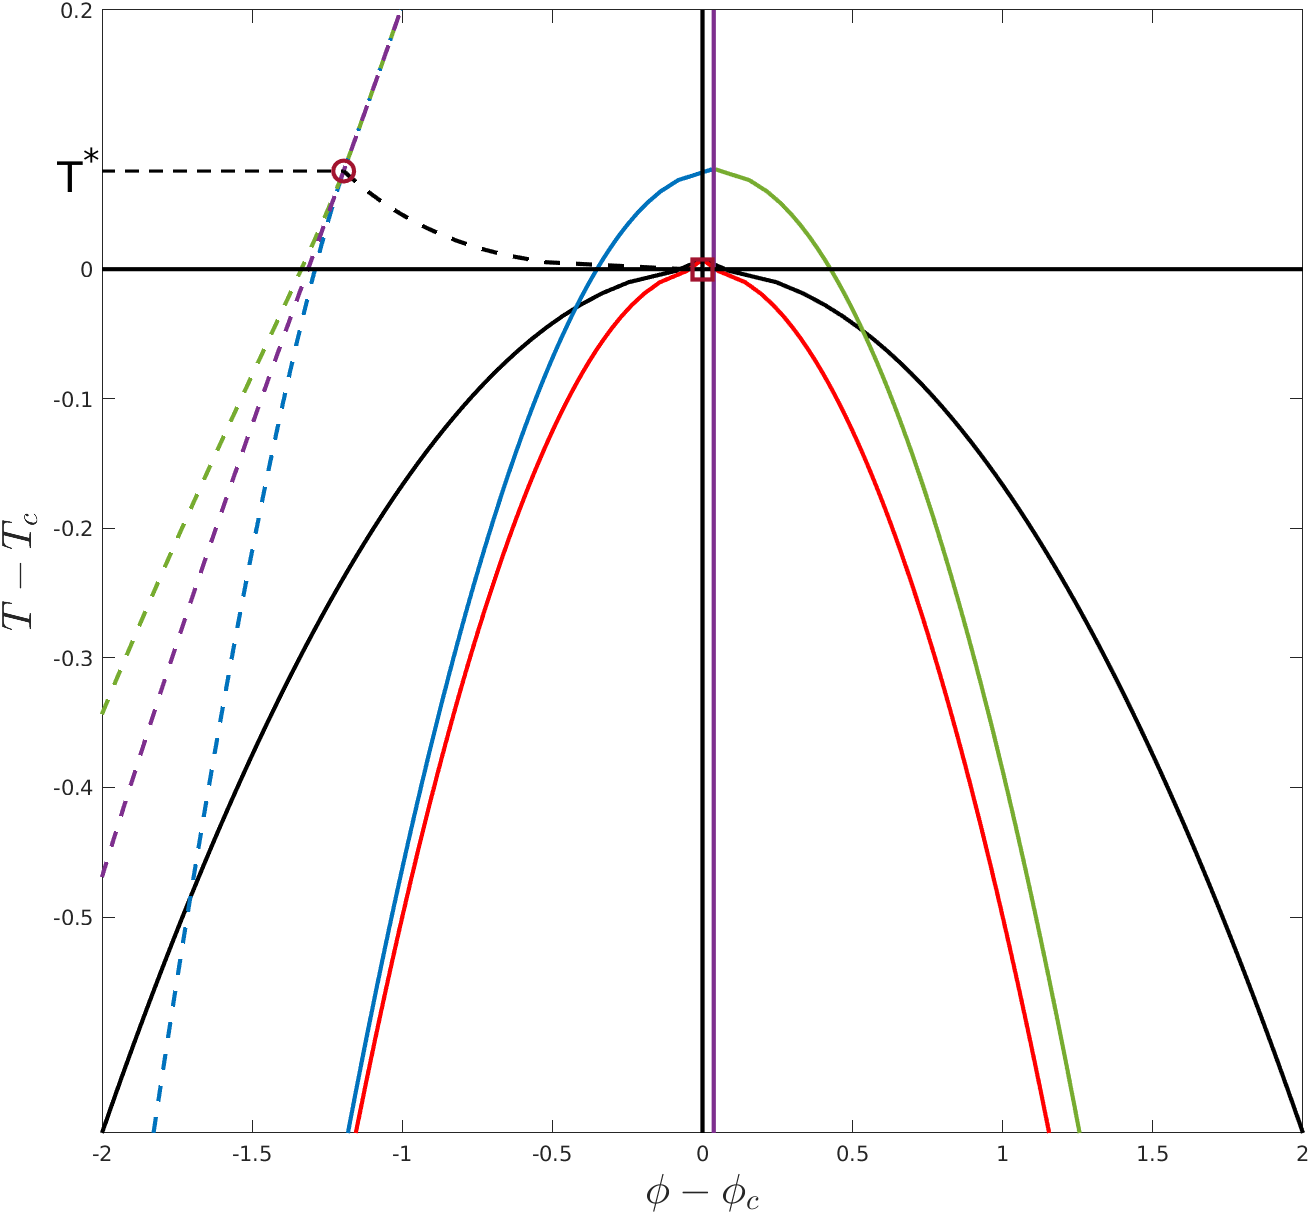
Phase diagram. The resulting phase diagram is shown in Fig. 4. For sufficiently low temperatures, two solutions to Eq. (5) exist, and (green and blue, respectively), and usually they are below the spinodal curve. As the temperature is elevated, the two solutions approach each other. At , they merge. The corresponding bulk composition curves and (dashed green and blue) behave similarly, and merge at at a “surface critical point” (SCP), marked by a large circle. At this point, the bulk values and are such that, at the surface, the second and third derivative of the energy with respect to both vanish.
The curve is a first-order phase line; crossing it from low to high values of at constant leads to a discontinuous change in the profile . This line is universal and does not depend on the exact form of the spatial dependence of the external force, .
The SCP point depends on the amplitude of the external forcing. The point displaces when the amplitude of the external force reduces toward zero. For any finite value of , Eqs. (4)-(6) yield the triplet solution . The second-order phase transition line, dashed black curve, is the locus of points for increasing from (SCP) to (BCP). Crossing it leads to a continuous change in the profile . On the second-order line, Eq. (5) is satisfied at a finite distance from it, at that depends on temperature. Fig. 5 is similar but here is positive and the SCP is found at temperatures higher than .
One can now see that the SCP point and the phase transition lines would not appreciably change even if the term in the energy were included. Indeed, if Eq. (4) has a term, just before the transition, the profiles are smoothly varying with and this second derivative is small. In addition, by definition, the interface separating high and low values of is an inflection point in the profile so .
IV Construction of profiles
To construct the composition profiles, we look at the function defined by
| (7) |
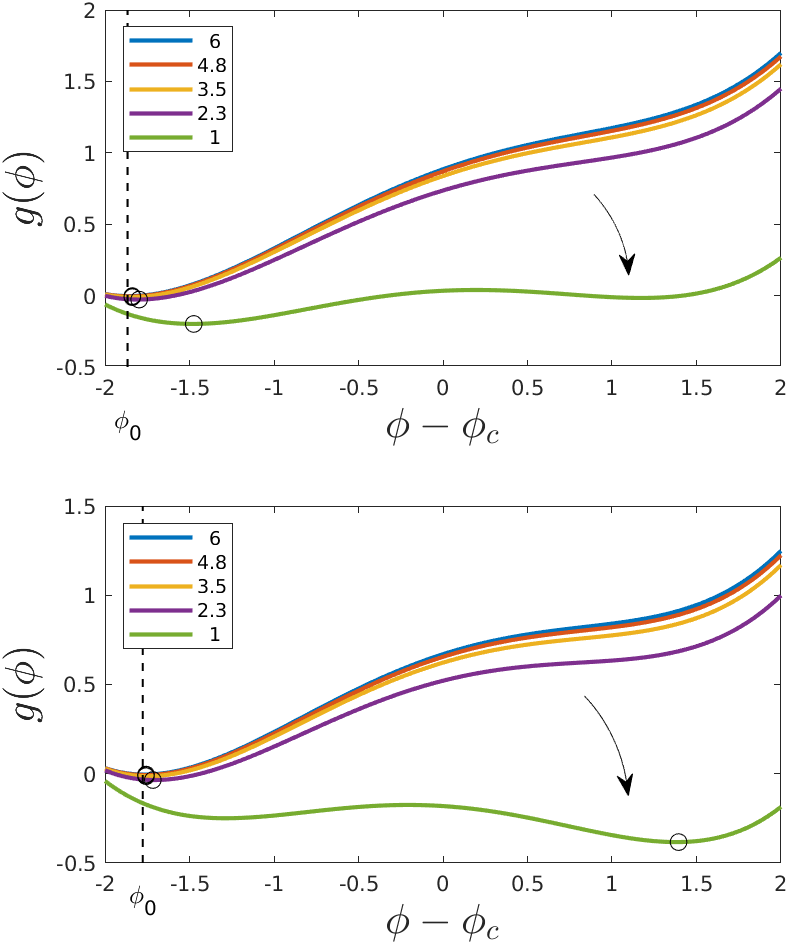
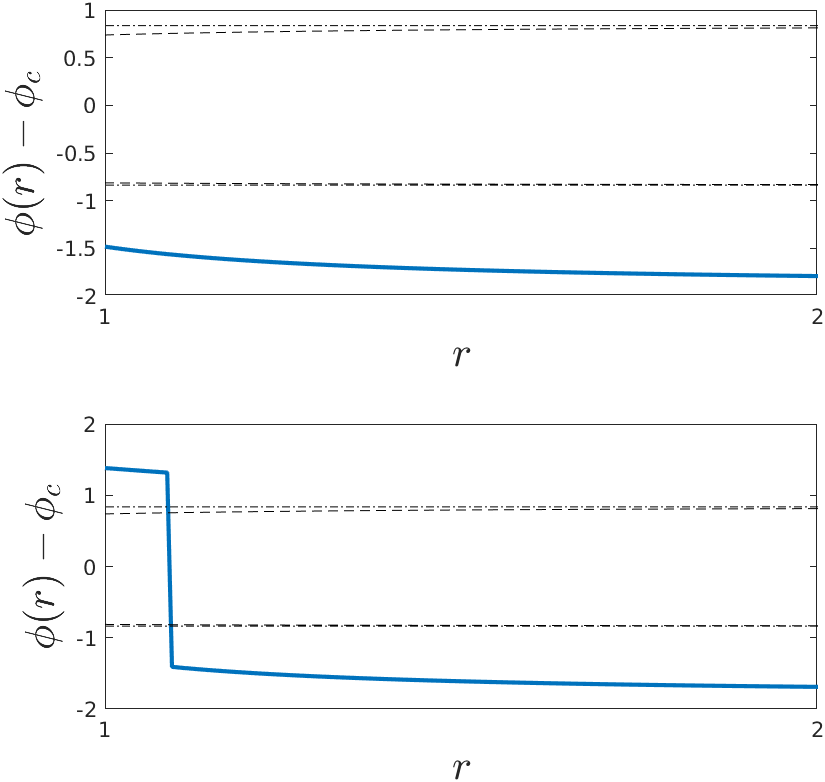
where is the bulk pressure. The “correct” value of composition at a specific is the value of that minimizes . Next, we concentrate on two points, marked in Fig. 4: the bullet is “inside” the first-order line, and the diamond is outside. The grand-potential plots for the two points are shown in Fig. 6 for several values of . The top panel shows the curves when the bulk composition is outside of the first-order line (diamond). When is large, the minimum is at (dashed vertical line). As decreases, the minimum gradually shifts to larger values of . Yet, even at the smallest possible value of () the minimum stays rather close to . The behavior is different at the bullet point, found below the first-order line. The bottom panel shows the curves in this case. Here, as decreases from large to small values, a discontinuous transition occurs between low and high values of .
The corresponding profiles are shown in Fig. 7.
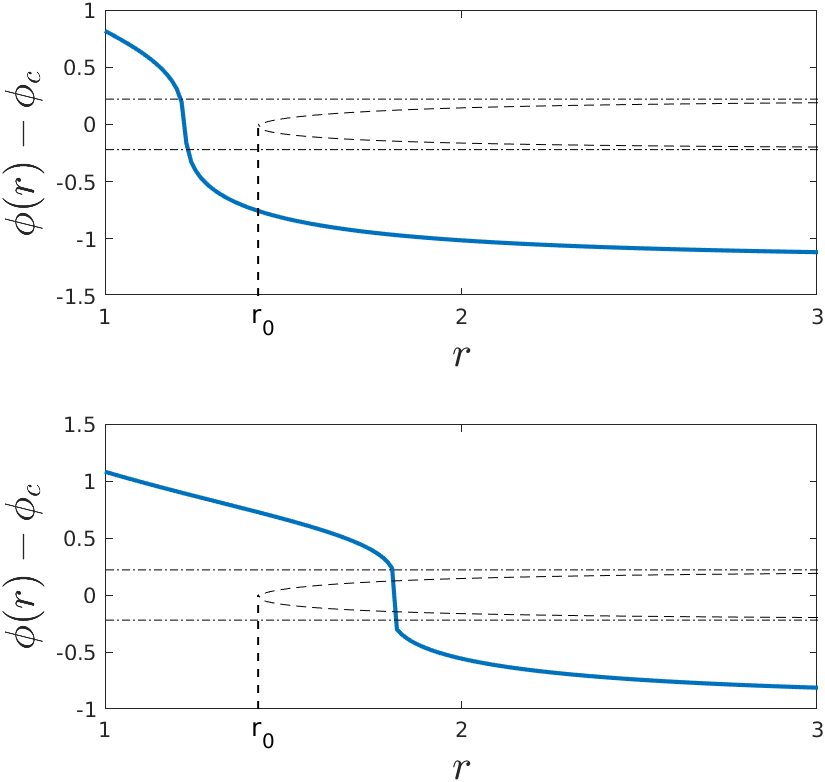
We now look at two points at a temperature above , marked by “+” and “” in Fig. 4. Across the dashed black line in the figure, the transition is second-order. Indeed, Fig. 8 shows the corresponding curves. When the point is to the left (“+”), the profile is continuous (though it might have a relatively steep domain). When the point is to the right (“”), the profile becomes discontinuous. The difference between this scenario and the previous one is that here the discontinuous profile emerges from the continuous one as a second-order phase transition. The second-order line is shown as a dashed black curve in Fig. 4.
In Figs. 7 and 8, we show two dashed black lines. They correspond to the two possible solutions of , that is, they are solutions of
| (8) |
for a specific value of . For low temperatures, , the two curves only meet at some smaller than unity, which is not valid. For high temperatures, , they meet at a finite value of , denoted . When the jump in the profile occurs exactly at , one is on the second-order phase transition line. In Fig. 8 (bottom) the jump is for and therefore in this example we are already past the phase transition line (point “”). For a given and amplitude of external force, the second-order line can thus be obtained when is the single solution to Eq. (8), with varying from to , and obtained from Eq. (4). The SCP is retrieved as the special case when .
The susceptibility . There are several ways to define the susceptibility in spatially-varying fields. We rewrite the sharp-kink profile equation as
| (9) |
and interpret as the field. A derivative of the profile equation with respect to the field then gives
| (10) |
Importantly, diverges at a point if equals one of the bulk spinodal values.
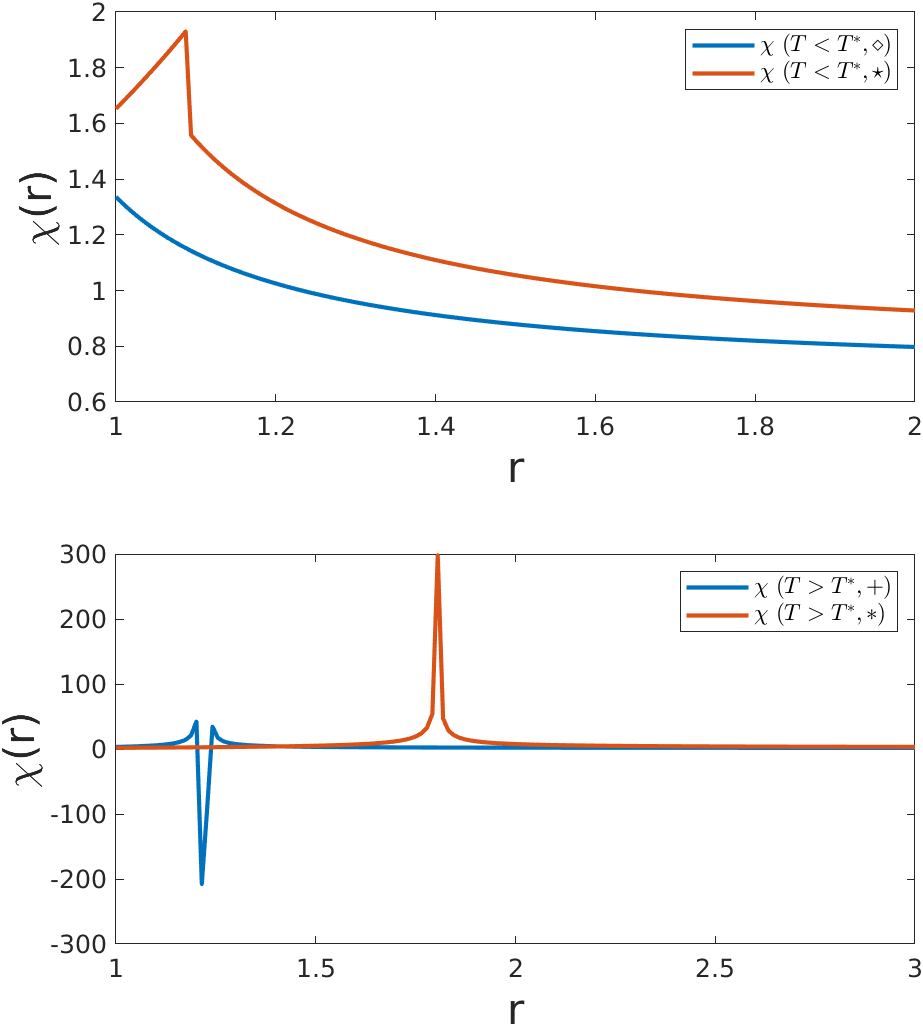
Figure 9 shows calculated by Eq. (10) for the profiles shown in Figs. 7 and 8. diverges for the profiles that cross one of the two spinodal values (points “”, “+”, and “”) and remains finite otherwise (point “”).
Note that the susceptibility can tend to at one side of a point and to at the other side. This happens when the curve crosses the bulk spinodal value. The negative susceptibility appears in a small region of space [of order of Eq. (1)] where the composition crosses between two phases stabilized by the field. It is indicative that the local value of is unstable as a bulk phase.
V Landau expansion of the free energy
To get explicit expressions for the quantities presented in the previous sections valid close enough to the bulk critical point, we use a standard (symmetric) Landau expansion of the free energy and external field,
| (11) |
with , and a positive constant independent of . Quantities are further expressed in terms of instead of . The bulk chemical potential is
Equations (4)-(6) can now be written for the surface [] as
| (12) | |||
| (13) | |||
| (14) |
The solutions to these equations give the qualitative phase diagram in Fig. 4 if and or Fig. 5 if and .
To find the SCP point, we use at the SCP, and at the SCP temperature, , , so this composition can be simply called . From Eq. (14) we find that
| (15) |
is independent of temperature. Hence the line is entirely to the left of the critical composition if and to the right otherwise. Substitution in Eq. (13) gives for ,
| (16) |
Interestingly, depends on the amplitude of the external forcing (expressed via and ) both linearly and quadratically. is above the critical point temperature if
and below otherwise.
The first-order line is obtained from Eq. (12) as the solution of the third-order polynomial in ,
with . The composition of the SCP point, , is a special case with , simplifying to
| (17) |
The lines and in the phase diagram are the solutions to the quadratic equation [Eq. (13)] with varying values of . The dashed curves in Fig. 8 are the solution to , namely,
| (18) |
The value of is defined such that the two solutions are the same, i.e., when the discriminant vanishes: . This yields a quadratic equation for :
| (19) |
(if then ). At , there is no solution with because , while at there is one. The value of the single solution is then
| (20) |
How to obtain the second-order transition line? This line is obtained by increasing from to as a parameter, with given from Eq. (19), from Eq. (20) (replace ), and both substituted in
to find .
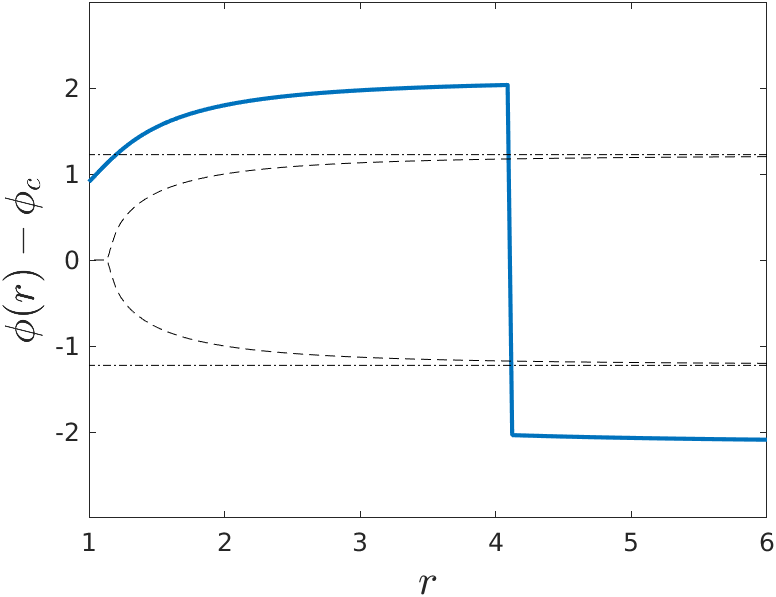
Non-monotonic profiles. The profiles usually look like the ones in Figs. 7 and 8: is a monotonically decreasing function, with . If is within the unstable area of the phase diagram, exhibits a sharp drop at the “liquid”-“gas” interface. If, however, and are sufficiently large, close to the surface ) the external field dominates over the bulk free energy and can increase with inside the liquid phase. To see this, assume that and are very large, then at the free energy is , and in this parabola, the linear and quadratic terms are negative and positive, respectively. The minimum value, , can have any positive value and, in particular, it can be smaller than the (upper) spinodal value. Figure 10 shows such a profile.
The free-energy picture as decreases is this: at , has a double minima, with the most stable one being the bulk “gas”, at . As decreases, the “liquid” minimum lowers until, at the interface, the two minima are in equal depth. As further decreases, the “liquid” minimum becomes the global minimum; it continuously shifts with . If then it shifts to the right. If is sufficiently large, it shifts to the left, while the curve loses the “gas” minimum and becomes the parabola mentioned above.
VI Examples
We list here several different systems to which the theory presented above applies.
Centrifugation. Consider a binary mixture with composition of two partially miscible liquids “1” and “2” placed in a rapidly rotating centrifuge. Denoting the angular velocity as and the distance from the rotation axis as , we write the effective energy as Tsori and Leibler (2007b); Zemb et al. (2021)
Here, , is the maximum distance from the rotation axis, , is a molecular volume, is the thermal energy, and is the composition-dependent mass density. Thus and . Usually, is approximated as a linear interpolation between the densities of the two liquids; in the language of the Landau expansion above, is the difference in the liquids’ densities, and . This means that the temperature of the SCP point is [Eq. (16)]. The SCP occurs at the maximal radius of the centrifuge.
Lipid monolayers. A monolayer consisting of a mixture of two dipolar lipids forms a homogeneous phase if the surface pressure is sufficiently small Lee et al. (1994); McConnell et al. (1984). When a wire passing perpendicular to the monolayer is charged, smooth density variations appear. However, if the wire’s charge (or potential) is large, a distinct dense, liquid-like, phase appears around the wire. This system’s energy is given by
where is the lipid density scaled by , , is the molecule’s electric dipole moment, is the wire’s charge density, is the dielectric constant, and is the ratio between the wire’s radius and the distance to the wire. We find that and is linear in , leading again to . The SCP occurs at the surface of the wire.
Wedge capacitor. The wedge capacitor is made up of two semi-infinite metallic planes that have an opening angle between them Tsori et al. (2004) and the potential difference between the plates is . A purely dielectric fluid of composition is placed between these planes. The electrostatic energy density is and the electric field satisfying Laplace’s equation is , hence and are given by
| (22) |
Here denotes the magnitude of the dielectrophoretic force. is the vacuum permittivity, is scaled by , the minimal value of .
In the vicinity of the critical point, one writes as a power series around the critical composition to the third order in ,
| (23) |
The mapping to the language of the Landau expansion Eq. (V) is
From Eq. (16) we find to be
| (24) |
As denoted above, depends on the amplitude of the external field, , both linearly and quadratically.
We can estimate by using the values of measured in the experiment by Debye and Kleboth Debye and Kleboth (1965). They found and . Since is typically much smaller than unity, the term in can be safely neglected and one finds that . If and K we find K.
Nucleation around a charged particle. Consider a charged spherical colloidal particle in an ambient gas environment. The particle could be a molecular cluster ionized by solar radiation or an aerosol particle lifted from the ground. When the particle has a fixed surface charge density , it is easy to solve the Laplace’s equation to find that , where is the fluid density scaled by its critical value, is the particle’s radius, and is the distance from its center. The liquid nucleation around the colloid is governed by the free energy
Here and .
If one truncates the series Eq. (23) at linear order, , then
and it is easy to make the following mapping
The value of is now [Eq. (16)],
| (26) |
For binary mixtures of two nonpolar solvents, and . Neglecting compared to , we find that and is smaller than .
Magnetic spins. Consider an incompressible monolayer of identical spins characterized by a local magnetization areal density with a nearest-neighbor coupling parameter . The spins orient only in the direction and the monolayer is constrained to lie in the – half-plane with . An infinitely long wire of radius carrying current passes through the axis. The magnetic field in the plane is , where is the vacuum permeability. The coupling term is then . The governing equation for the local magnetization is given by
| (27) |
The resulting magnetization is monotonic and smooth in for small currents , and exhibits a sharp coexistence between high and low magnetizations in sufficiently large currents. In this simple case, is independent on and thus , but other, nonlinear, forms for can be envisioned and in that case can also be non-monotonic.
Laser-tweezing phase separation. A Laser radiation passing through a mixture of two transparent dielectric liquids brings about a dielectrophoretic force proportional to the beams intensity . If heat adsorption is negligible and azimuthal (cylindrical) symmetry applies, the equilibrium composition profile is given by
| (28) |
is the index of refraction and is a constant Walton and Wynne (2018). when the beam is Gaussian, with being the characteristic width of the beam. Hence, if varies linearly with , but can be larger or smaller than depending on the sign and magnitude of and .
Flow-induced condensation. Imagine a fluid constrained to lie in an infinite plane. The fluid will flow towards the origin if the pressure at the orifice of radius at the origin is smaller than at infinity. In azimuthal symmetry and denoting by the distance from the origin scaled by , the fluid’s composition in steady-state obeys the equation,
| (29) |
Here, primes denote differentiation with respect to the radial coordinate , and is proportional to the rate of influx at . At large length-scales, and can be neglected and we find and . Thus and liquid-gas coexistence occurs below if the influx rate is large enough.
VII Conclusions
We study a generic mean-field model of systems in external fields. The field may have arbitrary dependence on the order parameter and on the spatial coordinate . This treatment generalizes numerous works on vastly different systems. The graphical construction shown in Figs. 1– 3 and 6 provides a simple interpretation of the governing equations Eqs. (4)-(6) and leads to the phase diagrams in Figs. 4 and 5. Monotonic fields have a point in space where they are maximal and this point is analogous to a surface in wetting phenomena. We find that the bulk critical point expands to a line of second-order phase transition that ends in a “surface critical point”. A line of first-order transition meets the second-order line at this point. This line resembles the prewetting line in wetting phenomena Hauge and Schick (1983) and the adsorption increases discontinuously on it (not shown) Cahn (1977); De Gennes (1985); Tarazona and Evans (1983, 1984); Gittes and Schick (1984).
The second-order line depends on while the first-order line is universal and independent of the form of . If some conditions apply to , non-monotonic profiles can form even when external forcing is monotonic. It would be interesting to investigate how the order-parameter evolves dynamically to produce the equilibrium profiles found here. We predict an interfacial instability as a result of competition between the long-range nature of the force and the local diffusive transport and surface-tension related stress.
The current model applies to isotropic phases but it can be extended to the coexistence of isotropic and ordered phases, for example, near the disordered-lamellar phase boundary in block-copolymers or similar systems. The modulated phases can be generally described by a negative gradient-squared term and a higher-order derivative term Seul and Andelman (1995); Tsori and Andelman (2001). Within the sharp-kink approximation, Eqs. (4–(6) would stay the same if the length associated with the modulation period is much smaller than the length-scale of the external force. For a strong enough force, the surface would induce order (e.g., lamellar) near it even when the bulk is disordered. The corresponding profile would have oscillations near the surface, decaying to a uniform value at the bulk. Although the model can be extended to modulated phases at least in some limits, there are issues related to the direction of the force with respect to the crystal axis of the ordered phase. It is not obvious that lamellae would form parallel to the lamellar-disorder phase boundary or how an external field couples to a body-faced cubic phase.
Acknowledgment
This work was supported by the Israel Science Foundation (ISF) grant No. 274/19.
References
- Landau and Lifshitz (1957) L. D. Landau and E. M. Lifshitz, Electrodynamics of Continuous Media (Nauka (Moscow), 1957).
- Kittel and Kroemer (1998) C. Kittel and H. Kroemer, Thermal physics (American Association of Physics Teachers, 1998).
- Moldover et al. (1979) M. R. Moldover, J. V. Sengers, R. W. Gammon, and R. J. Hocken, Rev. Mod. Phys. 51, 79 (1979).
- Larson (1999) R. G. Larson, The Structure and Rheology of Complex Fluids, Vol. 150 (Oxford University Press New York, 1999).
- Landau et al. (1986) L. D. Landau, E. M. Lifshitz, A. M. Kosevich, and L. P. Pitaevskii, Theory of Elasticity, Vol. 7 (Elsevier, 1986).
- Brini et al. (2013) E. Brini, E. A. Algaer, P. Ganguly, C. Li, F. Rodriguez-Ropero, and N. F. van der Vegt, Soft Matter 9, 2108 (2013).
- Müller-Plathe (2002) F. Müller-Plathe, ChemPhysChem 3, 754 (2002).
- Huang (2008) K. Huang, Statistical mechanics (John Wiley & Sons, 2008).
- Hohenberg and Barmatz (1972) P. Hohenberg and M. Barmatz, Phys. Rev. A 6, 289 (1972).
- Dickinson et al. (1975) E. Dickinson, C. M. Knobler, V. N. Schumaker, and R. L. Scott, Phys. Rev. Lett. 34, 180 (1975).
- Greer et al. (1975) S. C. Greer, T. E. Block, and C. M. Knobler, Phys. Rev. Lett. 34, 250 (1975).
- Leung and Miller (1975) H. Leung and B. N. Miller, Phys. Rev. A 12, 2162 (1975).
- Zimmerli et al. (1999a) G. A. Zimmerli, R. A. Wilkinson, R. A. Ferrell, and M. R. Moldover, Phys. Rev. Lett. 82, 5253 (1999a).
- Zimmerli et al. (1999b) G. A. Zimmerli, R. A. Wilkinson, R. A. Ferrell, and M. R. Moldover, Phys. Rev. E 59, 5862 (1999b).
- Tsori et al. (2004) Y. Tsori, F. Tournilhac, and L. Leibler, Nature (London) 430, 544 (2004).
- Tsori (2009) Y. Tsori, Rev. Mod. Phys. 81, 1471 (2009).
- Vink and Archer (2012) R. L. Vink and A. J. Archer, Phys. Rev. E 85, 031505 (2012).
- Samin and Tsori (2011) S. Samin and Y. Tsori, J. Phys. Chem. B 115, 75 (2011).
- Kroll and Tsori (2021) R. Kroll and Y. Tsori, J. Chem. Phys. 155, 174101 (2021).
- Tsori and Leibler (2007a) Y. Tsori and L. Leibler, Proc. Natl. Acad. Sci. U.S.A. 104, 7348 (2007a).
- Tsori (2021) Y. Tsori, Phys. Rev. E 104, 054801 (2021).
- Samin and Tsori (2016) S. Samin and Y. Tsori, Colloid Interface Sci. Commun. 12, 9 (2016).
- Sullivan et al. (2006) M. Sullivan, K. Zhao, A. Hollingsworth, R. H. Austin, W. Russel, and P. Chaikin, Phys. Rev. Lett. 96, 015703 (2006).
- Lee et al. (1994) K. Y. C. Lee, J. F. Klingler, and H. M. McConnell, Science 263, 655 (1994).
- McConnell et al. (1984) H. M. McConnell, L. K. Tamm, and R. M. Weis, Proc. Natl. Acad. Sci. U.S.A. 81, 3249 (1984).
- Delville et al. (1999) J. P. Delville, C. Lalaude, and A. Ducasse, Physica A 262, 40 (1999).
- Nishioka et al. (2000) H. Nishioka, K. Kida, O. Yano, and Q. Tran-Cong, Macromolecules 33, 4301 (2000).
- Tran-Cong-Miyata et al. (2004) Q. Tran-Cong-Miyata, S. Nishigami, T. Ito, S. Komatsu, and T. Norisuye, Nature Mater. 3, 448 (2004).
- Walton and Wynne (2018) F. Walton and K. Wynne, Nat. Chem. 10, 506 (2018).
- Baulin and Khokhlov (1999) V. A. Baulin and A. R. Khokhlov, Phys. Rev. E 60, 2973 (1999).
- Ben Dor et al. (2022) Y. Ben Dor, Y. Kafri, D. Mukamel, and A. M. Turner, Phys. Rev. Lett. 128, 154501 (2022).
- Rossen et al. (1986) W. R. Rossen, H. T. Davis, and L. E. Scriven, J. Colloid. Interface Sci. 113, 248 (1986).
- Bonn et al. (2009) D. Bonn, J. Eggers, J. Indekeu, J. Meunier, and E. Rolley, Rev. Mod. Phys. 81, 739 (2009).
- Nakanishi and Fisher (1982) H. Nakanishi and M. E. Fisher, Phys. Rev. Lett. 49, 1565 (1982).
- Leger and Joanny (1992) L. Leger and J.-F. Joanny, Rep. Prog. Phys. 55, 431 (1992).
- Andelman et al. (1988) D. Andelman, J.-F. Joanny, and M. Robbins, Europhys. Lett. 7, 731 (1988).
- Cahn (1977) J. W. Cahn, J. Chem. Phys. 66, 3667 (1977).
- Tsori and Leibler (2007b) Y. Tsori and L. Leibler, C. R. Phys. 8, 955 (2007b).
- Zemb et al. (2021) T. Zemb, R. Rosenberg, S. Marčelja, D. Haffke, J.-F. Dufrêche, W. Kunz, D. Horinek, and H. Cölfen, Phys. Chem. Chem. Phys. 23, 8261 (2021).
- Debye and Kleboth (1965) P. Debye and K. Kleboth, J. Chem. Phys. 42, 3155 (1965).
- Hauge and Schick (1983) E. H. Hauge and M. Schick, Phys. Rev. B 27, 4288 (1983).
- De Gennes (1985) P.-G. De Gennes, Rev. Mod. Phys. 57, 827 (1985).
- Tarazona and Evans (1983) P. Tarazona and R. Evans, Mol. Phys. 48, 799 (1983).
- Tarazona and Evans (1984) P. Tarazona and R. Evans, Mol. Phys. 52, 847 (1984).
- Gittes and Schick (1984) F. T. Gittes and M. Schick, Phys. Rev. B 30, 209 (1984).
- Seul and Andelman (1995) M. Seul and D. Andelman, Science 267, 476 (1995).
- Tsori and Andelman (2001) Y. Tsori and D. Andelman, EPL (Europhys. Lett.) 53, 722 (2001).