ALMA/ACA CO Survey of the IC 1459 and NGC 4636 Groups: Environmental Effects on the Molecular Gas of Group Galaxies
Abstract
We present new results of a 12CO(=1–0) imaging survey using the Atacama Compact Array (ACA) for 31 Hi detected galaxies in the IC 1459 and NGC 4636 groups. This is the first CO imaging survey for loose galaxy groups. We obtained well-resolved CO data (0.7 1.5 kpc) for a total of 16 galaxies in two environments. By comparing our ACA CO data with the Hi and UV data, we probe the impacts of the group environment on the cold gas components (CO and Hi gas) and star formation activity. We find that CO and/or Hi morphologies are disturbed in our group members, some of which show highly asymmetric CO distributions (e.g., IC 5264, NGC 7421, and NGC 7418). In comparison with isolated galaxies in the xCOLD GASS sample, our group galaxies tend to have low star formation rates and low H2 gas fractions. Our findings suggest that the group environment can change the distribution of cold gas components, including the molecular gas, and star formation properties of galaxies. This is supporting evidence that preprocessing in the group-like environment can play an important role in galaxy evolution.
1 Introduction
Galaxy properties (e.g., morphology, star formation rate (SFR), and color) change with environment including the field, groups, and clusters. As the surrounding density increases, the fraction of early-type galaxies increases (i.e., the density-morphology relation; Dressler 1980; Goto et al. 2003; Houghton 2015). In particular, in the cluster environment, the galaxy population is dominated by red sequence galaxies with lower SFRs (Lewis et al., 2002; Gómez et al., 2003; Hogg et al., 2004; Kauffmann et al., 2004). Furthermore, this trend is also observed at the outskirts of galaxy clusters (Cybulski et al., 2014; Jaffé et al., 2016; Morokuma-Matsui et al., 2021).
In fact, in a hierarchical Universe, a significant fraction of cluster populations is accreted through the groups (McGee et al., 2009; De Lucia et al., 2012). This result implies that many galaxies are likely to be already affected by the environmental effects in groups (e.g., tidal interaction and ram pressure stripping (RPS); for a review see Cortese et al. 2021), making them become red, passive, and gas deficient before they fall into a cluster. This process (known as “preprocessing”) can account for a significant fraction of the quenched galaxies at the outskirts of the cluster or beyond the virial radius of the cluster (Haines et al., 2015; Dénes et al., 2016; Jaffé et al., 2016; Roberts & Parker, 2017; Jung et al., 2018; Vulcani et al., 2018; Džudžar et al., 2019; Seth & Raychaudhury, 2020; Cortese et al., 2021; Kleiner et al., 2021; Morokuma-Matsui et al., 2021; Castignani et al., 2022). Therefore, studying “preprocessing” (e.g., how significantly galaxies can be processed in the group environment before they enter a cluster) is important to understand galaxy evolution in the groups as well as the clusters.
In addition, at least half of all galaxies belong to galaxy groups in the local universe (Eke et al., 2004; Robotham et al., 2011), indicating that the group environment is the common place where local galaxies evolve.
Although there are various external processes that can play a role in changing physical properties of galaxies, tidal interactions and merging events are more frequent, especially in the group environment, due to low-velocity dispersion of the group, which are thought to be the main mechanisms affecting group galaxies (Zabludoff & Mulchaey, 1998; Bitsakis et al., 2014; Alatalo et al., 2015; Iodice et al., 2020; Kleiner et al., 2021; Wang et al., 2022). Some groups are detected in X-ray, indicating the presence of a hot intragroup medium (IGrM) (e.g., Osmond & Ponman, 2004). However, the strength of ram pressure in groups is expected to be not as strong as the strength of ram pressure in clusters because the velocity of group galaxies relative to the IGrM is not as high and the density of IGrM is relatively low. Nevertheless, evidence of ram pressure stripping has been reported in galaxy groups (Kantharia et al., 2005; Rasmussen et al., 2006; Westmeier et al., 2011; Wolter et al., 2015; Brown et al., 2017; Roberts et al., 2021).
The cold interstellar medium (ISM), mainly composed of atomic hydrogen (Hi) and molecular hydrogen (H2), is one of the important baryonic components of a galaxy, as the fuel for star formation. Generally, the Hi gas disk of the star-forming field galaxies extends beyond the optical disk (e.g., Walter et al., 2008). The large extent of the Hi disk and the low density of Hi gas make it more susceptible to environmental processes, such as tidal interactions (Yun et al., 1994; Saponara et al., 2018) and ram pressure stripping (Chung et al., 2009; Wang et al., 2020, 2021). In the group environment, galaxies are often reported with Hi deficiency, asymmetric Hi distribution, and a shrinking of Hi disk (Dénes et al., 2016; Brown et al., 2017; For et al., 2019; Lee-Waddell et al., 2019; For et al., 2021; Kleiner et al., 2021; Roychowdhury et al., 2022; Wang et al., 2022).
In particular, the H2 gas, which is mainly traced by carbon monoxide (CO), is known as the direct ingredient for star formation. Therefore, it is essential to understand how the group environmental processes affect the molecular gas of galaxies because a change of molecular gas properties by the environmental effects likely links to star formation activity and hence galaxy evolution. However, since the distribution of molecular gas is more compact within the stellar disk and its density is higher, it still remains unclear whether the molecular gas is also strongly affected by the group environmental processes. For cluster galaxies, recent studies on molecular gas have found evidence of the environmental effects on molecular gas of cluster galaxies (Boselli et al., 2014b; Lee et al., 2017; Lee & Chung, 2018; Jáchym et al., 2019; Zabel et al., 2019; Moretti et al., 2020a, b; Cramer et al., 2020). However, there are not many studies of the molecular gas in group galaxies (e.g., Alatalo et al., 2015), and therefore we still lack a good understanding of the group environmental effects on the molecular gas.
In order to obtain a better understanding of the group environmental effects on the molecular gas and the star formation activity, we carried out a 12CO(=1–0) imaging survey of 31 galaxies in two loose groups (IC 1459 group and NGC 4636 group) using the Atacama Large Millimeter/submillimeter Array (ALMA)/the Atacama Compact Array (ACA) in Cycle 7. This is the first CO imaging survey for the loose groups. In particular, a loose group is an intermediate structure between compact groups and clusters. Loose groups host tens of galaxies over an area of 1 Mpc2, with a median velocity dispersion of 165 km s-1 and a median virial mass of 1.9 10 (Tucker et al., 2000; Pisano, 2004). These are particular interesting objects in a study of structure formation in the hierarchical Universe.
However, previous CO imaging studies on group galaxies mainly focused on compact groups, showing violent interactions among group members (e.g., Alatalo et al., 2015). Thus, the well-resolved CO imaging data of our survey can provide a unique opportunity to study the detailed molecular gas properties (e.g., CO distribution and velocity field) of group galaxies and is expected to show direct evidence for the group environmental effects on the molecular gas.
Recent high-resolution Hi imaging observations for the IC 1459 group and the NGC 4636 group (hereafter I1459G and N4636G, respectively) show that there are explicit signs (stripped Hi gas and asymmetric Hi morphology) of external perturbations (Serra et al., 2015a; Oosterloo et al., 2018; Saponara et al., 2018; Koribalski et al., 2020). In addition, thanks to the proximity of these two groups (I1459G: 27.2 Mpc and N4636G: 13.6 Mpc) and the high spatial resolution of our ACA observations, individual group galaxies can be resolved on a kpc scale (I1459G: 1.5 kpc and N4636G: 0.7 kpc). Therefore, both the I1459G and N4636G are good laboratories to investigate the group environmental effects on molecular gas in detail. In particular, since the N4636G is falling into the Virgo cluster (Tully & Shaya, 1984; Nolthenius, 1993), this makes the N4636G the best target to study the preprocessing in the group environment.
In this work, we present the results of our ACA CO survey of the two groups. In particular, we compare the CO images with existing Hi images for our group sample to investigate how these two phases of the cold ISM react to the group environmental processes, since the Hi gas and CO gas have different characteristics (e.g., the disk size and the density). The combination of CO and Hi images is possibly powerful for distinguishing between different stripping or quenching mechanisms.
In Section 2, we describe the two galaxy groups and the sample selection along with the general properties of the target galaxies. Details of the ACA observations, data reduction, and ancillary data are described in Section 3. We present CO properties and CO images of our sample in Section 4. In Section 5, we investigate differences in global properties between the group sample and the extended CO Legacy Database for GASS111The Parkes Galactic All Sky Survey (xCOLD GASS; Saintonge et al. 2017) sample, and we discuss the impacts of the group environment on member galaxies. In Section 6, we summarize our results and conclusions. Throughout this paper, we adopt distances of 27.2 Mpc and 13.6 Mpc to two groups, I1459G and N4636G, respectively (Brough et al., 2006).
2 Group sample
The Group Evolution Multiwavelength Study (GEMS) is a panchromatic survey of 60 nearby galaxy groups (the recession velocity of 1000 km s-1 3000 km s-1), which has been initiated to study environmental effects on galaxy evolution in the group environment (Osmond & Ponman, 2004; Forbes et al., 2006). The survey covers a broad range of wavelengths from radio (Kilborn et al., 2005, 2009), infrared (Brough et al., 2006), optical (Miles et al., 2004), and X-ray (Osmond & Ponman, 2004) to investigate how strongly and frequently group members are influenced by various processes. Among 60 groups in the GEMS, in particular, both I1459G and N4636G were observed in the Hi emission, with the high spatial resolution of the Australian Square Kilometer Array Pathfinder (ASKAP, Serra et al. 2015b; Koribalski et al. 2020). The presence of high-resolution Hi images takes great advantage of verifying immediately the environmental effects on the cold gas disk (e.g., asymmetric Hi distribution; Serra et al. 2015b; For et al. 2019; Lee-Waddell et al. 2019). For these reasons, we selected these two groups to probe the group environmental effects on the cold gas and star formation activity of group galaxies.
Both I1459G and N4636G have many properties in common such as the detection of X-ray emission, the presence of a relatively large elliptical galaxy at the group center (i.e., bright group-centered galaxy; BGG) (Osmond & Ponman, 2004; Brough et al., 2006). However, their locations in the large scale structure are rather distinct. The I1459G is a relatively isolated group, while the N4636G falls into the Virgo cluster (Tully & Shaya, 1984; Nolthenius, 1993). Therefore, the N4636G is an ideal laboratory to study “preprocessing” of group galaxies.
We describe the details of the properties of two groups as well as the sample selection for our ACA CO observations in the following sections.

2.1 IC 1459 Group
The I1459G is a loose galaxy group that includes 10 members identified by a friends-of-friends (FOF) algorithm (Brough et al., 2006). Additional faint galaxies (e.g., dwarf and ultra-diffuse galaxies) are likely to be associated with the I1459G, based on previous Hi observations and recent deep optical imaging (e.g., Kilborn et al., 2009; Serra et al., 2015a; Forbes et al., 2020).
The BGG of the I1459G, with a stellar mass of 3 1011 , which we estimated using the the Wide-field Infrared Survey Explorer (WISE) data (see Section 3.3), shows many peculiar features, such as a counter-rotating stellar core (Franx & Illingworth, 1988; Prichard et al., 2019), an irregular dust distribution (Forbes et al., 1994), and the tidal tails and shells in the outskirts of the galaxy (Forbes et al., 1995; Iodice et al., 2020). All these features indicate that the BGG in the I1459G has experienced tidal interactions and/or merging events. X-ray observations also revealed that there is a hot IGrM at the center of the I1459G (Osmond & Ponman, 2004).
Many previous Hi imaging observations of the I1459G (e.g., Kilborn et al., 2009; Serra et al., 2015a; Saponara et al., 2018; Oosterloo et al., 2018) also suggest that galaxies in the I1459G are undergoing violent interactions (e.g., tidal interactions between galaxies). With the Australia Telescope Compact Array (ATCA), Saponara et al. (2018) reported a substantial amount of Hi in clouds (7.2 ) and in extended distributions near IC 1459 (BGG), IC 5264, and NGC 7418A, covering nearly half of the group region. In addition, Oosterloo et al. (2018) found a long Hi tail across the I1459G with the Karoo Array Telescope (KAT-7). Recent Hi imaging data obtained from the ASKAP reveal that many of group galaxies show asymmetric and disturbed Hi morphologies (Serra et al., 2015a).
Under the assumption that the I1459G is in dynamical equilibrium (e.g., Balogh et al., 2007) and adopting the group velocity dispersion (: 223 km s-1) taken from Osmond & Ponman (2004), we calculated the group virial radius (: 0.55 Mpc) and the total group mass of (1.9 1013 ), where is the radius at which the system’s mean mass density is 200 times higher than the critical density of the Universe, and is the total mass enclosed within .
2.2 NGC 4636 Group
The N4636G is located towards the southeast region of the Virgo cluster and is falling into the cluster. In the group, there is an early-type BGG (NGC 4636) with a stellar mass of 31010 (O’Sullivan et al., 2018).
The N4636G shows luminous and extended X-ray emission, indicating the existence of a hot IGrM (e.g., Osmond & Ponman, 2004; Baldi et al., 2009; Ahoranta et al., 2016). This X-ray emission is extended out to 0.3 Mpc from the group center (Matsushita et al., 1998), suggesting that some group galaxies near the group center are possibly affected by ram pressure stripping. Interestingly, recent X-ray studies of NGC 4636 show that the morphology of X-ray emission near the BGG is complex, showing arm-like structures and bubbles related to previous active galactic nucleus (AGN) activity (e.g., Baldi et al., 2009). The direction of the radio jets also coincides with the X-ray cavities (Giacintucci et al., 2011).
The N4636G hosts at least 17 members identified by Brough et al. (2006). However, 100 systems, including low-mass dwarfs and massive spiral galaxies, could be associated with the N4636G, in a recent study (Lin et al., 2023). Previous Hi observations of the N4636G found that there are many Hi-deficient galaxies, which implies that group members in the N4636G are affected by the environmental effects (Kilborn et al., 2009).
Under the assumption that the N4636G is in dynamical equilibrium and adopting the group velocity dispersion (: 284 km s-1) taken from Osmond & Ponman (2004), we calculated the total group mass of (3.9 1013 ) and the group virial radius (: 0.70 Mpc).
2.3 Sample Selection
The target galaxies of our ACA CO survey were selected from the GEMS-Hi survey that observed Hi gas of galaxies within a square region of 30 deg2 surrounding the center of each group for a sample of 16 selected GEMS groups, with the Parkes radio telescope (Kilborn et al., 2009). From this Hi survey, we selected a sample of 31 systems with Hi detections, which are located within 1.5 and 3 (group velocity dispersion), in these two groups (11 galaxies in the I1459G and 20 galaxies in the N4636G). Since the primary selection criterion is the presence of Hi, which implies that the sample galaxies may have a cold ISM with potentially molecular gas, our targets show a variety of morphological types from dwarfs to spirals (Table 1), with a wide range of stellar masses (1.6 106 4.9 1010 ; Table 1) and Hi gas masses (3.1 107 7.5 108 ; Table 1, Kilborn et al. 2009).
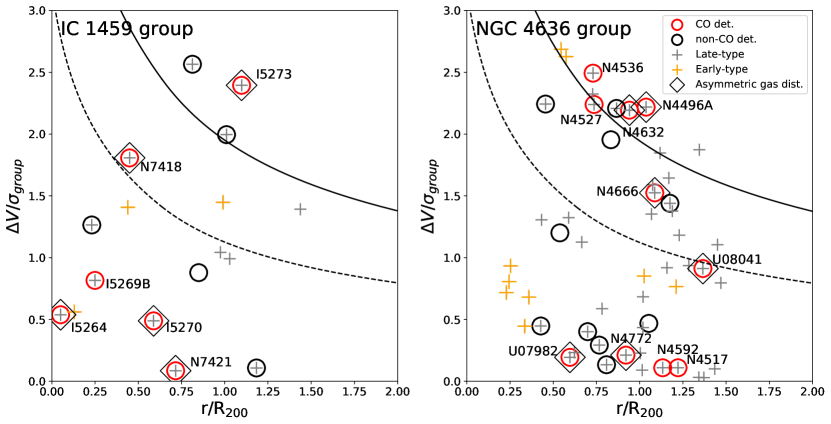
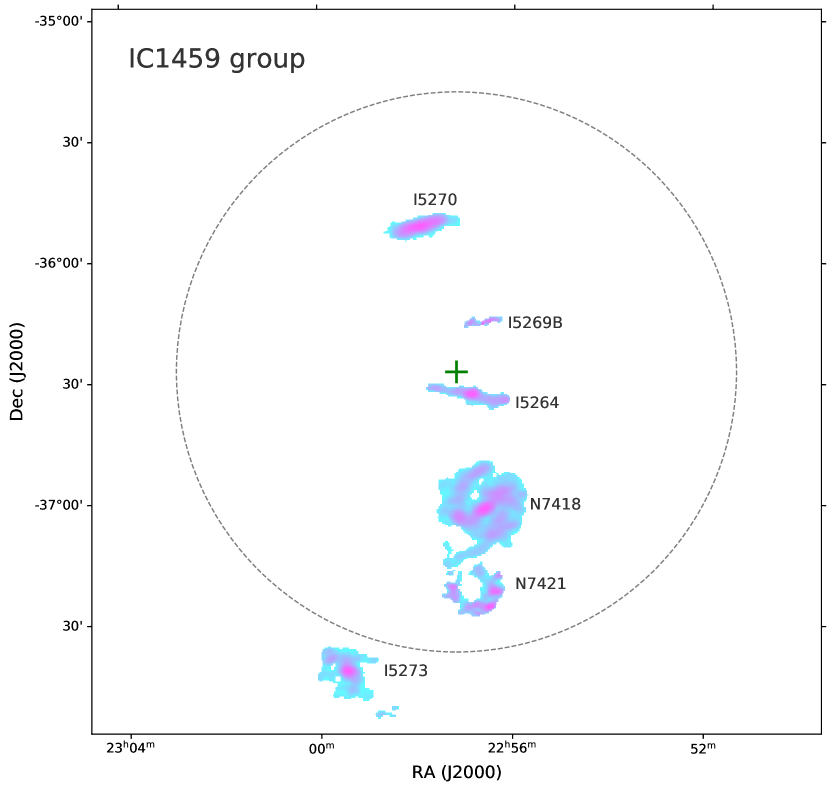
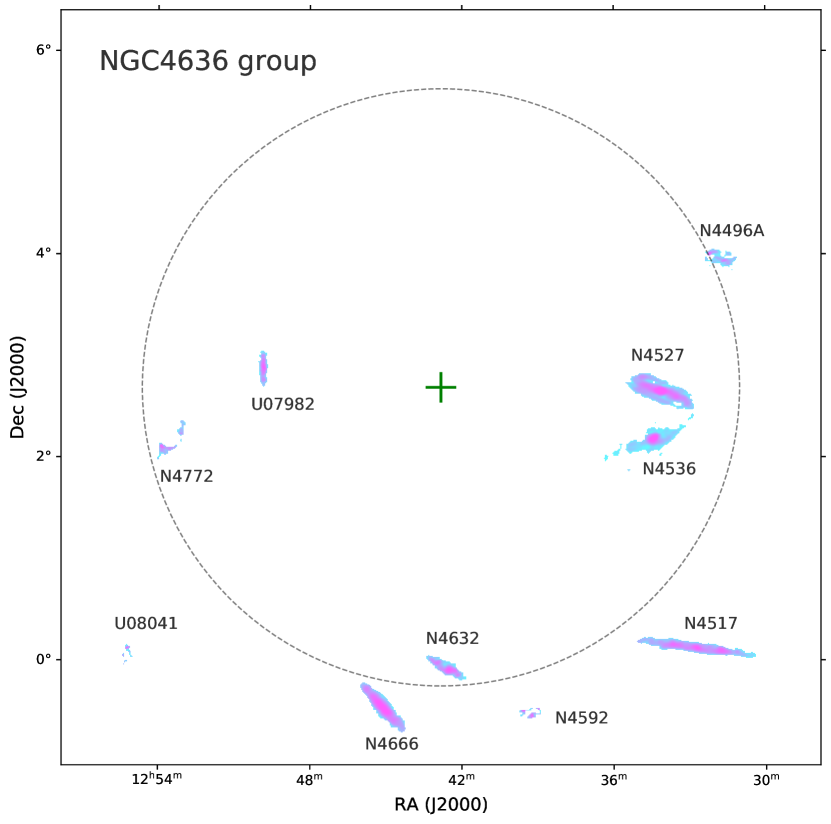
Figure 1 shows the locations of our sample in the I1459G and the N4636G (red circles: detection of CO, black circles: nondetection of CO). Their BGGs are shown as green large crosses. Small crosses (gray: late-type, yellow: early-type) also indicate galaxies taken from the Hyperleda database, which are also within 1.5 and 3 and brighter than the absolute magnitude of -15.5 (the faintest galaxy among small crosses in the I1459G) in the -band. Our target galaxies of the I1459G are located around the BGG as well as in the outskirts of the group. On the other hand, many of our sample galaxies in the N4636G are located around its .
Figure 2 also displays the distributions of the sample galaxies on the projected phase-space diagram (PSD), which allows us to probe a projected distance from the group center (, normalized by ) and a line of sight velocity with respect to the systemic velocity of the group (, normalized by the group velocity dispersion), simultaneously. Some of our group targets, with high above the curve of the maximum escape velocity, may just pass through a group, but they can still be affected by all group environmental effects during this one fly-by trip.
The general properties (e.g., coordinates, stellar masses, Hi gas masses, star formation rates) of our sample are summarized in Table 1.
| Name | R.A. | Decl. | Type | Inc | PA | v (opt) | log | SFR | |
|---|---|---|---|---|---|---|---|---|---|
| (J2000) | (J2000) | (deg) | (deg) | (km s-1) | (108) | () | ( yr-1) | ||
| (1) | (2) | (3) | (4) | (5) | (6) | (7) | (8) | (9) | (10) |
| IC 1459 group | |||||||||
| ESO 406-G040 | 23h00m21s.99 | -37d12m04s.0 | IB | 44.3 | 1.5 | 1248 | 6.31.0 | 8.87 | 0.0440.020 |
| ESO 406-G042 | 23h02m14s.24 | -37d05m01s.2 | SABm | 80.1 | 66.4 | 1375 | 19.21.6 | 9.42 | 0.1690.025 |
| DUKST 406-083 | 23h02m00s.50 | -36d29m04s.5 | 66.1 | 97.0 | 1624 | 2.81.0 | 7.50 | 0.0210.003 | |
| IC 5264 | 22h56m53s.02 | -36d33m15s.3 | Sab | 90.0 | 80.1 | 1940 | 9.71.2 | 10.15 | 0.1440.004 |
| IC 5269B | 22h56m36s.72 | -36d14m59s.5 | SBc | 82.6 | 96.7 | 1638 | 30.02.0 | 9.89 | 0.1780.026 |
| IC 5269C | 23h00m48s.17 | -35d22m13s.5 | Scd | 74.9 | 62.8 | 1796 | 14.71.6 | 9.46 | 0.1210.022 |
| IC 5270 | 22h57m54s.88 | -35d51m29s.0 | SBc | 58.2 | 105.1 | 1929 | 66.63.7 | 9.94 | 0.7400.102 |
| IC 5273 | 22h59m26s.72 | -37d42m10s.5 | SBc | 50.8 | 48.5 | 1286 | 38.12.2 | 10.34 | 1.7580.529 |
| NGC 7418 | 22h56m36s.15 | -37d01m48s.2 | Sc | 40.0 | 137.7 | 1417 | 48.82.6 | 10.57 | 2.0490.759 |
| NGC 7418A | 22h56m41s.23 | -36d46m21s.9 | Scd | 61.2 | 81.4 | 2102 | 40.12.3 | 9.30 | 0.4560.033 |
| NGC 7421 | 22h56m54s.32 | -37d20m50s.7 | Sbc | 36.2 | 80.6 | 1801 | 7.51.2 | 10.32 | 0.2740.041 |
| NGC 4636 group | |||||||||
| EVCC 0854 | 12h32m58s.04 | +04d34m42s.5 | Sm | 60.8 | 1233 | 0.90.2 | 6.20 | 0.0020.001 | |
| EVCC 0962 | 12h37m29s.07 | +04d45m04s.3 | I | 62.4 | 12.4 | 1655 | 0.30.2 | 7.65 | 0.0050.001 |
| IC 3474 | 12h32m36s.51 | +02d39m40s.9 | Scd | 87.1 | 42.5 | 1727 | 5.30.3 | 8.75 | |
| NGC 4496A | 12h31m39s.26 | +03d56m22s.8 | Scd | 38.5 | 67.5 | 1730 | 19.00.9 | 9.58 | 0.3450.018 |
| NGC 4517 | 12h32m45s.48 | +00d06m52s.5 | Sc | 90.0 | 84.4 | 1131 | 38.11.4 | 10.27 | 0.6330.079 |
| NGC 4517A | 12h32m27s.97 | +00d23m25s.7 | Sd | 75.2 | 30.1 | 1509 | 14.90.7 | 9.33 | 0.1040.015 |
| NGC 4527 | 12h34m08s.47 | +02d39m13s.9 | SABb | 81.2 | 69.5 | 1736 | 41.91.4 | 10.30 | 1.8950.943 |
| NGC 4536 | 12h34m27s.09 | +02d11m16s.8 | SABb | 73.1 | 120.7 | 1808 | 31.91.1 | 10.13 | 2.1710.959 |
| NGC 4592 | 12h39m18s.74 | -00d31m54s.6 | Sd | 90.0 | 94.2 | 1069 | 75.03.3 | 9.38 | 0.3050.016 |
| NGC 4632 | 12h42m32s.34 | -00d04m54s.2 | Sc | 70.5 | 58.9 | 1723 | 20.20.8 | 9.42 | 0.2580.028 |
| NGC 4666 | 12h45m08s.64 | -00d27m42s.5 | SABc | 69.6 | 40.6 | 1533 | 36.91.4 | 10.18 | 2.1931.025 |
| NGC 4688 | 12h47m46s.61 | +04d20m12s.8 | Sc | 23.7 | 986 | 12.61.0 | 8.69 | 0.1820.028 | |
| NGC 4772 | 12h53m29s.17 | +02d10m06s.3 | SABa | 67.3 | 155.1 | 1040 | 1.50.2 | 10.28 | 0.0290.006 |
| UGC 07715 | 12h33m55s.68 | +03d32m45s.6 | I | 20.9 | 1138 | 0.70.1 | 8.65 | 0.0120.002 | |
| UGC 07780 | 12h36m42s.09 | +03d06m30s.7 | Sm | 90.0 | 48.2 | 1441 | 2.90.2 | 7.97 | 0.0080.007 |
| UGC 07824 | 12h39m50s.42 | +01d40m20s.7 | SBm | 73.0 | 80.9 | 1227 | 2.10.2 | 8.70 | 0.0090.003 |
| UGC 07841 | 12h41m11s.59 | +01d24m37s.1 | Sb | 62.3 | 144.4 | 1737 | 3.80.3 | 8.92 | |
| UGC 07911 | 12h44m28s.78 | +00d28m05s.4 | Sm | 66.8 | 15.0 | 1183 | 5.50.3 | 9.58 | 0.0770.012 |
| UGC 07982 | 12h49m50s.25 | +02d51m06s.9 | Sb | 87.1 | 0.8 | 1155 | 3.30.2 | 9.39 | 0.0090.001 |
| UGC 08041 | 12h55m12s.64 | +00d06m60s.0 | SBcd | 54.0 | 168.3 | 1359 | 9.20.7 | 9.53 | 0.0940.014 |
Note. — (1) Galaxy name; (2) R.A. (J2000); (3) decl. (J2000); (4) morphological type; (5) inclination angle; (6) position angle; Columns (2) - (6) from HyperLeda (http://leda.univ-lyon1.fr/; Makarov et al. 2014) (7) optical velocity (Kilborn et al., 2009); (8) Hi gas mass, Hi gas masses from Parkes observations (Kilborn et al., 2009); (9) stellar mass, stellar masses estimated from the WISE data; (10) star formation rate (SFR), star formation rates derived using the GALEX FUV/NUV data and the WISE 22 m data.
| Name | , | Hi Imaging Data | ||
|---|---|---|---|---|
| (, deg) | (mJy beam-1) | |||
| (1) | (2) | (3) | (4) | (5) |
| IC 1459 Group | ||||
| ESO 406-G040 | 14.28.9, 102.8 | 14.6 | 1 | ASKAP BETA |
| ESO 406-G042 | 14.18.9, 102.3 | 13.9 | 1 | ASKAP BETA |
| DUKST 406-083 | 14.28.9, 103.5 | 13.9 | 1 | |
| IC 5264 | 14.28.9, 103.2 | 13.1 | 1 | ASKAP BETA |
| IC 5269B | 14.28.9, 101.8 | 10.7 | 3 | ASKAP BETA |
| IC 5269C | 14.28.8, 103.0 | 13.9 | 1 | ASKAP BETA |
| IC 5270 | 14.28.9, 102.3 | 10.1 | 3 | ASKAP BETA |
| IC 5273 | 14.19.0, 100.2 | 11.5 | 2 | ASKAP BETA |
| NGC 7418 | 14.19.0, 101.3 | 9.2 | 5 | ASKAP BETA |
| NGC 7418A | 14.28.9, 103.5 | 13.1 | 1 | ASKAP BETA |
| NGC 7421 | 14.28.9, 103.2 | 13.8 | 1 | ASKAP BETA |
| NGC 4636 Group | ||||
| EVCC 0854 | 14.110.1, 97.0 | 13.9 | 1 | WALLABY pilot |
| EVCC 0962 | 14.29.9, 101.4 | 13.3 | 1 | WALLABY pilot |
| IC 3474 | 14.29.8, 102.0 | 13.7 | 1 | WALLABY pilot |
| NGC 4496A | 14.19.9, 101.8 | 8.8 | 6 | WALLABY pilot |
| NGC 4517 | 14.19.7, 94.9 | 11.4 | 8 | WALLABY pilot |
| NGC 4517A | 14.19.7, 97.0 | 14.3 | 1 | WALLABY pilot |
| NGC 4527 | 14.19.9, 96.8 | 11.7 | 5 | WALLABY pilot |
| NGC 4536 | 14.19.8, 99.8 | 8.7 | 13 | VIVA |
| NGC 4592 | 14.09.5, 100.5 | 11.4 | 3 | WALLABY pilot |
| NGC 4632 | 14.09.7, 95.6 | 10.9 | 3 | WALLABY pilot |
| NGC 4666 | 13.99.6, 99.4 | 11.1 | 3 | WALLABY pilot |
| NGC 4688 | 14.110.0, 91.1 | 10.1 | 5 | WALLABY pilot |
| NGC 4772 | 14.19.8, 92.7 | 12.1 | 3 | VIVA |
| UGC 07715 | 14.110.0, 96.1 | 13.9 | 1 | WALLABY pilot |
| UGC 07780 | 14.110.0, 96.0 | 14.7 | 1 | WALLABY pilot |
| UGC 07824 | 14.19.9, 94.8 | 14.5 | 1 | |
| UGC 07841 | 14.09.8, 95.7 | 14.2 | 1 | WALLABY pilot |
| UGC 07911 | 14.19.8, 93.4 | 14.5 | 1 | WALLABY pilot |
| UGC 07982 | 14.09.9, 92.6 | 11.7 | 3 | WALLABY pilot |
| UGC 08041 | 13.99.6, 98.3 | 11.2 | 3 | |
| Name | CO Peak Flux | CO Flux | log | log | log | |||
|---|---|---|---|---|---|---|---|---|
| (km s-1) | (km s-1) | (km s-1) | (Jy km s-1 beam-1) | (Jy km s-1) | (K km s-1 pc2) | () | () | |
| (1) | (2) | (3) | (4) | (5) | (6) | (7) | (8) | (9) |
| IC 1459 Group | ||||||||
| ESO 406-G040 | 42 | 1.3 | 6.36 | 7.00 | 7.19 | |||
| ESO 406-G042 | 121 | 2.1 | 6.57 | 7.21 | 7.24 | |||
| DUKST 406-083 | 83 | 1.7 | 6.49 | 7.12 | 8.42 | |||
| IC 5264 | 94 | 356 | 331 | 17.6 | 54.63.6 | 7.960.03 | 8.600.03 | 8.540.03 |
| IC 5269B | 228 | 156 | 149 | 1.8 | 4.30.7 | 6.890.74 | 7.530.07 | 7.490.07 |
| IC 5269C | 172 | 2.45 | 6.64 | 7.28 | 7.31 | |||
| IC 5270 | 101 | 230 | 198 | 26.1 | 100.45.5 | 8.260.02 | 8.900.02 | 8.850.02 |
| IC 5273 | 196 | 152 | 110 | 13.5 | 60.33.7 | 8.040.03 | 8.670.03 | 8.600.03 |
| NGC 7418 | 207 | 206 | 175 | 34.6 | 302.215.4 | 8.740.02 | 9.370.02 | 9.290.02 |
| NGC 7418A | 180 | 2.4 | 6.63 | 7.27 | 7.32 | |||
| NGC 7421 | 129 | 151 | 70 | 4.3 | 37.62.7 | 7.830.03 | 8.470.03 | 8.400.03 |
| NGC 4636 Group | ||||||||
| EVCC 0854 | 62 | 1.5 | 5.82 | 6.45 | 7.75 | |||
| EVCC 0962 | 27 | 0.9 | 5.62 | 6.26 | 7.55 | |||
| IC 3474 | 147 | 2.2 | 6.00 | 6.64 | 6.88 | |||
| NGC 4496A | 154 | 127 | 102 | 4.6 | 36.32.4 | 7.210.03 | 7.850.03 | 7.860.03 |
| NGC 4517 | 301 | 298 | 275 | 28.6 | 449.422.9 | 8.310.02 | 8.950.02 | 8.880.02 |
| NGC 4517A | 154 | 2.4 | 6.03 | 6.66 | 6.72 | |||
| NGC 4527 | 356 | 411 | 370 | 372.6 | 1638.082.1 | 8.870.02 | 9.510.02 | 9.440.02 |
| NGC 4536 | 324 | 354 | 325 | 214.5 | 608.930.6 | 8.440.02 | 9.080.02 | 9.020.02 |
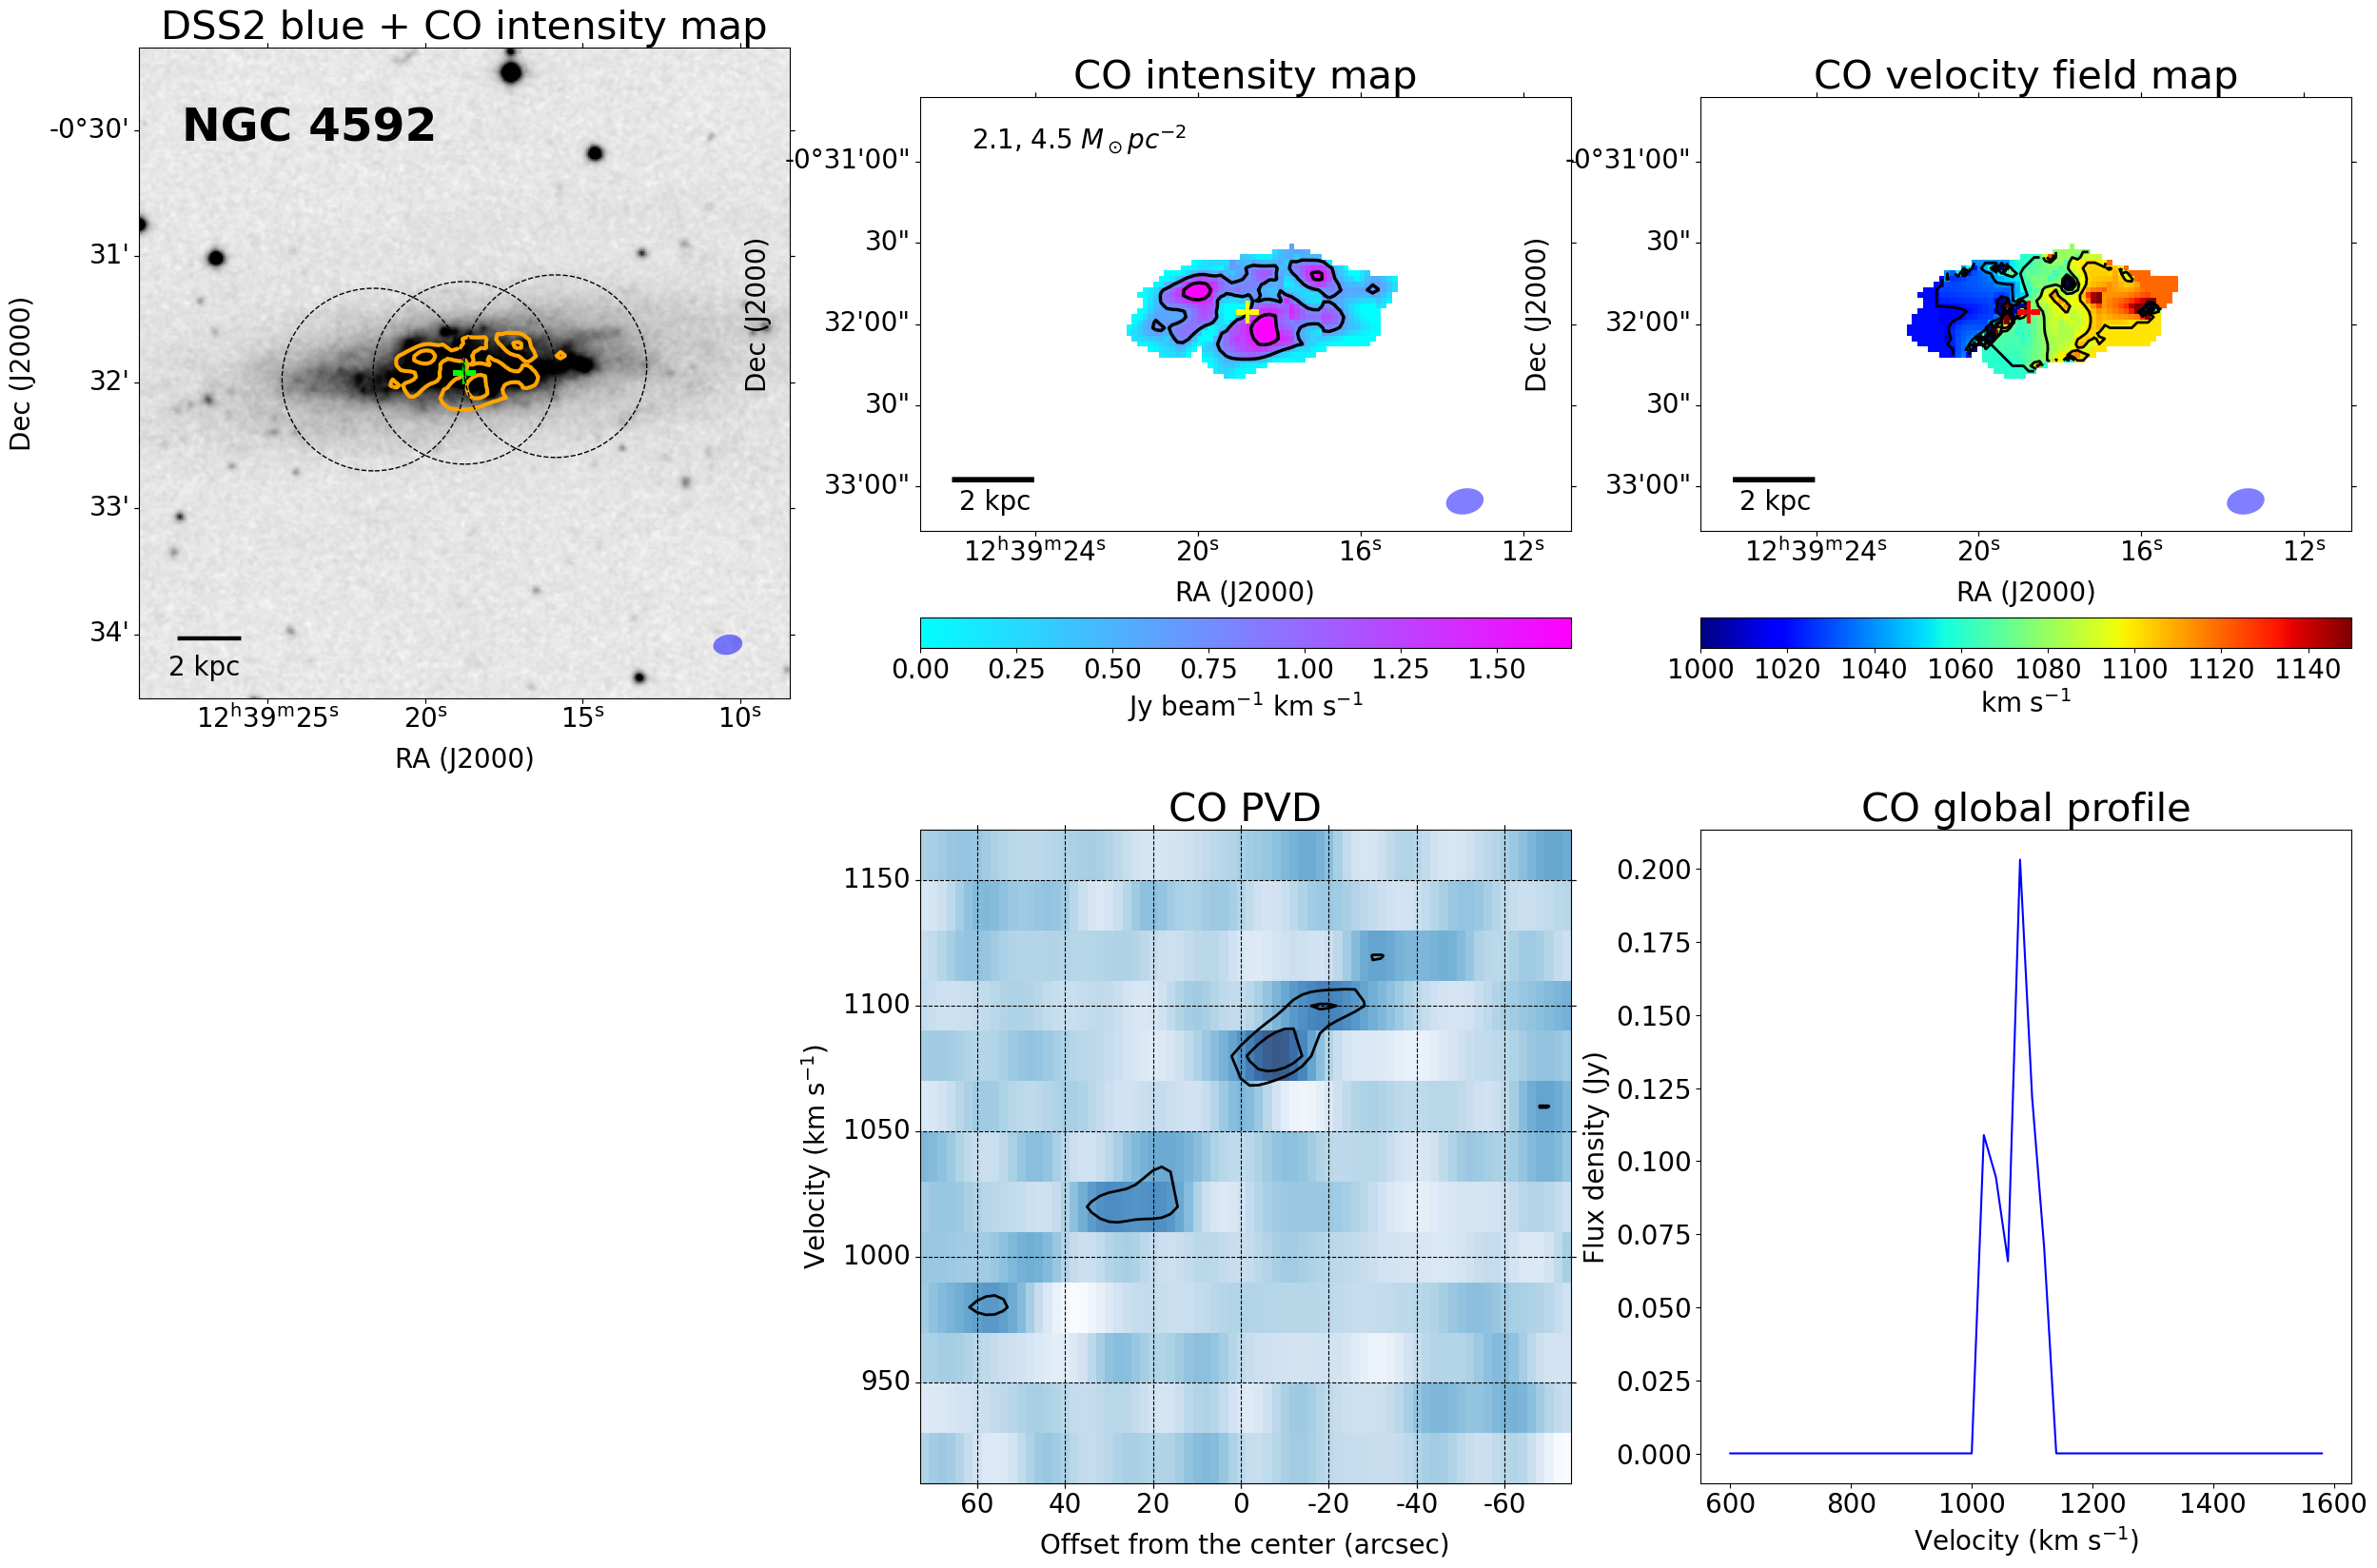
| NGC 4592 | 198 | 109 | 40 | 1.9 | 13.31.7 | 6.780.06 | 7.420.06 | 7.460.06 |
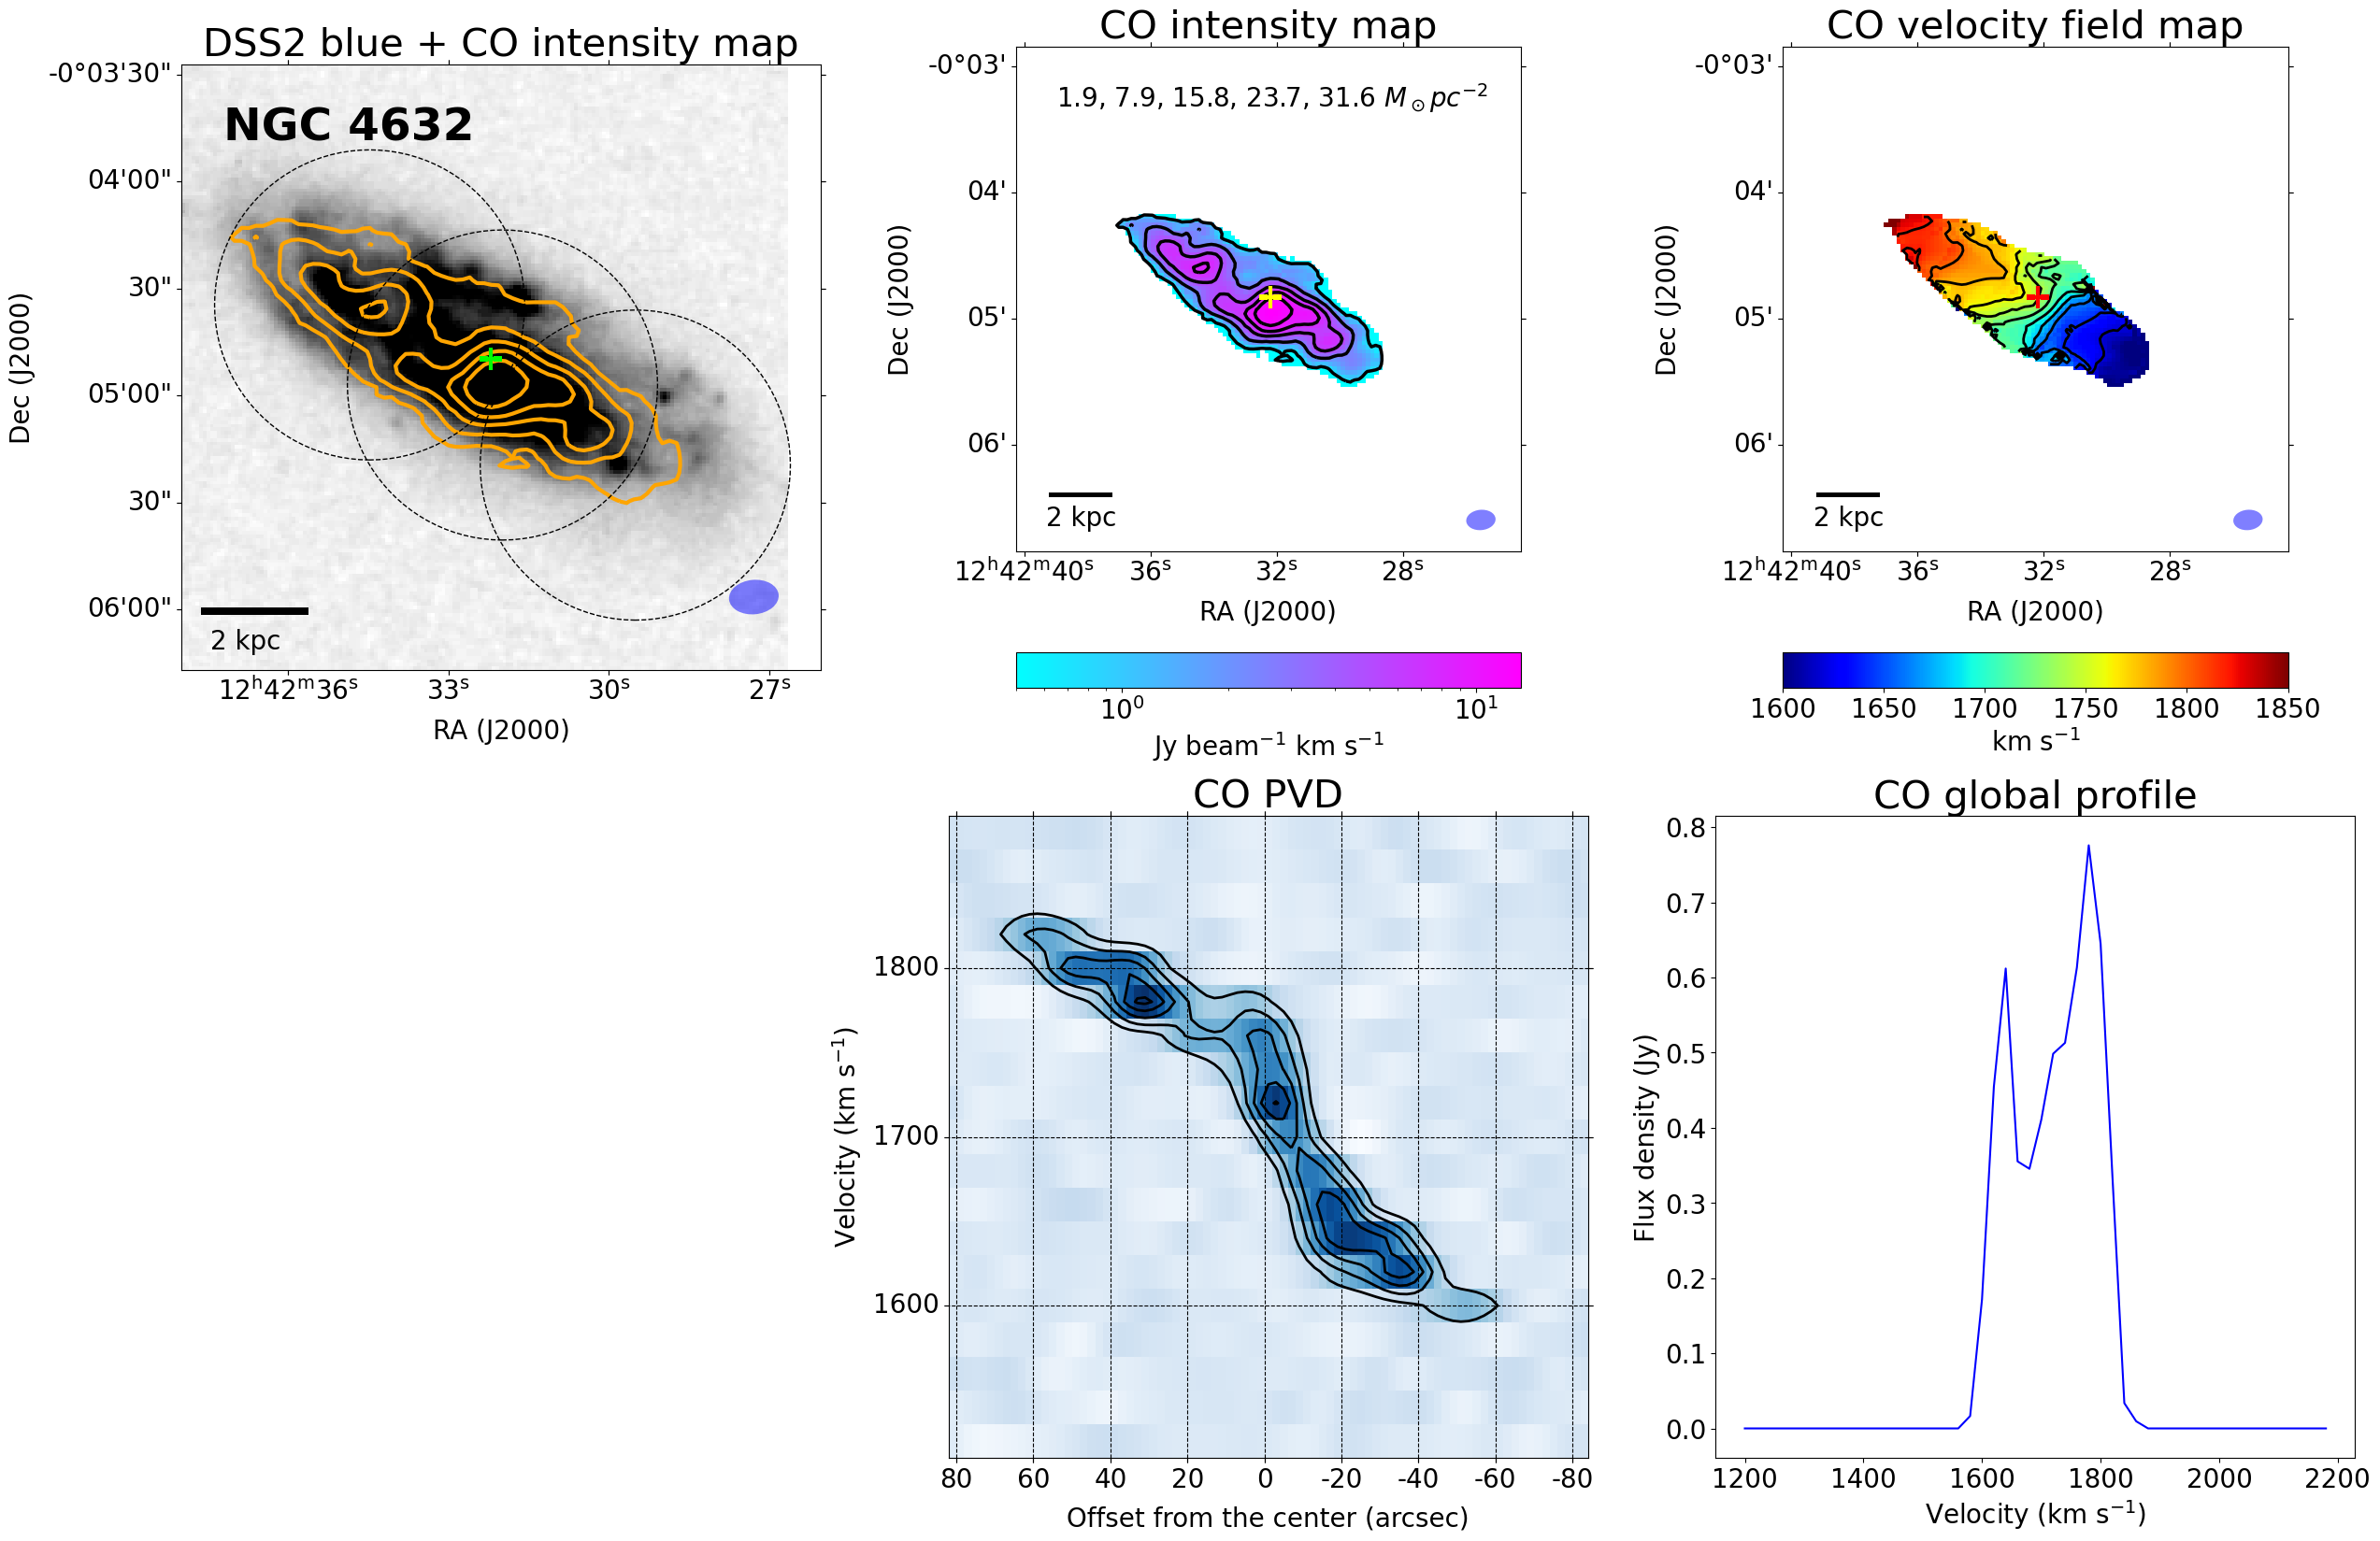
| NGC 4632 | 223 | 236 | 205 | 13.4 | 115.86.4 | 7.720.02 | 8.360.02 | 8.390.02 |
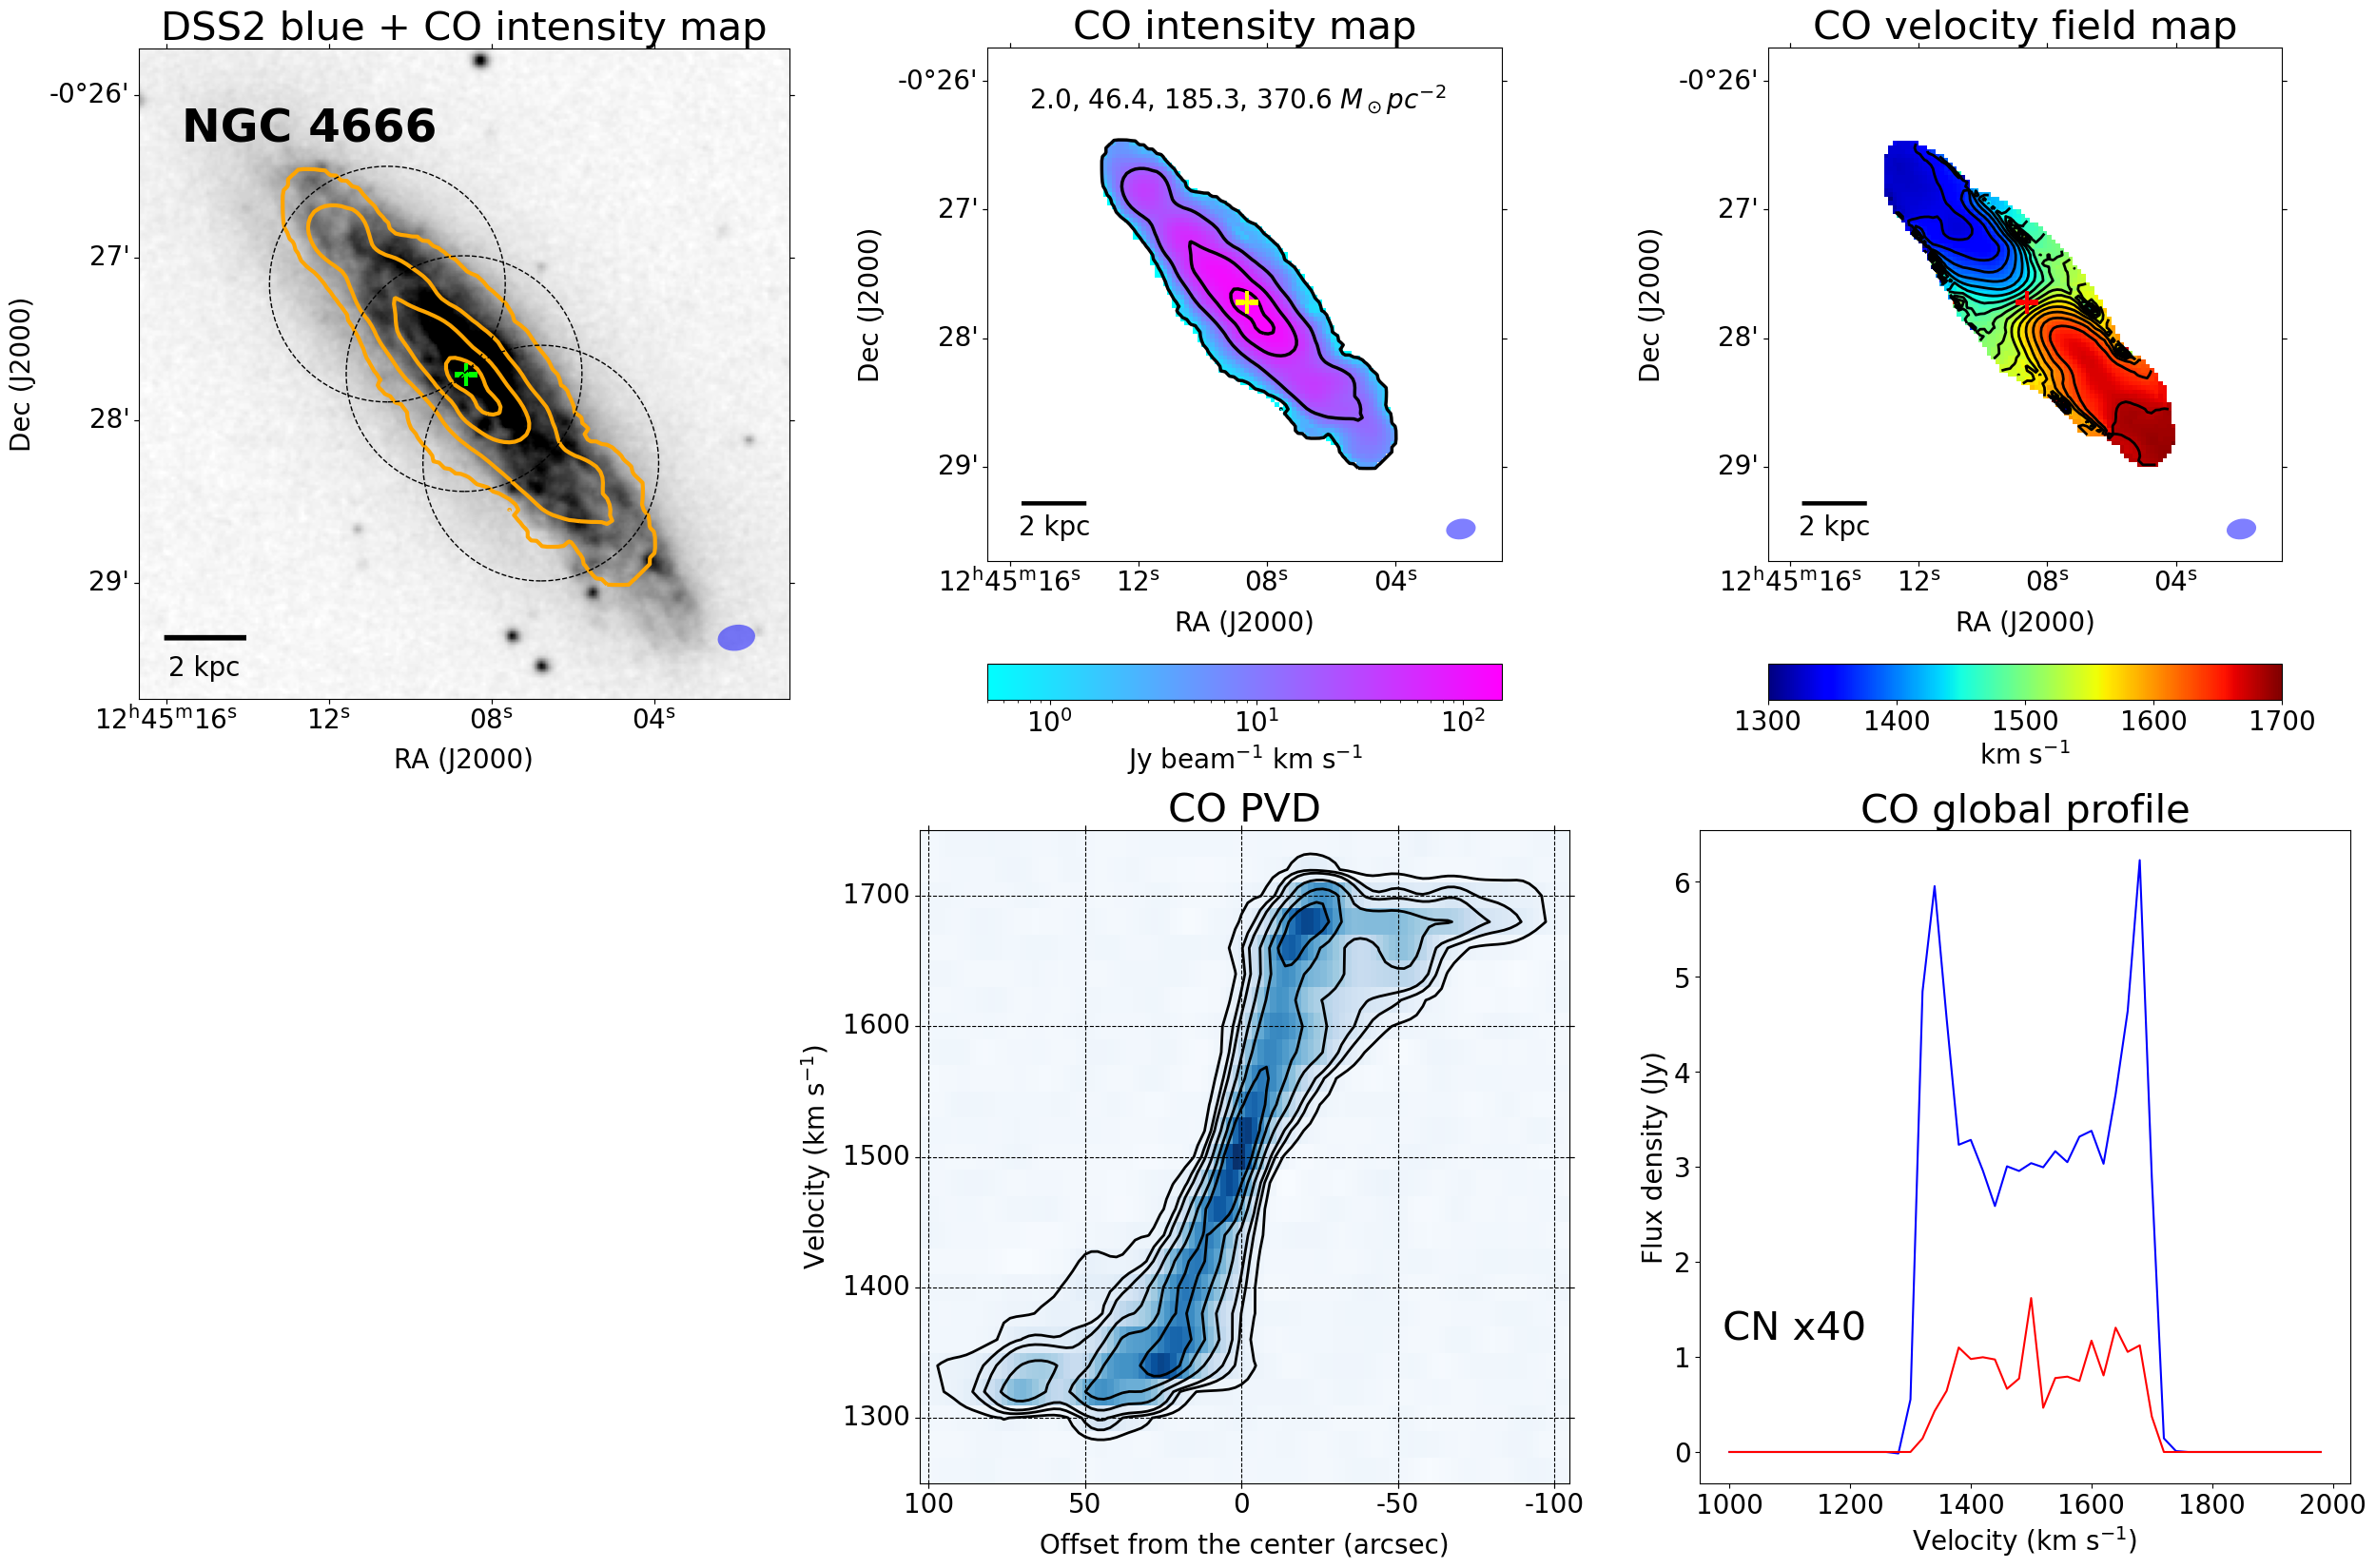
| NGC 4666 | 324 | 409 | 387 | 154.3 | 1471.773.7 | 8.820.02 | 9.460.02 | 9.400.02 |
| NGC 4688 | 44 | 0.9 | 5.61 | 6.25 | 6.52 | |||
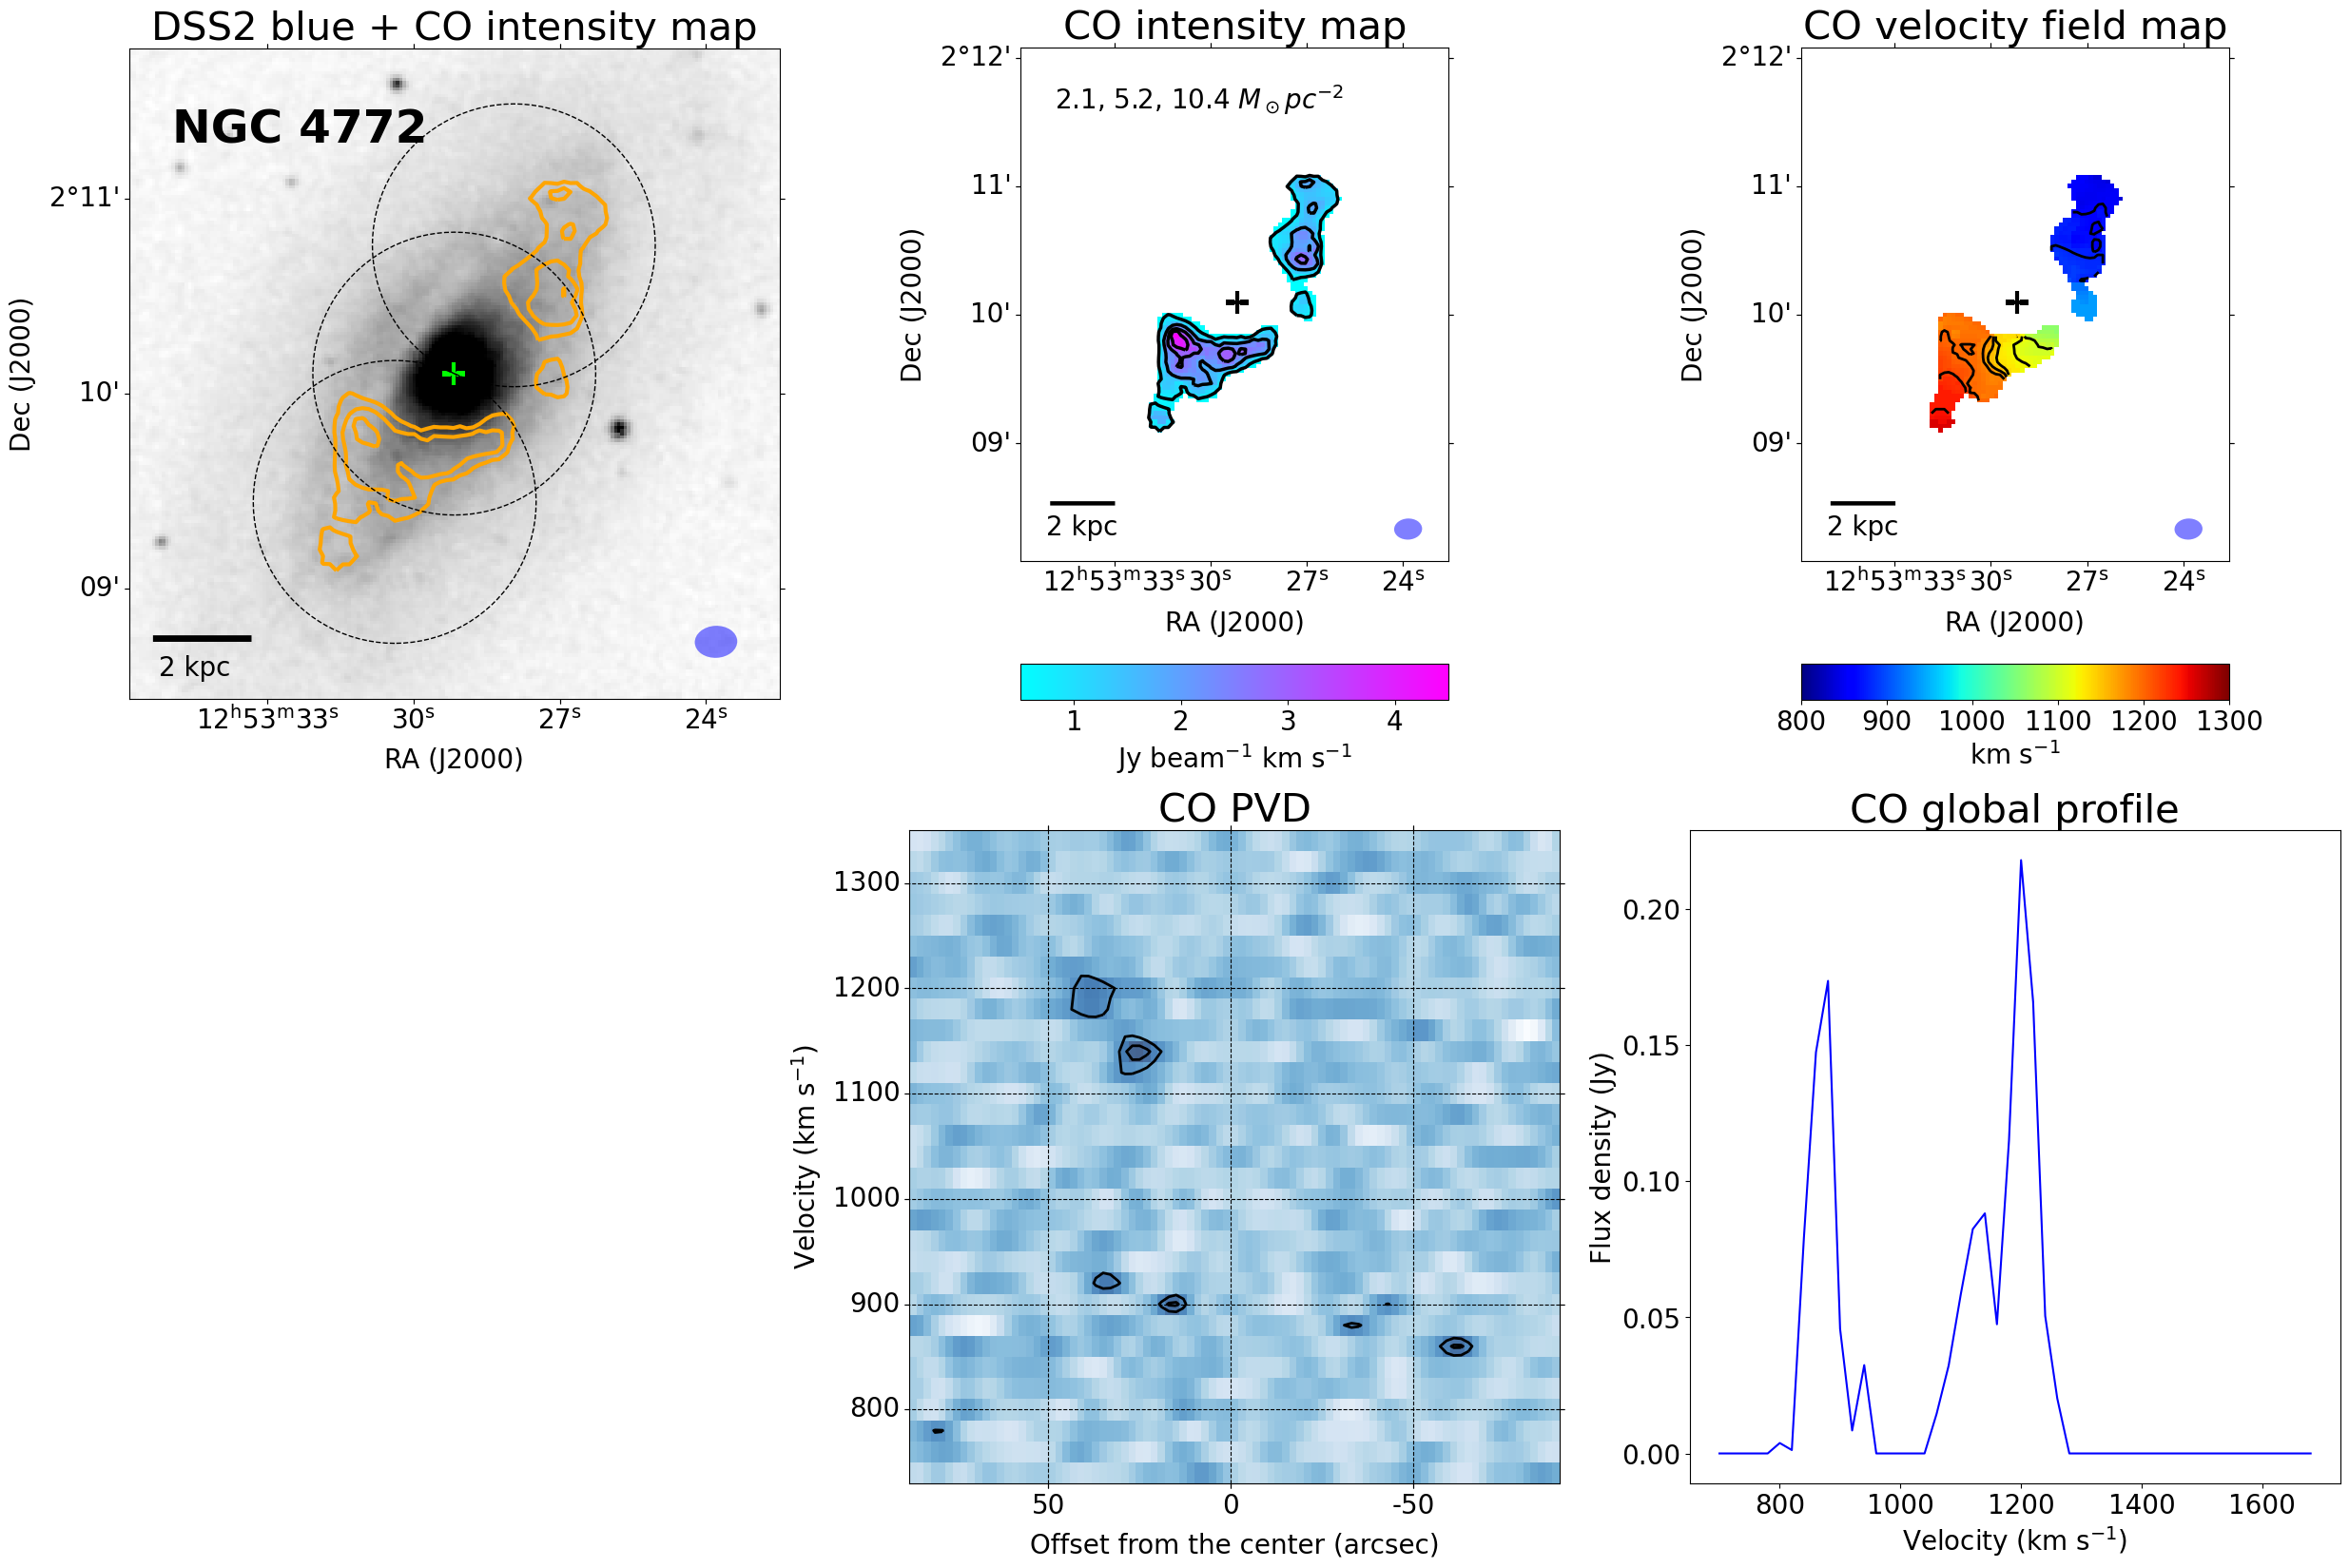
| NGC 4772 | 38 | 156 | 52 | 4.5 | 27.72.2 | 7.100.04 | 7.740.04 | 7.660.04 |
| UGC 07715 | 29 | 1.0 | 5.66 | 6.29 | 6.59 | |||
| UGC 07780 | 117 | 2.1 | 5.98 | 6.22 | 7.49 | |||
| UGC 07824 | 101 | 2.0 | 5.95 | 6.58 | 6.85 | |||
| UGC 07841 | 104 | 1.9 | 5.94 | 6.58 | 6.75 | |||
| UGC 07911 | 107 | 2.0 | 5.96 | 6.60 | 6.60 | |||
| UGC 07982 | 214 | 202 | 176 | 6.4 | 41.32.8 | 7.270.03 | 7.910.03 | 7.950.03 |
| UGC 08041 | 175 | 129 | 102 | 2.3 | 8.001.1 | 6.560.06 | 7.200.06 | 7.210.06 |
Note. — (1) Galaxy name; (2) the Hi linewidths measured at 50% of the peak flux (Kilborn et al., 2009); (3) the CO linewidths measured at 20% and 50% of the peak flux using SoFiA; (4) the peak value of CO intensity map; (5) the total CO flux; (6) the total CO luminosity; (7) & (8) the total molecular gas mass derived from the CO luminosity using the constant CO-to-H2 conversion factor ( = 4.35 pc-2 (K km s-1)-1) and the metallicity-dependent CO-to-H2 conversion factor.
3 Observations and data
3.1 Observations
Our CO imaging observations (project ID: 2019.1.01804.S; PI: B. Lee) of group galaxies were carried out using the ALMA/ACA in Cycle 7 (2019 October to 2019 December). While the ACA consists of 12 antennas of 7 m diameter (the 7m array) and 4 antennas of 12 m diameter (the total power array), we only used the 7m array, with 911 antennas in our observations. The mean precipitable water vapor value was 3.6 mm during the observations.
Four spectral windows (SPW 1, 2, 3 ,4) were set up to observe 12CO(=1–0) ( = 115.271 GHz) line and CN(=1–0; =3/2–1/2) ( = 113.491 GHz) line in the upper sideband (SPW 1 and 2) and 3 mm continuum emission in the lower sideband (SPW 3 and 4). Each SPW has a total bandwidth of 1875 MHz (5000 km s-1) and a channel width of 1.13 MHz (3 km s-1).
The size of the primary beam is 87. The most typical extent of CO gas in late-type galaxies is 50% 70% of the inner part of the optical disk (e.g., Schruba et al., 2011). In order to cover the entire CO disk, 15 out of 31 galaxies were observed in mosaic mode. The number of mosaic fields varies from two to 13 pointings, which depends on the apparent size of each target galaxy. The rest (16 targets) of the sample were observed by a single pointing. The largest recoverable angular scale (i.e., the maximum recoverable scale (MRS)) in our ACA observations is 59, corresponding to 7.8 kpc at 27.2 Mpc (I1459G) and 3.9 kpc at 13.6 Mpc (N4636G), respectively. With this MRS, we expected that our proposed observations using only the 7m array could recover most of the total flux. Thus, we did not include the total power array. However, we may possibly miss some CO flux. The missing flux problem is discussed in Section 4.2 and 5.2.
Based on the prediction for the molecular gas surface density at the edge of the star-forming disk (e.g., 4 pc-2; Schaye 2004), we aim to reach a gas surface density of 4 pc-2 in 5 in a beam with a velocity resolution of 20 km s-1. Adopting the Milky Way CO-to-H2 conversion factor ( = 4.35 pc-2 (K km s-1)-1; Strong & Mattox 1996; Bolatto et al. 2013), the requested sensitivity is 14.6 mJy beam-1 over a velocity resolution of 20 km s-1.
3.2 Data Reduction and Imaging
The ACA data were calibrated using the standard ALMA pipeline in the Common Astronomy Software Applications package (CASA, version: 5.6.1-8; McMullin et al. 2007). After calibration, the continuum is subtracted by fitting the line-free channels with the uvcontsub task. Cleaned CO data cubes of individual samples are created using the tclean task in the CASA package. The clean regions are carefully selected by visual inspection for every channel of the cubes. In particular, the mosaic images of 15 galaxies observed with multiple pointings were produced by setting the sub-parameter gridder=‘mosaic’ in the tclean task. To increase the signal-to-noise ratio (S/N) of the data and to recover faint CO emission, natural weighting was applied and the channel width of the cleaned cubes was binned into a velocity resolution of 20 km s -1. The final data cubes have a synthesized beam of 149 with a pixel size of 2. The noise level is measured using line-free channels. The typical root mean square (rms) noise level is 12.4 mJy beam-1 over a channel width of 20 km s-1, which is measured prior to the primary beam correction. The synthesized beam sizes and rms noise levels for individual galaxies are listed in Table 2. The final data cubes are corrected for primary beam attenuation with the impbcor task.
For each galaxy, we obtained a detection mask from the cleaned data cube, using the SoFiA (Source Finding Application) software (Serra et al., 2015b; Westmeier et al., 2021) with a 3 threshold for reliable detection. In particular, the data cube was convolved with several smoothing kernels, which are Gaussian filters with FWHM equivalent to 0, 3, and 7 pixels on the sky plane, and a threshold-based detection mask is produced for each smoothed version of the cube. The final detection mask is a combination of all these masks. Such a smooth + clip (S + C) procedure is good at detecting low density and diffuse structures. Then, a reliability parameter of the detection should be calculated by SoFiA by comparing the statistics of distribution of negative and positive pixels, based on the assumption that the noise has a rough symmetric distribution around zero, and thus the noise pattern of positive pixels should be similar to that of negative pixels. We refer the readers to Serra et al. (2015b) for more details of the algorithm. Because the field of view is relatively small for some of our observations, there is not sufficient statistics to robustly derive the reliability parameter for every galaxy. Therefore, we further manually inspect each detection mask to remove false detections. By applying the final detection masks for the sample galaxies, we generated integrated CO intensity maps (0th moment), velocity field maps (1st moment), and velocity dispersion maps (2nd moment).
3.3 Ancillary Data
To estimate the stellar masses (), SFRs, and Hi masses of galaxies in our sample and to investigate Hi distribution of the sample galaxies, we made use of the complementary data including the far-ultraviolet (FUV), near-ultraviolet (NUV), infrared, and Hi images. For calculating the stellar masses and SFRs, we assume a Kroupa initial mass function (IMF; Kroupa 2001). First, to obtain an estimate of the stellar masses, we utilize the photometric pipeline of Wang et al. (2017) with the 3.4 m data (W1 band) and 4.6 m data (W2 band) of the Wide-field Infrared Survey Explorer (WISE; Wright et al. 2010). We derive the stellar mass of the sample galaxies using the W1 luminosity with a W1-W2 color dependent mass-to-light ratio (Jarrett et al., 2017) (for details, see Section 3 of Wang et al. 2017). The typical error of the stellar mass is 0.15 dex. With a combination of the Galaxy Evolution Explorer (GALEX) FUV data (Martin et al., 2005) and the 22 m data (W4 band) from WISE (Wright et al., 2010), we also derive the dust attenuation corrected SFR by using the equations of Calzetti (2013). The FUV and W4 fluxes trace the dust free and dust attenuated part of the total SFR in a galaxy, respectively. When the FUV fluxes have too low S/N (1), we use GALEX NUV fluxes to estimate the dust free part of the SFR.
For some of our sample galaxies, there are recent high-resolution Hi imaging data. For the I1459G sample, 10 out of 11 galaxies were detected in the ASKAP BETA (the Boolardy Engineering Test Array) survey (Serra et al., 2015a). In the case of the N4636G sample, 18 out of 20 galaxies were detected in the WALLABY pilot survey (Koribalski et al., 2020). For NGC 4536 and NGC 4772, we use the Hi imaging data of the VIVA (the VLA Imaging survey of Virgo galaxies in Atomic gas, Chung et al. 2009). In total, 28 out of 31 sample galaxies (90%) have resolved Hi images. The spatial resolutions for the ASKAP BETA, WALLABY pilot survey, and VIVA are 60 (7.92 kpc), 30 (1.98 kpc), and 18 (1.19 kpc), respectively. These Hi imaging data are useful for a comparison of the CO distribution of group galaxies. We adopted the Hi gas masses from previous Parkes observations (Kilborn et al., 2009) for homogeneity and flux completeness. The stellar masses, SFRs, and Hi gas masses of our sample are summarized in Table 1.
4 Results
4.1 CO Detections
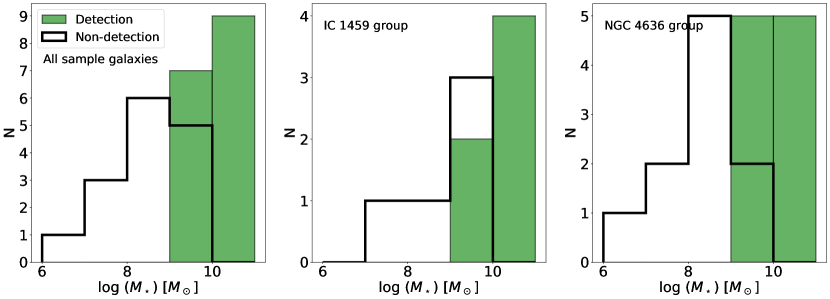
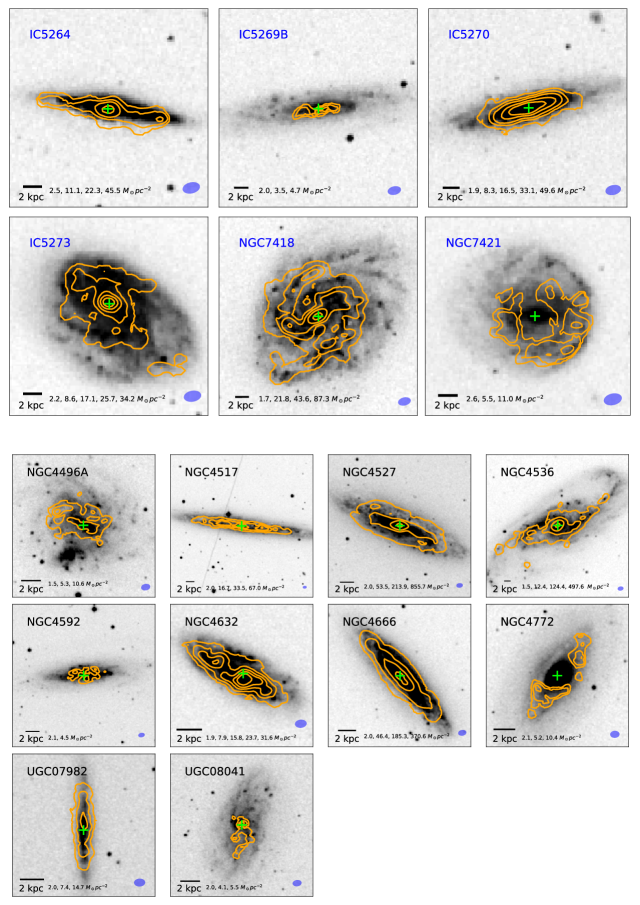
We detected CO emission in 16 out of 31 galaxies from both the I1459G (6/11) and the N4636G (10/20). The stellar mass range of galaxies with CO detection is 1091010 (Figure 3); all of these are spiral galaxies. Figure 4 shows the CO distribution overlaid on DSS2 blue optical images. On the other hand, galaxies without CO detection tend to have lower stellar masses (9.4109; see Figure 3), and their morphological types are dwarfs and spirals (Figure 29 in Appendix F). Both Figures 1 and 2 show the distributions of all sample galaxies on the projected sky plane and on the projected PSD. Red and black open circles indicate CO detections and nondetections of CO, respectively. Interestingly, most of the CO-detected galaxies of the N4636G tend to be at large group-centric radii, while those in the I1459G tend to be at smaller group-centric radii. We discuss this in detail in Section 5.3.
4.2 CO Properties
The integrated CO flux () are measured in Jy km s-1 using
| (1) |
where is the total flux of CO in each channel, is the velocity resolution (20 km s-1) of the CO data cube. For the integrated CO flux, all pixels within the detection mask are summed over channels. The uncertainty of the integrated CO flux is calculated by
| (2) |
where is the rms noise level of data cube, and is the number of beams in the emission region of each channel. The first term of equation 2 is the measurement error of the integrated CO flux, and the second term is a typical absolute flux accuracy (5% in Band 3, ALMA cycle 7 proposer’s guide222https://almascience.nao.ac.jp/documents-and-tools/cycle7/alma-proposers-guide). The integrated CO flux and its uncertainty are summarized in Table 3.
For galaxies with nondetections, the upper limits of CO flux are estimated using the rms noise level. To calculate the upper limits, we assume that the size of the CO-emitting area is the same as the beam size and the line width of the CO disk corresponds to an FWHM of Hi gas. We adopt values of the FWHM of Hi gas (Table 3) from the GEMS-Hi observations of Kilborn et al. (2009).
In our sample, CO emission of five galaxies (NGC 4517, NGC 4527, NGC 4536, NGC 4632, NGC 4666) in the N4636G were also detected in previous single-dish observations (Boselli et al., 2014a; Sorai et al., 2019). Except for NGC 4517, four galaxies have resolved CO maps from the CO Multi-line Imaging of Nearby Galaxies (COMING) project (Sorai et al., 2019). To estimate how much of the total CO flux we recover in our ACA observations, we compared the CO flux of our ACA observations with that of previous single-dish observations from the literature. The flux ratio between our ACA data and the single-dish data ranges from 0.5 to 0.9. The averaged flux ratio of three galaxies (NGC 4536, NGC 4632, NGC 4666) is 0.9, but two galaxies (NGC 4517, NGC 4527) show relatively low flux ratios (NGC 4517: 0.5 and NGC 4527: 0.7). We may miss some CO flux of large-scale structures that are larger than the maximum recoverable scale (59) of our ACA observations, especially for galaxies with a large angular size of the optical disk (see also Appendix D of Leroy et al. (2021) for a detailed description of the missing flux as a function of CO disk size).
The CO luminosity () is calculated using the following equation (Solomon & Vanden Bout, 2005):
| (3) |
in K km s-1 pc2, where is the integrated CO flux in Jy km s-1, is the luminosity distance in Mpc, is the observing frequency in GHz, and z is the redshift. Using , the H2 masses for our sample galaxies are determined as
| (4) |
where is a CO-to-H2 conversion factor in pc-2 (K km s-1)-1.
We apply two different CO-to-H2 conversion factors. First, we use the metallicity-dependent CO-to-H2 conversion factor calculated using the Equation (25) of Accurso et al. (2017). Following the approach of Zabel et al. (2019), we do not consider the distance from the main sequence (MS). The MS parameter does not significantly influence the results of calculation of the metallicity-dependent CO-to-H2 conversion factor (Zabel et al., 2019). We also follow the approach of Zabel et al. (2019) to calculate metallicities of our samples because we do not have metallicities of individual galaxies. To derive metallicities of individual galaxies, we use the mass-metallicity relation of Sánchez et al. (2017). As a result, the metallicity-dependent CO-to-H2 conversion factor here mainly depends on the stellar masses of galaxies. Therefore, the low-mass galaxies have higher conversion factors. Secondly, we also adopt = 4.35 pc-2 (K km s-1)-1 ( cm-2 (K km s; Strong & Mattox 1996; Bolatto et al. 2013). This CO-to-H2 conversion factor includes a factor of 1.36 for helium abundance correction.
The CO linewidth is measured at 20% () and 50% () of the peak flux using SoFiA. The CO linewidths, CO luminosities, and H2 masses for our sample of group galaxies are summarized in Table 3. The details of the CO data for individual group galaxies with CO detections are described in Appendix.
4.3 Peculiar CO Structures
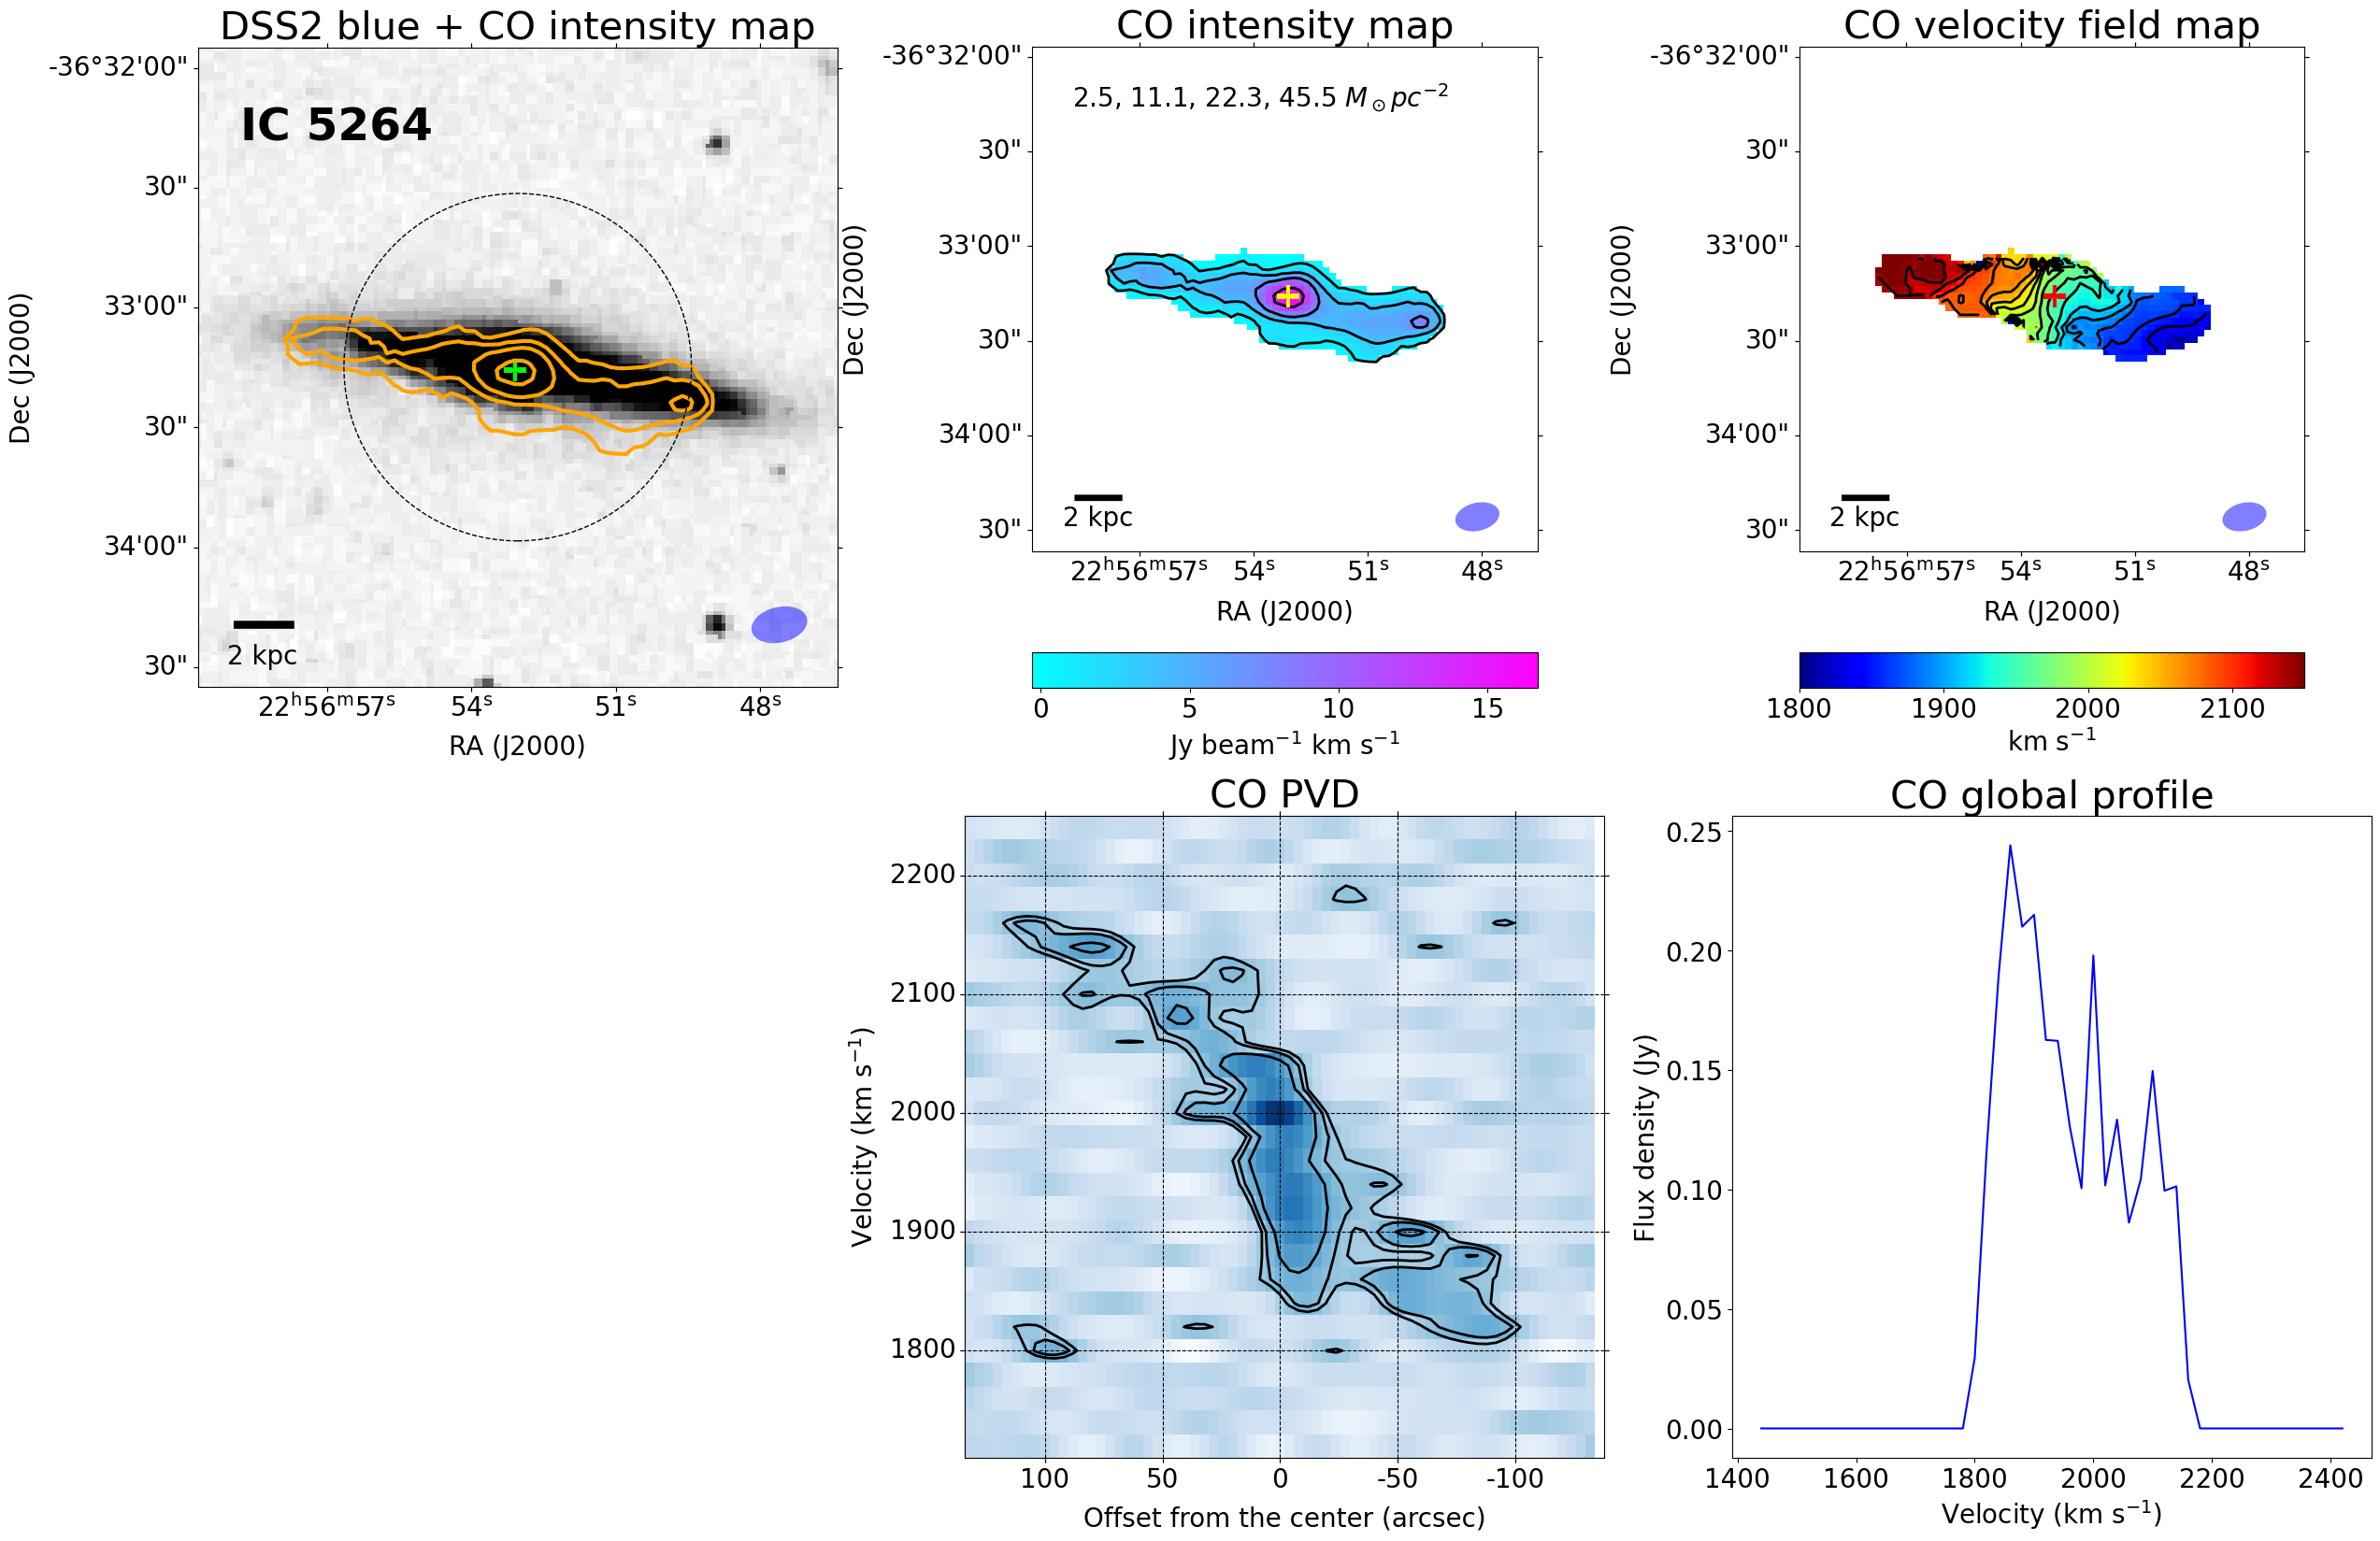
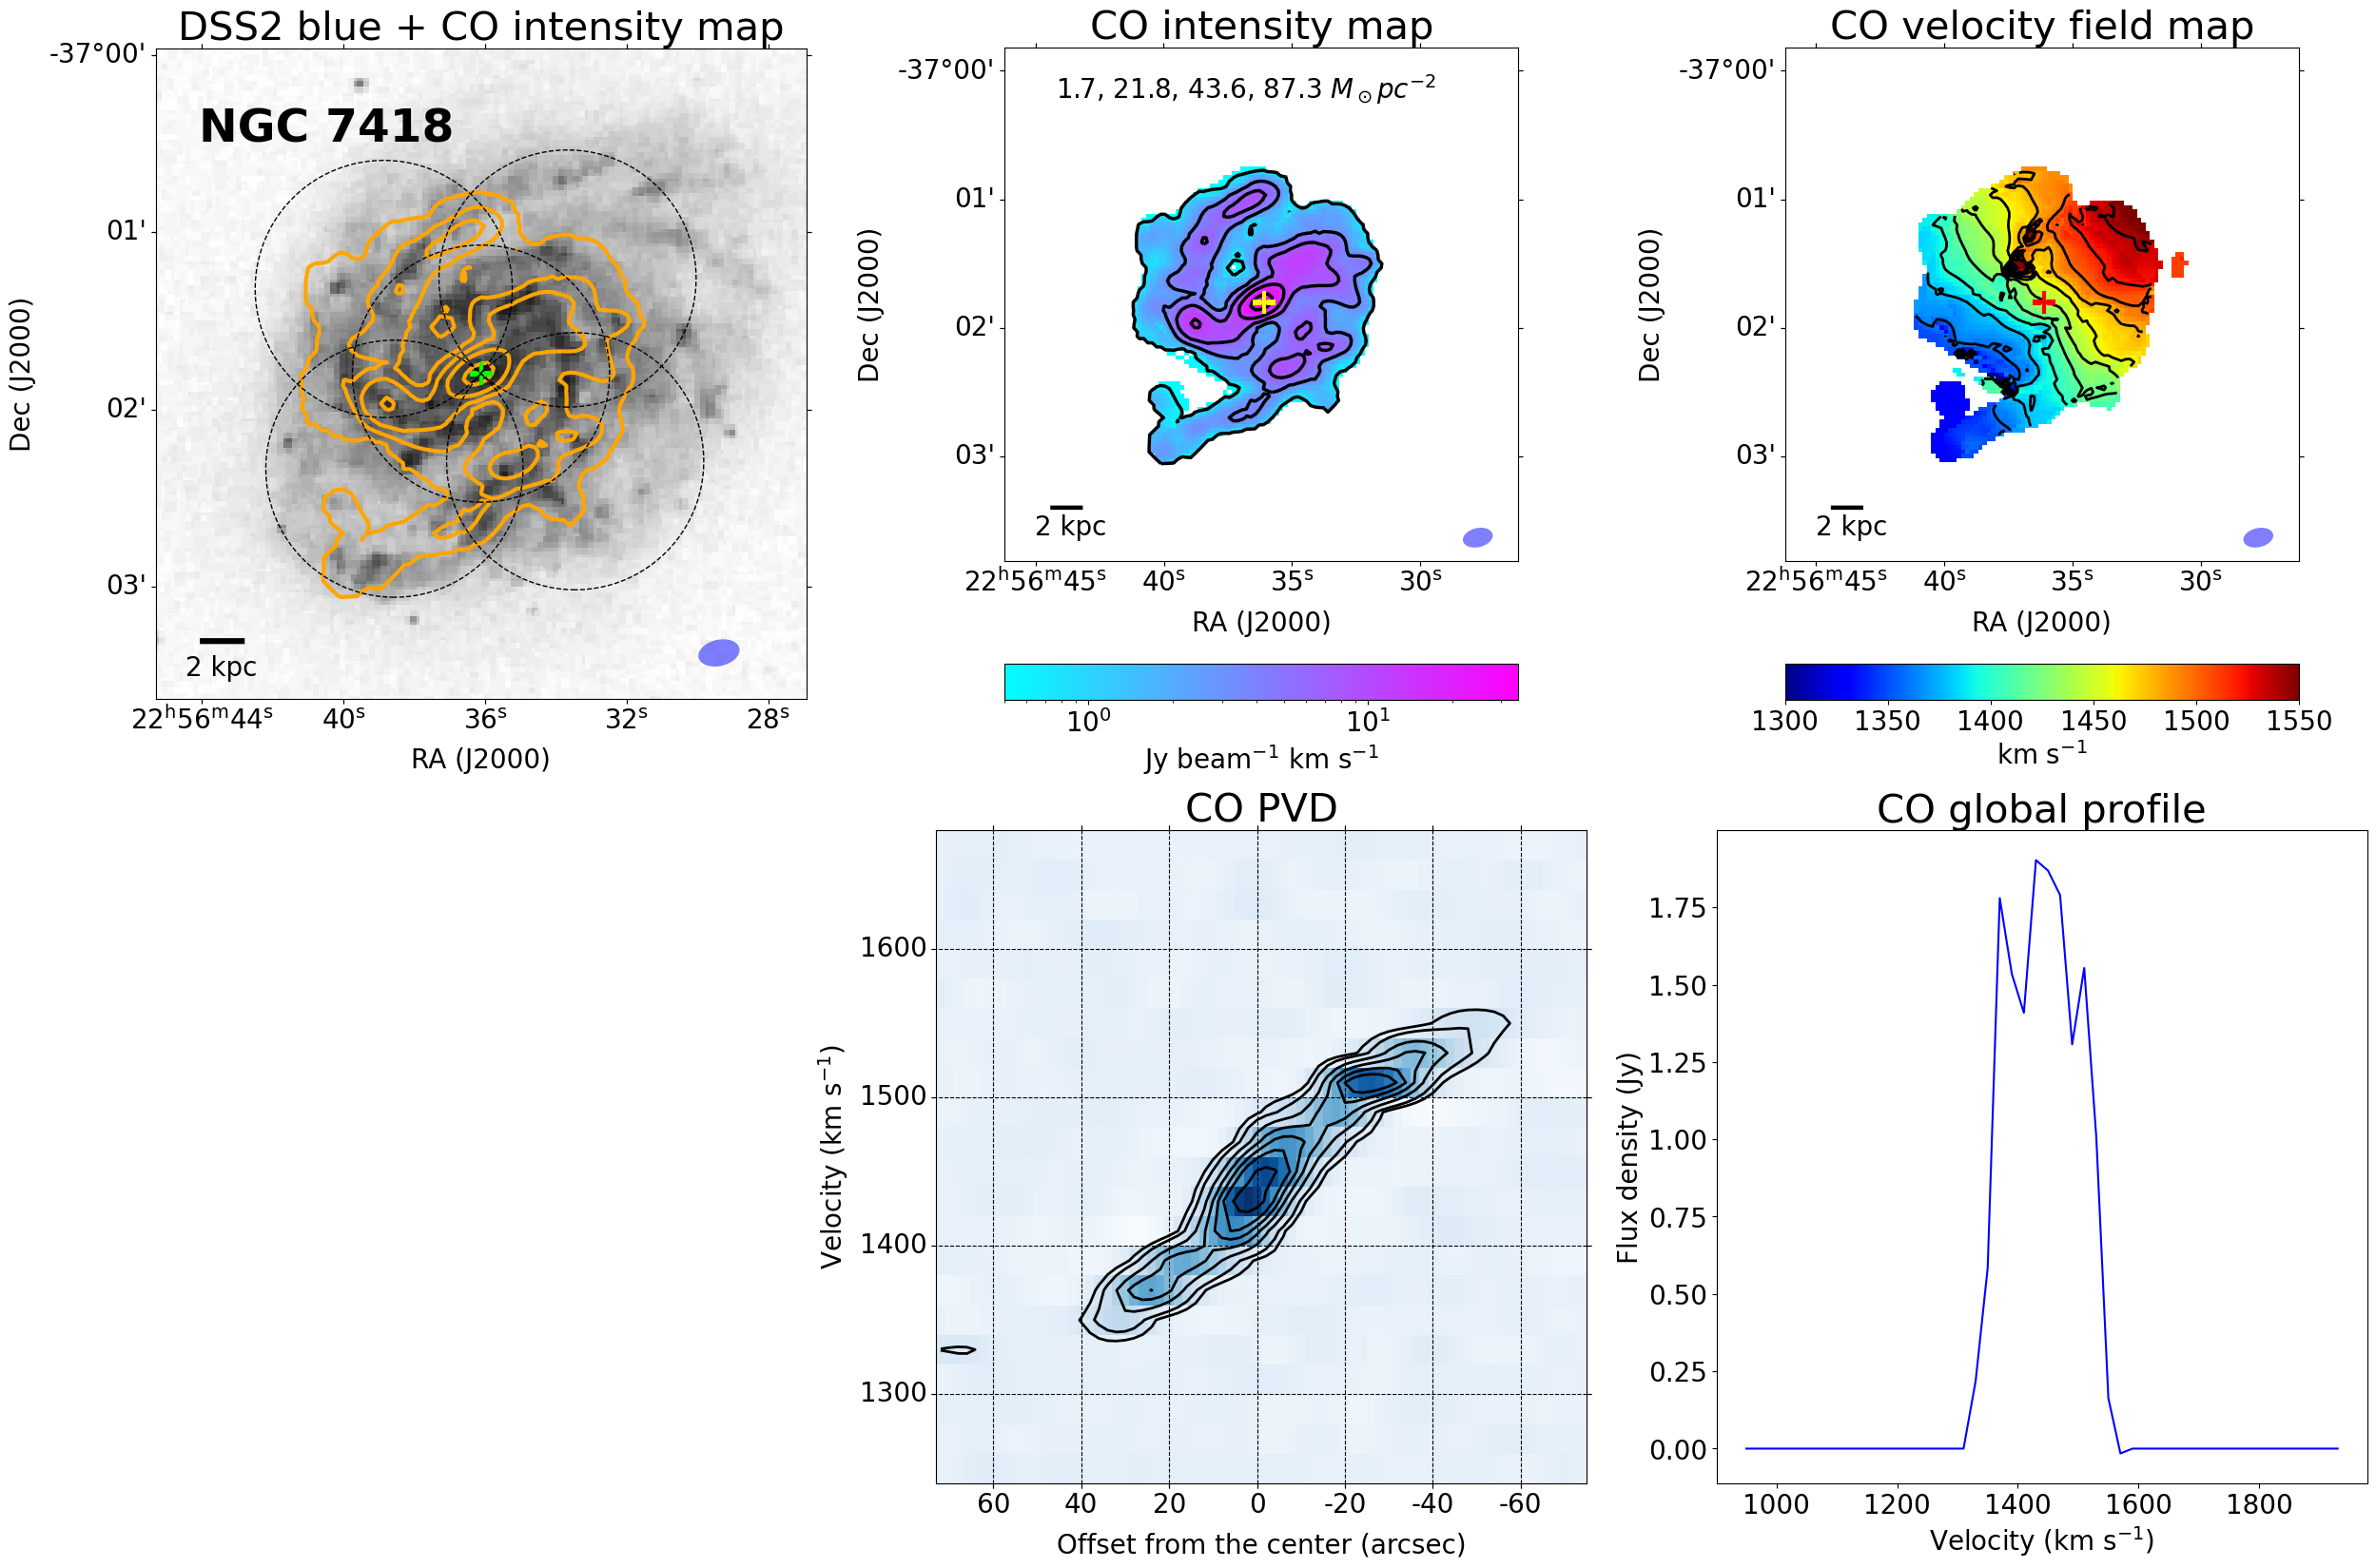
We find that some of our group samples show peculiar CO structures in their CO intensity maps, CO velocity maps, and position-velocity diagrams (PVDs), as seen in Figure 4 and the CO atlas of our group members in Appendix B. These peculiarities are such as (1) a highly asymmetric CO distribution, (2) a hole in the central region, (3) a large offset (1 kpc) between the CO peak and the optical center, (4) a bar- or ring-like structure, and (5) a high molecular gas surface density (100 pc-2) in the central region.
Asymmetric CO distribution
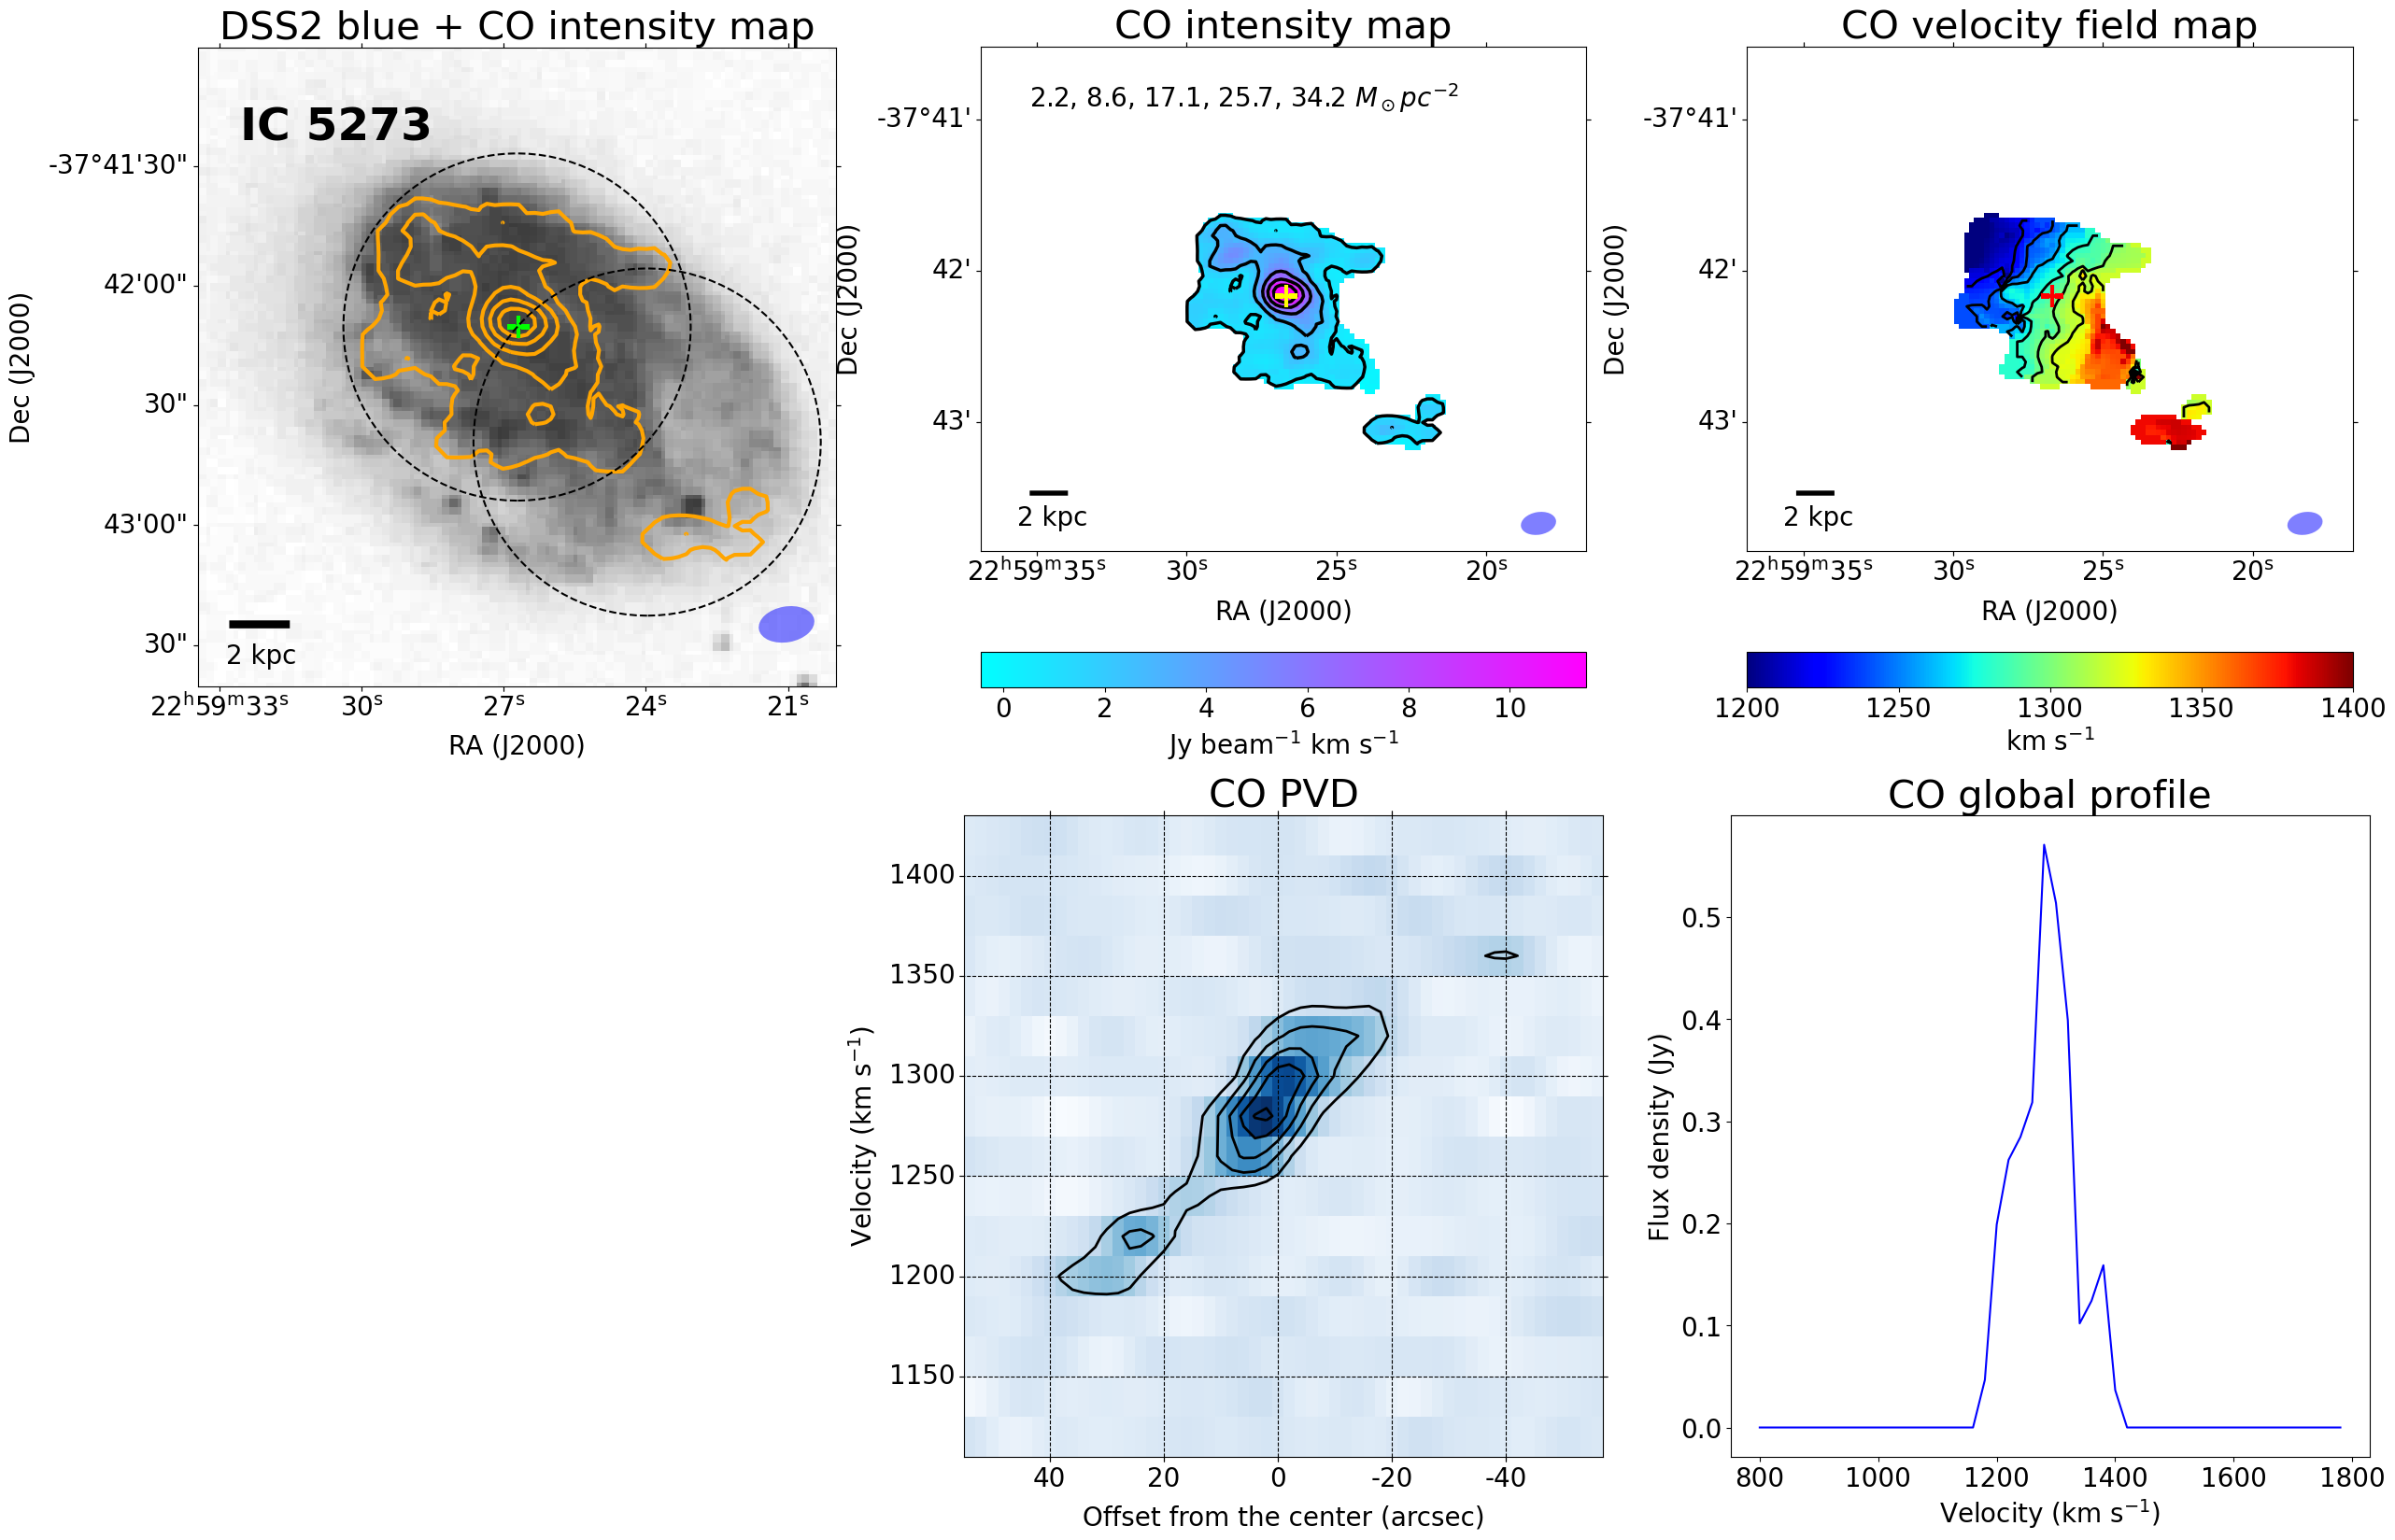
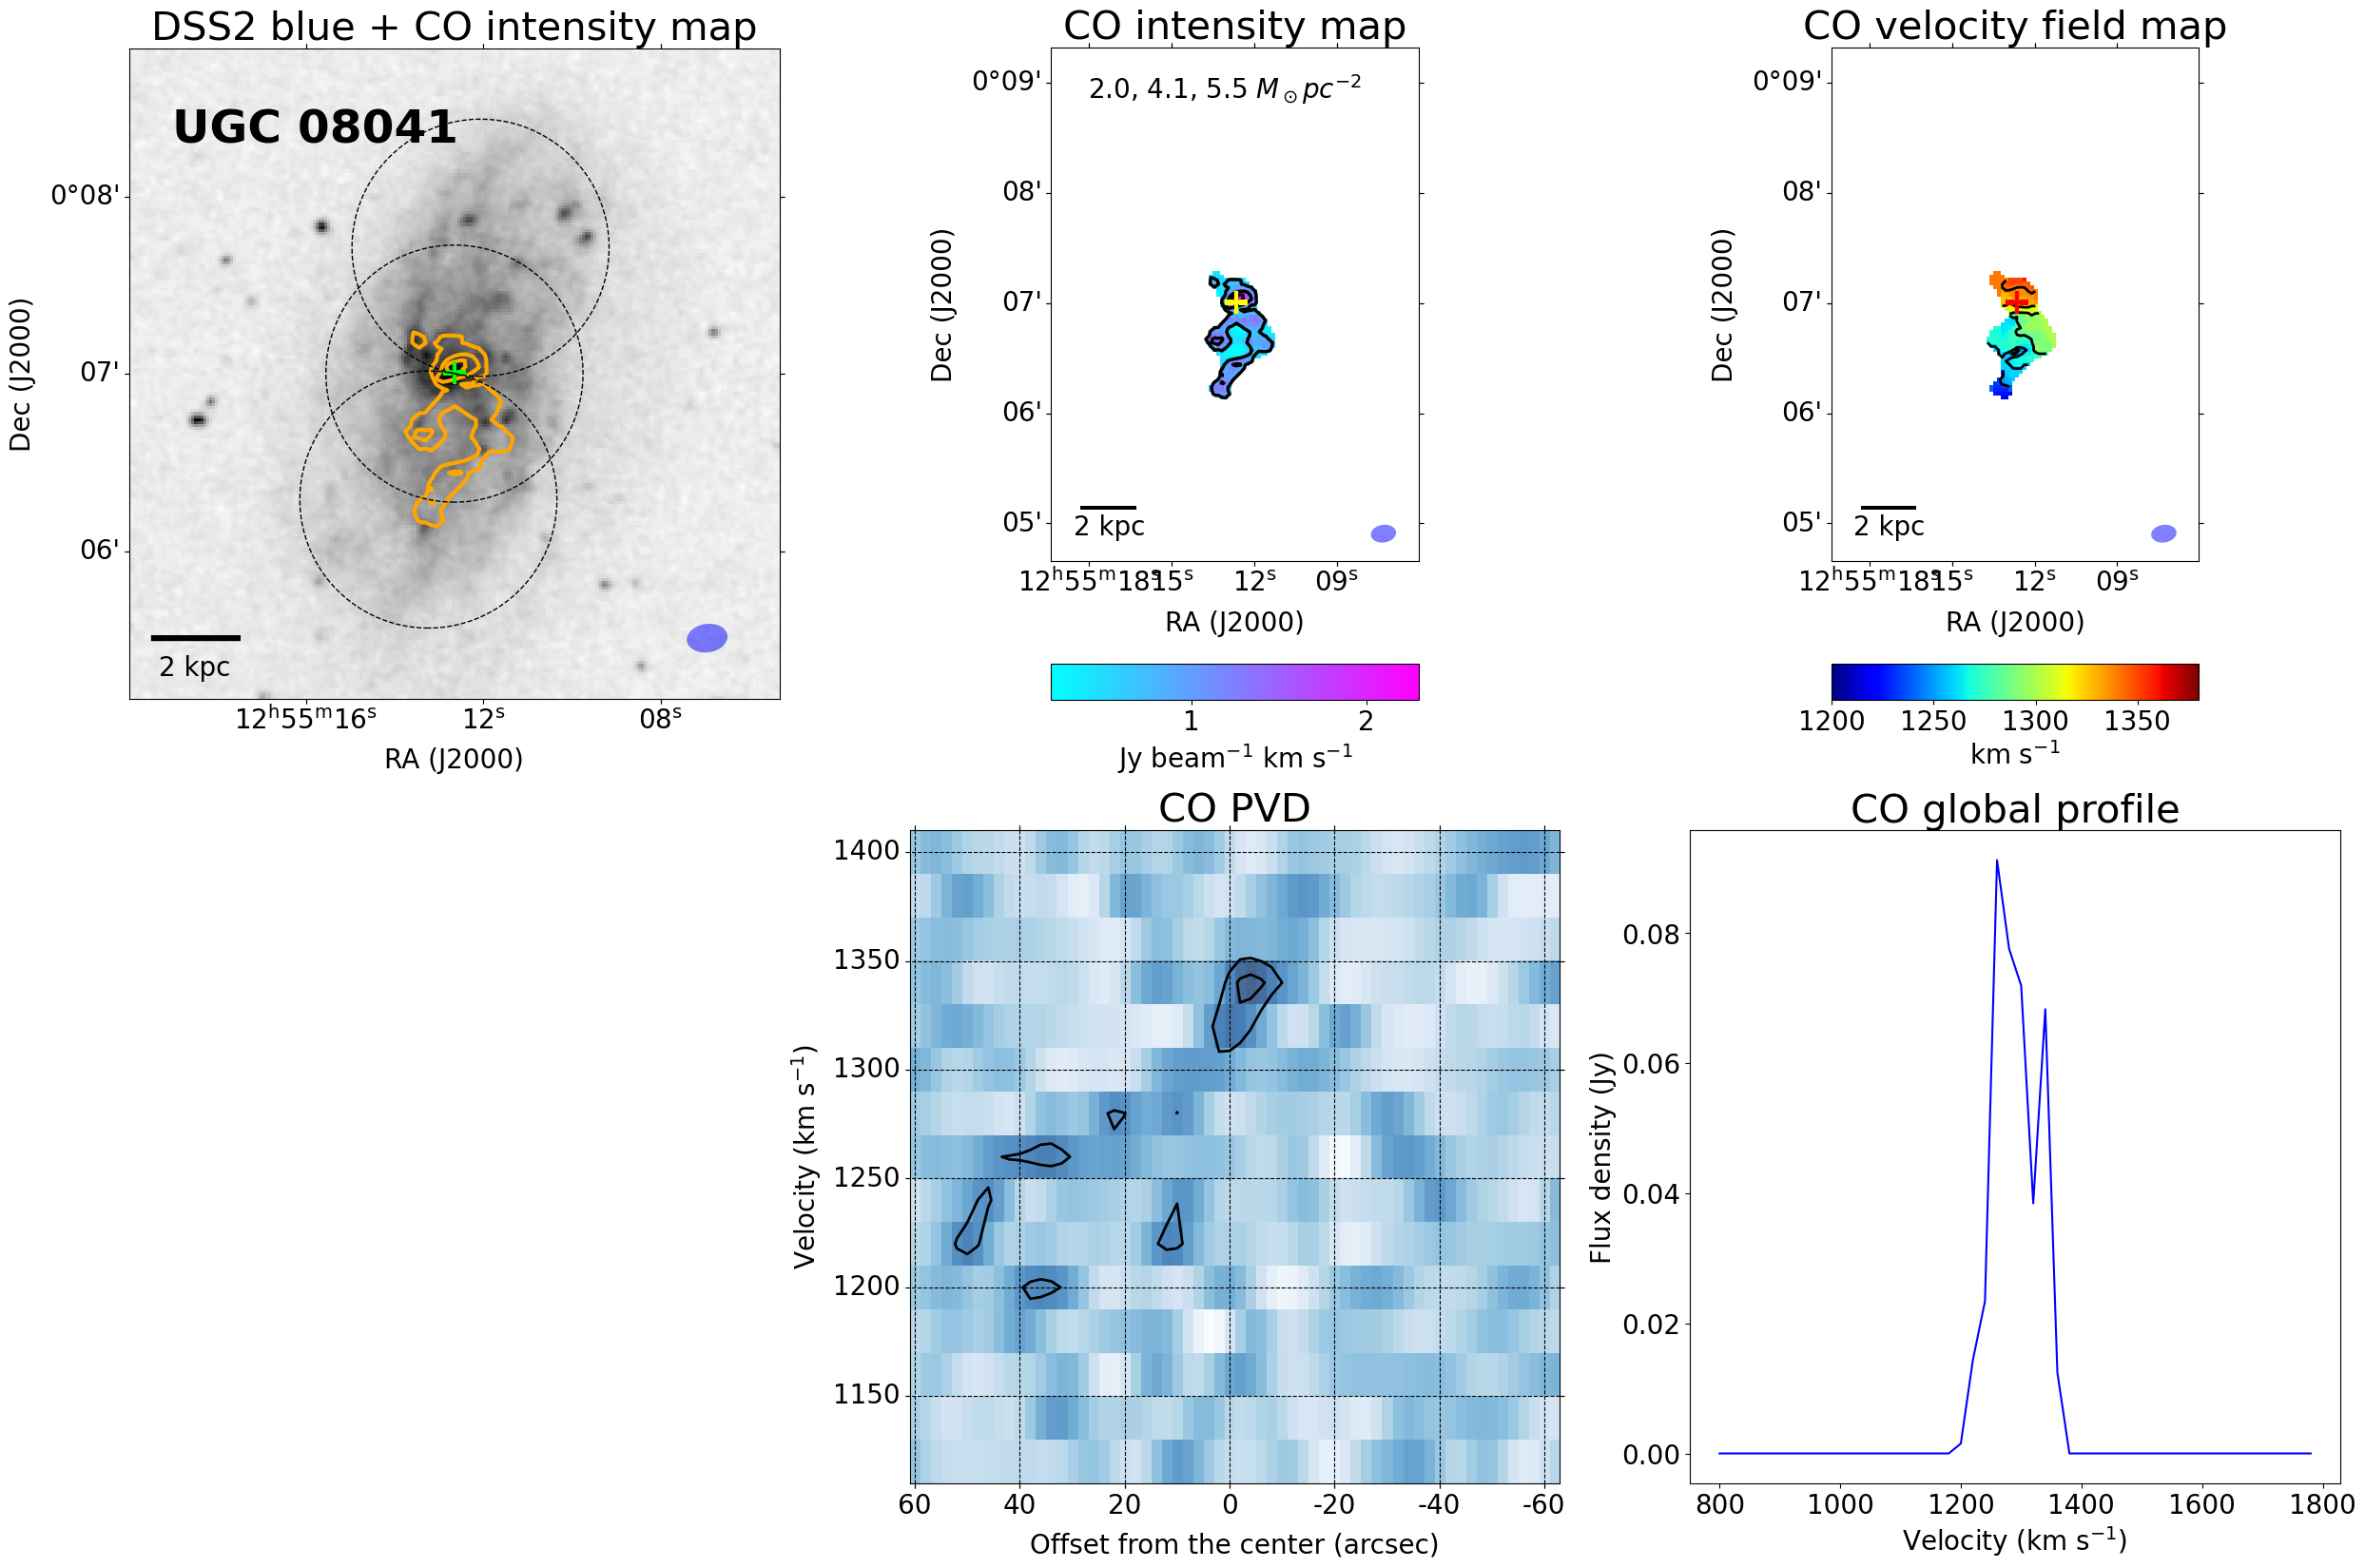
IC 5264, IC 5273, and NGC 7418 in the I1459G show highly asymmetric CO distributions. For IC 5264, the CO disk in the west side is shrunken, compared to the extent of the CO disk in the east side (49 (6.5 kpc) in the west side versus 57 (7.5 kpc) in the east side, Figure 4). The CO gas also appears to be extended toward the southwest. The 60% of the total CO flux is measured in the southern part below the major axis of IC 5264, compared to the CO flux in the northern part. In IC 5273, a CO clump is located at the southwest edge of the stellar disk (Figure 4); its distance from the optical center is 8.8 kpc. The CO flux of this clump is 3 Jy km s-1, which corresponds to 5% of the total CO flux. While the CO distribution of NGC 7418 follows well the spiral arms of the stellar disk, a long CO structure in the southeast part of the CO disk is extended up to 11.4 kpc from the center of the stellar disk. On the opposite side, however, the extent of the CO disk is about 7.8 kpc. Two galaxies (NGC 4632 and UGC 08041) in the N4636G also show asymmetric CO distributions. The CO disk of NGC 4632 is more extended toward the northeast side (80 (5.3 kpc) in the northeast versus 61 (4.0 kpc) in the southwest). UGC 08041 has a very extended CO structure in the southern part (53 (3.5 kpc) in the south versus 13 (0.9 kpc) in the north).
No CO emission in the central region and large offset between the CO peak and the optical center
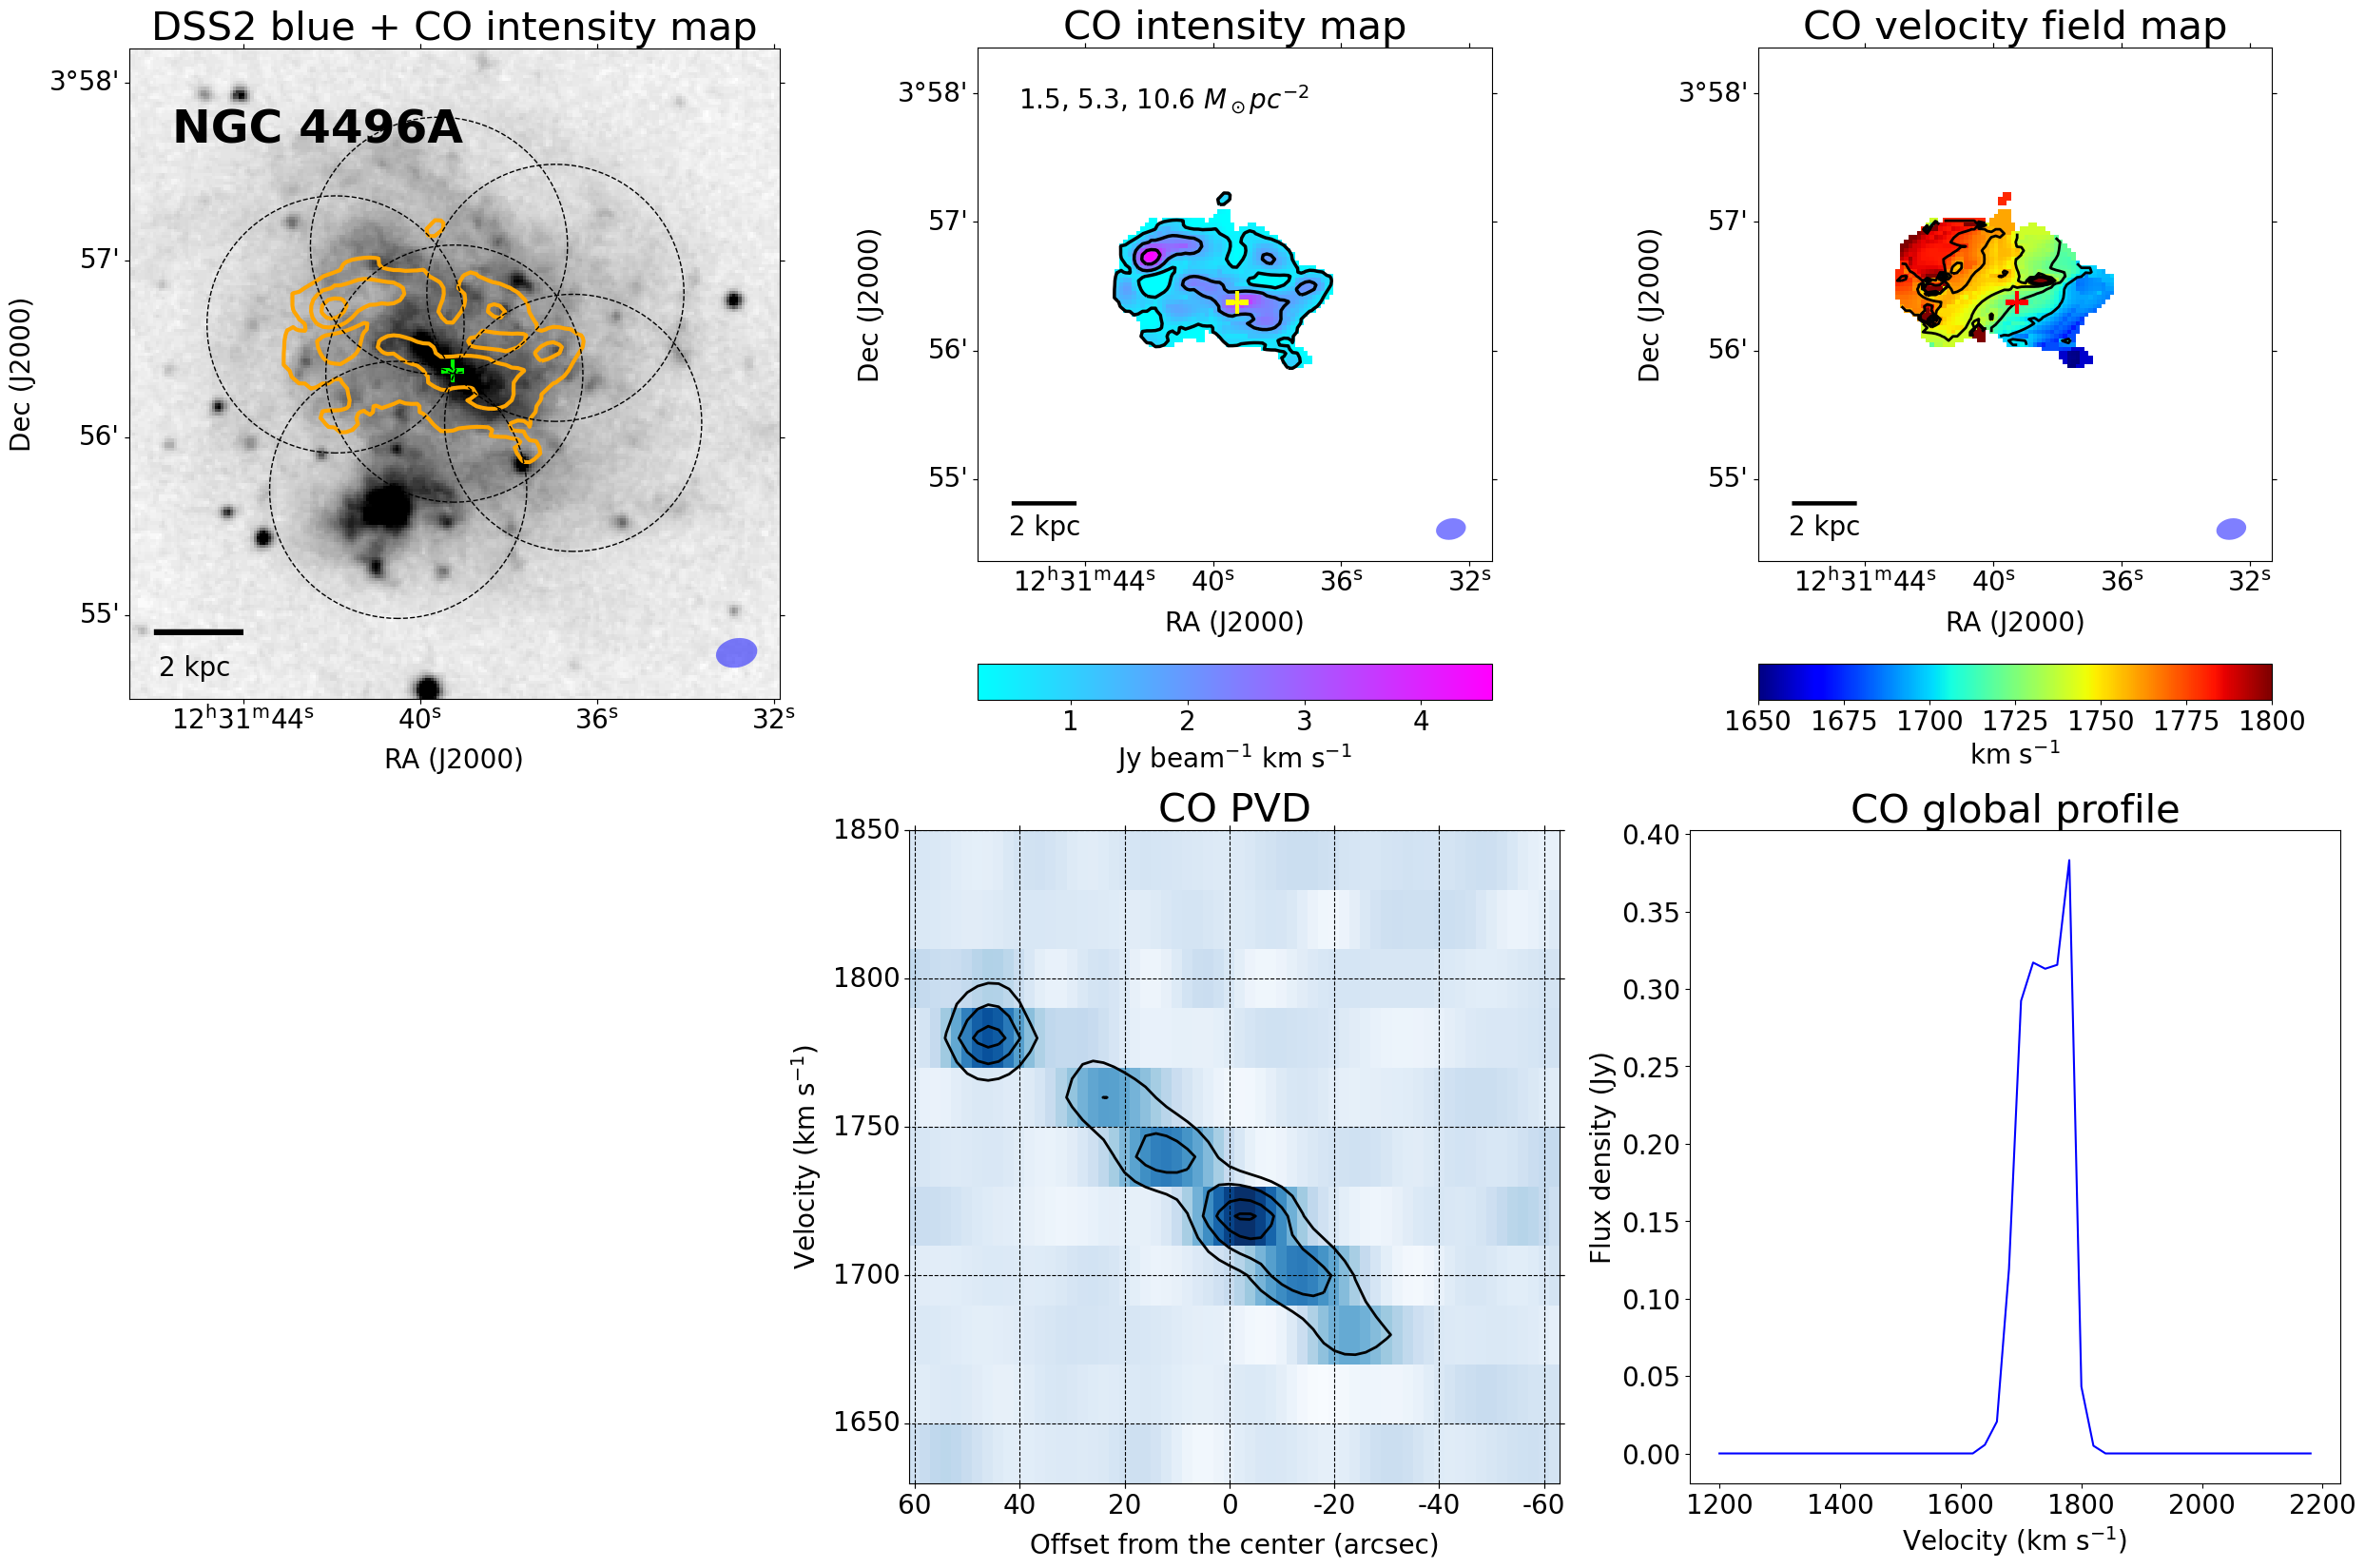
As seen in Figure 4, our ACA CO data do not show any CO emission in the central region of two galaxies (NGC 7421 in the I1459G and NGC 4772 in the N4636G), contrary to our other samples. Instead, NGC 7421 has a relatively strong CO emission in the southwest region of the optical image, with 50% of the total CO flux. In the case of NGC 4772, there are two discrete CO regions. In particular, the southeast region has 65% of the total CO flux. In addition to no CO emission in the central region, these two galaxies show a large offset between the CO peak position and the optical center (see Figure 15 and 23). The offset distances are 4.8 kpc in NGC 7421 and 2.1 kpc (NGC 4772), respectively. Interestingly, the CO peak of NGC 4496A is also found at the northeast edge of the CO disk (see Figure 16), and the distance between the peak position and the center is 3 kpc.
Bar- or ring-like structure and high surface density in the central region
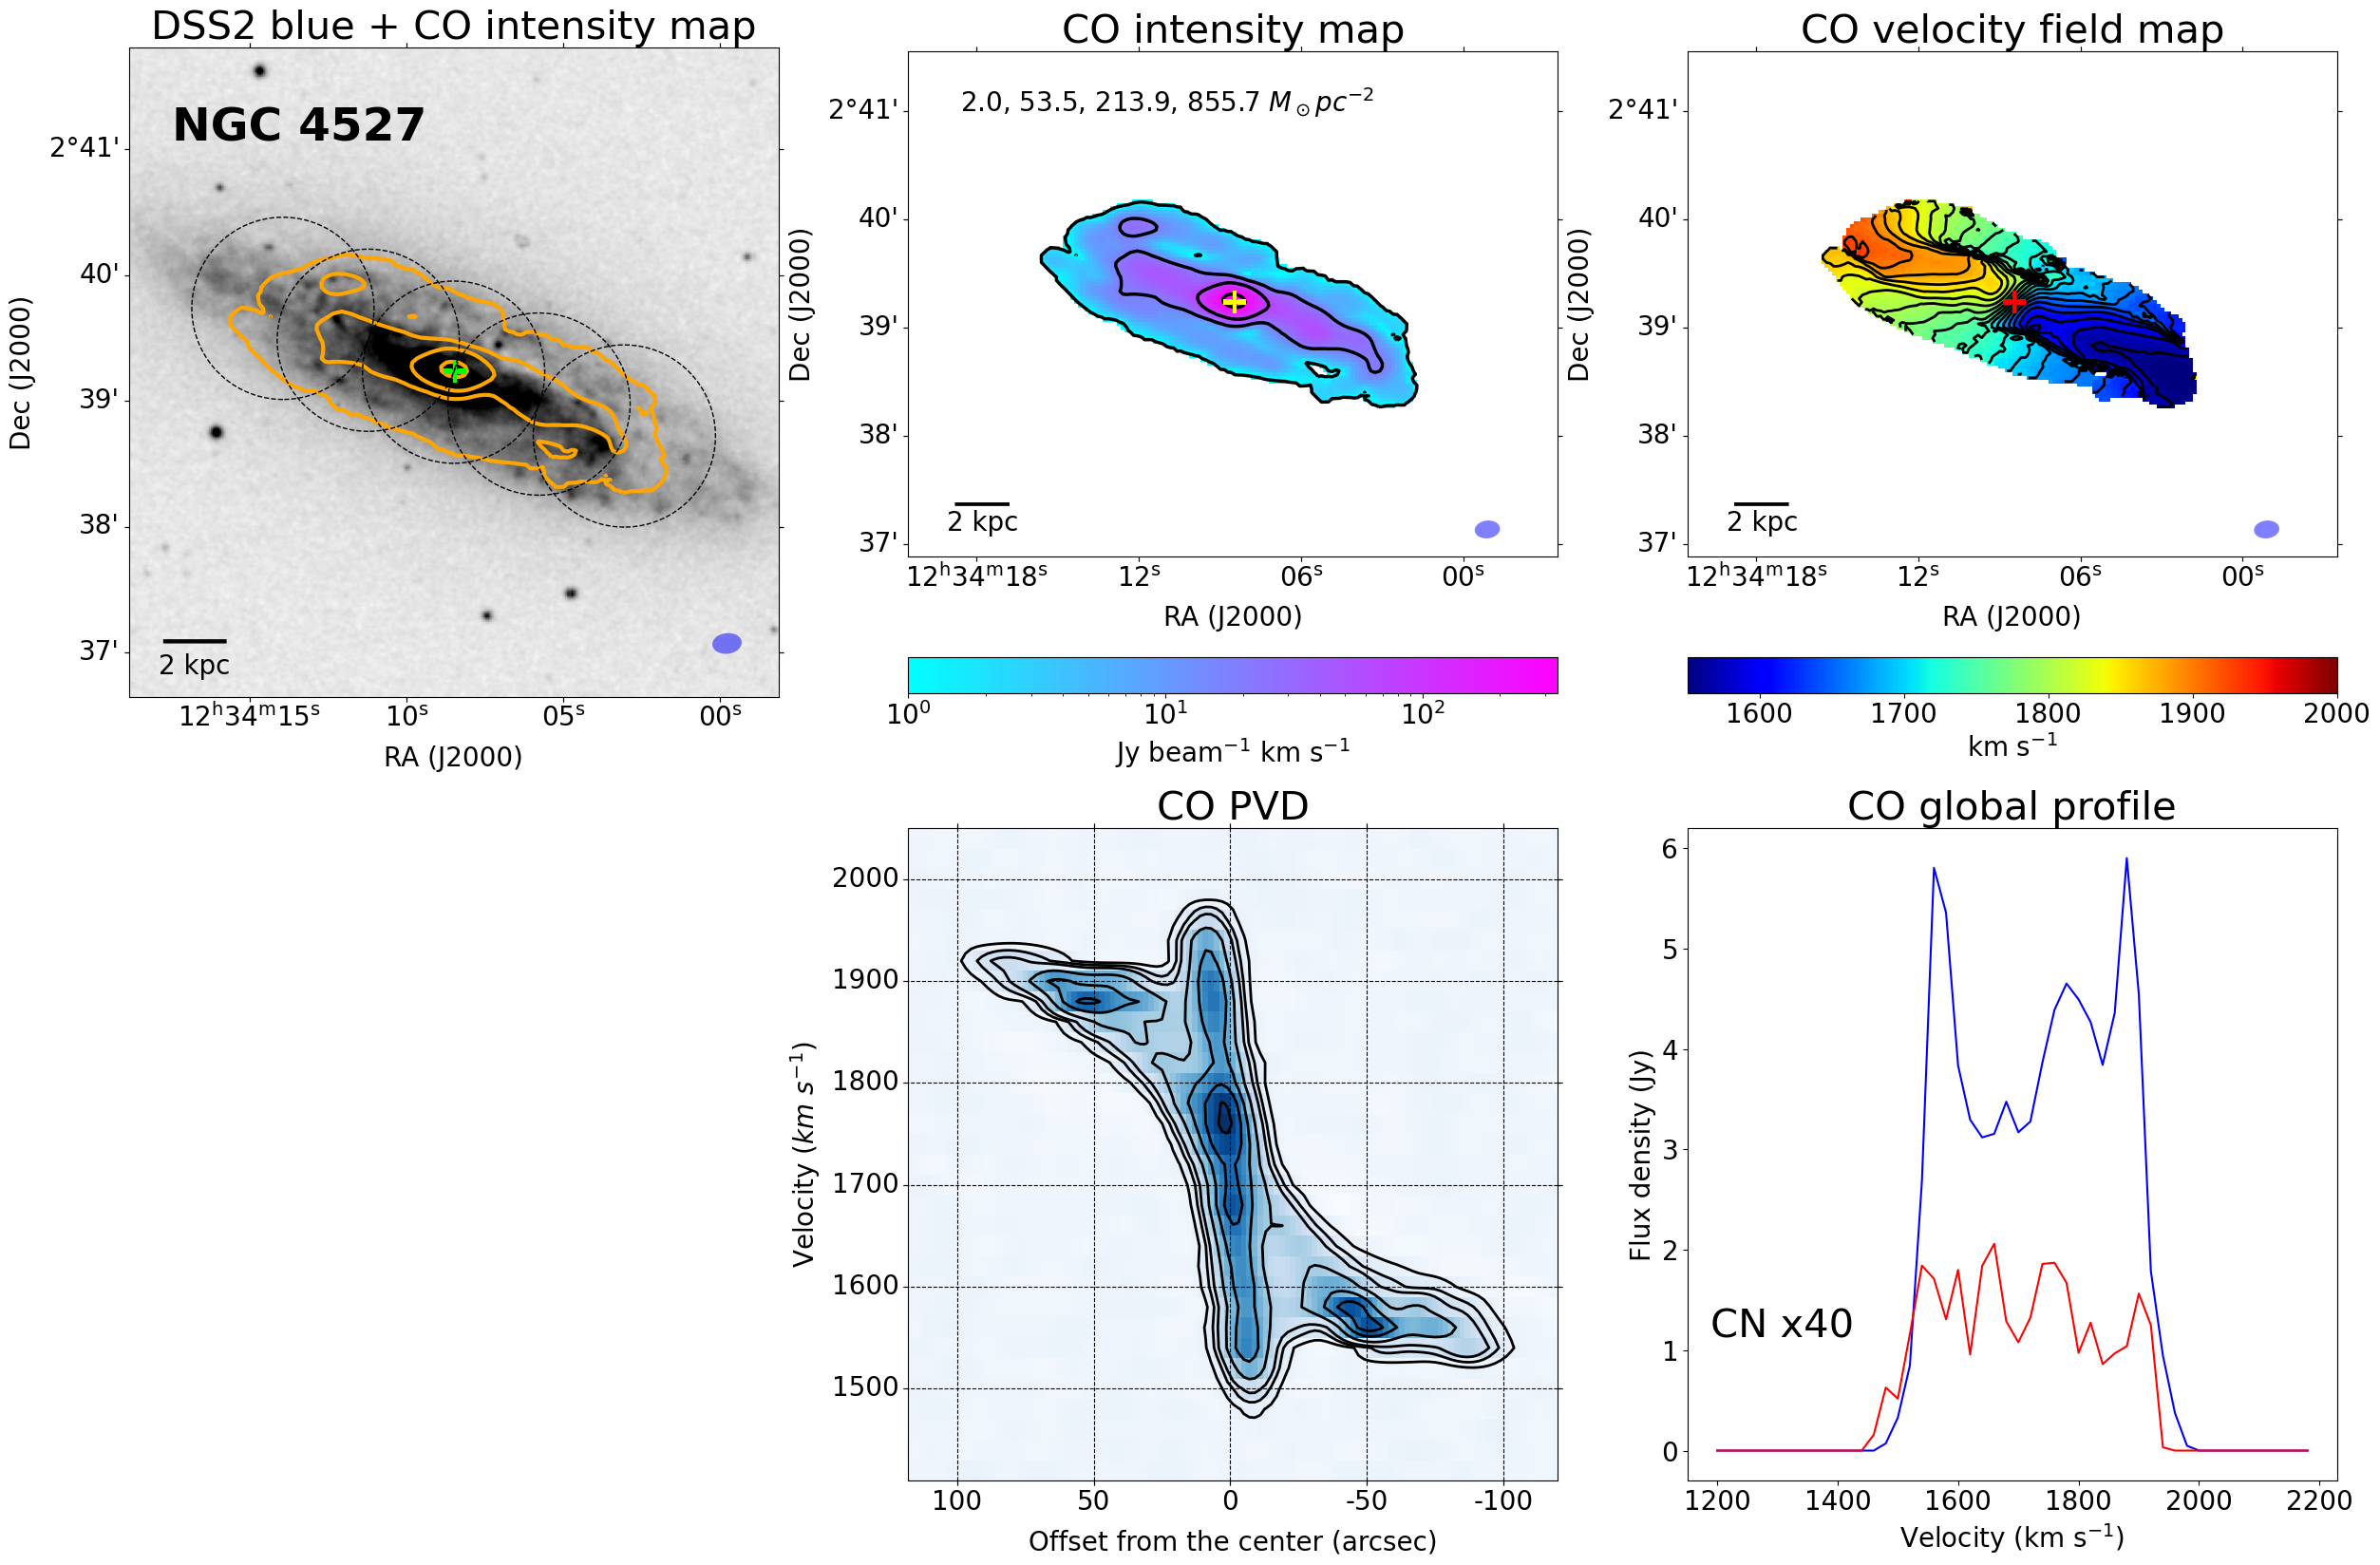
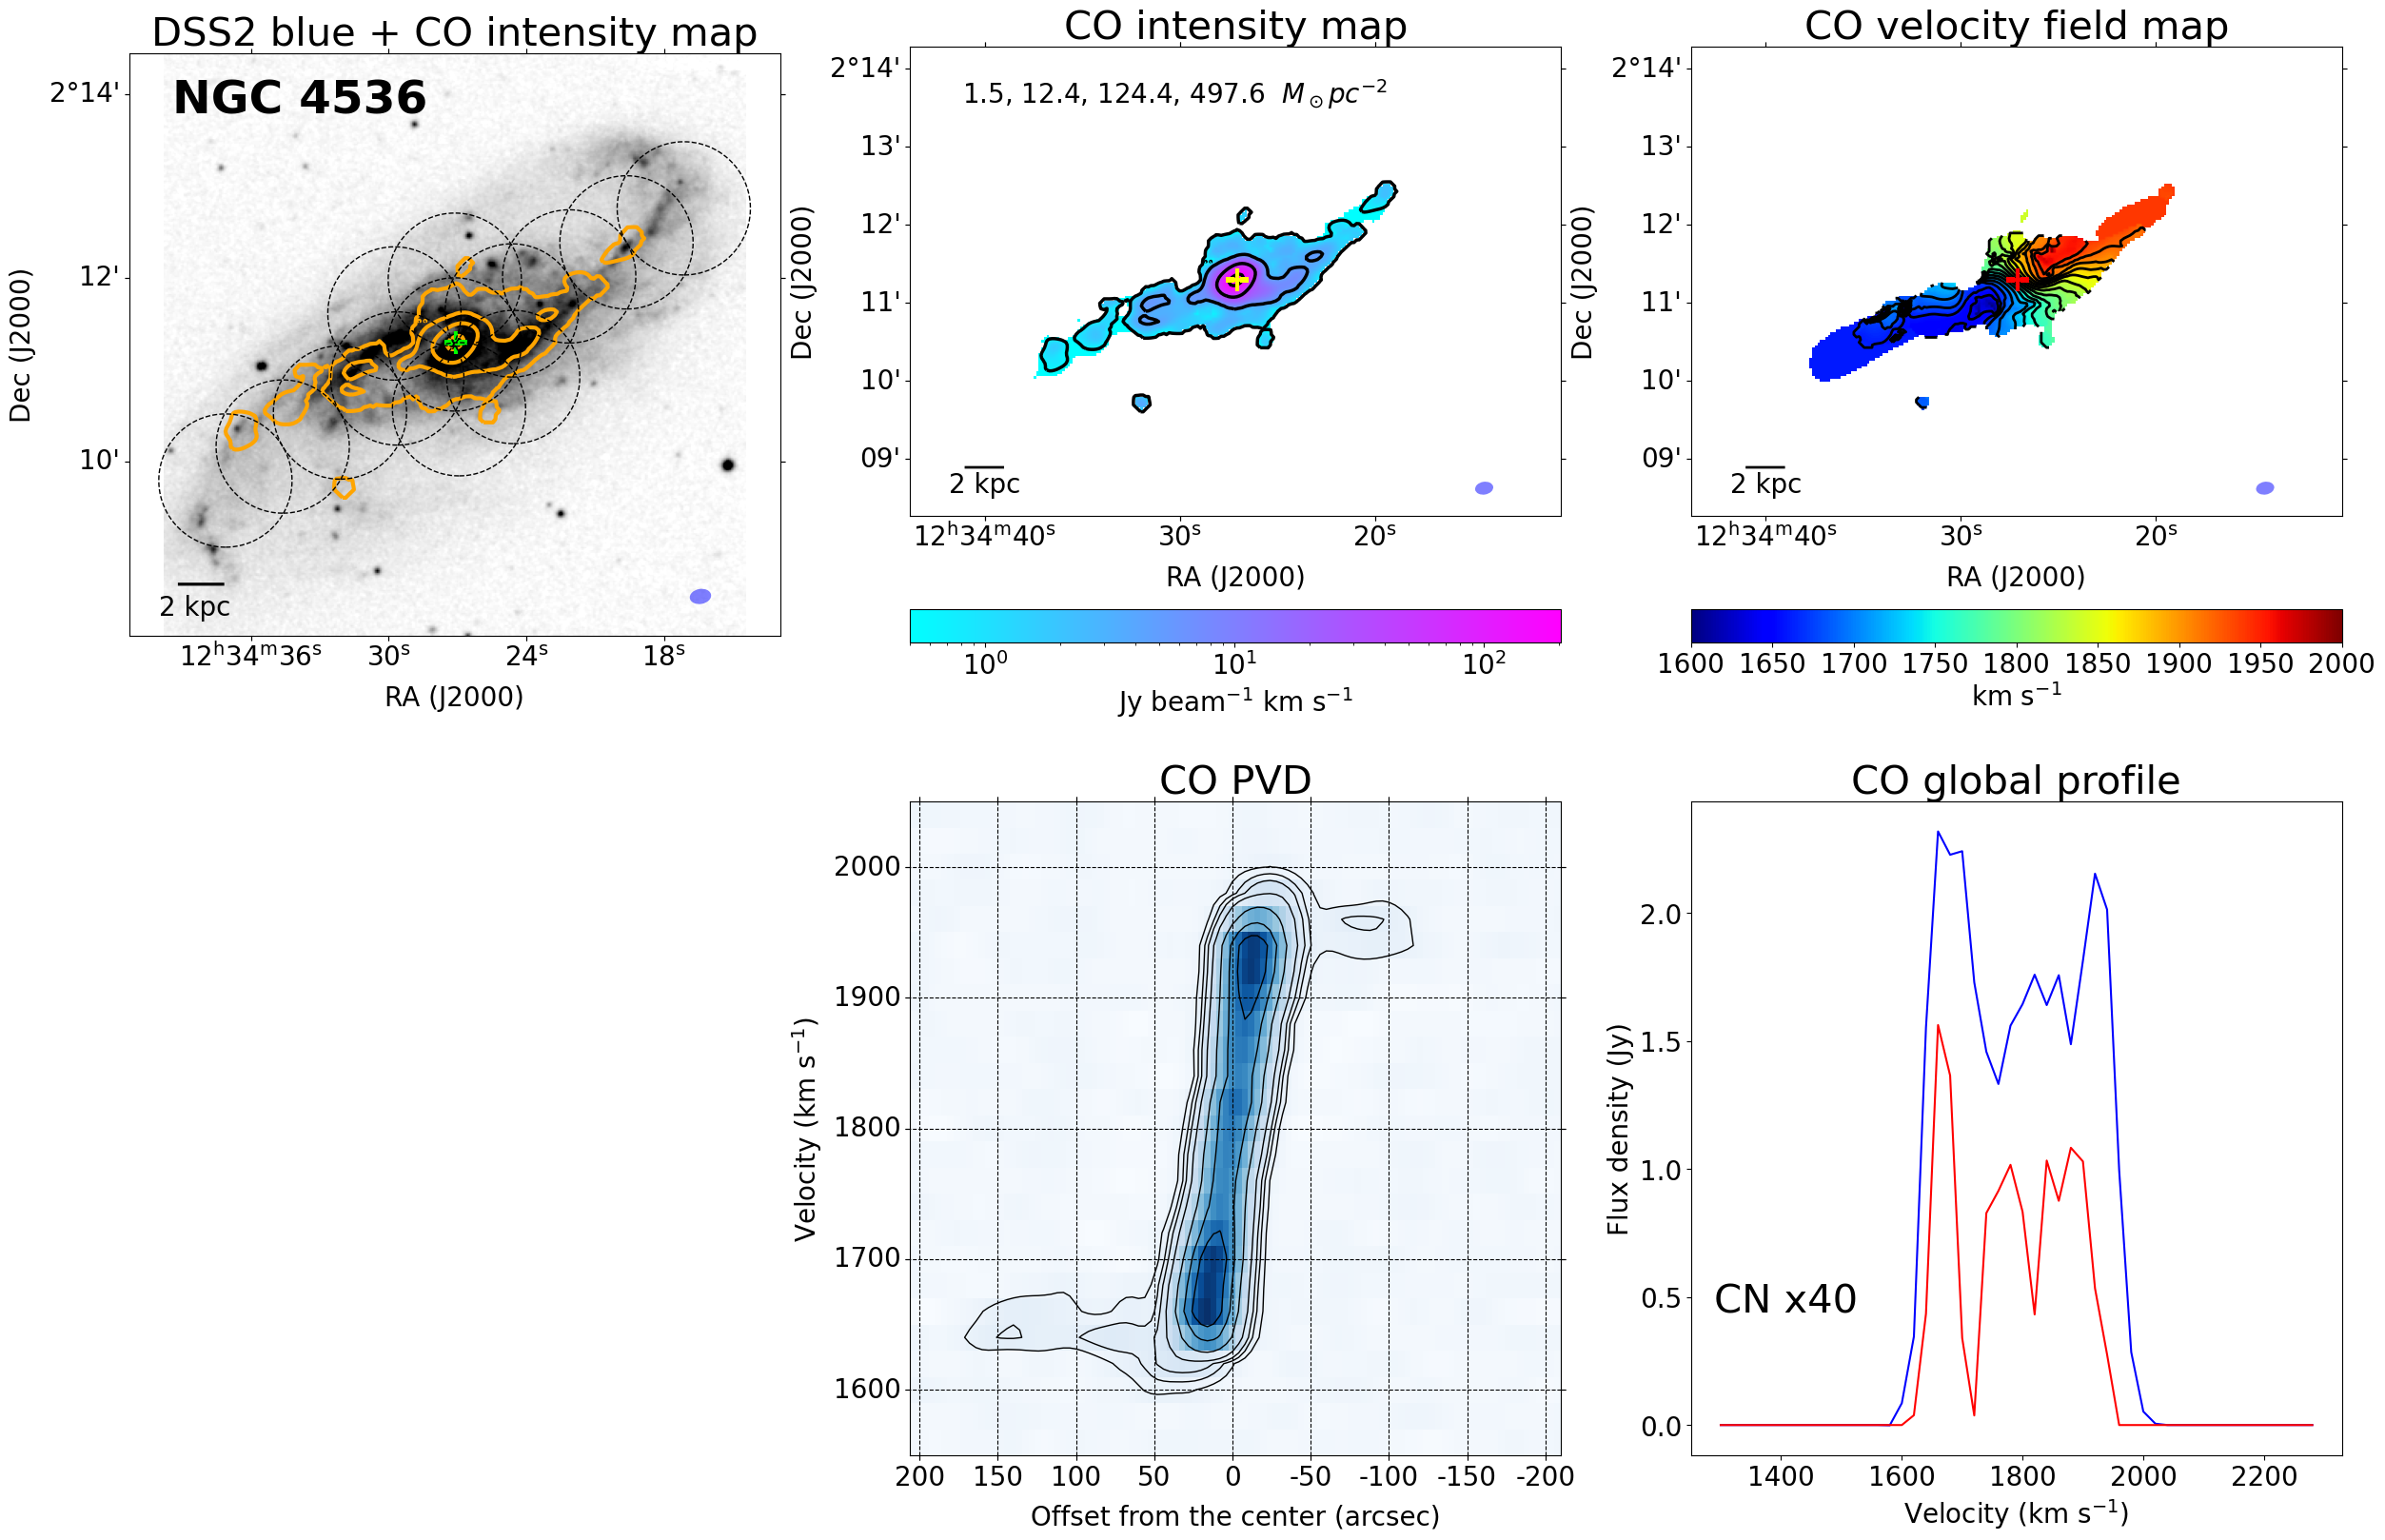
The CO PVDs of NGC 4527 and NGC 4536 in the N4636G clearly show a steep velocity gradient in the inner region (see Figure 18 and 19). This indicates a presence of a bar- or ring-like structure in the central region (e.g., Alatalo et al., 2013). The rapidly increasing velocity structures of these two galaxies are also seen in the central region of their velocity field maps (Figure 18 and 19). In addition to the presence of distinct CO structure in the central region, these two samples and NGC 4666 show relatively high molecular surface density (100 pc-2), compared to other member galaxies (Figure 4).
5 Discussion
Using the Hi and CO imaging data, we discuss how the group environments affect the distributions of cold ISM components of galaxies in Section 5.1. In Section 5.2, we present scaling relations of the global properties of our group sample, and compare them with the global properties in the xCOLD GASS sample. Finally, we discuss preprocessing in the group environment in Section 5.3. Note that although some of our targets are thought to be affected by various group environmental processes, we briefly discuss external mechanisms for individual group members in this study. Instead, distinguishing between various environmental processes for individual members is studied in more detail in a following work (e.g., Lin et al., 2023).
5.1 Hi and CO Distributions of Group Galaxies
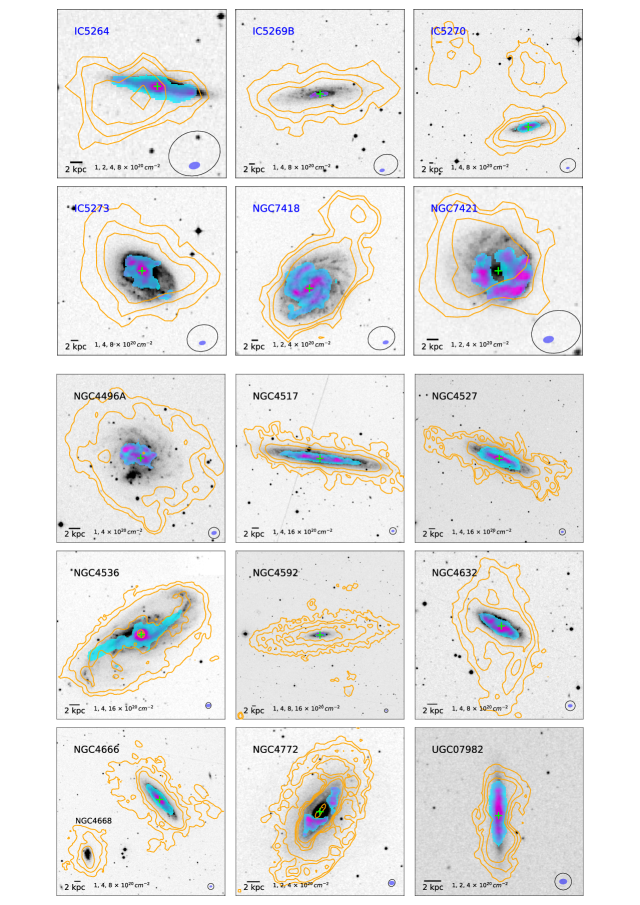
15 out of 16 group galaxies with CO detection in our ACA observations also have Hi imaging data (Chung et al., 2009; Serra et al., 2015a; Koribalski et al., 2020), and Figure 5 shows their Hi and CO distributions overlaid on their optical images (DSS2 blue).
Based on their Hi and CO distributions, we have classified the 15 group galaxies into three categories: (i) peculiar distributions in both Hi and CO (IC 5264, IC 5273, NGC 7418, NGC 7421, NGC 4632, NGC 4772), (ii) peculiar distribution in Hi (IC 5270, NGC 4666, UGC 07982), (iii) relatively symmetric distributions in both Hi and CO (IC 5269B, NGC 4527, NGC 4536, NGC 4592). Interesting features of group members are briefly summarized in Table 4.
5.1.1 Peculiar Distributions in Both CO and Hi
Asymmetric structure
Four galaxies (IC 5264, IC 5273, NGC 7418, NGC 7421) show asymmetric morphologies in both CO and Hi. In particular, their Hi distributions are extended toward one side. On the opposite side of the long Hi extensions, the HI disks are truncated near or within the stellar disk.
For IC 5264, as shown in Figure 5, the Hi gas is more extended toward the southeast. On the opposite side, the Hi disk is truncated within the stellar disk. This asymmetric Hi distribution is analogous to the CO distribution of IC 5264 as described in Section 4.3. Interestingly, a locally strong CO emission is found at the edge of the truncated Hi disk. In NGC 7421, the Hi disk is pushed away to the northeast. On the opposite side, there is a relatively strong CO emission with the CO peak (Figure 5). In the case of NGC 7418, while a long Hi tail is seen in the northwest, the Hi disk is compressed in the southeast. In particular, an extended CO emission is found at the site of Hi compression in NGC 7418 (Figure 5).
In these three galaxies, Hi compression at the truncated side of the Hi disk may lead to an increase of Hi gas density, which likely triggers an efficient transition from Hi gas to H2 gas (Chung & Kim, 2014; Lizée et al., 2021). Consequently, this conversion process is likely to result in the local enhancement of CO (IC 5264 and NGC 7421) and the extended CO structure (NGC 7418). In addition, external perturbations can directly compress CO gas. These phenomena are already known from previous studies of cluster galaxies (Chung & Kim, 2014; Lee et al., 2017; Lizée et al., 2021), but similar results are now found for our group galaxies. The morphological correlations and connections between two different ISM components suggest that group environmental processes can significantly affect both diffuse Hi gas and dense CO gas.
IC 5273 shows highly asymmetric Hi and CO morphologies, but there seems to be no similarity or no connection between the Hi distribution and the CO distribution, in contrast with the above three galaxies (IC 5264, NGC 7418, and NGC 7421). This suggests that this galaxy may be affected by the environment in a different way. In addition to asymmetric distributions of both Hi and CO, IC 5273, NGC 7418, NGC 7421 also show clearly a lopsided feature in their optical images, which suggests that these three galaxies are likely to be affected by tidal interactions.
Ring-like structure
NGC 4632 and NGC 4772 have large Hi outer ring structures, as shown in Figure 5. In particular, the position angle (PA) of Hi outer ring of NGC 4632 largely deviates from that of the inner Hi disk and the stellar disk. The PA of Hi outer ring of NGC 4772 is also slightly different from the inner Hi disk (Chung et al., 2009). The origin of Hi ring structures could be accretions, minor mergers, and tidal interactions with other galaxies (e.g., see Buta & Combes, 1996; Barnes, 1999; Bettoni et al., 2010, and references therein). Moreover, both NGC 4632 and NGC 4772 show irregular CO distributions in the inner Hi disks, as described in Section 4.3. The external perturbations seem to cause not only large Hi outer ring structures but also irregular CO distributions in these two galaxies.
5.1.2 Peculiar Distribution in Hi
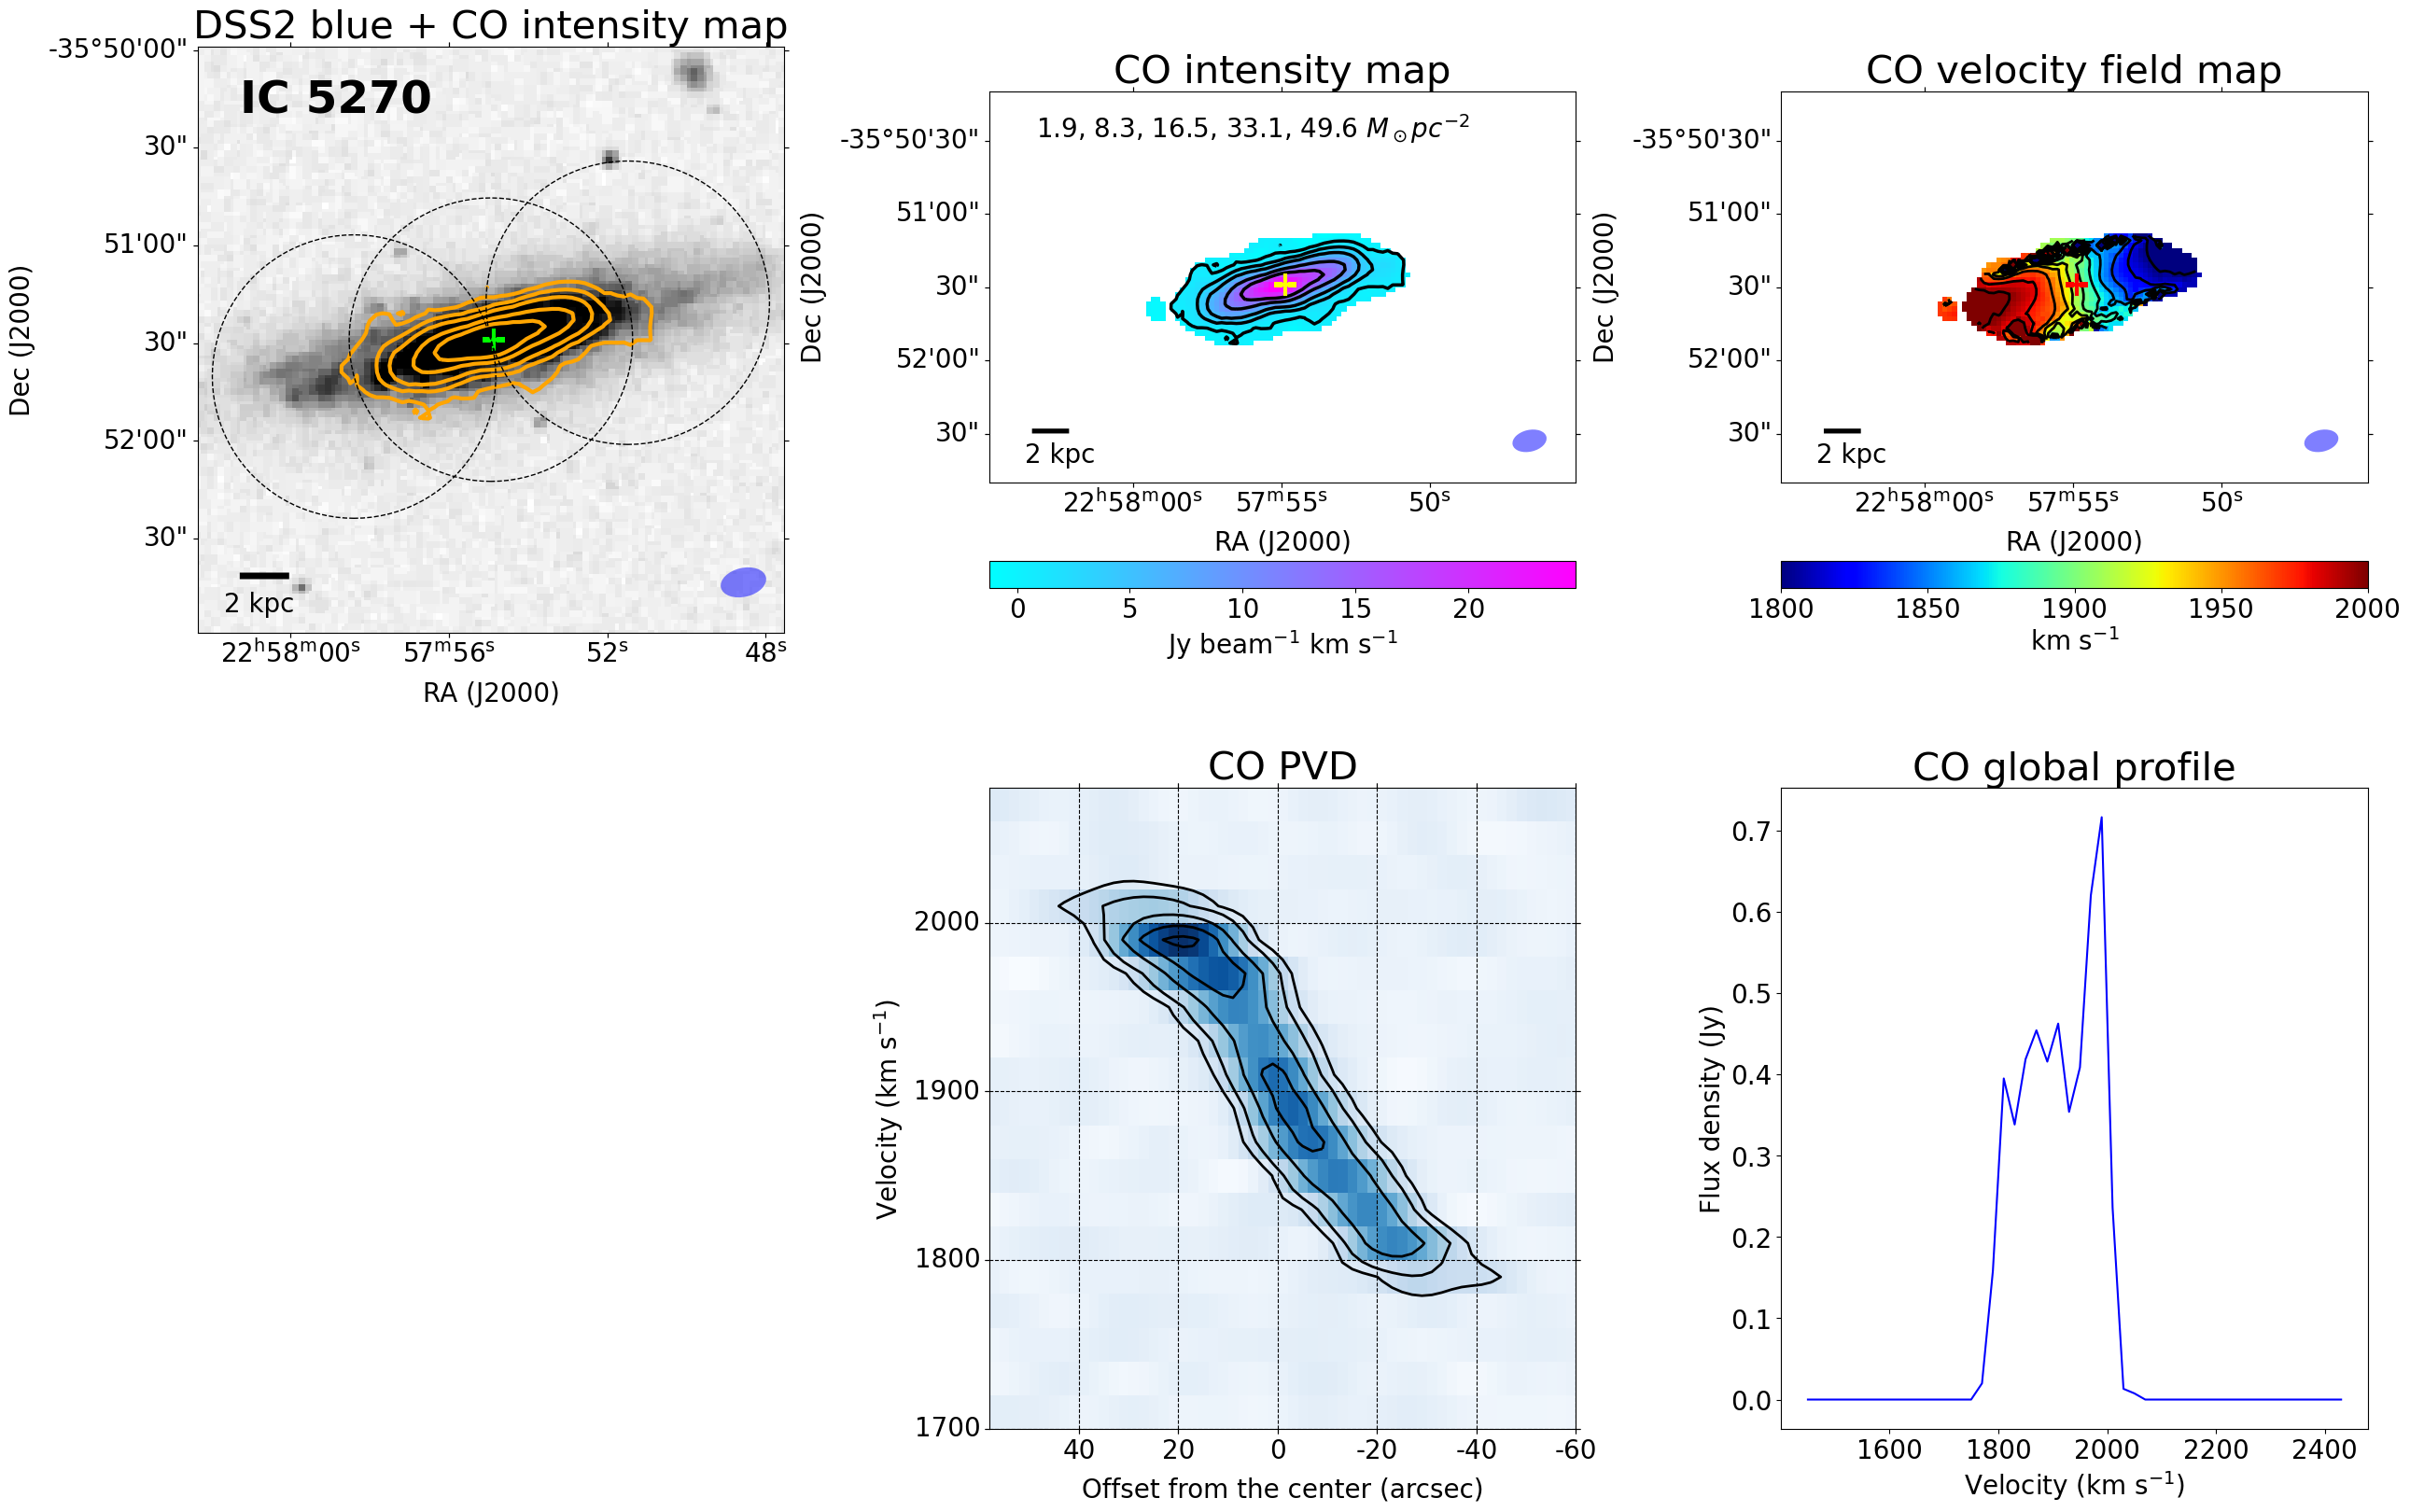
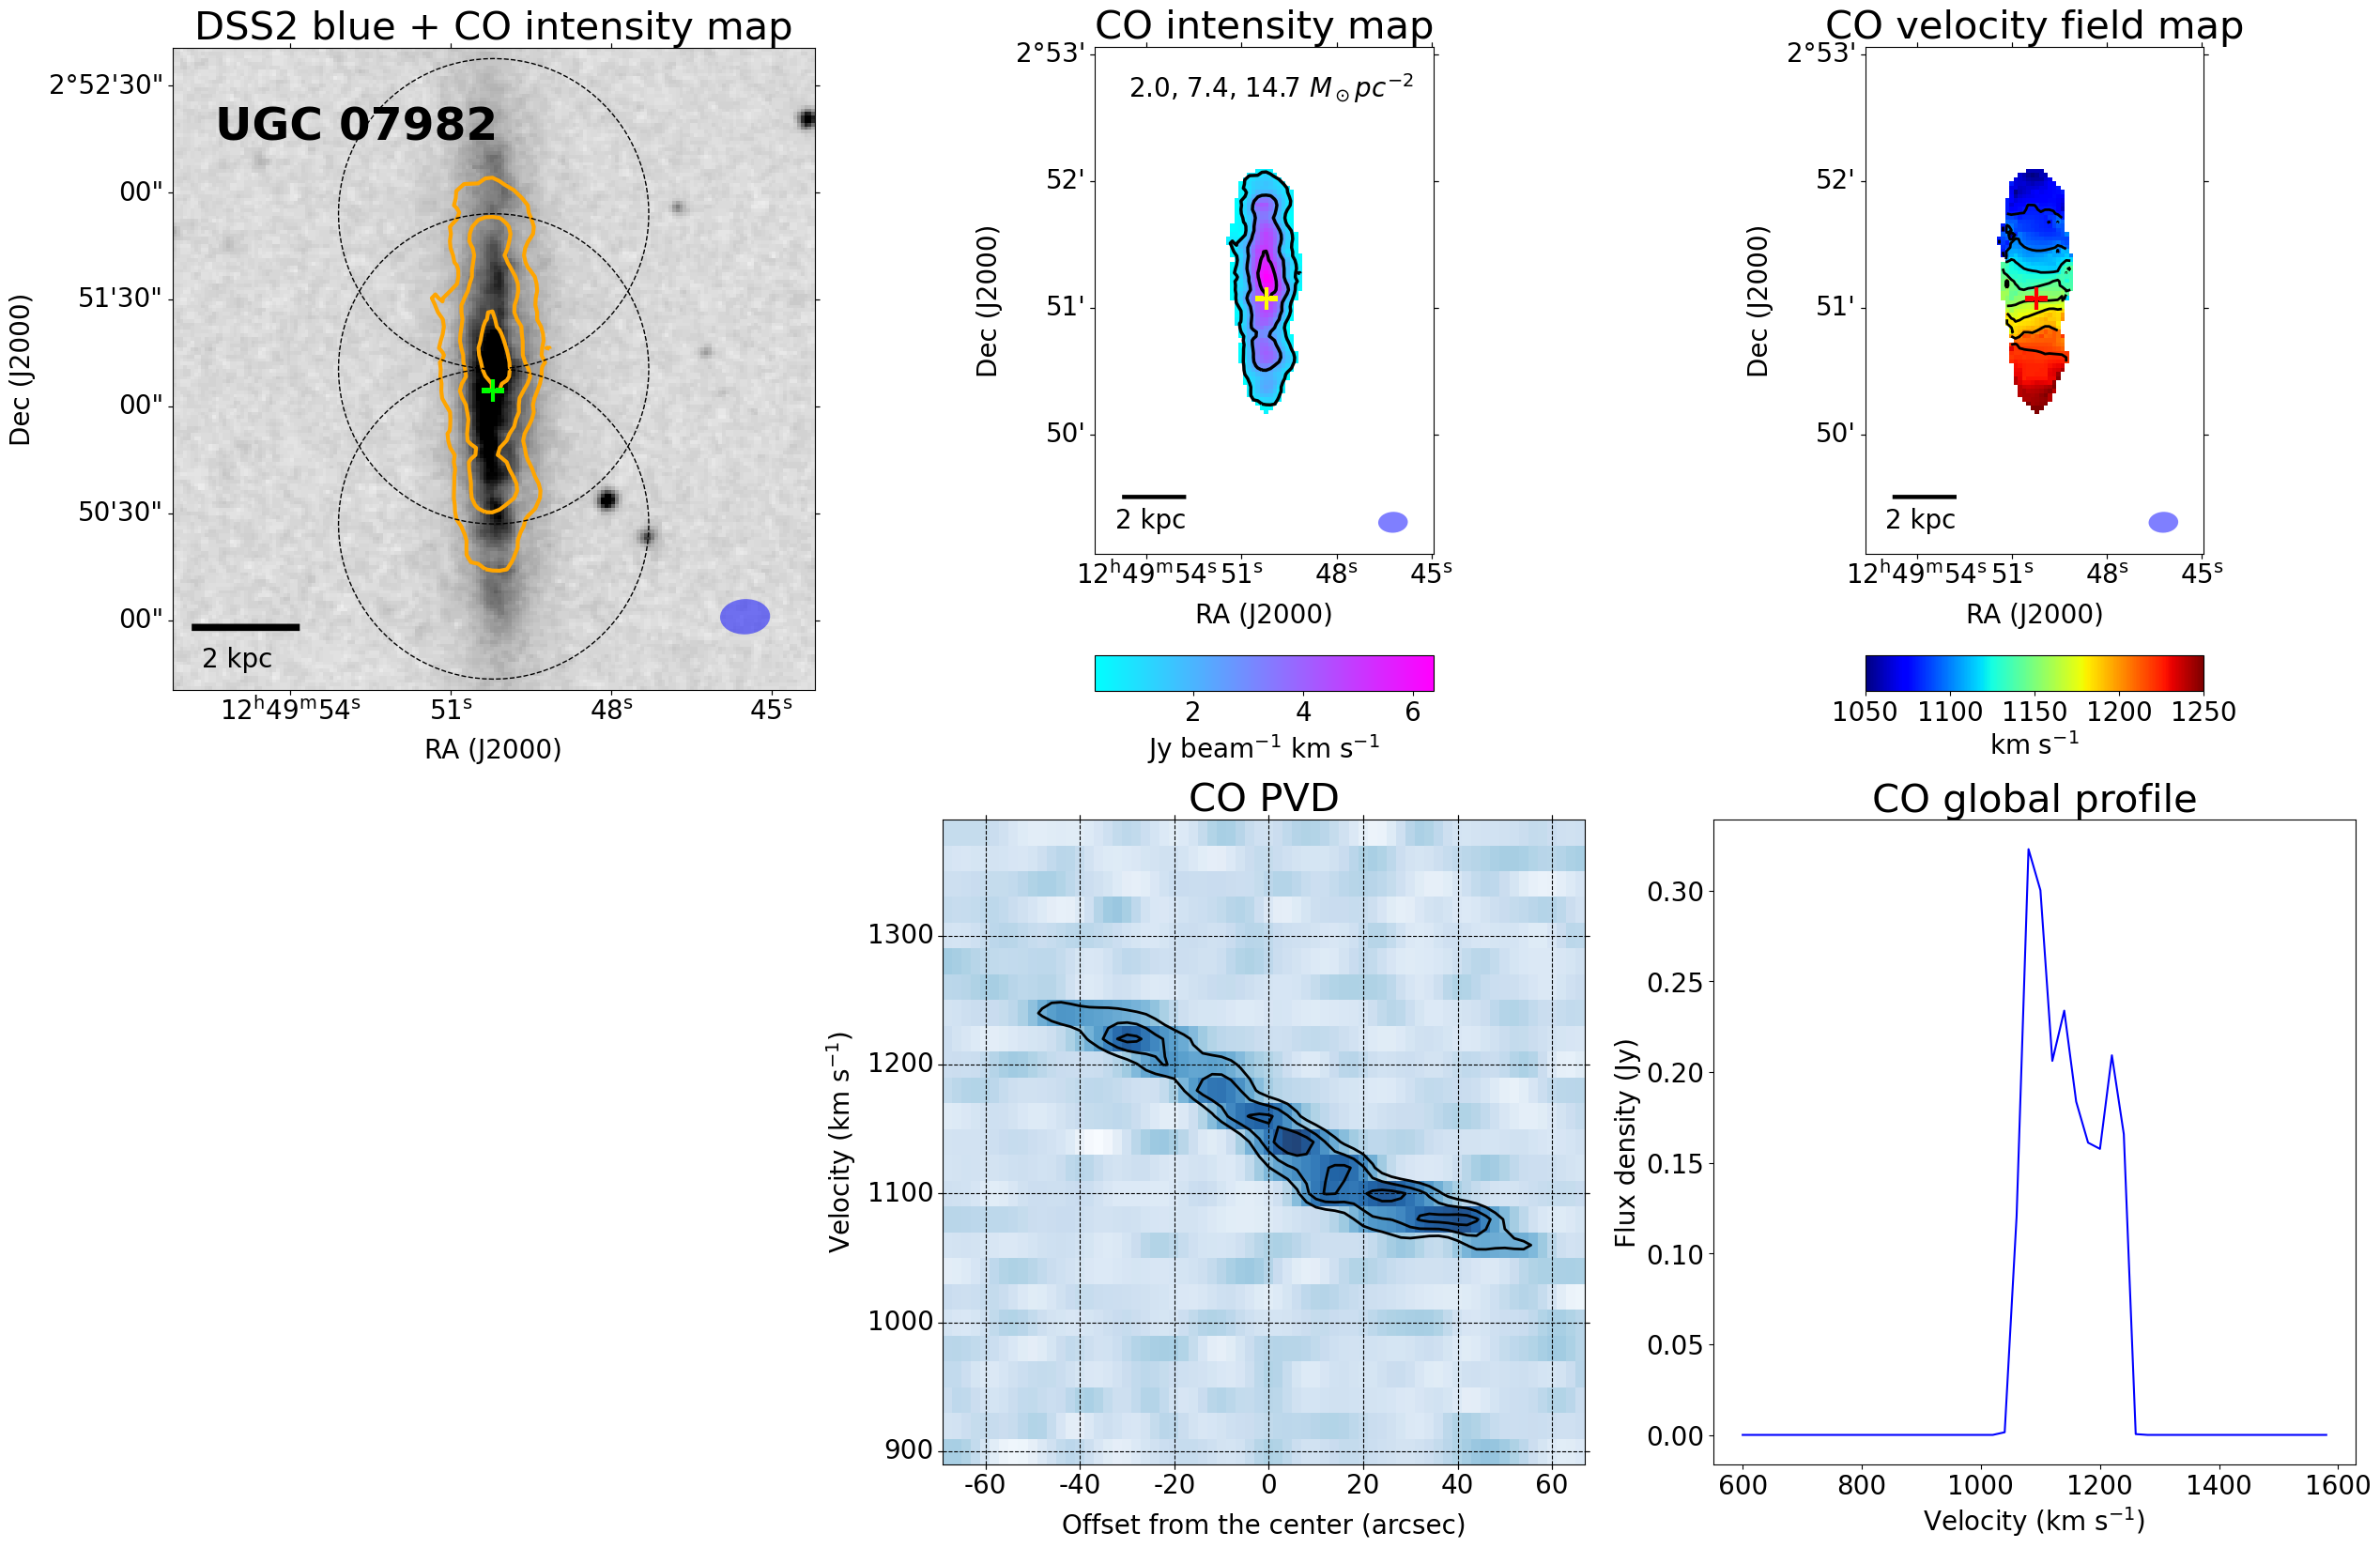
The Hi morphologies of three galaxies (IC 5270, NGC 4666, UGC 07982) appear to be asymmetric, but their CO distributions are smooth and undisturbed. Near the north of IC 5270, there are two Hi clouds, as seen in Figure 5. Although the Hi disk does not look asymmetric, these two Hi clouds are possibly stripped from IC 5270 (Serra et al., 2015a), which is suggestive of evidence for tidal interactions (Serra et al., 2015a). In NGC 4666, the outer part of Hi disk extends farther out toward its neighbor galaxy (NGC 4668), which indicates that the Hi morphology is strongly disturbed by the interaction with the neighboring galaxy (Figure 5). The direction of the Hi tail of NGC 4668 is also toward NGC 4666. The previous Hi observations with the VLA also show clear signs of interaction between NGC 4666 and NGC 4668 (see more details in Figure 5 of Walter et al. 2004). In UGC 07982, the northern part of the Hi disk is truncated within the stellar disk (Figure 5). In addition, the Hi gas is slightly extended toward the west side. However, the stellar disk of UGC 07982 looks undisturbed. This suggests that UGC 07982 is likely to be undergoing ram pressure stripping (RPS) in the N4636G. Indeed, this galaxy is identified as the RPS galaxy, based on an analysis of the ram pressure level against the restoring force in the disk for UGC 07982. Further details of the RPS for UGC 07982 and other galaxies in the N4636G are presented in Lin et al. (2023).
5.1.3 Symmetric/Smooth Distributions in Both Hi and CO
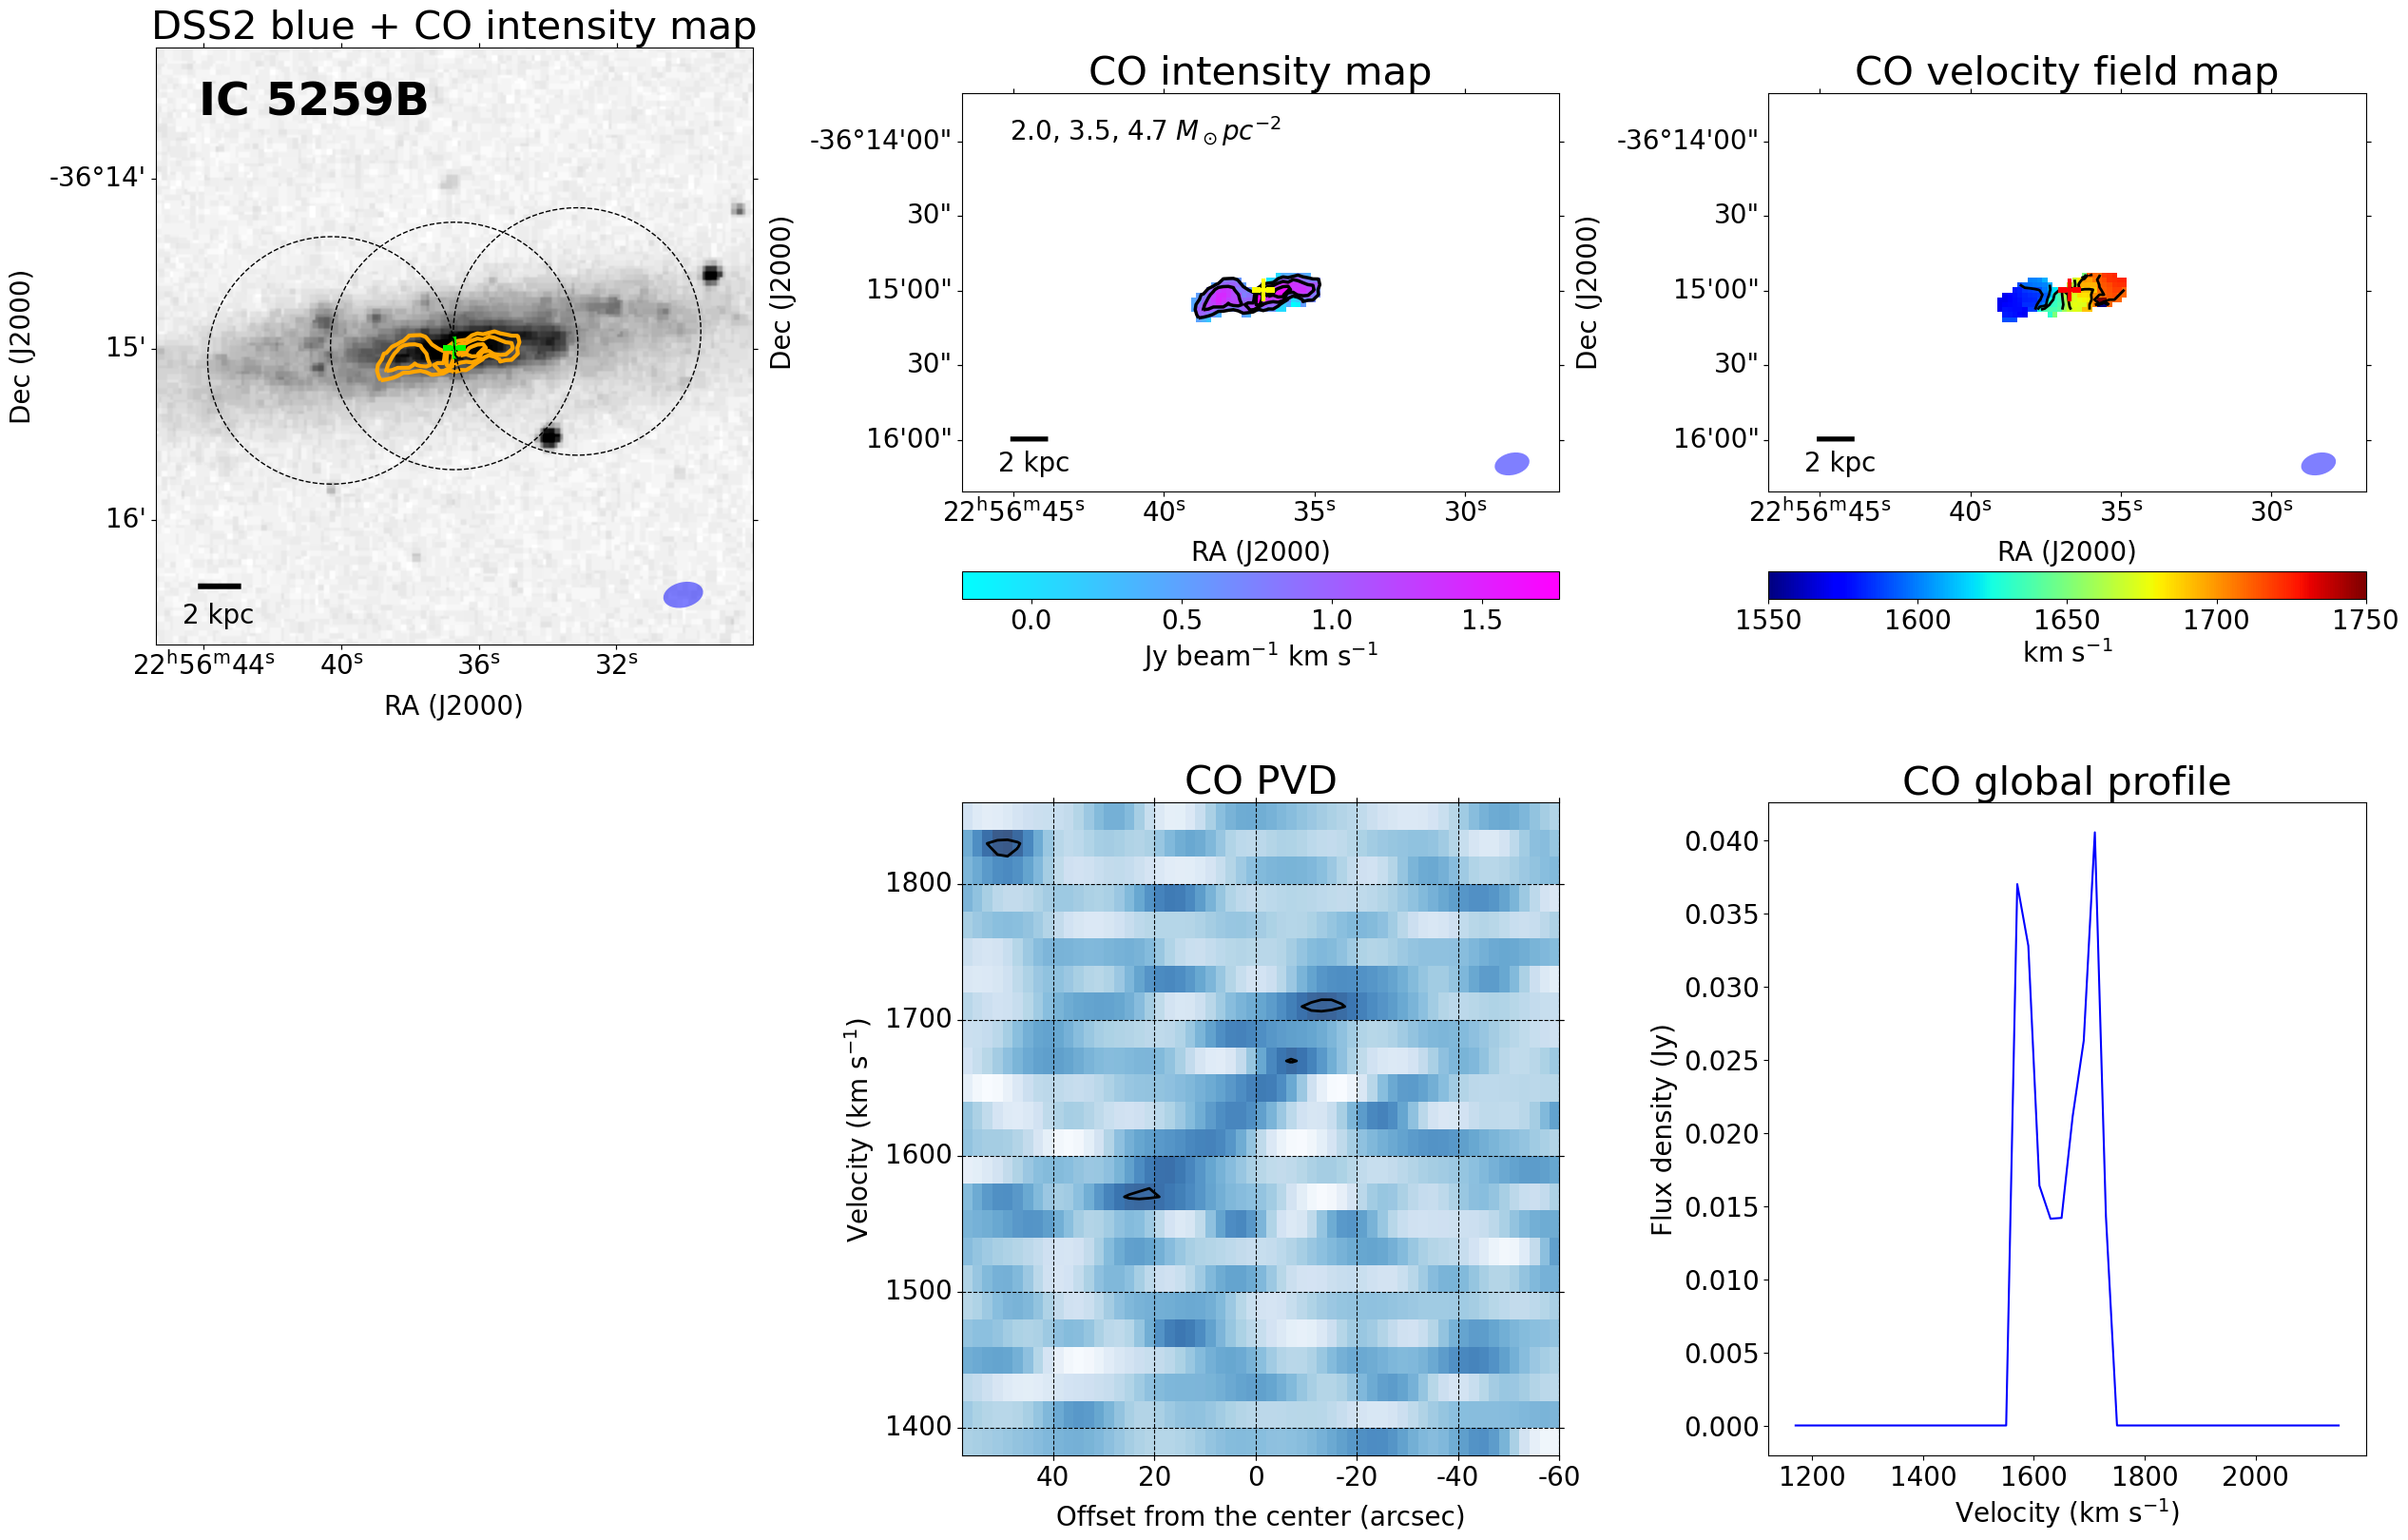
Four galaxies (IC 5269B, NGC 4527, NGC 4536, NGC 4592) show relatively symmetric/smooth distributions in both Hi and CO, compared to other group samples mentioned above. Although the CO distributions of some galaxies (e.g., IC 5269B and NGC 4592) appear to be somewhat clumpy due to the low S/N of the CO data, the Hi disks of four group samples are symmetric and smooth, indicating that there may be no external perturbations.
5.1.4 Asymmetry Parameter for the CO Intensity Map
In addition to probing peculiar gas distributions qualitatively, we also calculate the asymmetry parameter () using the CO intensity maps to estimate the degree of asymmetry quantitatively. The asymmetry of the CO image is calculated using the following equation (Conselice et al., 2000; Holwerda et al., 2011a; Giese et al., 2016):
| (5) |
where is the CO intensity map, and is the same CO intensity map rotated by 180° with respect to the center of the stellar disk. A high value indicates a high asymmetry of CO distribution. The CO asymmetry values for 16 galaxies are summarized in Table 4. Group members (IC 5264, IC 5273, NGC 7418, NGC 7421, NGC 4632, NGC 4772) showing asymmetric morphologies from both CO and Hi images tend to have higher asymmetry values, compared to other members. On average, the asymmetry value for these six galaxies is 0.46. On the other hand, the mean value for samples (NGC 4517, NGC 4527, NGC 4536) with no signs of interactions from both CO/Hi morphologies is 0.18, and galaxies (IC 5270, NGC 4666, UGC 07982) showing asymmetric morphology in only Hi have the mean value of 0.17. As previous studies with Hi images found higher asymmetry values from galaxies in a dense environment (Holwerda et al., 2011b; Reynolds et al., 2020), it is also expected that CO asymmetry values tend to be high in galaxies undergoing environmental processes (e.g., tidal interaction and RPS). Indeed, our results support the notion that high CO asymmetry values can be found in the group environment.
However, some (e.g., IC 5269B, NGC 4592) of our group members also tend to have high values of the CO asymmetry parameter although these galaxies are not likely to be affected by environmental processes, based on their symmetric Hi and optical morphologies. Instead, in these galaxies, clumpy CO structures due to low S/N of the CO data could result in high values in the CO asymmetry.
In this analysis for the CO asymmetry parameter, our results could be biased due to the small sample size (16 group members for the asymmetry analysis). Therefore, more group galaxies are required to obtain a statistically robust result.
| Name | CO Asymmetry Value | Peculiar Distribution | Notes |
|---|---|---|---|
| IC 1459 Group | |||
| IC 5264 | 0.30 | CO, Hi | asymmetric CO and Hi distributions |
| IC 5269B | 0.50 | low S/N in CO data | |
| IC 5270 | 0.10 | Hi | two Hi clouds near IC 5270 |
| IC 5273 | 0.38 | CO, Hi | CO clump (southwest) |
| NGC 7418 | 0.34 | CO, Hi | extended CO structure (southeast), Hi tail (northwest) |
| NGC 7421 | 0.68 | CO, Hi | strong local CO emission (southwest) |
| NGC 4636 Group | |||
| NGC 4496A | 0.49 | CO | off-center CO peak (northeast) |
| NGC 4517 | 0.20 | symmetric CO and Hi distributions | |
| NGC 4527 | 0.17 | symmetric CO and Hi distributions | |
| NGC 4536 | 0.16 | symmetric CO and Hi distributions | |
| NGC 4592 | 0.50 | clumpy CO distribution, low S/N in CO data | |
| NGC 4632 | 0.51 | CO, Hi | asymmetric CO distribution, Hi polar ring structure |
| NGC 4666 | 0.15 | Hi | asymmetric Hi distribution, close neighbor galaxy |
| NGC 4772 | 0.57 | CO, Hi | asymmetric CO distribution, Hi outer ring structure |
| UGC 07982 | 0.25 | Hi | asymmetric Hi distribution |
| UGC 08041 | 0.70 | CO | asymmetric CO distribution, low S/N in CO data, no Hi image |
Note. — (1) Galaxy name; (2) CO asymmetry value; (3) peculiar distributions of CO and/or Hi; (4) notes for CO and/or Hi distributions of group members.
5.2 Comparisons of Global Properties between Group Galaxies and xCOLD GASS Galaxies
In this section, we present scaling relations of global measurements (e.g., SFR, gas fraction, gas depletion time) in our group galaxies, and compare global properties of group galaxies with those of galaxies in a low-density environment. From the comparison, we can investigate how the group environment affects global properties of group galaxies. For this comparison, we use 240 isolated galaxies, which are selected based on the Sloan Digital Sky Survey (SDSS) DR7 group catalog of Yang et al. (2007), from the extended CO Legacy Database for GASS (xCOLD GASS; Saintonge et al. 2017) with Hi information from the extended GALEX Arecibo SDSS Survey (xGASS; Catinella et al. 2018). The sample of 240 local isolated galaxies (0.01 0.05 ) uniformly covering the stellar mass range (9 log (/) 11.5) were observed deeply in both Hi and CO, which can provide a reference for various scaling relations in local isolated galaxies. Hereafter, we refer to the sample of 240 galaxies as the xCOLD GASS sample. Note that we rescaled the measurements of stellar masses and SFRs of our group sample by dividing by 1.06 (e.g., Salim et al., 2007; Zahid et al., 2012), to compare our group sample with the xCOLD GASS sample under the same Chabrier IMF condition (Chabrier, 2003).
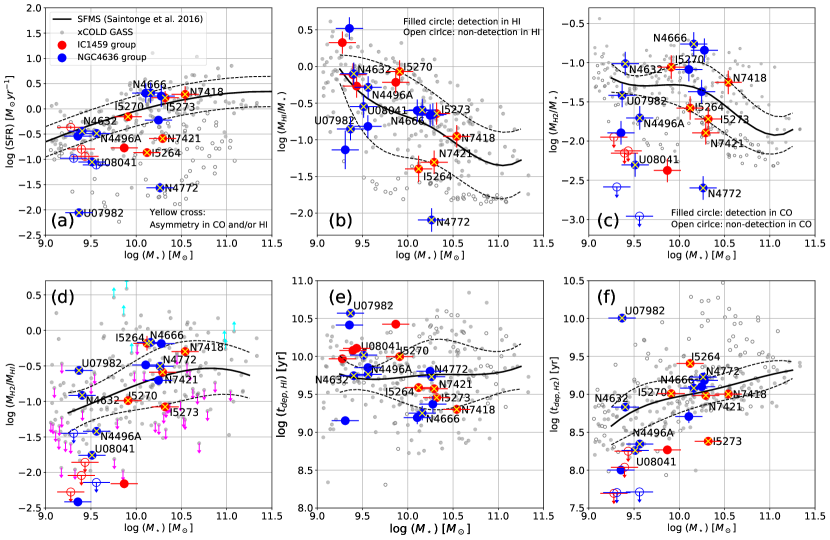
Figure 6 shows (a) SFR, (b) Hi gas fraction (), (c) H2 gas fraction (), (d) the ratio of H2 gas to Hi gas (), (e) Hi gas depletion time (), (f) H2 gas depletion time () as a function of the stellar mass () of galaxies. In Figure 6, we use the metallicity-dependent CO conversion factor to calculate the H2 gas masses of the group sample and the xCOLD GASS sample. The red and blue filled circles indicate our group galaxies that have CO detection, in the I1495G and the N4636G, respectively. The group samples with non-detection in CO are shown as open circles. Note that in the following analysis of scaling relations, we limited our group sample objects with a stellar mass of log (/) 9 because all samples with CO detections have stellar masses of log (/) 9. The xCOLD GASS galaxies are shown in the gray filled circles (Hi or CO detections) and gray open circles (nondetections in CO (Figure 6 (a), (c), (f)) or nondetection in Hi (Figure 6 (b), (e))), respectively. Note that fractions that we calculated in the following scaling relations also include nondetection cases.
Star formation activity
First, Figure 6 (a) shows the distribution of SFRs of the group sample and the xCOLD GASS sample as a function of the stellar mass of the galaxies. A solid line indicates the star-forming main sequence (SFMS) determined by Saintonge et al. (2016), and dashed lines are the 0.3 dex scatter (Speagle et al., 2014). Galaxies lying below the solid line are less star-forming (i.e., relatively suppressed in star formation) than the galaxies lying above and on the line. Galaxies lying below the lower dashed line tend to leave the star-forming main sequence and get quenched in star formation. In Figure 6 (a), we can see that our group samples cover both star-forming galaxies (48%) and quenched galaxies (48%). The ratio of star-forming galaxies in our group sample is consistent with that (50%) in the xCOLD GASS sample. On the other hand, the fraction of quenched galaxies in our group sample is slightly higher than that (39%) in the xCOLD GASS sample. Interestingly, eight out of 12 low-mass (log (/) 10) group members have suppressed SFR with respect to the main sequence.
In the following, using scaling relations (median values (solid lines) and standard deviations (dashed lines), see Figure 6 (b)(f)), we compare global physical properties (e.g., gas fraction, gas depletion time) of our group galaxies to the isolated galaxies from the xCOLD GASS sample, in order to obtain clues why and how the galaxies get affected in the group environment. The different behavior of the low-mass galaxies also motivates us to investigate the low- and high-mass galaxies separately.
Hi gas and H2 gas fractions
Figure 6 (b) and (c) show the Hi gas fraction and the H2 gas fraction, respectively. By using the median trends (solid lines) of the Hi gas and the H2 gas fractions for isolated galaxies, with their 1 standard deviations (dashed lines), this figure shows that Hi (H2)-deficient galaxies are below the lower dashed line, while normal galaxies are above that line. Hi (H2)-rich galaxies are above the upper dashed line. We also compare the distribution of Hi and H2 fractions of group samples with respect to the median trend as a function of stellar mass to identify potential systematic shifts.
In Figure 6 (b), the group galaxies follow a similar distribution as the whole xCOLD GASS sample above and below the median relation of Hi mass fraction as a function of stellar mass. There are 17 group galaxies with normal or high Hi gas fraction (81%), while 4 group galaxies (19%) are below the -1 scatter, indicating Hi-deficient galaxies. In the xCOLD GASS sample (9.25 log (/) 11.25), the fractions of Hi-rich or normal, and Hi-deficient galaxies are 77% and 23%, respectively. We do not find that overall, the galaxies in our group sample are deficient in Hi gas, compared to the xCOLD GASS sample, even though previous Hi studies for group galaxies (e.g., Hess & Wilcots, 2013; Brown et al., 2017) found evidence that group galaxies tend to be deficient in the Hi gas. This result is likely at least partly due to our sample selection of GEMS-Hi detected galaxies from the very beginning. Thus our results may be slightly biased toward the relatively Hi-rich systems. Nevertheless, Hi-deficient group members (e.g., IC 5264, NGC 4772, UGC 07982) tend to show highly asymmetric Hi morphology, implying that the Hi gas removal occurs due to the group environmental processes.
In Figure 6 (c), we find a high fraction (57%) of H2-deficient galaxies in our group sample in comparison with the fraction (26%) of H2-deficient galaxies in the xCOLD GASS sample (9.25 log (/) 11.25). This result suggests that group members can be deficient in the H2 gas content. On the other hand, Martinez-Badenes et al. (2012) showed that there is an excess of the H2 gas content in compact group galaxies, compared to isolated galaxies. Interestingly, most of the low-mass members (log (/) 10), including the nondetections) in our group sample show a significant deficiency in H2 gas (below the dashed line). Given that our sample is already biased toward the Hi-rich galaxies, such a deficiency in H2 gas is striking.
The ratio of H2 gas to Hi gas and Hi/H2 depletion times
For the ratio of H2 gas to Hi gas (), as shown in Figure 6 (d), the high-mass galaxies (log (/) 10) of our group sample are in line with the trend of the xCOLD GASS sample. However, the ratios of H2 gas to Hi gas in the low-mass galaxies (log (/) 10), including the nondetections of our group sample tend to be lower than the median trend of star-forming galaxies. A similar trend is found in the H2 gas depletion time that shows, on average, a shorter depletion time of H2 gas for the low-mass galaxies when compared to the star-forming galaxies of the same stellar mass (Figure 6 (f)). As a result, this subset of the low-mass galaxies shows systematically longer (except for one outlier) depletion time for the Hi gas than the median value of the same stellar mass (Figure 6 (e)).
A constant CO-to-H2 conversion factor
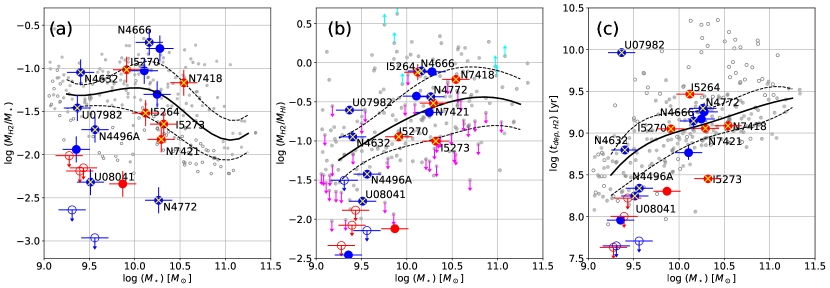
We also calculate the H2 gas fraction, the ratio of H2 to Hi, and H2 gas depletion time, using the constant CO-to-H2 conversion factor ( = 4.35 pc-2 (K km s-1)-1), to investigate whether these quantities significantly changes with the constant CO-to-H2 conversion factor, compared to the results with the metallicity-dependent CO-to-H2 conversion factor. As seen in Figure 7, there are no significant differences in the scaling relations between these two different conversion factors. This indicates our conclusions are insensitive to the CO-to-H2 conversion factor in a given stellar mass range.
The missing flux problem
For two galaxies (NGC 4517 and NGC 4527) whose total fluxes are significantly missed in our ACA observations (the flux ratio between our ACA data and the single-dish data: 0.5 (NGC 4517) and 0.7 (NGC 4527), see also Section 4.2), we examine again the scaling relations using their total fluxes from the single-dish data, in order to test whether the missing flux issue in our ACA observations severely affects our results. Based on the results with the single-dish data, the missing flux issue of these two members, which belong to the high-mass subsample, does not change our conclusion in the analysis of scaling relations.
Considering (1) the most typical extent of the CO disk (i.e., 50% 70% of the optical disk) in late-type galaxies (Schruba et al., 2011) and (2) the fact that the low-mass galaxies tend to have a smaller size of the stellar disk (Fernández Lorenzo et al., 2013), the low-mass group members are expected to have smaller CO disks than the high-mass group galaxies. Consequently, we may miss relatively small portions of total CO fluxes of the low-mass group sample in our ACA observations (see also Appendix D of Leroy et al. (2021) for a detailed description of the missing flux as a function of CO disk size), compared to the high-mass group sample. Therefore, the deficiency of H2 gas in the low-mass group members is unlikely due to the missing flux problem. As a result, although we may miss some CO fluxes from our group targets, we expect that this missing flux problem is not likely to change our conclusions.
However, we cannot completely rule out the possibility of the missing flux problem can affecting our conclusions because we do not have accurate measurements of total CO fluxes in most group samples.
5.2.1 Group Environmental Effects on Low- and High-mass Group Members
For the high-mass galaxies, their distribution of all the quantities discussed above (if ignoring the marginally lower H2 mass fraction) tend to be close to that of the xCOLD GASS sample. For the low-mass galaxies the majority of which have a suppressed SFR, a short H2 depletion time, and a long Hi gas depletion time, the bottleneck in the baryonic flow from the Hi gas to the stars seems to be mostly at the conversion from Hi to H2. We note that the missing flux problem from the observations with the interferometry is unlikely to explain the systematic differences that we observe here, as the average fraction of the missing flux is only 10% and the problem should not be so serious for these small low-mass galaxies. It is known that the transition of Hi to H2 is not efficient in low-mass galaxies as the pressure and metallicities are both lower (Leroy et al., 2005; Krumholz et al., 2009; Bolatto et al., 2011). However, this effect does not explain the systematic difference that we observe either, as we are comparing with the median behavior of galaxies with the same stellar mass.
One of the possible scenarios is that for these low-mass galaxies, which are more sensitive to the environmental effects due to their relatively shallow gravitational potential, the Hi gas is highly perturbed and becomes stable against gravitational collapse (i.e., a high value in the Toomre Q parameter). The systematically low ratio of H2 to Hi in these low-mass galaxies was not fully expected, as environmental effects could have enhanced such a conversion, when the ram pressure assists the gas to reach high densities (e.g., Mok et al., 2017), or when the tidal effects induce shocks and condense the cold gas (e.g., Lizée et al., 2021). It is therefore meaningful to find that in these low-mass galaxies, the actual situation is that the conversion of Hi to H2 seems to be suppressed. It is also interesting to point out the tentatively shortened H2 depletion time in the low-mass galaxies. It is possible that the molecular clouds once formed can be more massive and denser as a result of the higher Jeans mass in the perturbed interstellar medium (Bournaud, 2010), leading to more vigorous star-formation than in an unperturbed circumstance. This scenario is supported by studies based on observations of the dense molecular gas in merging systems (e.g., Juneau et al., 2009). As a result, we observe a systematically shorter depletion time of the molecular gas for these low-mass group galaxies than for field galaxies. Although the suppressed Hi-to-molecular conversion and the shortened molecular depletion are opposite effects in the flow of baryons from the Hi to the stars, the former process seems to dominate over the latter, resulting in a systematically elongated Hi depletion time, and lower SFR than the SFMS for these low-mass galaxies, as found in this work.
If we look closely at the three massive, quenched galaxies (NGC 7421, IC 5264, and NGC 4772), they have relatively low Hi gas and H2 gas fractions, when compared to the median behavior of the xCOLD GASS sample. In addition, their SFRs are lower than the SFMS galaxies. Thus these three galaxies are mostly quenched because their neutral gas reservoir significantly shrinks, possibly due to environmental gas stripping, or starvation accelerated by stripping. The necessity of losing gas reservoirs before the quenching of these high-mass galaxies is consistent with recent findings for normal field galaxies (e.g., Cortese et al., 2020; Wang et al., 2020; Guo et al., 2021).
Overall, environmental effects seem to work on the low- and high-mass galaxies in different ways. The consequence is that the low-mass galaxies systematically and significantly drop in SFR because the conversion of Hi to H2 is severely suppressed, while the high-mass galaxies tend to remain on the SFMS before the Hi reservoir significantly drops. However, our results in the analysis of the scaling relations suffer from a small sample size. Therefore, in order to verify this result and have a more robust conclusion, more CO observations for group galaxies are required.
In fact, individual galaxies in the two groups seem to be subject to different environmental effects. The locations of individual galaxies in each group are different. While galaxies in the I1459G are located in various regions from the group center to the outskirt of the group, many of the sample galaxies in the N4636G are located near the outskirts () of the N4636G. In addition, the properties (e.g., group mass) of these two groups are different although both groups are loose galaxy groups. These different environmental effects make individual group galaxies have different global properties. We describe individual galaxies in each group in more detail in Appendix C.
5.3 Group Preprocessing
We find that some galaxies in both the I1459G and the N4636G present highly asymmetric distributions in Hi and/or CO data. (e.g., IC 5264, IC 5273, NGC 7421, NGC 4632, NGC 4772, UGC 07982). Furthermore, some of them have low SFRs and low cold gas fractions. Our results suggest that group galaxies can be preprocessed by external mechanisms (tidal interactions and/or ram pressure stripping). In particular, strong local peaks in the CO disk and one-sided extended CO structures due to the external perturbations are the interesting findings in our study, which are supportive evidence for which the molecular gas can be also affected by the group environment.
The N4636G seems to be falling into the Virgo cluster. Together with the asymmetric Hi and/or CO distributions and changes of global properties of galaxies in the N4636G, the fact that the N4636G has many early-type galaxies around the group center (see the right panel of Figure 1) and the higher Hi deficiency (Kilborn et al., 2009) indicates that galaxies can have been already processed by the group environment before they enter the cluster. Recent studies have also found that galaxies in the substructures (e.g., W cloud) and the filaments near the Virgo cluster tend to have a decrease of SFR and low gas fraction (Yoon et al., 2017; Morokuma-Matsui et al., 2021; Mun et al., 2021; Castignani et al., 2022). As in other previous works, our findings support the group preprocessing scenario, which could be one of the important mechanisms in galaxy evolution with the environment. However, our study is limited to only two groups. Therefore, to have a robust conclusion about the group preprocessing, follow-up studies with more groups associated with the cluster are required.
As already mentioned in previous sections, our sample is already biased toward the Hi-rich systems in these two groups. This results in missing severely Hi-deficient members, especially in the N4636G. These Hi-deficient galaxies may still have the molecular gas within their stellar disks. To have a complete picture of the environmental effects on the group galaxies, these Hi-deficient members should also be studied together in future work.
6 Summary and conclusions
We have presented the results of the CO imaging survey for 31 galaxies in the I1459G and the N4636G, using the ALMA/ACA. This is the first CO imaging survey for loose galaxy groups. The main scientific goal of this CO survey is to obtain an understanding of the group’s environmental effects on molecular gas, star formation, and galaxy evolution.
We obtained well-resolved CO imaging data (0.7 1.5 kpc; Figure 4 and Appendix B) for 16 out of 31 galaxies in both I1459G and N4636G from our ACA observations in ALMA Cycle 7. In the I1459G, six out of 11 galaxies have CO detection, and in the N4636G, 10 out of 20 galaxies have CO detection. Their stellar masses range from 109to 1010.
We find that Hi and/or CO distributions (Figure 5) are asymmetric in our group galaxies. In particular, IC 5264, NGC 7421, and NGC 7418 have Hi tails and Hi compression. Their CO distributions are also highly asymmetric, which show extended CO structure and a local peak of CO emission. Our CO imaging data reveal the peculiar CO distributions of group galaxies, which are motivations for further study on the molecular gas of group galaxies with CO imaging observations.
In the comparison of scaling relations of global properties (e.g., SFR and gas fraction) between our group sample and the xCOLD GASS sample, overall, environmental effects seem to work on the low- and high-mass galaxies in different ways. The consequence is that the low-mass galaxies systematically and significantly drop in SFR because the conversion of Hi to H2 seems to be severely suppressed, while the high-mass galaxies tend to remain along the SFMS before the Hi reservoir significantly drops (Figure 6). For some interesting group members (e.g., IC 5264, NGC 7421, NGC 4772, and UGC 07982) showing highly asymmetric morphologies in Hi and/or CO images, a significant decrease of SFRs and gas fractions is found. These results indicate that environmental processes (e.g., tidal interactions and ram pressure stripping) in a group can change the distributions of both molecular gas and Hi gas. This likely results in changes of global properties of group galaxies, such as a decrease of SFR, Hi and H2 gas fractions.
Our results suggest that group galaxies can be significantly processed by the group environment. In particular, the results of the N4636G provide supporting evidence for which the group preprocessing, one of the important mechanisms for galaxy evolution, can occur before groups enter a cluster.
However, our conclusions are solely based on a small sample. To have a robust result of the group environmental effects on physical properties, especially the molecular gas, of galaxies, more CO observations for group members are required for future studies.
In the near future, we plan to make the products (e.g., cubes, moments maps, PVDs) from our ACA CO observations of group galaxies accessible online.
Appendix A Locations of CO-detected group members on the projected sky
Figures 8 and 9 show locations of CO-detected group galaxies on the projected sky plane and their CO distributions (color scale). The CO intensity maps are enlarged by a factor of 12. A dashed circle indicates . A green cross shows location of the BGG. While a cyan color indicates a low-intensity value, a magenta color shows a relatively high-intensity value.
Appendix B CO atlas of galaxies in the IC 1459 group and the NGC 4636 group
We present the ACA CO data for each galaxy of the group sample (Figures 1025). Each figure shows the CO intensity map, velocity field map, CO PVD, CO line profile together with the optical image. The details of each panel in the figure are described as follows. The large dashed circle(s) are the primary beam(s) of the ACA observations. Top left panel: the CO intensity map (orange contours) is overlaid on the DSS2 blue (gray scale). Top middle panel: the CO intensity map in color scale. The contour levels indicating the molecular gas surface density are shown at the top of each panel. The surface density of the molecular gas is calculated by adopting = 4.35 pc-2 (K km s-1)-1 (Strong & Mattox, 1996; Bolatto et al., 2013). In this calculation, we did not apply an inclination correction. Top right panel: CO velocity field map (color scale) with contours (20 km s-1 interval). Bottom middle panel: CO PVD. The PVD is obtained by cutting through the major axis of the galaxy with 16 width in the CO data cube. Bottom right panel: CO line profile (blue color). For NGC 4527, NGC 4536, and NGC 4666, their CN line profiles (red color) are also overlaid on their CO line profiles (blue color). The CN profiles are magnified by a factor of 40. The cross indicates the stellar disk center. The bar at the bottom-left corner represents the physical scale of 2 kpc. The synthesized beam (blue ellipse) of CO data is shown at the bottom-right corner.


Appendix C Comments on individual galaxies with CO detections in the IC 1459 group and the NGC 4636 group
IC 5264 As seen in Figure 10, the CO morphology is very asymmetric. As described in Section 4.3, the CO disk is more extended in the east side than in the west side. Meanwhile, a local peak of CO is found at the edge of the CO disk in the west side. In addition, the CO gas appears to be pushed down to the south from the stellar disk. The CO kinematics are disturbed, as seen in both the velocity map and the PVD in Figure 10. The asymmetry is also found in the CO global profile of IC 5264.
IC 5264 is very close to the BGG (IC 1459) of the group (a projected distance of 27.8 kpc from the group center), which seems to be located within the stellar halo of IC 1459 (Iodice et al., 2020). This implies that IC 5264 is interacting with the BGG (IC 1459) tidally and with the hot halo of the BGG hydrodynamically (e.g., ram pressure stripping). Indeed, Iodice et al. (2020) found the warped structure in the stellar component from VST (VLT Survey Telescope) observations.
As seen in Figure 6, IC 5264 has a lower Hi gas fraction than the median trend of the xCOLD GASS sample. In addition, the H2 gas fraction of IC 5264 is close to the lower dashed line, which indicates a relatively low H2 gas fraction. This decrease of the cold gas (Hi and H2) contents due to external perturbations likely causes its lower SFR, and this suppressed star formation naturally leads to a long H2 gas depletion time. IC 5264 is likely to have already been significantly processed in the group environment.
IC 5269B In our ACA observations, the CO emission is found in the central region of the stellar disk, although IC 5269B has an extended Hi disk (see Figures 5 and 11).
IC 5270 The CO distribution is smooth, and the CO velocity field map seems to be regular (Figure 12). However, some asymmetries are seen in the PVD and the CO global profile (Figure 12). In the global profile, more CO flux is found around 2000 km s-1. IC 5270 has slightly high Hi/H2 gas fractions (Figure 6 (b) and (c)) and normal SFR (Figure 6 (a)).
IC 5273 Even though IC 5273 is located at the outskirt of the I1459G, the CO morphology is highly asymmetric (Figure 13). A locally strong CO emission is found at the northwest side of the CO disk (see also Figure 5). On the other hand, in the southwestern edge of the stellar disk, a CO clump (or patch) is found. IC 5273 shows both asymmetric stellar and CO distributions, strongly suggesting that IC 5273 is affected by external perturbations. However, the Hi fraction (Figure 6 (b)) and SFR (Figure 6 (a)) of this galaxy lie on the median trend and the SFMS, respectively.
NGC 7418 Relatively strong CO emission is seen along the spiral arm (Figures 5 and 14). There is an extended CO emission at the southeast where the Hi compression is seen (see Figure 5). NGC 7418 also shows an asymmetric stellar disk from the optical image, together with asymmetric CO and Hi distributions, indicating that this galaxy has experienced environmental processes in the I1459G. The CO kinematics seems to be not much disturbed, based on the CO velocity field map showing a regular rotating CO disk. Although NGC 7418 shows sings of interactions from Hi, CO, and optical images, this galaxy has typical Hi gas fraction (Figure 6 (b)) and normal SFR (Figure 6 (a)). However, its H2 gas fraction is slightly higher (Figure 6 (c)).
NGC 7421 This galaxy shows a hole in the central region of the CO intensity map (Figure 15). Interestingly, the CO distribution is very asymmetric, with locally strong CO emission in the west side of the CO disk (Figures 5 and 15). This feature is often seen in ram pressure stripping galaxies (Lee et al., 2017; George et al., 2019; Lizée et al., 2021). Ram pressure can compress the molecular gas (e.g. Lee et al., 2017). Thus, NGC 7421 is thought to be likely affected by ram pressure, based on its Hi image (see also Figure 5) (e.g., Ryder et al., 1997; Serra et al., 2015a). However, Oosterloo et al. (2018) suggests that it is expected that the strength of ram pressure is much weaker than in the galaxy cluster (e.g., Virgo cluster), which implies that the ram pressure stripping may not be the main mechanism to affect NGC 7421. A stellar disk of NGC 7421 appears to be extended to the east. The asymmetric stellar disk and disturbed Hi/CO morphologies suggest that a tidal interaction may affect the cold gas components and stellar disk of NGC 7421, as suggested in other previous studies (Oosterloo et al., 2018; Iodice et al., 2020). NGC 7421 has a slightly low Hi fraction (Figure 6 (b)), and its H2 gas fraction and SFR are much lower than the median trend of the xCOLD GASS sample. These results suggest that the group environment significantly affect not only the distributions of cold gas contents (Hi and CO) but also global properties (i.e., removal of cold gas and suppression of SFR) of this galaxy.
NGC 4496A NGC 4496A shows asymmetric CO distribution with a local CO peak in the northeast of the CO disk (Figure 16) although NGC 4496A seems to not be affected by external perturbations, based on its symmetric stellar and Hi disks (see its optical and Hi images in Figure 5). The asymmetric CO distribution of this galaxy may be due to internal mechanisms. NGC 4496A has a typical SFR (Figure 6 (a)) and Hi gas fraction (Figure 6 (b)), but its H2 gas fraction is much lower than the median trend of the xCOLD GASS sample (Figure 6 (c)).
On the projected sky plane, NGC 4496A has a close companion (NGC 4496B) that is located at the southern part of the stellar disk of NGC 4496A. However, the system velocity (4530 km s-1) of NGC 4496B significantly differs from the system velocity (1730 km s-1) of NGC 4496A, which indicates that two galaxies are unlikely to interact with each other. Indeed, there are no signs of interaction in the Hi image of NGC 4496A (Figure 5).
NGC 4517 Overall, the CO morphology and the CO kinematics are regular, as seen in Figure 17. However, the kinematics of CO gas at the west side (from -100 to -150 in the PVD) of the CO disk deviates from the regularly rotating CO disk. This deviation is also seen in the velocity field map.
NGC 4527 The CO morphology and CO kinematics appear to be undisturbed (Figure 18). The CO PVD clearly shows a steep velocity gradient in the inner part. This indicates a presence of a bar-like structure in the central region (e.g., Alatalo et al., 2013). The rapidly increasing velocity component is also seen in the central region of the velocity field map. This distinct velocity structure was also reported in previous high-resolution CO observation (Shibatsuka et al., 2003). Figure 18 presents the line profiles of both CO (blue line) and CN lines (red line). The velocity range of the CN emission is comparable to that of the CO emission. The details of the CN structure of NGC 4527 are in Appendix D.
NGC 4536 The CO gas seems to be concentrated in the central region with a strong peak, and the relatively faint CO emission appears to extend along the stellar arms. Some CO patches are also found in the outer part (Figure 19). Previous high-resolution CO observations (2) using the NMA (the Nobeyama Millimeterwave Array) and the OVRO (the Owens Valley Radio Observatory) millimeterwave interferometer reported the gas concentration in the nuclear disk (Sofue et al., 2003; Jogee et al., 2005). Recently, this galaxy is also mapped in CO (21) transition in the Virgo Environment Traced in CO Survey (VERTICO; Brown et al. 2021). As for NGC 4527, the CN emission is detected in the central region of NGC 4536 (see Figures 19 and 27).
NGC 4592 The CO distribution of NGC 4592 looks clumpy, as seen in Figure 20. As seen in Figure 5, its Hi disk is symmetric/smooth and extends beyond its stellar disk.
NGC 4632 The CO distribution and the CO kinematics are asymmetric. In particular, the CO distribution seems to resemble the complex structure of the inner stellar disk (Figure 21). In the east side, the CO disk is more extended and presents a strong local peak. This asymmetric structure is also clearly seen in the PVD of NGC 4632. Interestingly, NGC 4632 has a polar ring-like structure in the Hi gas, and its deep optical image (Figure 26) also shows the polar ring structure in the south. External mechanisms (e.g., minor merger) may cause the formation of the ring structure of NGC 4632. Additional analysis on the deep imaging and kinematics of the Hi ring is underway (X. Chen et al. 2022, in preparation and N. Deg et al. 2022, in preparation).
Although NGC 4632 shows clear signs of external perturbations with the polar ring structure and asymmetric distributions of the CO gas and the stellar component, this galaxy has a typical SFR (Figure 6 (a)), and a normal Hi gas fraction (Figure 6 (b)). However, its H2 gas fraction is above +1 scatter, indicating more abundant H2 gas (Figure 6 (c)).
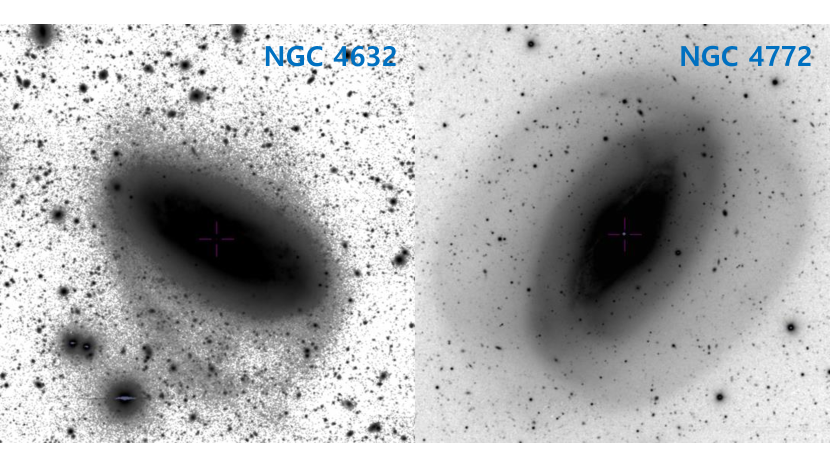
NGC 4666 Overall, the CO morphology and the CO kinematics are regular, as seen in Figure 22. In addition, the CN emission is also detected in the central region of NGC 4666 (see Figures 22 and 27). The details of the CN structure of NGC 4666 are in Appendix D.
As discussed in Section 5.1, NGC 4666 is interacting with its neighbor galaxy (NGC 4668). Interestingly, while NGC 4666 has a typical Hi gas fraction (Figure 6 (b)), its SFR is relatively high (Figure 6 (a)), and the H2 gas fraction is much higher than the median trend of the xCOLD GASS sample ((Figure 6 (c)). In this case, tidal interactions may help to convert the Hi gas into the H2 gas efficiently (Kaneko et al., 2017) and enhance the star formation activity, as reported in previous studies (e.g., Pan et al., 2018; Renaud et al., 2019).
NGC 4772 The CO gas is found along the inner Hi disk, as discussed in Section 5.1. We did not detect CO emission in the bulge region of NGC 4772 (Figure 23). The VERTICO project (Brown et al., 2021) also observed CO(2–1) line of this galaxy, and its CO(2–1) distribution is similar to the CO(1–0) distribution in our ACA observation. As seen in the Hi image (Figure 5), NGC 4772 has a large Hi outer ring. Furthermore, this galaxy shows a diffuse extended stellar rings from a deep optical image (Figure 26). Based on these complex structures, NGC 4772 is thought to experience a minor merger (Haynes et al., 2000; Chung et al., 2009).
NGC 4772 present significantly low SFR ((Figure 6 (a)) and low Hi/H2 gas fractions ((Figure 6 (b) and (c)). The decrease of the cold gas contents likely results in the suppression of star formation activity in NGC 4772.
UGC 07982 Overall, the CO morphology and the CO kinematics are regular, as seen in Figure 24. However, as discussed in Section 5.1, this galaxy is likely to be experiencing RPS in the N4636G, based on its asymmetric Hi morphology and the analysis of the ram pressure strength against the restoring force in the disk for UGC 07982 (Lin et al., 2023).
UGC 07982 has a very low SFR (Figure 6 (a)) and a low Hi gas fraction (Figure 6 (b)), compared to the SFMS galaxies. In particular, this galaxy has quite a long H2 gas depletion time (Figure 6 (f)), indicating a low star formation efficiency. In this case, the external perturbation (i.e., RPS) may prevent the molecular gas from forming new stars by injecting additional turbulent motion into the molecular gas, as suggested by previous studies (Alatalo et al., 2015; Mok et al., 2016; Lee et al., 2017).
UGC 08041 As described in Section 4.3, the CO distribution of UGC 08041 is irregular, showing that the CO emission is much extended toward the south (Figure 25). UGC 08041 shows typical SFR (Figure 6 (a)) and normal Hi gas fraction (Figure 6 (b)). However, its H2 gas fraction is quite low (Figure 6 (c)), compared to the median trend of the xCOLD GASS sample.
Appendix D CN line detection
The CN line is one of the molecular lines that trace dense molecular gas. This molecule is abundant in photon-dominated regions (PDRs) because the CN molecule can be created by a photo-dissociation process (e.g., Rodriguez-Franco et al., 1998; Boger & Sternberg, 2005). In our ACA observations, three galaxies (NGC 4527, NGC 4536, and NGC 4666) in the N4636G have CN detection. These three galaxies show active star-formation activity (SFR 2 yr-1, see also Table 1) (Dahlem et al., 1997; Shibatsuka et al., 2003; Jogee et al., 2005) together with nuclear activity in the galactic center (e.g., AGN) (Ho et al., 1997; Shibatsuka et al., 2003; Persic et al., 2004; McAlpine et al., 2011). Figure 27 reveals CN distribution of three galaxies. NGC 4527 and NGC 4536 show compact distribution of CN emission in the central region, while NGC 4666 show relatively extended CN distribution. For NGC 4527, the linewidth of CN is slightly larger than that of CO. Meanwhile, for NGC 4536 and NGC 4666, the linewidths of CN are narrow, compared to the linewidths of CO (see Tables 3 and 5, and Figures 18, 19, and 22). The integrated CN fluxes, peak intensities of the intensity maps, the CN linewidths, rms noise per channel of the CN data cubes, and information on the synthesized beam of the CN data are summarized in Table 5.
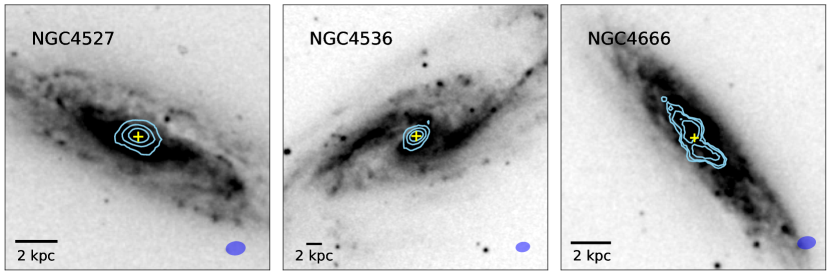
| Name | , | CN Peak Flux | CN Flux | |||
|---|---|---|---|---|---|---|
| (, deg) | (mJy beam-1) | (km s-1) | (km s-1) | (Jy km s-1 beam-1) | (Jy km s-1) | |
| (1) | (2) | (3) | (4) | (5) | (6) | (7) |
| NGC 4527 | 14.310.1, 96.1 | 8.0 | 463 | 408 | 12.5 | 15.61.3 |
| NGC 4536 | 14.310.0, 99.2 | 6.0 | 303 | 264 | 5.8 | 6.40.7 |
| NGC 4666 | 14.19.7, 99.1 | 8.0 | 370 | 321 | 2.7 | 8.51.0 |
Note. — (1) Galaxy name; (2) beam size (major and minor axes), beam position angle; (3) rms noise level per channel of the CN data; (4) and (5) the CN linewidths measured at 20% and 50% of the peak flux using the SoFiA; (6) the peak value of CN intensity map; (7) the total CN flux.
Appendix E 3 mm continuum detection
Four galaxies (NGC 4527, NGC 4536, NGC 4666, and NGC 4772) of the N4636G have a 3 mm continuum detection. The 3 mm continuum emission of NGC 4772 was detected in the previous Nobeyama Millimeter Array (NMA) observations. For NGC 4772, its 3 mm flux density (6.0 0.6 mJy) in our ACA observations is consistent with the 3 mm flux density (5.2 2.9 mJy) in the NMA observations (Doi et al., 2011). Figure 28 shows the 3 mm continuum distributions of the four galaxies. The 3 mm continuum distribution is compact in three galaxies (NGC 4527, NGC 4536, and NGC 4772). NGC 4666 shows the extended continuum distribution, similar to the CN distribution. All four galaxies have nuclear activity in the galactic center. NGC 4527 is the transition object between the starburst and the low-ionization nuclear emission-line region (LINER) (Ho et al., 1997). NGC 4536 hosts the low luminosity AGN (LLAGN) together with active star formation in the central region (Satyapal et al., 2008; McAlpine et al., 2011). In addition, the obscured AGN is found in NGC 4666 (Dahlem et al., 1997). NGC 4772 has also LLAGN (Doi et al., 2011). The 3 mm flux densities, peak flux densities of the 3 mm continuum, rms noise and synthesized beam of the 3 mm data are summarized in Table 6.
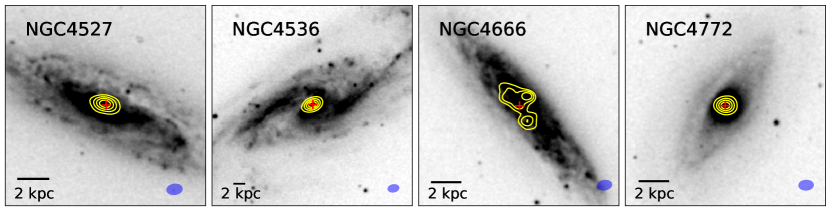
| Name | , | Peak Flux Density | Flux Density | Nuclear Activity | References | |
|---|---|---|---|---|---|---|
| (, deg) | (mJy beam-1) | (mJy beam-1) | (mJy) | |||
| (1) | (2) | (3) | (4) | (5) | (6) | (7) |
| NGC 4527 | 15.510.7, 97.6 | 0.32 | 5.1 | 6.10.9 | starburst/LINER | (a) |
| NGC 4536 | 15.510.7, 100.3 | 0.20 | 9.1 | 11.90.9 | LLAGN | (b), (c) |
| NGC 4666 | 15.410.5, 100.4 | 0.28 | 2.4 | 9.31.2 | obscured AGN | (d) |
| NGC 4772 | 15.510.8, 92.6 | 0.24 | 5.9 | 6.00.6 | LLAGN | (e) |
Note. — (1) Galaxy name; (2) beam size (major and minor axes), beam position angle; (3) rms noise level of the 3 mm continuum data; (4) the peak value of 3 mm continuum map; (5) the total 3 mm continuum flux; (6) Type of the nuclear activity; (7) References for types of the nuclear activity: (a) Ho et al. (1997), (b) Satyapal et al. (2008), (c) McAlpine et al. (2011), (d) Dahlem et al. (1997), (e) Doi et al. (2011)
Appendix F Optical Images of Our Group Sample with Nondetections of CO
Figure 29 shows optical images of group members with nondetection of CO in the I1459G and the N4636G.
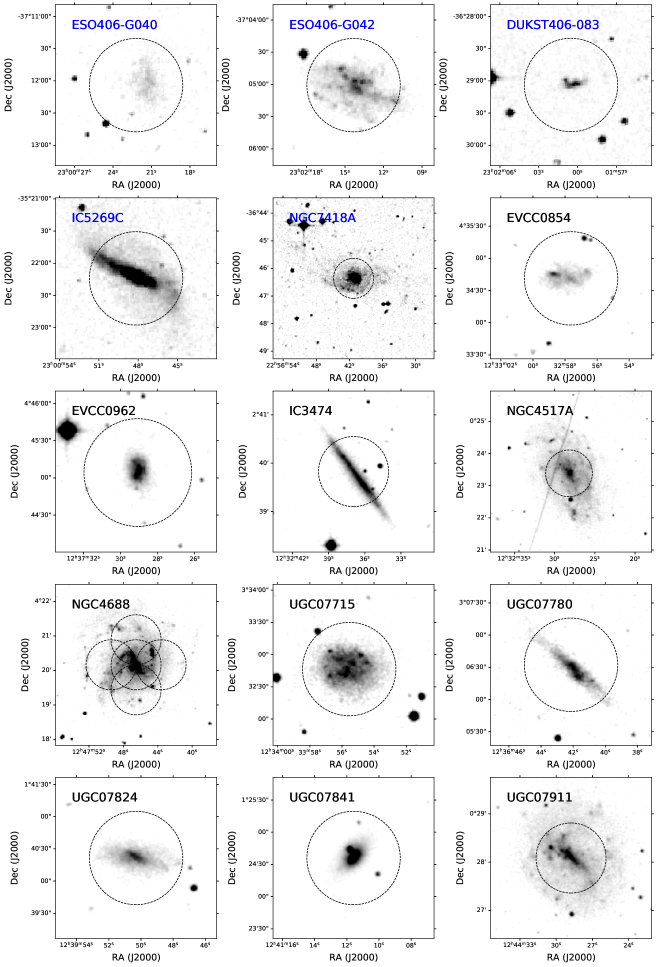
References
- Accurso et al. (2017) Accurso, G., Saintonge, A., Catinella, B., et al. 2017, MNRAS, 470, 4750, doi: 10.1093/mnras/stx1556
- Ahoranta et al. (2016) Ahoranta, J., Finoguenov, A., Pinto, C., et al. 2016, A&A, 592, A145, doi: 10.1051/0004-6361/201527523
- Aihara et al. (2019) Aihara, H., AlSayyad, Y., Ando, M., et al. 2019, PASJ, 71, 114, doi: 10.1093/pasj/psz103
- Alatalo et al. (2013) Alatalo, K., Davis, T. A., Bureau, M., et al. 2013, MNRAS, 432, 1796, doi: 10.1093/mnras/sts299
- Alatalo et al. (2015) Alatalo, K., Appleton, P. N., Lisenfeld, U., et al. 2015, ApJ, 812, 117, doi: 10.1088/0004-637X/812/2/117
- Astropy Collaboration et al. (2013) Astropy Collaboration, Robitaille, T. P., Tollerud, E. J., et al. 2013, A&A, 558, A33, doi: 10.1051/0004-6361/201322068
- Astropy Collaboration et al. (2018) Astropy Collaboration, Price-Whelan, A. M., Sipőcz, B. M., et al. 2018, AJ, 156, 123, doi: 10.3847/1538-3881/aabc4f
- Baldi et al. (2009) Baldi, A., Forman, W., Jones, C., et al. 2009, ApJ, 707, 1034, doi: 10.1088/0004-637X/707/2/1034
- Balogh et al. (2007) Balogh, M. L., Wilman, D., Henderson, R. D. E., et al. 2007, MNRAS, 374, 1169, doi: 10.1111/j.1365-2966.2006.11235.x
- Barnes (1999) Barnes, D. G. 1999, PASA, 16, 77, doi: 10.1071/AS99077
- Bettoni et al. (2010) Bettoni, D., Buson, L. M., & Galletta, G. 2010, A&A, 519, A72, doi: 10.1051/0004-6361/201014750
- Bitsakis et al. (2014) Bitsakis, T., Charmandaris, V., Appleton, P. N., et al. 2014, A&A, 565, A25, doi: 10.1051/0004-6361/201323349
- Boger & Sternberg (2005) Boger, G. I., & Sternberg, A. 2005, ApJ, 632, 302, doi: 10.1086/432864
- Bolatto et al. (2013) Bolatto, A. D., Wolfire, M., & Leroy, A. K. 2013, ARA&A, 51, 207, doi: 10.1146/annurev-astro-082812-140944
- Bolatto et al. (2011) Bolatto, A. D., Leroy, A. K., Jameson, K., et al. 2011, ApJ, 741, 12, doi: 10.1088/0004-637X/741/1/12
- Bonnarel et al. (2000) Bonnarel, F., Fernique, P., Bienaymé, O., et al. 2000, A&AS, 143, 33, doi: 10.1051/aas:2000331
- Boselli et al. (2014a) Boselli, A., Cortese, L., & Boquien, M. 2014a, A&A, 564, A65, doi: 10.1051/0004-6361/201322311
- Boselli et al. (2014b) Boselli, A., Cortese, L., Boquien, M., et al. 2014b, A&A, 564, A67, doi: 10.1051/0004-6361/201322313
- Bournaud (2010) Bournaud, F. 2010, in Astronomical Society of the Pacific Conference Series, Vol. 423, Galaxy Wars: Stellar Populations and Star Formation in Interacting Galaxies, ed. B. Smith, J. Higdon, S. Higdon, & N. Bastian, 177, doi: 10.48550/arXiv.0909.1812
- Brough et al. (2006) Brough, S., Forbes, D. A., Kilborn, V. A., & Couch, W. 2006, MNRAS, 370, 1223, doi: 10.1111/j.1365-2966.2006.10542.x
- Brown et al. (2017) Brown, T., Catinella, B., Cortese, L., et al. 2017, MNRAS, 466, 1275, doi: 10.1093/mnras/stw2991
- Brown et al. (2021) Brown, T., Wilson, C. D., Zabel, N., et al. 2021, ApJS, 257, 21, doi: 10.3847/1538-4365/ac28f5
- Buta & Combes (1996) Buta, R., & Combes, F. 1996, Fund. Cosmic Phys., 17, 95
- Calzetti (2013) Calzetti, D. 2013, Star Formation Rate Indicators, ed. J. Falcón-Barroso & J. H. Knapen, 419
- Castignani et al. (2022) Castignani, G., Combes, F., Jablonka, P., et al. 2022, A&A, 657, A9, doi: 10.1051/0004-6361/202040141
- Catinella et al. (2018) Catinella, B., Saintonge, A., Janowiecki, S., et al. 2018, MNRAS, 476, 875, doi: 10.1093/mnras/sty089
- Chabrier (2003) Chabrier, G. 2003, PASP, 115, 763, doi: 10.1086/376392
- Chung et al. (2009) Chung, A., van Gorkom, J. H., Kenney, J. D. P., Crowl, H., & Vollmer, B. 2009, AJ, 138, 1741, doi: 10.1088/0004-6256/138/6/1741
- Chung & Kim (2014) Chung, E. J., & Kim, S. 2014, PASJ, 66, 11, doi: 10.1093/pasj/pst011
- Conselice et al. (2000) Conselice, C. J., Bershady, M. A., & Jangren, A. 2000, ApJ, 529, 886, doi: 10.1086/308300
- Cortese et al. (2020) Cortese, L., Catinella, B., Cook, R. H. W., & Janowiecki, S. 2020, MNRAS, 494, L42, doi: 10.1093/mnrasl/slaa032
- Cortese et al. (2021) Cortese, L., Catinella, B., & Smith, R. 2021, PASA, 38, e035, doi: 10.1017/pasa.2021.18
- Cramer et al. (2020) Cramer, W. J., Kenney, J. D. P., Cortes, J. R., et al. 2020, ApJ, 901, 95, doi: 10.3847/1538-4357/abaf54
- Cybulski et al. (2014) Cybulski, R., Yun, M. S., Fazio, G. G., & Gutermuth, R. A. 2014, MNRAS, 439, 3564, doi: 10.1093/mnras/stu200
- Dahlem et al. (1997) Dahlem, M., Petr, M. G., Lehnert, M. D., Heckman, T. M., & Ehle, M. 1997, A&A, 320, 731
- De Lucia et al. (2012) De Lucia, G., Weinmann, S., Poggianti, B. M., Aragón-Salamanca, A., & Zaritsky, D. 2012, MNRAS, 423, 1277, doi: 10.1111/j.1365-2966.2012.20983.x
- Dénes et al. (2016) Dénes, H., Kilborn, V. A., Koribalski, B. S., & Wong, O. I. 2016, MNRAS, 455, 1294, doi: 10.1093/mnras/stv2391
- Doi et al. (2011) Doi, A., Nakanishi, K., Nagai, H., Kohno, K., & Kameno, S. 2011, AJ, 142, 167, doi: 10.1088/0004-6256/142/5/167
- Dressler (1980) Dressler, A. 1980, ApJ, 236, 351, doi: 10.1086/157753
- Džudžar et al. (2019) Džudžar, R., Kilborn, V., Murugeshan, C., et al. 2019, MNRAS, 490, L6, doi: 10.1093/mnrasl/slz139
- Eke et al. (2004) Eke, V. R., Baugh, C. M., Cole, S., et al. 2004, MNRAS, 348, 866, doi: 10.1111/j.1365-2966.2004.07408.x
- Fernández Lorenzo et al. (2013) Fernández Lorenzo, M., Sulentic, J., Verdes-Montenegro, L., & Argudo-Fernández, M. 2013, MNRAS, 434, 325, doi: 10.1093/mnras/stt1020
- For et al. (2019) For, B. Q., Staveley-Smith, L., Westmeier, T., et al. 2019, MNRAS, 489, 5723, doi: 10.1093/mnras/stz2501
- For et al. (2021) For, B. Q., Wang, J., Westmeier, T., et al. 2021, MNRAS, 507, 2300, doi: 10.1093/mnras/stab2257
- Forbes et al. (2020) Forbes, D. A., Dullo, B. T., Gannon, J., et al. 2020, MNRAS, 494, 5293, doi: 10.1093/mnras/staa1111
- Forbes et al. (1994) Forbes, D. A., Franx, M., & Illingworth, G. D. 1994, ApJ, 428, L49, doi: 10.1086/187390
- Forbes et al. (1995) Forbes, D. A., Reitzel, D. B., & Williger, G. M. 1995, AJ, 109, 1576, doi: 10.1086/117386
- Forbes et al. (2006) Forbes, D. A., Ponman, T., Pearce, F., et al. 2006, PASA, 23, 38, doi: 10.1071/AS06002
- Franx & Illingworth (1988) Franx, M., & Illingworth, G. D. 1988, ApJ, 327, L55, doi: 10.1086/185139
- George et al. (2019) George, K., Poggianti, B. M., Bellhouse, C., et al. 2019, MNRAS, 487, 3102, doi: 10.1093/mnras/stz1443
- Giacintucci et al. (2011) Giacintucci, S., O’Sullivan, E., Vrtilek, J., et al. 2011, ApJ, 732, 95, doi: 10.1088/0004-637X/732/2/95
- Giese et al. (2016) Giese, N., van der Hulst, T., Serra, P., & Oosterloo, T. 2016, MNRAS, 461, 1656, doi: 10.1093/mnras/stw1426
- Gómez et al. (2003) Gómez, P. L., Nichol, R. C., Miller, C. J., et al. 2003, ApJ, 584, 210, doi: 10.1086/345593
- Goto et al. (2003) Goto, T., Yamauchi, C., Fujita, Y., et al. 2003, MNRAS, 346, 601, doi: 10.1046/j.1365-2966.2003.07114.x
- Guo et al. (2021) Guo, H., Jones, M. G., Wang, J., & Lin, L. 2021, ApJ, 918, 53, doi: 10.3847/1538-4357/ac062e
- Haines et al. (2015) Haines, C. P., Pereira, M. J., Smith, G. P., et al. 2015, ApJ, 806, 101, doi: 10.1088/0004-637X/806/1/101
- Harris et al. (2020) Harris, C. R., Millman, K. J., van der Walt, S. J., et al. 2020, Nature, 585, 357, doi: 10.1038/s41586-020-2649-2
- Haynes et al. (2000) Haynes, M. P., Jore, K. P., Barrett, E. A., Broeils, A. H., & Murray, B. M. 2000, AJ, 120, 703, doi: 10.1086/301457
- Hess & Wilcots (2013) Hess, K. M., & Wilcots, E. M. 2013, AJ, 146, 124, doi: 10.1088/0004-6256/146/5/124
- Ho et al. (1997) Ho, L. C., Filippenko, A. V., & Sargent, W. L. W. 1997, ApJS, 112, 315, doi: 10.1086/313041
- Hogg et al. (2004) Hogg, D. W., Blanton, M. R., Brinchmann, J., et al. 2004, ApJ, 601, L29, doi: 10.1086/381749
- Holwerda et al. (2011a) Holwerda, B. W., Pirzkal, N., de Blok, W. J. G., et al. 2011a, MNRAS, 416, 2415, doi: 10.1111/j.1365-2966.2011.17683.x
- Holwerda et al. (2011b) Holwerda, B. W., Pirzkal, N., de Blok, W. J. G., & van Driel, W. 2011b, MNRAS, 416, 2447, doi: 10.1111/j.1365-2966.2011.18662.x
- Houghton (2015) Houghton, R. C. W. 2015, MNRAS, 451, 3427, doi: 10.1093/mnras/stv1113
- Hunter (2007) Hunter, J. D. 2007, Computing in Science & Engineering, 9, 90, doi: 10.1109/MCSE.2007.55
- Iodice et al. (2020) Iodice, E., Spavone, M., Cattapan, A., et al. 2020, A&A, 635, A3, doi: 10.1051/0004-6361/201936435
- Jáchym et al. (2019) Jáchym, P., Kenney, J. D. P., Sun, M., et al. 2019, ApJ, 883, 145, doi: 10.3847/1538-4357/ab3e6c
- Jaffé et al. (2016) Jaffé, Y. L., Verheijen, M. A. W., Haines, C. P., et al. 2016, MNRAS, 461, 1202, doi: 10.1093/mnras/stw984
- Jarrett et al. (2017) Jarrett, T. H., Cluver, M. E., Magoulas, C., et al. 2017, ApJ, 836, 182, doi: 10.3847/1538-4357/836/2/182
- Jogee et al. (2005) Jogee, S., Scoville, N., & Kenney, J. D. P. 2005, ApJ, 630, 837, doi: 10.1086/432106
- Juneau et al. (2009) Juneau, S., Narayanan, D. T., Moustakas, J., et al. 2009, ApJ, 707, 1217, doi: 10.1088/0004-637X/707/2/1217
- Jung et al. (2018) Jung, S. L., Choi, H., Wong, O. I., et al. 2018, ApJ, 865, 156, doi: 10.3847/1538-4357/aadda2
- Kaneko et al. (2017) Kaneko, H., Kuno, N., Iono, D., et al. 2017, PASJ, 69, 66, doi: 10.1093/pasj/psx041
- Kantharia et al. (2005) Kantharia, N. G., Ananthakrishnan, S., Nityananda, R., & Hota, A. 2005, A&A, 435, 483, doi: 10.1051/0004-6361:20042261
- Kauffmann et al. (2004) Kauffmann, G., White, S. D. M., Heckman, T. M., et al. 2004, MNRAS, 353, 713, doi: 10.1111/j.1365-2966.2004.08117.x
- Kilborn et al. (2009) Kilborn, V. A., Forbes, D. A., Barnes, D. G., et al. 2009, MNRAS, 400, 1962, doi: 10.1111/j.1365-2966.2009.15587.x
- Kilborn et al. (2005) Kilborn, V. A., Koribalski, B. S., Forbes, D. A., Barnes, D. G., & Musgrave, R. C. 2005, MNRAS, 356, 77, doi: 10.1111/j.1365-2966.2004.08450.x
- Kleiner et al. (2021) Kleiner, D., Serra, P., Maccagni, F. M., et al. 2021, A&A, 648, A32, doi: 10.1051/0004-6361/202039898
- Koribalski et al. (2020) Koribalski, B. S., Staveley-Smith, L., Westmeier, T., et al. 2020, Ap&SS, 365, 118, doi: 10.1007/s10509-020-03831-4
- Kroupa (2001) Kroupa, P. 2001, MNRAS, 322, 231, doi: 10.1046/j.1365-8711.2001.04022.x
- Krumholz et al. (2009) Krumholz, M. R., McKee, C. F., & Tumlinson, J. 2009, ApJ, 693, 216, doi: 10.1088/0004-637X/693/1/216
- Lee & Chung (2018) Lee, B., & Chung, A. 2018, ApJ, 866, L10, doi: 10.3847/2041-8213/aae4d9
- Lee et al. (2017) Lee, B., Chung, A., Tonnesen, S., et al. 2017, MNRAS, 466, 1382, doi: 10.1093/mnras/stw3162
- Lee-Waddell et al. (2019) Lee-Waddell, K., Koribalski, B. S., Westmeier, T., et al. 2019, MNRAS, 487, 5248, doi: 10.1093/mnras/stz017
- Leroy et al. (2005) Leroy, A., Bolatto, A. D., Simon, J. D., & Blitz, L. 2005, ApJ, 625, 763, doi: 10.1086/429578
- Leroy et al. (2021) Leroy, A. K., Hughes, A., Liu, D., et al. 2021, ApJS, 255, 19, doi: 10.3847/1538-4365/abec80
- Lewis et al. (2002) Lewis, I., Balogh, M., De Propris, R., et al. 2002, MNRAS, 334, 673, doi: 10.1046/j.1365-8711.2002.05558.x
- Lin et al. (2023) Lin, X., Wang, J., Kilborn, V., et al. 2023, arXiv e-prints, arXiv:2304.09795, doi: 10.48550/arXiv.2304.09795
- Lizée et al. (2021) Lizée, T., Vollmer, B., Braine, J., & Nehlig, F. 2021, A&A, 645, A111, doi: 10.1051/0004-6361/202038910
- Makarov et al. (2014) Makarov, D., Prugniel, P., Terekhova, N., Courtois, H., & Vauglin, I. 2014, A&A, 570, A13, doi: 10.1051/0004-6361/201423496
- Martin et al. (2005) Martin, D. C., Fanson, J., Schiminovich, D., et al. 2005, ApJ, 619, L1, doi: 10.1086/426387
- Martinez-Badenes et al. (2012) Martinez-Badenes, V., Lisenfeld, U., Espada, D., et al. 2012, A&A, 540, A96, doi: 10.1051/0004-6361/201117281
- Matsushita et al. (1998) Matsushita, K., Makishima, K., Ikebe, Y., et al. 1998, ApJ, 499, L13, doi: 10.1086/311339
- McAlpine et al. (2011) McAlpine, W., Satyapal, S., Gliozzi, M., et al. 2011, ApJ, 728, 25, doi: 10.1088/0004-637X/728/1/25
- McGee et al. (2009) McGee, S. L., Balogh, M. L., Bower, R. G., Font, A. S., & McCarthy, I. G. 2009, MNRAS, 400, 937, doi: 10.1111/j.1365-2966.2009.15507.x
- McMullin et al. (2007) McMullin, J. P., Waters, B., Schiebel, D., Young, W., & Golap, K. 2007, in Astronomical Society of the Pacific Conference Series, Vol. 376, Astronomical Data Analysis Software and Systems XVI, ed. R. A. Shaw, F. Hill, & D. J. Bell, 127
- Miles et al. (2004) Miles, T. A., Raychaudhury, S., Forbes, D. A., et al. 2004, MNRAS, 355, 785, doi: 10.1111/j.1365-2966.2004.08356.x
- Mok et al. (2017) Mok, A., Wilson, C. D., Knapen, J. H., et al. 2017, MNRAS, 467, 4282, doi: 10.1093/mnras/stx345
- Mok et al. (2016) Mok, A., Wilson, C. D., Golding, J., et al. 2016, MNRAS, 456, 4384, doi: 10.1093/mnras/stv2958
- Moretti et al. (2020a) Moretti, A., Paladino, R., Poggianti, B. M., et al. 2020a, ApJ, 889, 9, doi: 10.3847/1538-4357/ab616a
- Moretti et al. (2020b) —. 2020b, ApJ, 897, L30, doi: 10.3847/2041-8213/ab9f3b
- Morokuma-Matsui et al. (2021) Morokuma-Matsui, K., Kodama, T., Morokuma, T., et al. 2021, ApJ, 914, 145, doi: 10.3847/1538-4357/abedb6
- Mun et al. (2021) Mun, J. Y., Hwang, H. S., Lee, M. G., et al. 2021, Journal of Korean Astronomical Society, 54, 17, doi: 10.5303/JKAS.2021.54.1.17
- Nolthenius (1993) Nolthenius, R. 1993, ApJS, 85, 1, doi: 10.1086/191753
- Oosterloo et al. (2018) Oosterloo, T. A., Zhang, M. L., Lucero, D. M., & Carignan, C. 2018, arXiv e-prints, arXiv:1803.08263. https://arxiv.org/abs/1803.08263
- Osmond & Ponman (2004) Osmond, J. P. F., & Ponman, T. J. 2004, MNRAS, 350, 1511, doi: 10.1111/j.1365-2966.2004.07742.x
- O’Sullivan et al. (2018) O’Sullivan, E., Combes, F., Salomé, P., et al. 2018, A&A, 618, A126, doi: 10.1051/0004-6361/201833580
- Pan et al. (2018) Pan, H.-A., Lin, L., Hsieh, B.-C., et al. 2018, ApJ, 868, 132, doi: 10.3847/1538-4357/aaeb92
- Persic et al. (2004) Persic, M., Cappi, M., Rephaeli, Y., et al. 2004, A&A, 427, 35, doi: 10.1051/0004-6361:20041128
- Pisano (2004) Pisano, D. J. 2004, PASA, 21, 390, doi: 10.1071/AS04055
- Prichard et al. (2019) Prichard, L. J., Vaughan, S. P., & Davies, R. L. 2019, MNRAS, 488, 1679, doi: 10.1093/mnras/stz1191
- Rasmussen et al. (2006) Rasmussen, J., Ponman, T. J., & Mulchaey, J. S. 2006, MNRAS, 370, 453, doi: 10.1111/j.1365-2966.2006.10492.x
- Renaud et al. (2019) Renaud, F., Bournaud, F., Agertz, O., et al. 2019, A&A, 625, A65, doi: 10.1051/0004-6361/201935222
- Reynolds et al. (2020) Reynolds, T. N., Westmeier, T., Staveley-Smith, L., Chauhan, G., & Lagos, C. D. P. 2020, MNRAS, 493, 5089, doi: 10.1093/mnras/staa597
- Roberts & Parker (2017) Roberts, I. D., & Parker, L. C. 2017, MNRAS, 467, 3268, doi: 10.1093/mnras/stx317
- Roberts et al. (2021) Roberts, I. D., van Weeren, R. J., McGee, S. L., et al. 2021, A&A, 652, A153, doi: 10.1051/0004-6361/202141118
- Robotham et al. (2011) Robotham, A. S. G., Norberg, P., Driver, S. P., et al. 2011, MNRAS, 416, 2640, doi: 10.1111/j.1365-2966.2011.19217.x
- Rodriguez-Franco et al. (1998) Rodriguez-Franco, A., Martin-Pintado, J., & Fuente, A. 1998, A&A, 329, 1097
- Roychowdhury et al. (2022) Roychowdhury, S., Meyer, M. J., Rhee, J., et al. 2022, ApJ, 927, 20, doi: 10.3847/1538-4357/ac49ea
- Ryder et al. (1997) Ryder, S. D., Purcell, G., Davis, D., & Andersen, V. 1997, PASA, 14, 81, doi: 10.1071/AS97081
- Saintonge et al. (2016) Saintonge, A., Catinella, B., Cortese, L., et al. 2016, MNRAS, 462, 1749, doi: 10.1093/mnras/stw1715
- Saintonge et al. (2017) Saintonge, A., Catinella, B., Tacconi, L. J., et al. 2017, ApJS, 233, 22, doi: 10.3847/1538-4365/aa97e0
- Salim et al. (2007) Salim, S., Rich, R. M., Charlot, S., et al. 2007, ApJS, 173, 267, doi: 10.1086/519218
- Salo et al. (2015) Salo, H., Laurikainen, E., Laine, J., et al. 2015, ApJS, 219, 4, doi: 10.1088/0067-0049/219/1/4
- Sánchez et al. (2017) Sánchez, S. F., Barrera-Ballesteros, J. K., Sánchez-Menguiano, L., et al. 2017, MNRAS, 469, 2121, doi: 10.1093/mnras/stx808
- Saponara et al. (2018) Saponara, J., Koribalski, B. S., Benaglia, P., & Fernández López, M. 2018, MNRAS, 473, 3358, doi: 10.1093/mnras/stx2475
- Satyapal et al. (2008) Satyapal, S., Vega, D., Dudik, R. P., Abel, N. P., & Heckman, T. 2008, ApJ, 677, 926, doi: 10.1086/529014
- Schaye (2004) Schaye, J. 2004, ApJ, 609, 667, doi: 10.1086/421232
- Schruba et al. (2011) Schruba, A., Leroy, A. K., Walter, F., et al. 2011, AJ, 142, 37, doi: 10.1088/0004-6256/142/2/37
- Serra et al. (2015a) Serra, P., Koribalski, B., Kilborn, V., et al. 2015a, MNRAS, 452, 2680, doi: 10.1093/mnras/stv1326
- Serra et al. (2015b) Serra, P., Westmeier, T., Giese, N., et al. 2015b, MNRAS, 448, 1922, doi: 10.1093/mnras/stv079
- Seth & Raychaudhury (2020) Seth, R., & Raychaudhury, S. 2020, MNRAS, 497, 466, doi: 10.1093/mnras/staa1779
- Shibatsuka et al. (2003) Shibatsuka, T., Matsushita, S., Kohno, K., & Kawabe, R. 2003, PASJ, 55, 87, doi: 10.1093/pasj/55.1.87
- Sofue et al. (2003) Sofue, Y., Koda, J., Nakanishi, H., et al. 2003, PASJ, 55, 17, doi: 10.1093/pasj/55.1.17
- Solomon & Vanden Bout (2005) Solomon, P. M., & Vanden Bout, P. A. 2005, ARA&A, 43, 677, doi: 10.1146/annurev.astro.43.051804.102221
- Sorai et al. (2019) Sorai, K., Kuno, N., Muraoka, K., et al. 2019, PASJ, 71, S14, doi: 10.1093/pasj/psz115
- Speagle et al. (2014) Speagle, J. S., Steinhardt, C. L., Capak, P. L., & Silverman, J. D. 2014, ApJS, 214, 15, doi: 10.1088/0067-0049/214/2/15
- Strong & Mattox (1996) Strong, A. W., & Mattox, J. R. 1996, A&A, 308, L21
- Tucker et al. (2000) Tucker, D. L., Oemler, Augustus, J., Hashimoto, Y., et al. 2000, ApJS, 130, 237, doi: 10.1086/317348
- Tully & Shaya (1984) Tully, R. B., & Shaya, E. J. 1984, ApJ, 281, 31, doi: 10.1086/162073
- Virtanen et al. (2020) Virtanen, P., Gommers, R., Oliphant, T. E., et al. 2020, Nature Methods, 17, 261, doi: 10.1038/s41592-019-0686-2
- Vulcani et al. (2018) Vulcani, B., Poggianti, B. M., Jaffé, Y. L., et al. 2018, MNRAS, 480, 3152, doi: 10.1093/mnras/sty2095
- Walter et al. (2008) Walter, F., Brinks, E., de Blok, W. J. G., et al. 2008, AJ, 136, 2563, doi: 10.1088/0004-6256/136/6/2563
- Walter et al. (2004) Walter, F., Dahlem, M., & Lisenfeld, U. 2004, ApJ, 606, 258, doi: 10.1086/382774
- Wang et al. (2020) Wang, J., Xu, W., Lee, B., et al. 2020, ApJ, 903, 103, doi: 10.3847/1538-4357/abb9aa
- Wang et al. (2017) Wang, J., Koribalski, B. S., Jarrett, T. H., et al. 2017, MNRAS, 472, 3029, doi: 10.1093/mnras/stx2073
- Wang et al. (2021) Wang, J., Staveley-Smith, L., Westmeier, T., et al. 2021, ApJ, 915, 70, doi: 10.3847/1538-4357/abfc52
- Wang et al. (2022) Wang, S., Wang, J., For, B.-Q., et al. 2022, ApJ, 927, 66, doi: 10.3847/1538-4357/ac4270
- Westmeier et al. (2011) Westmeier, T., Braun, R., & Koribalski, B. S. 2011, MNRAS, 410, 2217, doi: 10.1111/j.1365-2966.2010.17596.x
- Westmeier et al. (2021) Westmeier, T., Kitaeff, S., Pallot, D., et al. 2021, MNRAS, 506, 3962, doi: 10.1093/mnras/stab1881
- Wolter et al. (2015) Wolter, A., Esposito, P., Mapelli, M., Pizzolato, F., & Ripamonti, E. 2015, MNRAS, 448, 781, doi: 10.1093/mnras/stv054
- Wright et al. (2010) Wright, E. L., Eisenhardt, P. R. M., Mainzer, A. K., et al. 2010, AJ, 140, 1868, doi: 10.1088/0004-6256/140/6/1868
- Yang et al. (2007) Yang, X., Mo, H. J., van den Bosch, F. C., et al. 2007, ApJ, 671, 153, doi: 10.1086/522027
- Yoon et al. (2017) Yoon, H., Chung, A., Smith, R., & Jaffé, Y. L. 2017, ApJ, 838, 81, doi: 10.3847/1538-4357/aa6579
- Yun et al. (1994) Yun, M. S., Ho, P. T. P., & Lo, K. Y. 1994, Nature, 372, 530, doi: 10.1038/372530a0
- Zabel et al. (2019) Zabel, N., Davis, T. A., Smith, M. W. L., et al. 2019, MNRAS, 483, 2251, doi: 10.1093/mnras/sty3234
- Zabludoff & Mulchaey (1998) Zabludoff, A. I., & Mulchaey, J. S. 1998, ApJ, 496, 39, doi: 10.1086/305355
- Zahid et al. (2012) Zahid, H. J., Dima, G. I., Kewley, L. J., Erb, D. K., & Davé, R. 2012, ApJ, 757, 54, doi: 10.1088/0004-637X/757/1/54