Vol.0 (20xx) No.0, 000–000
22institutetext: CAS Key Laboratory of FAST,National Astronomical Observatories, Chinese Academy of Sciences, Beijing 100101, China, ∗corresponding author: mz@nao.cas.cn
33institutetext: School of Astronomy and Space Science,University of Chinese Academy of Sciences, Beijing 100049, China
Extragalactic HI survey with FAST : First look of the pilot survey results
Abstract
As first data release of a pilot extragalactic HI survey with Five-hundred-meter Aperture Spherical radio Telescope (FAST),we extracted 544 extragalaxies from three-dimensional(3D) spectral data to perform interactive searching and computing, yielding global parameters for these detections, extending redshift ranges of HI 21cm line up to z = 0.04 ,which covers part of the sky region in right ascension(R.A. or ) and declination(Dec or ) range and . The S/N of 544 HI detections are greater than 5 flagged with code 1 to 4 based on baseline qualities or RFI contamination. Besides, we find 16 of which without any counterparts in the existing galaxy catalogs. The catalog can give a guidence for the future HI observation with FAST.
keywords:
HI survey: data release — galaxy: extragalaxies: HI 21cm line1 Introduction
Neutral atomic hydrogen(HI) is one of key tracer for studying the evolution of galaxy and matter distribution in the Universe. The hydrogen content in a galaxy is usually presented in three states: neutral molecular (), neutral atomic(HI) and ionized (HII). HI is usually the major phase observed in the outer regions of galaxy discs (Warren et al. 2004; Begum et al. 2005; Heald et al. 2011; Koribalski et al. 2018). HI emissions are also detected in filaments, plumes and/or bridges, tracing the gravitational interactions with neighbouring galaxies(Pearson et al. 2016; Koribalski et al. 2003; Meyer et al. 2004a). For many HI rich galaxies, the HI discs of spirals are usually much more extended than the stellar discs, leading to them highly susceptible to external forces such as tidal interactions, gas accretion, and ram pressure stripping, while providing fuel for star formation (Meurer 1996; Begum & Chengalur 2005; Bosma 2017; Serra et al. 2012; Koribalski et al. 2020). Therefore, the amount and extent of HI in galaxies varies significantly with environment (Cortese & Hughes 2009; Lemonias et al. 2013; Dénes et al. 2014; Stevens & Brown 2017).
Over the past decades, a number of HI surveys have being conducted to detect HI gas in the local Universe(Koribalski et al. 2020), including the the Parkes All-Sky Survey (HIPASS;(Staveley-Smith et al. 2000; Barnes et al. 2001; Meyer et al. 2004b)) in the southern hemisphere, and the Northern HIPASS extension (NHICAT;Wong et al. (2006)), and the Effelsberg Bonn HI Survey (EBHIS;Kerp et al. (2011)) in north hemisphere. The Arecibo Legacy Fast ALFA Survey (ALFALFA;Giovanelli et al. (2005a)) provides improved spatial resolution and sensitivity over 7000 . These surveys have played a key role in mapping the HI distribution, revealing the gas properties of nearby galaxies and providing valuable census of the cosmic HI content at low redshift (Maddox et al. 2021; Jones et al. 2018; Koribalski et al. 2020). See (Koribalski et al. 2020) for a review of the HI surveys.
As the current largest single dish radio telescope in the world, one of the key scientific goals of FAST is to perform a blind extragalactic HI sky surveys over a cosmologcially signifcant volum to exploit its superior sensitivity and angular resolution(NAN et al. 2011). The FAST HI survey will enlarge the survey area to a solid angle of 23000 with the declination range of and up to a redshift of 0.35 to carry out a census of HI galaxies in the northern sky(Li et al. 2018; Jiang et al. 2019). As one of the long term scientific program, the extra-galactic HI survey is scheduled to be carried out simultaneously with serveral other projects(Galactic HI survey,Pulsar search,Fast Radio Burst search) in the Commensal Radio Astronomy Fast Survey (CRAFTS) with 19-beam receivers in 1.05-1.45 GHz frequency range(L band) since 2020(Li et al. 2018; Jiang et al. 2019). One of the focus of FAST HI survey is to investigate the HI Mass Function (HIMF) in lower redshifts and its dependence on galaxy group and cluster environment. The HIMF plays a key role in revealing the galactic evolution history as a function of redshifts and explaining several crises between observations and simulations at small scales in frame of Cold Dark Matter(CDM) model(Obreschkow et al. 2009; Duffy et al. 2012; Weinberg et al. 2015; Jones et al. 2018). For instance, the slope at the faint end of the HIMF (Springob et al. 2005b; Zwaan et al. 2005; Jones et al. 2018) is still a puzzle, various HI surveys measure an abundance of low-mass systems that is far less than the number of dark matter sub-halos inferred from numerical simulations (Briggs et al. 1997; Rosenberg & Schneider 2000; Barnes et al. 2001; Giovanelli et al. 2005a; NAN et al. 2011; Zhang et al. 2019; Klypin et al. 1999). With the superior sensitivity and large sky coverage, FAST should be able to detect thousands of low mass galaxies with HI masses less than M, and therefore will be able to increase the abundance of low mass HI galaxies and thus provide a viable solution to the “missing satellites” problem(Klypin et al. 1999; Moore et al. 1999; Strigari et al. 2007; Giovanelli et al. 2005a; Weinberg et al. 2015).Besides, according to the recent observations, some of the Milky Way(MW) subhalos predicted by CDM model are significantly more massive than those resulted from stellar kinematics in its satellites, suggesting that the MW is missing a portion of sub-halos, which is known as, the ”too big to fail”(TBTF) problem (Boylan-Kolchin et al. 2011, 2012). This phenomenon has been confirmed in M31 environment(Tollerud et al. 2014) as well as in a population of field dwarfs (Ferrero et al. 2012; Papastergis et al. 2015), which indicates that this paradox has nothing with environmental effects. The effective way to investigate the connection between observations and CDM predictions is offered by the rotational velocity function(Giovanelli & Haynes 2015; Peebles 2001; Klypin et al. 2015). The dark matter halo mass function corresponds to the rotational velocity function of galaxies. The rotational velocity of a galaxy can be inferred from its velocity width of HI profile as the HI gas can extend further than any other directly observable component. A large number of galaxies are required to derive the HI velocity function and to tackle the TBTF problem (Baldry et al. 2008; Zwaan et al. 2010; Papastergis et al. 2011; Cattaneo et al. 2014; Giovanelli & Haynes 2015; Ai & Zhu 2018; Papastergis et al. 2013; Zhang et al. 2020).
In order to test our ability to discriminate cosmic signals from radio-frequency interference and to optimize data-taking and calibration procedures, we have carried out a pilot HI survey. This paper present the first data release from this pilot HI survey, in a catalog containing 544 HI extragalaxies from the sky region in . Among them, 302 HI detections are also presented in th ALFALFA catalog over the same sky area at the range (Haynes et al. 2018), which enable us to make full comparaison for which measured by the FAST and ALFALFA. The FAST HI pilot survey was designed to cover a vast variety of cosmic environments, which includes several nearby high density regions like the Virgo superclusters in nearby Universe(Saintonge et al. 2008).
The rest of the paper is organized as following. In section 2,we briefly introduce the key FAST survey parameters and describe sky area covered, give an overview of the FAST observation and data processes and present a search of 544 detections. In section 3, we present the statistical properties of these detections and list 16 sources that no optical counterparts to meet them and discuss the implications of these galaxies. Finally in section 4 we summarise this work. We assume (Hubble Constant) =70 kms-1Mpc-1, (Density parameter of matter) = 0.3 and (Density parameter of dark energy) = 0.7 and we use nature unit for the light speed throughout the paper.
2 The Data
2.1 Sky Coverage
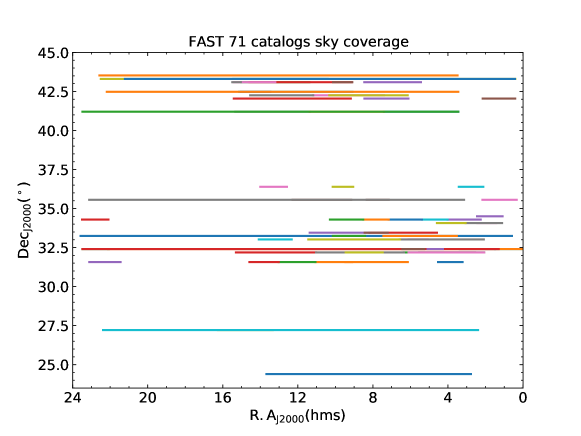
Figure.1 present the footprint of 71 discontinuous datacubes in this data release of the pilot HI survey. They are distributed in the range of and . These specific regions were surveyed as their zenith angles which requires FAST telescope parameters like sensitivity or resolution under the optimized status. By drift scanning sky areas over a larger R.A. range, and to test the performance of the whole FAST equipment in a varity of conditions during the pilot survey (NAN et al. 2011; Jiang et al. 2019; Zhang et al. 2020). In order to obtain some early science achievements, high density region of clusters in the northern sky are targeted as a foremost to discover meaning physics.
2.2 FAST Observations and Data Reduction
The data reported here was taken during the period of May 2020 to Aug 2021, and the pilot HI survey was carried out as a time-filler project when there are no other programs in the FAST observing queue. Although such type of project can not be planned for specified targets, we can still do blind search for HI 21cm emission. Our observational set-up was fixing the sky declination, and do drift scans during the project time. Each scan lasts for about 1-8 hours. We also use some commissioning time to do calibration observations. The FAST HI survey is carried out with the drift scan mode using FAST’s focal-plane 19-beam receiver system, which is set in a hexagonal array and works in dual polarization mode, with a frequency range from 1050 MHz to 1450 MHz. The 19-beam receiver was rotated by 23.4 degree so that the beam tracks are equally spaced in Declination with spacing(Li et al. 2018). For the backend, we choose the Spec(W) spectrometer which has 65536 channels covering the bandwidth of 500 MHz for each polarization and beam, with a velocity spacing of 1.67 km/s and a spectral resolution, after Hanning smoothing, about 5 km/s which is sufficient for resolving fine spectral structure and obtaining accurate column densities and velocity fields.
The raw data output from each drift scan observation were reduced using a python based data redution pipeline HIFAST which was developed by Jing et al. (in preparation). This pipeline consists of the following steps:(a) identify the calibratoin signal and calibrate the unit of the spectrum into kelvin. The calibration signal was from a standard 10K noise diode which is injected every 32 seconds. The detailed procedure was described in (Zhang et al. 2021);(b) convert the telescope pointing parameters to the precise position of R.A. and Dec for each spectrum ;(c) subtract the baseline for each spectrum using the asymmetrically reweighted penalized least squares algorithm (Baek et al. 2015);(d) calibrate the flux unit from Kelvin to Jy using the conversion factor 16 K/Jy (Jiang et al. 2019);(e) correct the Earth’s rotation and convert the redshift velocity from local standard of rest to the helicenter velocoty in Equatorial coordinate system;(e) finally,create the three-dimensional (3D) datacubes consist of R.A. and Dec, and Velocity in FITS data format. Once a data file is processed by the pipeline, the drift scan data were gridded to form 3D data cubes with spacing. To limit the size of the datacube, the velocity coverage of the datacube for the pilot survey is limitted to the range from to 19,000 km s-1.
Finally, we perform interactive search for 21cm signals from a galaxy in 71 datacubes as shown in Figure 1. The datacubes were displayed with the Starlink111http://starlink.eao.hawaii.edu/starlink software package and the HI emission sources were identified by human eyes and extracted manually. The final list of the HI catalog containing 544 sources is presented in Table 1.
2.3 Optical counterparts of the HI detections
For each HI detected source, we search for its optical counterparts using the NED database. Fields of around each HI detection were inspected. The counterparts were usually found within a circle of 1.5 arcmin radius centering at the HI source position, and the offset bewteen optical velocity and HI radio velocity is less than 300 km/s and the two redshifts is almost equal with error less than 0.001. Once optical sources are found within the search cone, we choose those sources with the type ”G” standing for a galaxy in NED. Most of the best matched counterparts were found to be from various existing catalogs such as the UGC catalog and NGC/IC catalog 222http://www.ngcicproject.org/, WISE catalog 333https://irsa.ipac.caltech.edu/frontpage/, 2MASS444http://egg.astro.cornell.edu/alfalfa/data/index.php catalog ,KUG555http://dbc.nao.ac.jp/cjads.html catalog, MRK666https://heasarc.gsfc.nasa.gov/W3Browse/rosat/markarian.html catalog, SDSS777http://skyserver.sdss.org catalog,MGC888https://heasarc.gsfc.nasa.gov/W3Browse/rosat/markarian.html catalog, PGC999http://cseligman.com/text/atlas/pgcmisc.htm and GALEX101010http://www.galex.caltech.edu/researcher/data.html catalog,and CGCG111111https://heasarc.gsfc.nasa.gov/W3Browse/galaxy-catalog/uzc.html. We also found that 302 FAST detections have been detected by ALFALFA and reported in the Arecibo General Catalog (AGC) 121212http://egg.astro.cornell.edu/alfalfa/data/index.php.
There are a few objects whose counterparts have not been attributed to the catalogs listed above, but they match equatorial coordinates and velocity of the FAST detected HI sources properly. These galaxies were found in the VizieR Online Data Catalog. Notes to individual galaxies are as listed in Table 1:
| FGC ID | Optical ID | (HI) | (HI) | (Opt.) | (Opt.) | position offset | cz (FAST HI) | cz (counterpart HI) | velocity offset |
|---|---|---|---|---|---|---|---|---|---|
| (arcmins) | km s-1 | km s-1 | km s-1 | ||||||
| (1) | (2) | (3) | (4) | (5) | (6) | (7) | (8) | (9) | (10) |
| 83 | [BKB95] 0242+4236B | 2 : 45 : 56.40 | 42 : 48 : 18.00 | 02h45m56s | +42d48.6m05s | 0.309 | 5039.3 | 5192.1 | 152.8 |
| 331 | LSBCF508-03 | 13 : 18 : 5.76 | 24 : 44 : 2.40 | 13h18m07.58s | +24d 44m 31.20s | 1.203 | 2725.3 | 2793.5 | 68.2 |
| 358 | SBS1415+437 | 14 : 17 : 3.36 | 43 : 29 : 42.00 | 14h17m01.408s | +43d30m05.47s | 1.13 | 637 | 616.1 | 20.9 |
| 376 | [TSK2008]1251 | 15 : 15 : 5.04 | 42 : 4 : 48.00 | 15h 15m 3.12s | +42d 4m 22.80s | 0.837 | 2388.8 | 2549.1 | 160.3 |
| 383 | KKR 65 | 22 : 2 : 6.72 | 42 : 8 : 56.40 | 22h 2m 6.00s | +42d 8m 56.40s | 0.143 | 4356.5 | 4426.3 | 69.8 |
| 388 | LCSBS2687P | 22 : 40 : 16.32 | 34 : 38 : 31.20 | 22h 40m 14.79s | +34d 38m 41.71s | 0.976 | 8404.1 | 8295.2 | 108.9 |
-
•
Col. 1 : FAST galaxies catalog identification (FGC ID) .
-
•
Col. 2 : Optical counterpart identification (Optical ID) number for these catalog detections
-
•
Col. 3 and Col. 4: The R.A. and Dec of FAST galaxies.
-
•
Col. 5 and Col. 6: The R.A. and Dec of Optical counterpart.
-
•
Col.7: the position offset of FAST and optical counterparts .
-
•
Col.7 and Col 8 : FAST source HI velocity and optical counterparts velocity.
-
•
Col.9 : velocity offset bewteen FAST and counterparts.
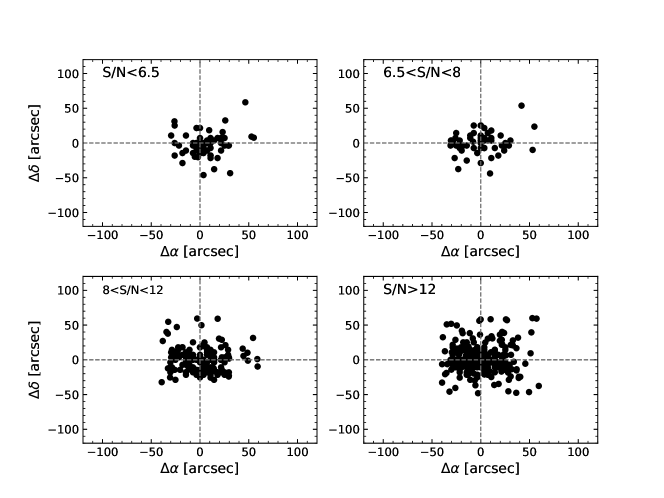
With the drift scan mode, most of the FAST observations are sampled at a fixed azimuth angle, and the zenith angle varies for different sources. To investigate possible dependence of the overall technical performance of the FAST telescope on pointing directions, we check the positional accuracy of the sources by comparing the HI detected position with the optical counterpart’s position. The foremost key limitation factor for the positional accuracy of FAST sources is the resolution of the FAST beams, which are in an approximately circle shape, with half power full widths of . The second key parameter affecting the quality of the FAST position accuracy is the S/N of the HI emission. High-S/N sources locate in more accurate centroids than those low-S/N ones. Positional accuracy can also be affected by other factors, including the systematic pointing offsets of telescope, asymmetry in the HI profiles and centers of the optical and HI emission, statistical errors in the HI sources and mismatch of optical counterparts. Figure.2 shows the position offsets between these HI sources and optical counteparts in the detected 527 sources, represented by black points. Each point stands for the offset of optical source’s RA and DEC coordinates from the center of a source coordinates in four different S/N panels. The average offset is about . Such accuracy is excellent considering the size of FAST beam. In the panel of S/N objects (S/N >12), the mean positions offset for R.A and Dec are 20.8 and 20.1 arcseconds, respectively. As for velocity offset bewteen copunterpart and HI emission for 544 sources are within 300 km s-1with the largest value 218.6 km/s and average is 94.7 km s-1
3 Results
3.1 Catalog Presentation
Here, we list 544 detections together with their optical counterparts in Table 2. The paper version lists 50 representives objects and the rest table are available online. All detections are obtained from 71 different data cubes with radio frequency interference(RFI) and background level abroadly removed. Table 3 show 50 of 527 sources and their optical counterparts with optical velocity, and the remaining HI sources and counterparts are available online. There are 16 sources that have been not matched optical counterparts so far as listed in table 4. The contents of the different columns in the table 1 and 3 respectively are:
-
•
Col. 1: FAST galaxies catalog identification (FGC ID).
-
•
Col. 2: Optical counterpart identification (Optical ID) number for these catalog detections.
-
•
Cols. 3 & 4: Centroid position of each HI source in R.A. and Dec, J(2000). The positional average accuracy is about 20\arcsecand the accuracy of the HI positions depends on source emission intensity.
-
•
Cols. 5 &6: J(2000) Dec and R.A. of the optical counterpart of the HI detection. Counterpart objects are examined based on spatial offset, morphology, galaxy type, magnitude, and velocity or redshift. If a HI source detection’s optical counterpart can not be found in the optial survey catalogs, the corresponding optical ID is kept empty.
-
•
Col. 7: Heliocentric redshift velocity of the HI sources, , taken at midpoint between the channels where the flux density reaches maximum value of the two flux peaks or one, Units are km s-1.
-
•
Col. 8: Velocity width of the spectrum line profile, , measured at the 50% level of the flux peaks, as in the description of Col. 6.
-
•
Col. 9: Integrated flux density of the source, , in Jansky km s-1(Jy km s-1). This is measured on the integrated full spectrum line after removing the baseline and background noise. Note that the uncertainty in the total flux calibration is about 10%, mostly due to the fact that no flux calibrators were measured during many of the drift scan observations, and we only use the average conversion factor 16 K/Jy to convert from TA scale to Jy scale.
-
•
Col. 10: Signal-to-noise ratio S/N of a detection for integral flux, the error in integral flux for each source usually is resulted from three parts: rms noise of each channel and the error from baseline fitting rms and integral range in line width W50. The total error is quantitatively estimated as the (Koribalski et al. 2004), the S/N for integral flux can be estimated as the format:
(1) where is the integral flux density in Jy km s-1,where is peak to noise ratio, is 5 km/s of velocity resolution. The detections are classified into four categories based on their S/N and baseline qualities with code 1 to 4 :(1) 422 sources with signal of S/N >6.5; (2) 61 sources with signal of ; (3) 28 sources with relatively poor baselines; (4) 33 sources that are partly masked by strong RFIs.
-
•
Col. 11: Background noise rms about 5 km s-1velocity resolution with rebinning cubes per 3 channels.
-
•
Col. 12: Object distance in unit of milli-parsecs (Mpc) from observational position, . The distance is simply ; is the recession velocity measured in the Cosmic Microwave Background reference frame and is the Hubble constant, for which we use a value of 70 km s-1Mpc-1.
-
•
Col. 13: Log10 values of HI mass in solar unit of a source. That parameter is obtained using the expression (Giovanelli & Haynes 2015).
-
•
Col. 14: The corresponding entry number in the Arecibo General Catalog(AGC), a special catalog of extragalactic objects measured by M.P.H. and R.G.(Haynes et al. 2018).
-
•
Col.15: Object code, sources with are labeled code 1, sources with are recorded as code 2 , and sources with relatively poor baselines or that are partly masked by strong RFIs are flagged with code 3 and 4, respectively.
| FGC ID | Optical ID | (HI) | (HI) | (Opt.) | (Opt.) | cz⊙ | W50 | S/N | Dist | AGC ID | Code | |||
|---|---|---|---|---|---|---|---|---|---|---|---|---|---|---|
| (km s-1) | (km s-1) | (Jy km s-1) | (mJy) | (Mpc) | () | |||||||||
| (1) | (2) | (3) | (4) | (5) | (6) | (7) | (8) | (9) | (10) | (11) | (12 ) | (13) | (14) | (15) |
| 1 | UGC12898 | 0 : 0 : 34.56 | 33 : 35 : 38.40 | 0h 0m 37.44s | +33d 36m 3.60s | 4638.3 | 168.1 | 3.0 | 15.6 | 2 | 66.3 | 9.5 | 1 | |
| 2 | UGC12920 | 0 : 2 : 23.04 | 27 : 12 : 10.80 | 0h 2m 23.04s | +27d 12m 39.60s | 7319.4 | 276.5 | 3.0 | 18.9 | 1.5 | 104.6 | 10 | 12920 | 1 |
| 3 | UGC00063 | 0 : 7 : 50.40 | 35 : 57 : 39.60 | 0h 7m 50.88s | +35d 57m 57.60s | 450.0 | 73.3 | 3.6 | 18.3 | 2.8 | 6.4 | 7.4 | 63 | 3 |
| 4 | UGC00069 | 0 : 8 : 9.84 | 27 : 31 : 33.60 | 0h 8m 11.04s | +27d 31m 40.80s | 4580.3 | 177.2 | 7.5 | 40.8 | 1.5 | 65.4 | 9.6 | 69 | 1 |
| 5 | KUG0008+355 | 0 : 10 : 42.24 | 35 : 50 : 56.40 | 0h 10m 41.76s | +35d 50m 56.40s | 6058.6 | 127.9 | 2.5 | 8.2 | 2.8 | 86.6 | 9.4 | 100068 | 4 |
| 6 | NGC0021 | 0 : 10 : 48.00 | 33 : 20 : 24.00 | 0h 10m 46.80s | +33d 21m 10.80s | 4865.4 | 349.4 | 1.0 | 7.7 | 2 | 69.5 | 9 | 100 | 1 |
| 7 | UGC00117 | 0 : 12 : 55.68 | 33 : 21 : 39.60 | 0h 12m 54.48s | +33d 21m 39.60s | 4609.3 | 207.1 | 5.1 | 23.1 | 2 | 65.9 | 9.7 | 117 | 1 |
| 8 | UGC00128 | 0 : 13 : 51.60 | 35 : 59 : 16.80 | 0h 13m 50.88s | +35d 59m 38.40s | 4469.2 | 216.7 | 10.8 | 28 | 2.8 | 63.9 | 9.8 | 128 | 1 |
| 9 | WISEAJ001713.37+271454.2 | 0 : 17 : 11.52 | 27 : 15 : 10.80 | 0h 17m 13.20s | +27d 14m 52.80s | 3686.6 | 150.8 | 1.9 | 11.5 | 1.5 | 52.7 | 8.9 | 101815 | 1 |
| 10 | 0 : 17 : 15.36 | 42 : 7 : 55.20 | 4844.4 | 215.7 | 4.6 | 16 | 2.7 | 69.2 | 9.7 | 1 | ||||
| 11 | UGC00221 | 0 : 23 : 11.04 | 27 : 26 : 13.20 | 0h 23m 10.80s | +27d 25m 55.20s | 3860.5 | 160.3 | 2.0 | 12.7 | 1.5 | 55.2 | 9.1 | 221 | 1 |
| 12 | WISEAJ002638.16+360018.7 | 0 : 26 : 36.48 | 35 : 59 : 52.80 | 0h 26m 38.16s | +36d 0m 18.00s | 7179.3 | 143.9 | 1.3 | 5.7 | 2.8 | 102.6 | 9.2 | 104539 | 3 |
| 13 | 0 : 28 : 32.40 | 33 : 15 : 50.40 | 0h 28m 34.32s | +33d 16m 19.20s | 4570.7 | 214.2 | 4.0 | 17 | 2 | 65.3 | 9.6 | 284 | 1 | |
| 14 | UGC00288 | 0 : 29 : 5.28 | 43 : 26 : 24.00 | 0h 29m 3.60s | +43d 25m 55.20s | 197.1 | 49.1 | 2.5 | 15.7 | 3 | 3.8 | 7.3 | 3 | |
| 15 | UGC00303 | 0 : 30 : 33.36 | 42 : 6 : 46.80 | 0h 30m 31.68s | +42d 6m 36.00s | 5424.1 | 36.2 | 0.7 | 5.2 | 2.7 | 77.5 | 9 | 2 | |
| 16 | MRK0953 | 0 : 37 : 10.56 | 35 : 53 : 49.20 | 0h 37m 12.24s | +35d 54m 10.80s | 4369.4 | 69.4 | 2.0 | 7.7 | 2.9 | 62.4 | 8.9 | 100346 | 1 |
| 17 | UGC00376 | 0 : 37 : 54.72 | 32 : 41 : 13.20 | 0h 37m 54.00s | +32d 41m 20.40s | 4734.9 | 205.7 | 8.4 | 30.7 | 1.9 | 67.6 | 10 | 376 | 1 |
| 18 | UGC00384 | 0 : 38 : 20.64 | 32 : 38 : 42.00 | 0h 38m 22.08s | +32d 38m 16.80s | 4615.7 | 186.7 | 7.2 | 26.3 | 2.4 | 65.9 | 9.9 | 384 | 1 |
| 19 | UGC00394 | 0 : 38 : 43.92 | 42 : 0 : 18.00 | 0h 38m 43.44s | +41d 59m 49.20s | 5393.5 | 60.8 | 0.8 | 5.4 | 2.7 | 77.1 | 9.1 | 1 | |
| 20 | NGC0226 | 0 : 42 : 53.76 | 32 : 35 : 2.40 | 0h 42m 54.00s | +32d 34m 51.60s | 4715.5 | 137.3 | 7.7 | 33.9 | 1.9 | 67.4 | 9.9 | 459 | 1 |
| 21 | IC0046 | 0 : 42 : 59.04 | 27 : 14 : 42.00 | 0h 42m 58.08s | +27d 15m 10.80s | 5126.2 | 221.9 | 2.9 | 13.7 | 1.5 | 73.2 | 9.3 | 100482 | 1 |
| 22 | MRK0346 | 0 : 44 : 54.96 | 27 : 26 : 52.80 | 0h 44m 56.88s | +27d 26m 60.00s | 5058.6 | 144.4 | 1.5 | 10.2 | 1.5 | 72.3 | 9.5 | 100499 | 1 |
| 23 | UGC00484 | 0 : 46 : 57.36 | 32 : 40 : 1.20 | 0h 46m 55.92s | +32d 40m 30.00s | 4795.0 | 408.2 | 15.1 | 40.7 | 1.9 | 68.5 | 10.2 | 484 | 1 |
| 24 | KPG017 | 0 : 47 : 1.20 | 32 : 41 : 31.20 | 0h 47m 3.12s | +32d 41m 2.40s | 4953.9 | 79.3 | 2.7 | 18.1 | 2.4 | 70.8 | 9.5 | 1730 | 1 |
| 25 | UGC00549 | 0 : 54 : 42.72 | 36 : 45 : 36.00 | 0h 54m 42.00s | +36d 45m 54.00s | 6045.7 | 68.2 | 0.6 | 5.2 | 3.1 | 86.4 | 9 | 4 | |
| 26 | UGC00602 | 0 : 58 : 21.36 | 36 : 44 : 16.80 | 0h 58m 23.28s | +36d 43m 48.00s | 6126.2 | 212.5 | 2.3 | 9.4 | 2.9 | 87.5 | 9.6 | 4 | |
| 27 | MCG +07-03-013 | 1 : 00 : 54.96 | 43 : 41 : 6.00 | 01h00m59.50s | +43d40m26.0s | 5000.6 | 200.1 | 2.2 | 8.5 | 3 | 71.4 | 9.4 | 1 | |
| 28 | KUG 0059+356 | 1 : 2 : 38.40 | 35 : 53 : 38.40 | 1h 2m 39.60s | +35d 53m 49.20s | 2184.3 | 84.1 | 1.4 | 6.5 | 2.9 | 31.6 | 8.4 | 115328 | 3 |
| 29 | KUG 0108+356 | 1 : 11 : 34.56 | 35 : 52 : 8.46 | 1h 11m 34.80s | +35d 53m 20.40s | 9446.6 | 129.0 | 1.5 | 6.3 | 2.9 | 135 | 9.7 | 115609 | 4 |
| 30 | KUG 0109+357 | 1 : 11 : 54.72 | 36 : 2 : 9.60 | 1h 11m 52.80s | +36d 1m 48.00s | 9505.0 | 99.2 | 1.8 | 52.2 | 2.9 | 135.8 | 10 | 115610 | 3 |
| 31 | 1 : 14 : 45.84 | 27 : 10 : 51.60 | 3570.7 | 100.0 | 5.0 | 22.1 | 1.5 | 51 | 8.8 | 1 | ||||
| 32 | CGCG502-074 | 1 : 24 : 9.84 | 32 : 45 : 28.80 | 1h 24m 10.80s | +32d 45m 57.60s | 5871.7 | 147.4 | 2.3 | 10.8 | 2.2 | 83.9 | 9.6 | 110302 | 1 |
| 33 | NGC0523 | 1 : 25 : 22.08 | 34 : 1 : 8.40 | 1h 25m 20.64s | +34d 1m 30.00s | 4902.3 | 459.7 | 1.8 | 11.7 | 2.1 | 70 | 9.3 | 979 | 1 |
| 34 | WISEAJ012622.06+323806.9 | 1 : 26 : 20.40 | 32 : 38 : 24.00 | 1h 26m 21.84s | +32d 38m 9.60s | 4079.8 | 63.8 | 1.0 | 6.2 | 2.4 | 58.3 | 8.9 | 115203 | 1 |
| 35 | NGC0573 | 1 : 30 : 49.44 | 41 : 15 : 21.60 | 1h 30m 49.44s | +41d 15m 25.20s | 2775.2 | 120.7 | 2.4 | 12.3 | 2.5 | 39.7 | 8.9 | 3 | |
| 36 | WISEAJ013141.69+340858.2 | 1 : 31 : 42.48 | 34 : 8 : 56.40 | 1h 31m 41.76s | +34d 8m 60.00s | 7095.5 | 59.8 | 0.8 | 6.1 | 2.1 | 101.4 | 9.3 | 115595 | 1 |
| 37 | WISEAJ013154.04+271945.5 | 1 : 31 : 52.56 | 27 : 19 : 51.60 | 1h 31m 54.00s | +27d 19m 44.40s | 3768.8 | 55.9 | 0.4 | 5.3 | 1.5 | 53.8 | 8.6 | 112516 | 2 |
| 38 | CGCG522-006 | 1 : 47 : 42.96 | 35 : 0 : 52.92 | 1h 47m 43.68s | +35d 1m 22.80s | 5475.6 | 91.7 | 3.7 | 18.2 | 2.8 | 78.2 | 9.7 | 110530 | 1 |
| 39 | NGC0672 | 1 : 47 : 54.48 | 27 : 25 : 51.60 | 1h 47m 54.48s | +27d 25m 58.80s | 406.0 | 195.4 | 120.4 | 455.8 | 1.5 | 5.8 | 8.5 | 1256 | 1 |
| 40 | CGCG482-017NED01 | 1 : 48 : 35.04 | 27 : 33 : 18.00 | 1h 48m 35.28s | +27d 32m 52.80s | 10473.9 | 131.5 | 2.4 | 15.3 | 1.5 | 149.6 | 9.8 | 110534 | 1 |
| 41 | IC1731 | 1 : 50 : 12.48 | 27 : 11 : 52.80 | 1h 50m 12.24s | +27d 11m 45.60s | 3536.9 | 174.8 | 6.7 | 26.9 | 1.5 | 50.5 | 9 | 1291 | 1 |
| 42 | UGC01347 | 1 : 52 : 45.36 | 36 : 36 : 43.20 | 1h 52m 45.84s | +36d 37m 8.40s | 5467.6 | 138.3 | 3.4 | 12.8 | 2.9 | 78.1 | 9.7 | 1 | |
| 43 | UGC01355 | 1 : 53 : 37.92 | 43 : 58 : 26.40 | 1h 53m 36.24s | +43d 57m 57.60s | 6076.3 | 282.9 | 2.4 | 7.5 | 3 | 86.8 | 9.6 | 1 | |
| 44 | 1 : 56 : 49.68 | 34 : 8 : 27.60 | 4739.3 | 385.4 | 2.7 | 18.4 | 2.1 | 67.7 | 9.5 | 1 | ||||
| 45 | WISEA J015708.84+354852.0 | 1 : 57 : 9.60 | 35 : 48 : 54.00 | 1h 57m 7.92s | +35d 48m 25.20s | 4441.9 | 181.7 | 2.7 | 8.8 | 2.9 | 63.5 | 9.3 | 115626 | 1 |
| 46 | UGC01422 | 1 : 57 : 8.16 | 32 : 47 : 20.40 | 1h 57m 6.72s | +32d 47m 20.40s | 4367.7 | 267.3 | 0.4 | 5.7 | 1.8 | 62.4 | 8.6 | 1422 | 2 |
| 47 | NGC0753 | 1 : 57 : 41.04 | 35 : 54 : 57.60 | 1h 57m 42.24s | +35d 54m 57.60s | 4710.8 | 375.6 | 18.5 | 42.9 | 2.8 | 67.3 | 10 | 1437 | 1 |
| 48 | KUG 0156+324 | 1 : 59 : 7.92 | 32 : 43 : 30.00 | 1h 59m 9.36s | +32d 43m 4.80s | 4304.9 | 168.9 | 5.1 | 26.6 | 1.8 | 61.5 | 9.7 | 115273 | 1 |
| 49 | UGC 01472 | 1 : 59 : 57.36 | 34 : 20 : 9.60 | 1h 59m 58.90s | +34d 20m 35.00s | 4725.6 | 131.5 | 1.5 | 9 | 2.1 | 67.5 | 9.2 | 1472 | 1 |
| 50 | 2 : 6 : 30.96 | 43 : 51 : 36.00 | 5197.1 | 187.6 | 2.5 | 8.4 | 3 | 74.2 | 9.5 | 1 |
In Table 3, we show the first 50 sources of 527 counterparts with basic parameters, for which column (1) to column (6) are FGC ID, optial ID, HI line velocity, optical velocity, apparent magnitude and objects type,respectively. Here HI radio velocity has been transformed to optical velocity in columns (3).
| FGC ID | Optical ID | HI Velocity(optical) | Optical velocity | Magnitude | Galaxy type | |
|---|---|---|---|---|---|---|
| (km s-1) | (km s-1) | (grb -band) | ||||
| (1) | (2) | (3) | (4) | (5) | (6) | |
| 1 | UGC12898 | 4711.1 | 4780 | 16.5 | G | |
| 2 | UGC12920 | 7502.4 | 7613 | 15.48 | G | |
| 3 | UGC00063 | 450.7 | 441 | 15.34 | G | |
| 4 | UGC00069 | 4651.4 | 4637 | 14.49 | G | |
| 5 | KUG0008+355 | 6183.4 | 6159 | 15.5 | G | |
| 6 | NGC0021 | 4945.6 | 4765 | 13.51 | G | |
| 7 | UGC00117 | 4681.2 | 4754 | 14.78 | G | |
| 8 | UGC00128 | 4536.8 | 4531 | 16.5 | G | |
| 10 | WISEAJ001713.37+271454.2 | 3732.5 | 3704 | G | ||
| 12 | UGC00221 | 3910.9 | 3905 | 14.66 | G | |
| 13 | WISEAJ002638.16+360018.7 | 7355.3 | 7302 | UvS | ||
| 14 | UGC00284 | 4641.4 | 4732 | 14.71 | G | |
| 15 | UGC00288 | 197.3 | 187 | 16 | G | |
| 16 | UGC00303 | 5524.0 | 5623 | 16.5 | G | |
| 17 | MRK0953 | 4434.0 | 4441 | 15.5 | G | |
| 18 | UGC00376 | 4810.8 | 4820 | 16 | G | |
| 19 | UGC00384 | 4687.9 | 4702 | 14.43 | G | |
| 20 | UGC00394 | 5492.3 | 5596 | 15.1 | G | |
| 21 | NGC0226 | 4790.9 | 4830 | 14.31 | G | |
| 22 | IC0046 | 5215.3 | 5286 | 14.75 | G | |
| 23 | MRK0346 | 5145.3 | 5186 | 16.5 | G | |
| 24 | UGC00484 | 4872.9 | 4864 | 13.86 | G | |
| 26 | UGC00549 | 6170.0 | 6062 | 15.79 | G | |
| 27 | UGC00602 | 6253.9 | 6145 | 14.68 | G | |
| 29 | KUG 0059+356 | 2226.4 | 2205 | 16.5 | G | |
| 30 | KUG 0108+356 | 9753.7 | 9789 | 16.5 | G | |
| 31 | KUG 0109+357 | 9816.0 | 9741 | 17.5 | G | |
| 33 | CGCG502-074 | 5988.9 | 6024 | 15.6 | G | |
| 34 | NGC0523 | 4983.8 | 4761 | 12.3B | G | |
| 35 | WISEAJ012622.06+323806.9 | 4136.0 | 4135 | UvES | ||
| 36 | NGC0573 | 2801.1 | 2788 | 14.1 | G | |
| 37 | WISEAJ013141.69+340858.2 | 7267.4 | 7262 | IrS | ||
| 38 | WISEAJ013154.04+271945.5 | 3816.7 | 3820 | G | ||
| 39 | CGCG522-006 | 5577.4 | 5559 | 14.79 | G | |
| 40 | NGC0672 | 406.6 | 429 | 11.47 | G | |
| 41 | CGCG482-017NED01 | 10852.8 | 10979 | 15.3 | G | |
| 42 | IC1731 | 3579.1 | 3503 | 14 | G | |
| 43 | UGC01347 | 5569.1 | 5543 | 13.49 | G | |
| 44 | UGC01355 | 6201.9 | 6322 | 13.97 | G | |
| 46 | [DF2014] 01 | 4508.6 | 4592 | G | ||
| 47 | UGC01422 | 4432.3 | 4583 | 14.35 | G | |
| 48 | NGC0753 | 4785.9 | 4858 | 12.97 | G | |
| 49 | KUG 0156+324 | 4367.6 | 4406 | 16.5 | G | |
| 50 | UGC 01472 | 4801.2 | 4849 | 16.07 | G | |
| 52 | UGC01601 | 5483.9 | 5591 | 15.49 | G | |
| 53 | UGC01602 | 5580.8 | 5489 | 16.5 | G | |
| 54 | UGC01626 | 5497.2 | 5543 | 14.11 | G | |
| 55 | KUG 0206+355 | 4985.5 | 4973 | 16 | G | |
| 56 | UGC01729 | 4492.0 | 4445 | 15.12 | G | |
| 57 | UGC01738 | 5570.8 | 5686 | 15.48 | G | |
| 58 | IC1784 | 5005.4 | 4817 | 14 | G |
3.2 General Properties of the Detections
We first describe some basic properties of the 544 HI detections by FAST. About 28.9% of FAST detections have cz <3000 km s-1. The detection rate decreases when the FAST survey scans a sky region much larger than the supergalactic plane and extends to the low density environment outside the northern part of the Virgo Cluster. In this data release we did not include any sources that are in any doubt of RFIs. Many tentative detections need to be confirmed with future observations and are not included in this catalog. Thus the HI detection rate with single pass of drift scan is much lower than that of ALFALFA. We estimate a detection rate of about 0.8 per square degree for the pilot FAST survey area of about 681 square degree, which is much lower than the average rate of 5.4 objects per square degree found in (Haynes et al. 2018) where the survey area crosses the northern part of the Virgo supercluster.
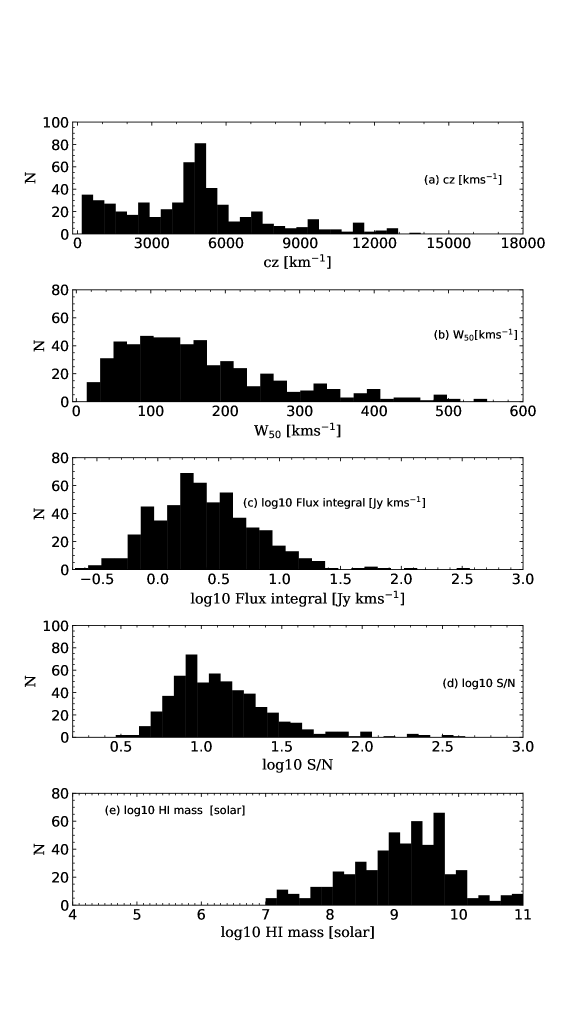
Figure 3 presents the distribution in values of heliocentric velocity cz, velocity width W50,S/N, and HI mass for the HI detections in our catalog. The distances are inferred from redshifts alone with the help of cosmic expansion dynamical theory. Due to the fact that many objects with less than 3000 km s-1are likely to be located in the Virgo Cluster sky region or even the local group region, the model yields great uncertainties caused by the peculiar motions. Thus, the real distance could be different from that listed in Table 2. However, it would be easy to scale the data once a more reliable distance is obtained. Plot (e) indicates somewhat over abundance in the sources with HI mass less than in our catalog, which could be due to the larger uncertainties in the distance measurements for the nearby sources.
The median redshift of the velocity distribution is 4681.33 km s-1and galaxies in this catalog have velocity widths which varies from 24.9 km s-1 to 539.3 km s-1(see Fig.3). Some detected sources with narrow spectra turn out to be nearby dwarf galaxie with low HI masses. The upper limit is at 539.3 km s-1for the line width, close to the upper-limit of the velocity width measured by previous HI samples (Koribalski et al. 2004; Springob et al. 2005a; Spekkens & Giovanelli 2006). It can also be seen that most of the line widths range from 100 to 200 km s-1, the fraction of line width more than 300 km s-1is significantly reduced and the largest line width is 539.3 km s-1. The third panel of Figure.3 shows the integrated flux distribution. The distribution of fluxes ranges from 0.21 to 365.8 Jy km s-1, and the median of the distribution is 2.3 Jykm s-1. The signal-to-noise ratios of the galaxies in Table 2 range from 5.1 to 436.8 with the lowest HI mass down to 7.1 logarithmic solar mass. As shown in the last panel of Fig.3, we found 36 galaxies with and the median of the mass distribution is M⊙, while the galaxy with the largest HI mass in this catalog is M⊙.
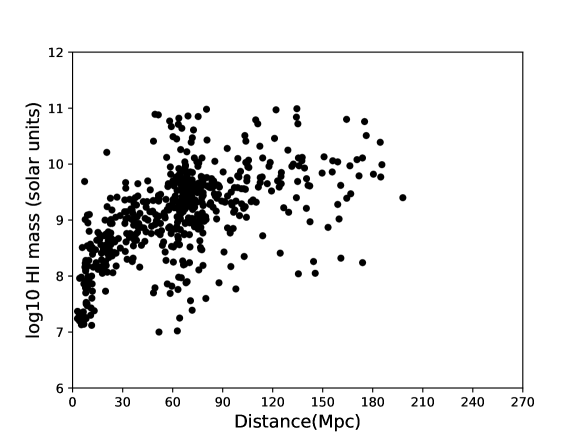
The distribution of the HI mass of the detections as a function of heliocentric recession velocity is presented in Figure 4.It shows that 72.4 percent of 544 sources were dectected within 120 Mpc and the farthest distance is 185.5 Mpc with HI mass about . There are 489 sources with HI mass less than .
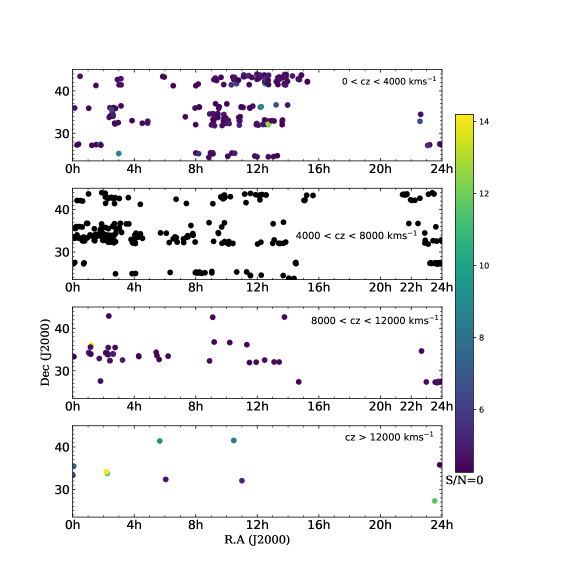
Furthermore, we show the S/N distribution in different velocity bins for all detections in Figure .5. Some galaxies, such as FGC 30,FGC 39, FGC 87, FGC 209,FGC 314, FGC 318, FGC 321, FGC 327 have very high S/N (), indicating that these galaxies have high HI fluxes. Some of them have very high HI masses, such as FGC 30, with a distance of 135.8 Mpc and HI mass of . In fact, a total of 55 gas rich galaxies have HI mass greater than . There are also many dwarf galaxies detected whitin the distance of 25 Mpc with HI mass larger than . FAST HI survey will detect large sample of these type of objects with its superior sensitivity and efficiency.
3.3 The properties of the FAST detections
The HI survey completeness can be defined as the fraction of cosmic sources of a given integrated flux density within the survey solid angle that are detected by a radio telescope(Giovanelli et al. 2005b). Although the sky coverage of the pilot survey is small, and the sky distributions of the datacubes are discontinuous, we can still try to get a sense of the completeness of the FAST survey.
Our results shows that the spectral noise level at 5 km/s resolution is about 2.5 mJy on average, which reaches the expected sensitivity of FAST for the one-pass drift scan survey. The detection threshold of a given spectral profile depends on both the shape and width of the profile. For wider profiles we can smooth the spectra further and the rms noise can decrease accordingly in term of the rms value of mJy, where res is the spectral resolution of the data after smoothing in unit of km s-1. The detection threshold is (Giovanelli et al. 2005b) can be obtained with the formula:
| (2) |
where S/N is a fiducial S/N for a detection and rms is the root mean square background noise at a pixel after smoothing spectrum line, the noise rms in unit of Jy and the width in km s-1.
Assuming a critical parameter of 200 km s-1as the
threshold width, for the one-pass drift scan of FAST survey, the
empirical relationship between the integrated flux density detection
threshold (,in Jy km s-1and the profile width (W50, in
km s-1) from the pilot observations of FAST survey can be expressed
in terms of the S/N ratio as (Giovanelli et al. 2005b; Haynes et al. 2011):
| (3) |
Note that the normalization factor of 0.11 here is different from that in Haynes et al. (2011) because the FAST data have a lower rms (2.5mJy at 5 km/s resolution) than that of ALFALFA (3.5mJy at 10 km/s resolution). It should also be noted that there are about 10% of uncertainties in the flux calibration for the pilot FAST survey data due to the lack of observation time for calibrator measurements.
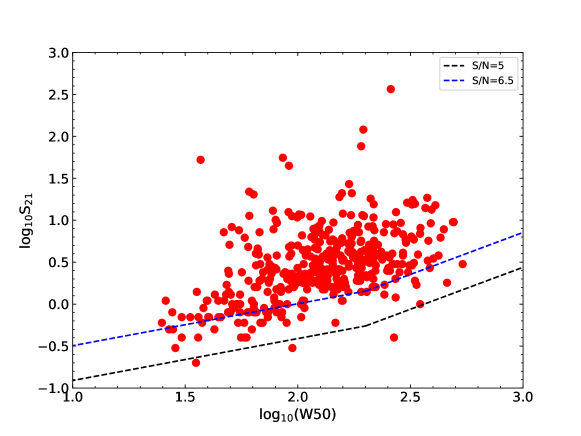
Figure 6 displays a plot of the HI integrated fluxes of the HI detections versus their line width. This figure shows that the flux sensitivity limit of the survey depends on the W50. Lower fluxes can be detected for smaller line widths in Eqs.3. The blue and black dashed lines in Fig 6 show the possible detection thresholds at levels of S/N =5 and 6.5,respectively. The median for a typical galaxy is 143.56km s-1. The flux is positively correlated with the line width. The integrate flux traces the HI gas mass, while the line width traces the galaxy rotation curve which is related to the total mass of the galaxy. These two parameters are naturally correlated with each other because the HI mass is correlated with the total mass of the galaxy(Ai & Zhu 2018; Guo et al. 2020).
Since the data from the FAST pilot survey were reduced with a HI pipeline in-development, the RFI mitigation and standing wave removal depend heavily on human interactions. The automated source finding codes for the FAST survey are also under developement, and the HI detections were identified by human eyes. Hence, it is possible that a few weak HI sources could be missed due to human mistakes or due to RFI contamination in the spectra. As shown in Figure 6, most of the detected sources have relately high S/N (with S/N 6.5). The sources with are relatively rare, suggesting that the HI sources in this S/N range were not completely identified. In the next section we will further evaluate the completeness of our FAST detetions by comparing with the ALFALFA dataset.
3.4 Comparison with ALFALFA detections
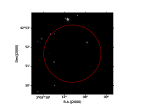
The ALFALFA Survey used the seven-horn Arecibo L-band Feed Array (ALFA) to blindly survey nearly 7000 of high Galactic latitude sky over 4400 nighttime hours(Haynes et al. 2018). Of the 544 FAST detected sources, 302 of them are also detected by ALFALFA. . Many of the FAST observed regions suffered serious RFI contamination, thus we chose two regions with less RFI effects to make fare comparision with the ALFALFA datasets. The left panel of Figure 7 compares the sources found in two Declinations range at with ,and with and and . In these ranges, FAST detect 194 sources, while ALFALFA contains 204 sources satisfying common heliocentric velocity range km s-1. The ALFALFA survey was conducted in two parts at and over . We found that more than 90% of the ALFALFA sources with peak flux more than 10 mJy are also detected by FAST. Of the 7 ALFALFA sources with peak fluxes less than 10 mJy, 5 of them are detected by FAST. There are about 10 to 20 percent of ALFALFA sources not detected by FAST due to RFI contamination.
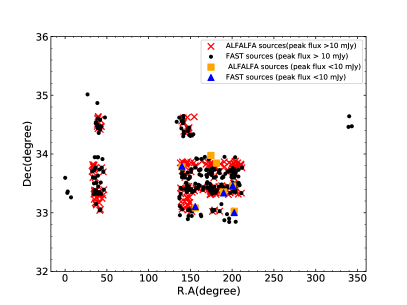
Figure 7 show the FAST detection rate is slightly lower than that of ALFALFA for the regions we compared. The detection rate is much lower in the edge of the FAST scan maps due to lower sensitivity in these area. Besides, there is strong RFIs in the frequency range of 1100–1300MHz which could impact the detection rate (Zhang et al. 2021). As a results, the baselines are poor for some FAST sources, and some galaxies’ spectra miss a part of the flux due to RFI masking.
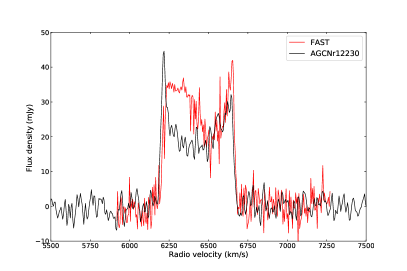
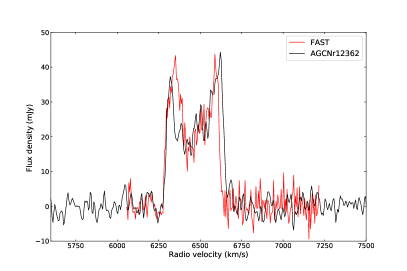
To futher check the telescope performance and our calibrations, we compare the FAST detected HI spectra with that of ALFALFA survey. Figure.9 show ten representative HI spectrum profiles overlaid with the corresponding ALFALFAL sources, where the x-axis labels the radio velocity in unit of and y-axis refers to the flux density in milliJansky (mJy). The spectra measured with FAST telescope matches that of ALFALFA within 10% of uncertainty. The FAST spectral resolution have been smoothed to 10 km/s to match that of ALFALFA(Haynes et al. 2018) and baseline fittings are general good for all sources.
| (4) |
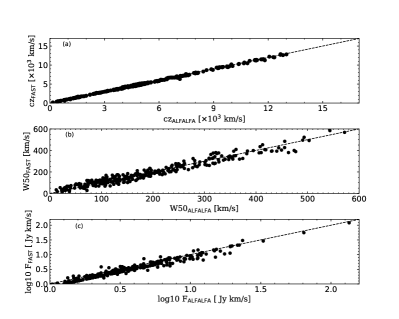
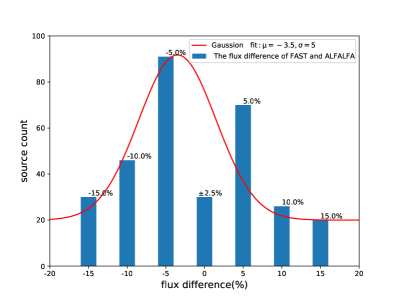
Figure.8 in left panel compares the ALFALFA measured values of velocity , line widths W50, and integrated fluxes to those measured with the FAST HI drift scan observations for the 302 galaxies in common. The mean offsets are 57.5 km/s,40.2 km/s,and standard deviation are 121.6 km/s, 30.7 km/s for the and measurements. The FAST integrated fluxes are somewhat smaller than that measured with ALFALFA, which could be due to poor baseline fitting or affected by RFIs and standing waves. The flux difference estimated with equation 4 for the 302 FAST-ALFALFA detected sources is presented as bar diagram in Figure 8 right panel. The flux differences are mostly with 15%. The mean offset and standard deviation for the gaussian fit to the bar char (Figure 8) are -3.5% and 5%, respectively. From these results,we find no significant difference bewteen the FAST and ALFALFA data sets considering the uncertainties in flux calibration for the pilot FAST HI survey which is about 10%.
![[Uncaptioned image]](/html/2204.05840/assets/x10.png)
![[Uncaptioned image]](/html/2204.05840/assets/x11.png)
![[Uncaptioned image]](/html/2204.05840/assets/x12.png)
![[Uncaptioned image]](/html/2204.05840/assets/x13.png)
![[Uncaptioned image]](/html/2204.05840/assets/x14.png)
![[Uncaptioned image]](/html/2204.05840/assets/x15.png)
![[Uncaptioned image]](/html/2204.05840/assets/x16.png)
![[Uncaptioned image]](/html/2204.05840/assets/x17.png)
![[Uncaptioned image]](/html/2204.05840/assets/x18.png)
![[Uncaptioned image]](/html/2204.05840/assets/x19.png)
![[Uncaptioned image]](/html/2204.05840/assets/x20.png)
![[Uncaptioned image]](/html/2204.05840/assets/x21.png)
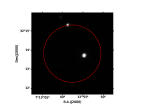
3.5 HI sources with no optical counterparts
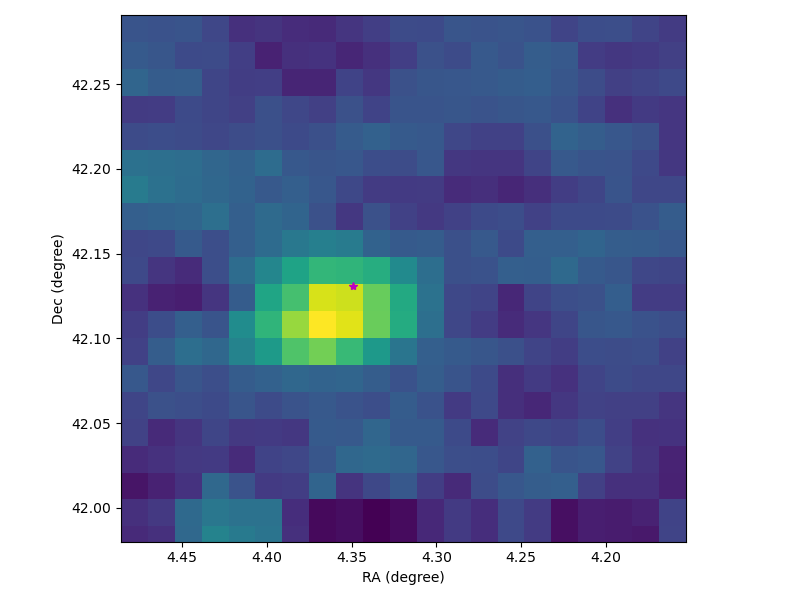
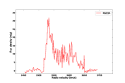
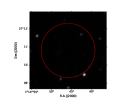
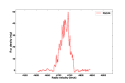
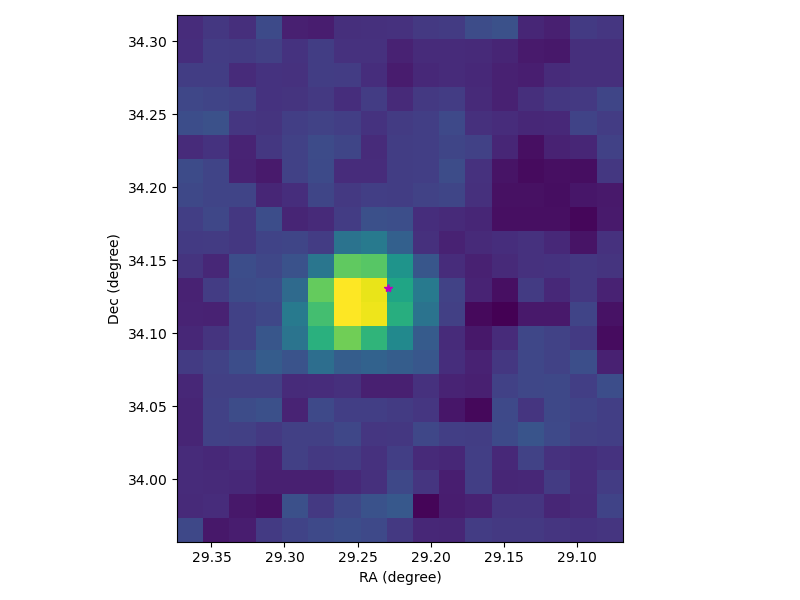
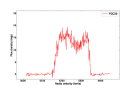
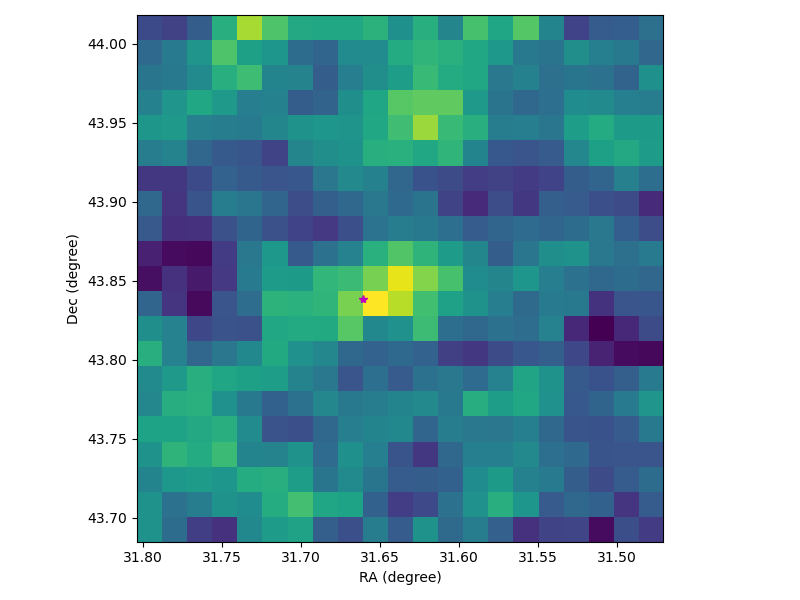
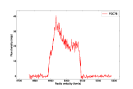
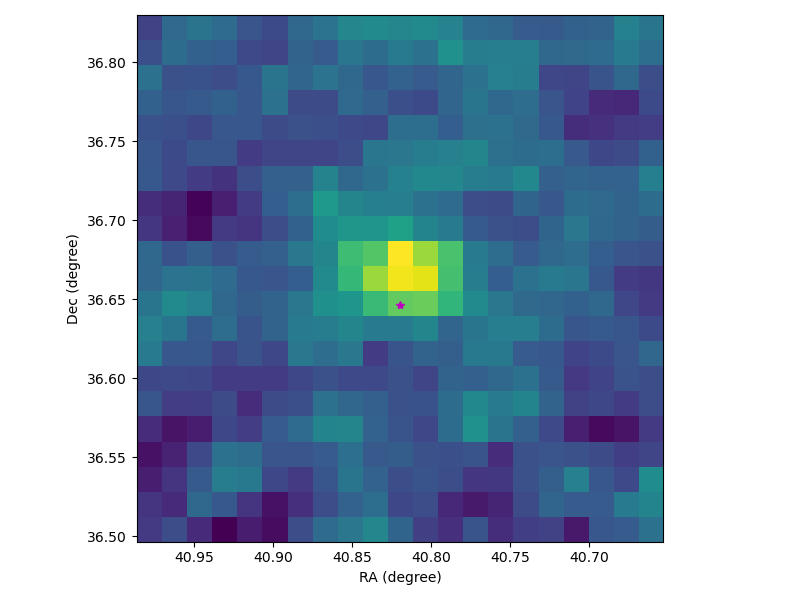
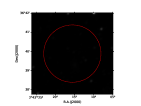
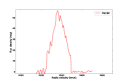
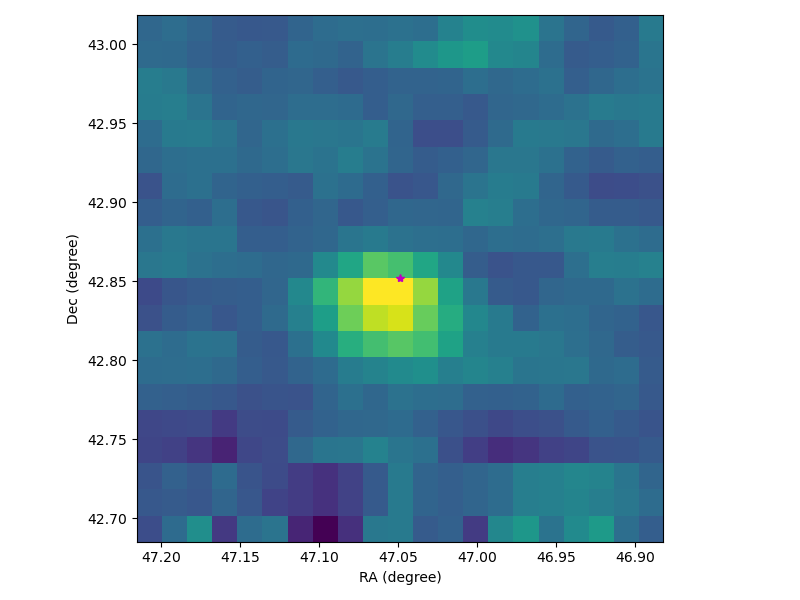
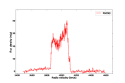
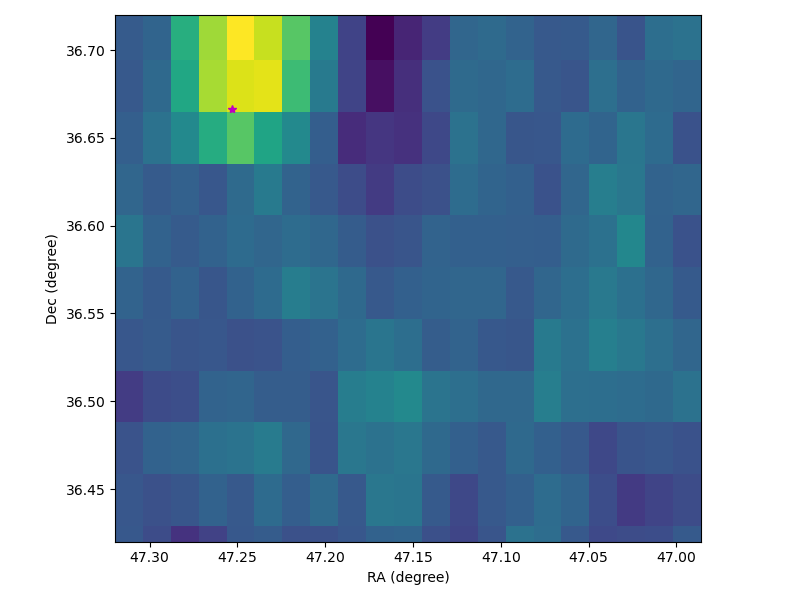
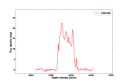
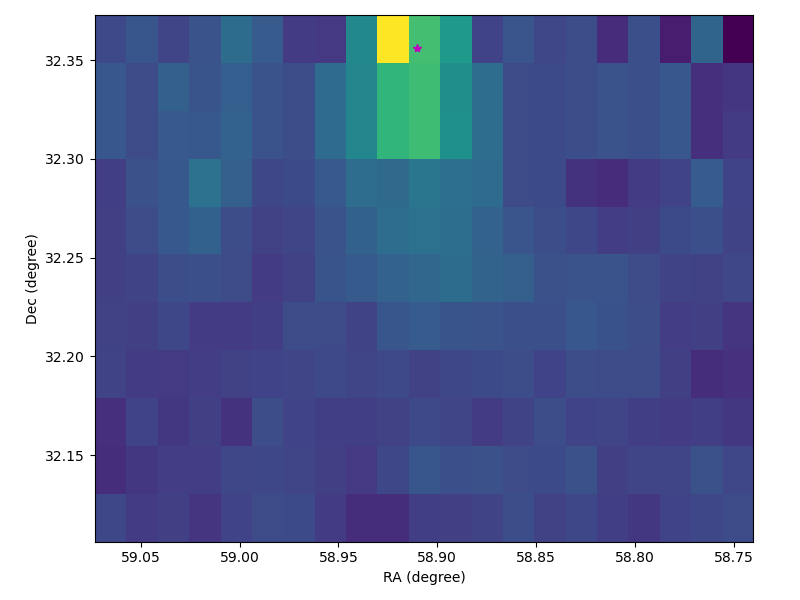
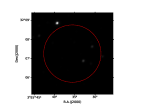
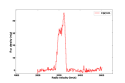
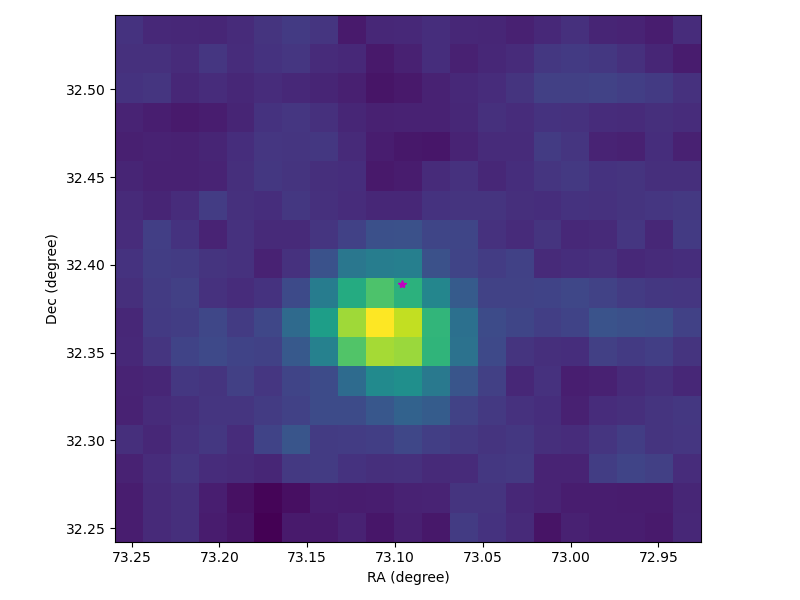
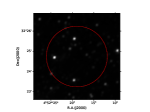
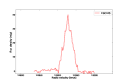
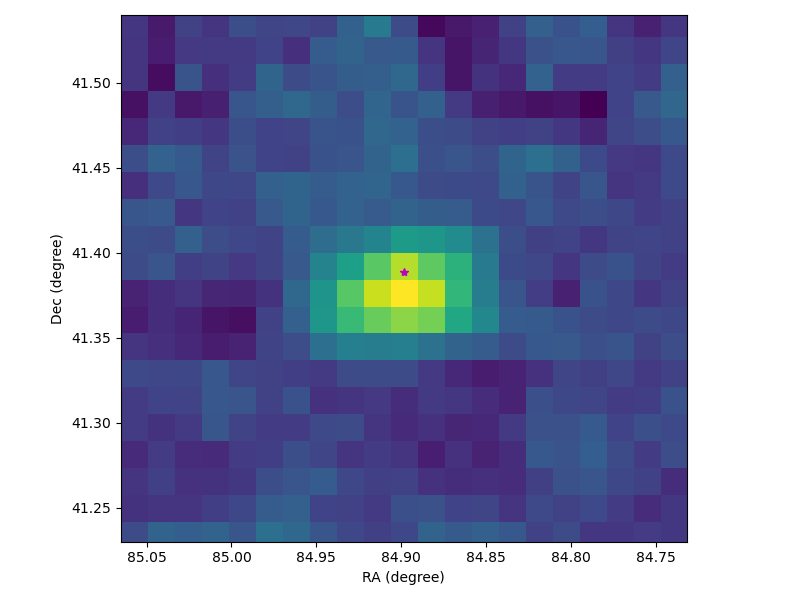
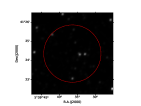
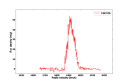
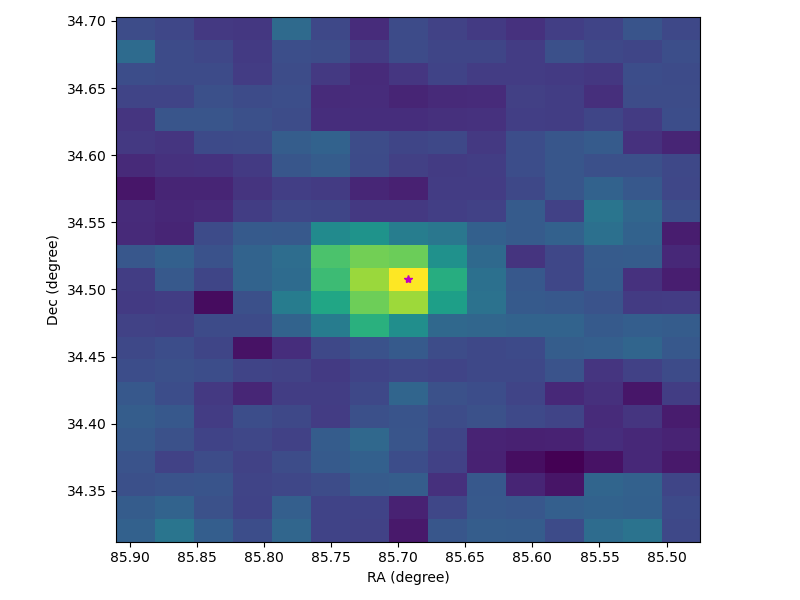
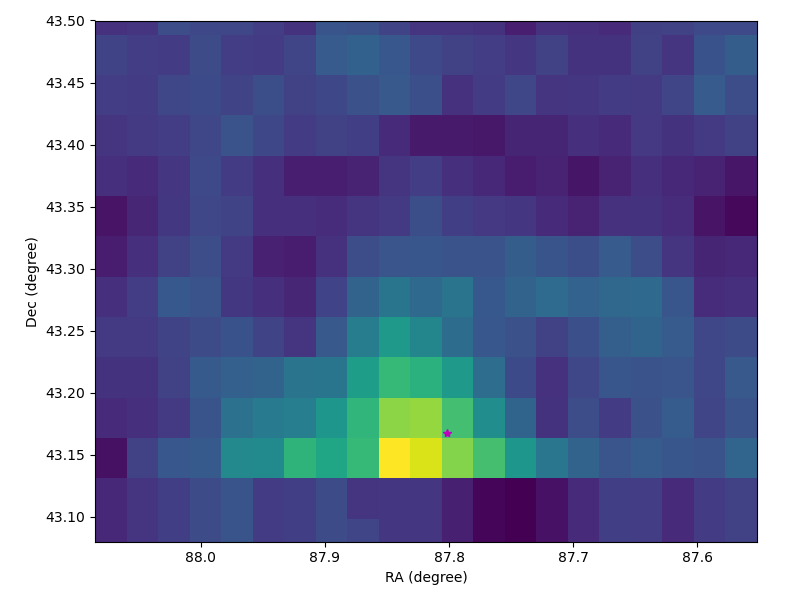
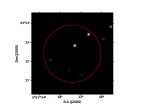
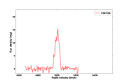
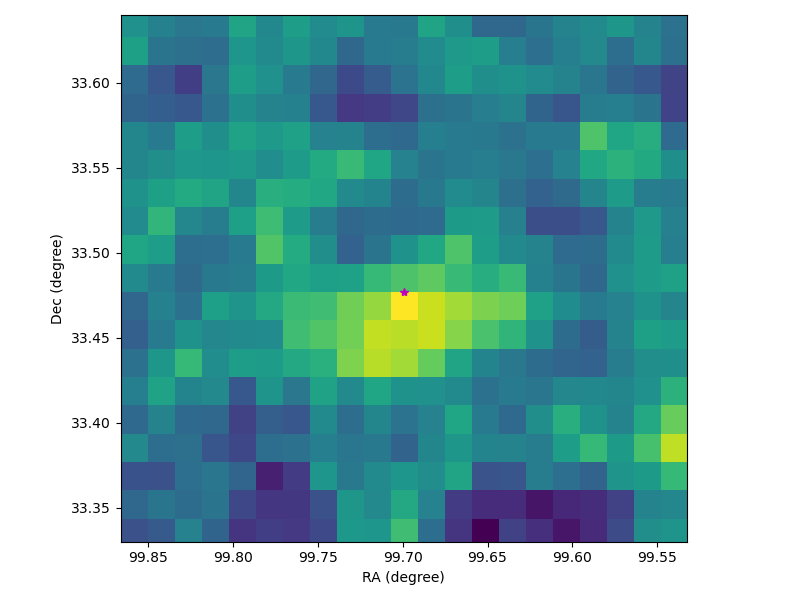
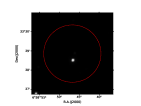
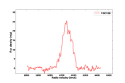
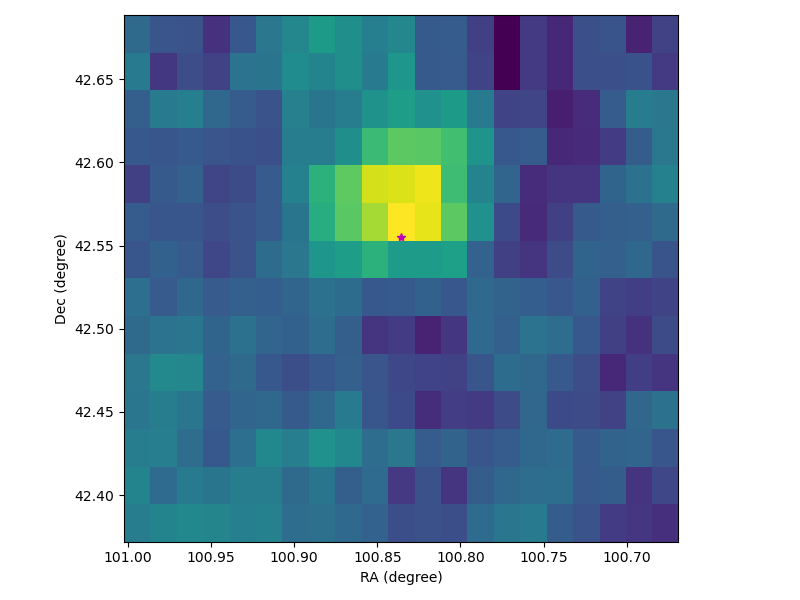
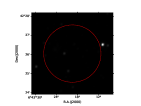
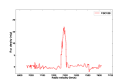
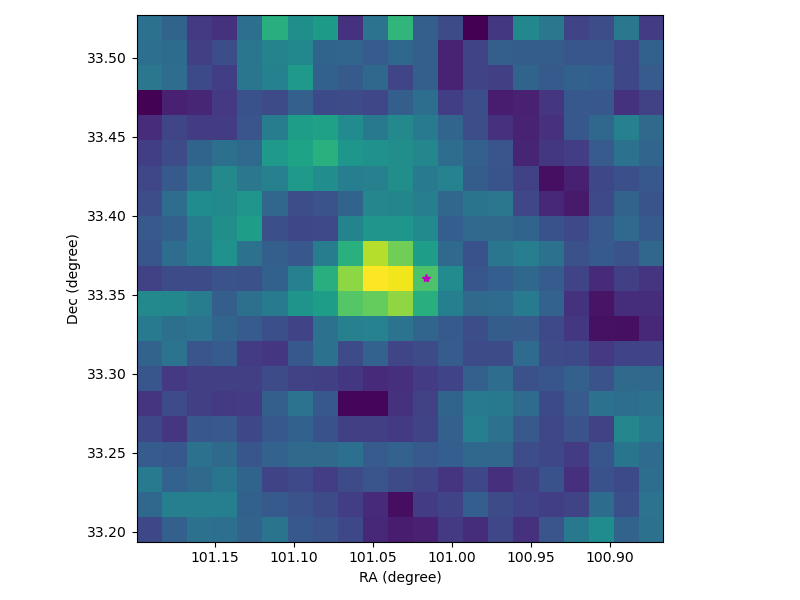
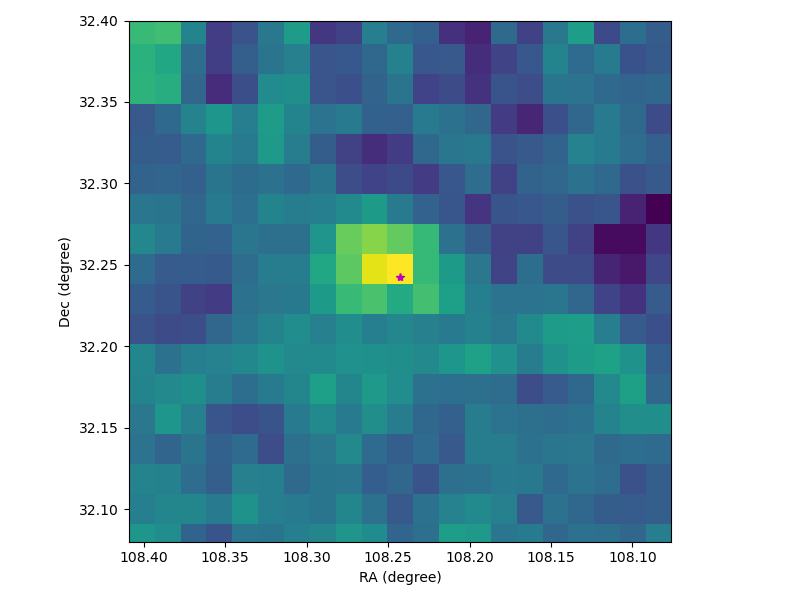
Figures 10 to 17 present the HI spectra and intensity color maps for the 16 sources listed in Table 4, for which no optical counterparts have been matched. Four of these sources, e.g. FGC 10,FGC 31, FGC 44, FGC 50, are located in regions not covered by current mainstream optical surveys, while other sources are within the optical survey area but they could be too faint to be detected by the optical surveys. It is possible that some HI detected sources are indeed optically dark galaxies, which have very low optical apparent magnitudes and are not detectable by optical telescopes. In Table 4, we mark the sources in the note column (12), where S stands for the sources that is too faint and beyond the SDSS survey detection limit of -22 magntitude in grz-band, while W depicts those beyond the WISE survey detection limit of -21 magntitude in W1/W2 band 131313https://www.legacysurvey.org/viewer/. Other parameters in this table are identical to that of Table 2.
From Table 4 we can see that the HI extragalaxies without optical counterparts have an R.A. range from 0 to 110∘ with a maximum redshift of 0.024, and their HI masses vary from to . The total HI flux of these galaxies ranges from 0.7 Jy km/s to 5 Jy km/s,and their line widths range from 25.9 to 385.4 km/s. Based on the measurement of the flux and line widths, the gas properties of these optically ”dark” galaxies appear to be normal. Future deep optical follow-up observations might be able to reveal some peculiar features in these type of galaxies.

| FGC ID | (HI) | (HI) | cz⊙ | W50 | S/N | Dist | logMHI | Code | Note | |||
|---|---|---|---|---|---|---|---|---|---|---|---|---|
| (km s-1) | (km s-1) | (Jy km s-1) | (mJy) | (Mpc) | () | |||||||
| (1) | (2) | (3) | (4) | (5) | (6) | (7) | (8) | (9) | (10) | (11) | (12) | |
| 10 | 00:17:15.34 | 42:07:56.85 | 4844.4 | 215.7 | 4.6 | 12 | 2.7 | 69.2 | 9.7 | 1 | W | |
| 31 | 01:14:45.78 | 27:10:52.49 | 3570.7 | 100 | 5 | 11.7 | 1.5 | 51 | 8.8 | 1 | S | |
| 44 | 01:56:49.57 | 34:08:27.17 | 4739.3 | 385.4 | 2.7 | 21 | 2.1 | 67.7 | 9.5 | 1 | W | |
| 50 | 02:06:31.00 | 43:51:34.95 | 5197.1 | 187.6 | 2.5 | 6.8 | 3 | 74.2 | 9.5 | 1 | W | |
| 78 | 02:43:16.03 | 36:39:57.10 | 5071.5 | 65.5 | 0.8 | 5.3 | 2.9 | 72.5 | 9 | 2 | W | |
| 92 | 03:08:09.38 | 42:51:36.83 | 2553.2 | 25.9 | 1.1 | 22.6 | 2.4 | 36.5 | 8.5 | 1 | S | |
| 93 | 03:08:35.36 | 36:27:17.10 | 3383.1 | 229 | 4 | 9.8 | 2.9 | 48.3 | 9.4 | 1 | W | |
| 105 | 03:55:35.52 | 32:08:02.40 | 4135.9 | 40.2 | 0.7 | 10.2 | 2.9 | 59.1 | 8.8 | 1 | W | |
| 121 | 04:52:18.91 | 32:24:42.31 | 3245.4 | 76.8 | 2.8 | 21.8 | 1.9 | 46.4 | 9.2 | 1 | W | |
| 125 | 05:39:35.00 | 41:24:22.29 | 12936 | 44.4 | 0.7 | 9.3 | 3.2 | 184.8 | 9.8 | 1 | W | |
| 126 | 05:42:42.34 | 34:30:36.77 | 5918.4 | 74.8 | 3 | 14.7 | 2.9 | 84.6 | 9.7 | 1 | W | |
| 127 | 05:51:15.75 | 43:22:24.11 | 3615.8 | 186.4 | 1.9 | 9.2 | 2.7 | 51.7 | 9.1 | 1 | W | |
| 136 | 06:38:46.83 | 33:28:52.43 | 5002.2 | 49 | 0.8 | 5.7 | 2.6 | 71.5 | 9 | 2 | W | |
| 138 | 06:43:20.56 | 42:26:04.06 | 6123 | 129.3 | 1.6 | 7.6 | 2.9 | 87.5 | 9.5 | 1 | W | |
| 139 | 06:44:6.72 | 33 :21:36.00 | 7296.9 | 36.1 | 0.4 | 5.8 | 2.6 | 104.2 | 9.1 | 2 | W | |
| 142 | 07:12:57.36 | 32 :13 48.00 | 4781.7 | 189.2 | 1.9 | 12.2 | 2 | 68.3 | 9.3 | 1 | W |
4 Summary
As first result from the FAST pilot HI survey, a catalog of 544 HI detections at sky region of are discribed in this work. All these sources as extragalactic objects and 527 of these sources can be matched with optical counterparts in online data archives. These detections are searched with a high confidence level in the accuracy of position and redshift. In the catalog, we have classified all sources into four categories based on their S/N and baseline qualities. Among them, 302 sources are also detected by ALFALFA. In regions not affected by RFI and standing waves, the FAST measured HI fluxes and profiles are consistent with that of ALFALFA. More than of ALFALFA detected sources with peak flux larger than 10 mJy were also detected in the FAST pilot HI survey. About 10 to 20 percent sources are missed due to RFI contamination. Our pilot study found 16 new detections without optical counterparts in redshift range . Some of them are quite massive in HI gas, but their optical fluxes could be too small to be dectected in optical wavelengths. These objects feature a few peculiar physical characteristics that deserve more further studies with multi-wavelength follow-up observations.
Acknowledgements.
We acknowledge the supports of the National Key RD Program of China No. 2017YFA0402600.This work has used the data from the Five-hundred-meter Aperture Spherical radio Telescope (FAST). FAST is a Chinese national mega-science facility, operated by the National Astronomical Observatories of Chinese Academy of Sciences (NAOC).This research has also made use of the NASA/IPAC Extragalactic Database (NED) which is operated by the Jet Propulsion Laboratory, California Institute of Technology, under contract with the National Aeronautics and Space Administration.This research has made use of the VizieR catalogue access tool, CDS,Strasbourg, France (DOI : 10.26093/cds/vizier).References
- Ai & Zhu (2018) Ai, M., & Zhu, M. 2018, ApJ, 862, 48
- Baek et al. (2015) Baek, S. K., Park, H. J., & Kim, B. J. 2015, The European Physical Journal B, 88
- Baldry et al. (2008) Baldry, I. K., Glazebrook, K., & Driver, S. P. 2008, Monthly Notices of the Royal Astronomical Society, 945
- Barnes et al. (2001) Barnes, D. G., Staveley-Smith, L., de Blok, W. J. G., et al. 2001, MNRAS, 322, 486
- Begum & Chengalur (2005) Begum, A., & Chengalur, J. N. 2005, MNRAS, 362, 609
- Begum et al. (2005) Begum, A., Chengalur, J. N., & Karachentsev, I. D. 2005, A&A, 433, L1
- Bosma (2017) Bosma, A. 2017, in Formation and Evolution of Galaxy Outskirts, ed. A. Gil de Paz, J. H. Knapen, & J. C. Lee, Vol. 321, 220
- Boylan-Kolchin et al. (2011) Boylan-Kolchin, M., Bullock, J. S., & Kaplinghat, M. 2011, Monthly Notices of the Royal Astronomical Society: Letters, 415, L40–L44
- Boylan-Kolchin et al. (2012) Boylan-Kolchin, M., Bullock, J. S., & Kaplinghat, M. 2012, Monthly Notices of the Royal Astronomical Society, 422, 1203–1218
- Briggs et al. (1997) Briggs, F. H., Sorar, E., Kraan-Korteweg, R. C., & van Driel, W. 1997, Publications of the Astronomical Society of Australia, 14, 37–44
- Cattaneo et al. (2014) Cattaneo, A., Salucci, P., & Papastergis, E. 2014, The Astrophysical Journal, 783, 66
- Cortese & Hughes (2009) Cortese, L., & Hughes, T. M. 2009, Monthly Notices of the Royal Astronomical Society, 400, 1225–1240
- Duffy et al. (2012) Duffy, A. R., Meyer, M. J., Staveley-Smith, L., et al. 2012, Monthly Notices of the Royal Astronomical Society, 426, 3385–3402
- Dénes et al. (2014) Dénes, H., Kilborn, V. A., & Koribalski, B. S. 2014, Monthly Notices of the Royal Astronomical Society, 444, 667–681
- Ferrero et al. (2012) Ferrero, I., Abadi, M. G., Navarro, J. F., Sales, L. V., & Gurovich, S. 2012, Monthly Notices of the Royal Astronomical Society, 425, 2817–2823
- Giovanelli & Haynes (2015) Giovanelli, R., & Haynes, M. P. 2015, The Astronomy and Astrophysics Review, 24
- Giovanelli et al. (2005a) Giovanelli, R., Haynes, M. P., Kent, B. R., et al. 2005a, The Astronomical Journal, 130, 2598–2612
- Giovanelli et al. (2005b) Giovanelli, R., Haynes, M. P., Kent, B. R., et al. 2005b, The Astronomical Journal, 130, 2613–2624
- Giovanelli et al. (2007) Giovanelli, R., Haynes, M. P., Kent, B. R., et al. 2007, The Astronomical Journal, 133, 2569–2583
- Guo et al. (2020) Guo, H., Jones, M. G., Haynes, M. P., & Fu, J. 2020, ApJ, 894, 92
- Haynes et al. (2011) Haynes, M. P., Giovanelli, R., Martin, A. M., et al. 2011, The Astronomical Journal, 142, 170
- Haynes et al. (2018) Haynes, M. P., Giovanelli, R., Kent, B. R., et al. 2018, The Astrophysical Journal, 861, 49
- Heald et al. (2011) Heald, G., Allan, J., Zschaechner, L., et al. 2011, in Tracing the Ancestry of Galaxies, ed. C. Carignan, F. Combes, & K. C. Freeman, Vol. 277, 59
- Jiang et al. (2019) Jiang, P., Yue, Y., Gan, H., et al. 2019, Commissioning Progress of the FAST, arXiv:1903.06324
- Jones et al. (2018) Jones, M. G., Haynes, M. P., Giovanelli, R., & Moorman, C. 2018, Monthly Notices of the Royal Astronomical Society, 477, 2–17
- Jones et al. (2018) Jones, M. G., Espada, D., Verdes-Montenegro, L., et al. 2018, A&A, 609, A17
- Kerp et al. (2011) Kerp, J., Winkel, B., Ben Bekhti, N., Flöer, L., & Kalberla, P. 2011, Astronomische Nachrichten, 332, 637–648
- Klypin et al. (2015) Klypin, A., Karachentsev, I., Makarov, D., & Nasonova, O. 2015, Monthly Notices of the Royal Astronomical Society, 454, 1798–1810
- Klypin et al. (1999) Klypin, A., Kravtsov, A. V., Valenzuela, O., & Prada, F. 1999, ApJ, 522, 82
- Koribalski et al. (2003) Koribalski, B., Gordon, S., & Jones, K. 2003, MNRAS, 339, 1203
- Koribalski et al. (2004) Koribalski, B. S., Staveley-Smith, L., Kilborn, V. A., et al. 2004, AJ, 128, 16
- Koribalski et al. (2018) Koribalski, B. S., Wang, J., Kamphuis, P., et al. 2018, MNRAS, 478, 1611
- Koribalski et al. (2020) Koribalski, B. S., Staveley-Smith, L., Westmeier, T., et al. 2020, Astrophysics and Space Science, 365
- Lemonias et al. (2013) Lemonias, J. J., Schiminovich, D., Catinella, B., Heckman, T. M., & Moran, S. M. 2013, The Astrophysical Journal, 776, 74
- Li et al. (2018) Li, D., Wang, P., Qian, L., et al. 2018, IEEE Microwave Magazine, 19, 112–119
- Maddox et al. (2021) Maddox, N., Frank, B. S., Ponomareva, A. A., et al. 2021, Astronomy Astrophysics, 646, 35
- Meurer (1996) Meurer, G. 1996, Star Clusters And The Duration Of Starbursts, HST Proposal
- Meyer et al. (2004a) Meyer, M. J., Zwaan, M. A., Webster, R. L., & et al. 2004a, VizieR Online Data Catalog, VIII/73
- Meyer et al. (2004b) Meyer, M. J., Zwaan, M. A., Webster, R. L., & et al. 2004b, VizieR Online Data Catalog, VIII/73
- Moore et al. (1999) Moore, B., Ghigna, S., Governato, F., et al. 1999, The Astrophysical Journal, 524, L19–L22
- NAN et al. (2011) NAN, R., LI, D., JIN, C., et al. 2011, International Journal of Modern Physics D, 20, 989–1024
- Obreschkow et al. (2009) Obreschkow, D., Croton, D., De Lucia, G., Khochfar, S., & Rawlings, S. 2009, The Astrophysical Journal, 698, 1467–1484
- Papastergis et al. (2013) Papastergis, E., Giovanelli, R., Haynes, M. P., Rodríguez-Puebla, A., & Jones, M. G. 2013, The Astrophysical Journal, 776, 43
- Papastergis et al. (2015) Papastergis, E., Giovanelli, R., Haynes, M. P., & Shankar, F. 2015, A&A, 574, A113
- Papastergis et al. (2011) Papastergis, E., Martin, A. M., Giovanelli, R., & Haynes, M. P. 2011, The Astrophysical Journal, 739, 38
- Pearson et al. (2016) Pearson, S., Besla, G., Putman, M. E., et al. 2016, MNRAS, 459, 1827
- Peebles (2001) Peebles, P. J. E. 2001, The Astrophysical Journal, 557, 495–504
- Rosenberg & Schneider (2000) Rosenberg, J. L., & Schneider, S. E. 2000, in Astronomical Society of the Pacific Conference Series, Vol. 218, Mapping the Hidden Universe: The Universe behind the Mily Way - The Universe in HI, ed. R. C. Kraan-Korteweg, P. A. Henning, & H. Andernach, 223
- Saintonge et al. (2008) Saintonge, A., Giovanelli, R., Haynes, M. P., et al. 2008, The Astronomical Journal, 135, 588
- Serra et al. (2012) Serra, P., Oosterloo, T., Morganti, R., et al. 2012, MNRAS, 422, 1835
- Spekkens & Giovanelli (2006) Spekkens, K., & Giovanelli, R. 2006, AJ, 132, 1426
- Springob et al. (2005b) Springob, C. M., Haynes, M. P., & Giovanelli, R. 2005b, ApJ, 621, 215
- Springob et al. (2005a) Springob, C. M., Haynes, M. P., Giovanelli, R., & Kent, B. R. 2005a, VizieR Online Data Catalog, VIII/77
- Staveley-Smith et al. (2000) Staveley-Smith, L., Koribalski, B. S., Stewart, I., et al. 2000, in Astronomical Society of the Pacific Conference Series, Vol. 217, Imaging at Radio through Submillimeter Wavelengths, ed. J. G. Mangum & S. J. E. Radford, 50
- Stevens & Brown (2017) Stevens, A. R. H., & Brown, T. 2017, Monthly Notices of the Royal Astronomical Society, 471, 447–462
- Strigari et al. (2007) Strigari, L. E., Bullock, J. S., Kaplinghat, M., et al. 2007, The Astrophysical Journal, 669, 676–683
- Tollerud et al. (2014) Tollerud, E. J., Boylan-Kolchin, M., & Bullock, J. S. 2014, Monthly Notices of the Royal Astronomical Society, 440, 3511–3519
- Warren et al. (2004) Warren, B. E., Jerjen, H., & Koribalski, B. S. 2004, in Dark Matter in Galaxies, ed. S. Ryder, D. Pisano, M. Walker, & K. Freeman, Vol. 220, 369
- Weinberg et al. (2015) Weinberg, D. H., Bullock, J. S., Governato, F., Kuzio de Naray, R., & Peter, A. H. G. 2015, Proceedings of the National Academy of Sciences, 112, 12249–12255
- Wong et al. (2006) Wong, O. I., Ryan-Weber, E. V., Garcia-Appadoo, D. A., et al. 2006, Monthly Notices of the Royal Astronomical Society, 371, 1855–1864
- Zhang et al. (2021) Zhang, B., Zhu, M., Wu, Z.-Z., et al. 2021, Monthly Notices of the Royal Astronomical Society, 503, 5385
- Zhang et al. (2021) Zhang, C.-P., Xu, J.-L., Wang, J., et al. 2021, arXiv e-prints, arXiv:2111.11018
- Zhang et al. (2019) Zhang, K., Wu, J., Li, D., et al. 2019, Science China Physics, Mechanics, and Astronomy, 62, 959506
- Zhang et al. (2020) Zhang, K., Wu, J., Li, D., et al. 2020, Monthly Notices of the Royal Astronomical Society, 500, 1741–1754
- Zwaan et al. (2010) Zwaan, M. A., Meyer, M. J., & Staveley-Smith, L. 2010, Monthly Notices of the Royal Astronomical Society, 403, 1969–1977
- Zwaan et al. (2005) Zwaan, M. A., Meyer, M. J., Staveley-Smith, L., & Webster, R. L. 2005, Monthly Notices of the Royal Astronomical Society: Letters, 359, L30–L34