The PADME beam line Monte Carlo simulation
The PADME experiment at the DANE Beam-Test Facility (BTF) of the INFN Laboratory of Frascati is designed to search for invisible decays of dark sector particles produced in electron-positron annihilation events with a positron beam and a thin fixed target, by measuring the missing mass of single-photon final states. The presence of backgrounds originating from beam halo particles can significantly reduce the sensitivity of the experiment. To thoroughly understand the origin of the beam background contribution, a detailed Geant4-based Monte Carlo simulation has been developed, containing a full description of the detector together with the beam line and its optical elements. This simulation allows the full interactions of each particle to be described, both during beam line transport and during detection, a possibility which represents an innovative way to obtain reliable background predictions.
1 Introduction
The PADME experiment [1, 2] at the DANE Beam-Test Facility (BTF) of the INFN Laboratory of Frascati (LNF) is designed to detect invisible decays of dark sector particles produced in positron on fixed target annihilation, by measuring the missing mass of single-photon final states. The experiment is equipped with a -thick active diamond target [3] which was struck by a positron beam with energy of in Run I (November 2018 to February 2019) and in Run II (2020) data-taking periods. Non-interacting positrons are deflected by a dipole magnet, while photons produced in annihilation are detected by a calorimeter (ECal) made of 616 BGO crystals [4]. The crystals are arranged in a cylindrical shape, with a central square hole, necessary to avoid the overwhelming Bremsstrahlung photon rate at small angles. To study detector performance, particle rates, signal acceptance and beam backgrounds, the full layout of the experiment is modeled using the Geant4 [5] simulation library. Run I used secondary positrons produced at the BTF target (upstream of the experimental hall) by high-energy electrons, followed by a few hours of running with primary positrons coming directly from the LINAC.
The original experiment simulation did not include any description of the beam line upstream of the PADME target. Instead, nominal beam parameters were used and particle tracking began at our target only. During this first running period, a non-negligible beam-related background component was discovered in data. Therefore an additional part of the beam transport line was added to the Geant4 description of the experimental setup. The updated setup was used to study the origin of this beam-related background and thereafter to optimize the beam line configuration for Run II, at a slightly lower energy and using the primary positron beam only. In this paper, we describe in detail the recent implementation of the beam line description and the main results achieved using the simulation, while highlighting the innovative way in which we simulate both accelerator transport and experimental detection in a single simulation program.
2 The PADME Experiment Monte Carlo simulation
A Geant4-based Monte Carlo (MC) simulation of the full experiment, called PadmeMC, was developed in the early stages of the project to obtain first sensitivity estimates for the dark photon search [1]. The PadmeMC simulation package has evolved since then into a complete framework, capable of implementing complex data output structures, more detailed descriptions of the detector geometry, and different configurations of the setup. The software development closely followed the design and construction of the experiment [6] and was largely exploited to define the detailed design of the experiment and the various sub-detectors. In particular, it has been used extensively to verify the impact that different proposed technical solutions would have on the resolution of the dark photon recoil mass measurement and to optimize the construction parameters.
During Run I, the control of beam-related backgrounds was understood to be of crucial importance for the sensitivity of the experiment. The total energy deposit in the PADME ECal due to beam halo photons needs to be below to avoid spoiling this sensitivity. Because this is an extremely challenging task for the BTF beam transport line when combined with the request of having positrons in long bunches, a detailed beam transportation simulation is essential. At the end of the run, PadmeMC was improved to include a full simulation of the BTF beam transport line. The simulation now features the two bending dipoles, the two focussing/defocussing quadrupole pairs, and the beam collimators.
In the standard running conditions of the experiment, each LINAC pulse reaching the target is filled with positrons, with mm-scale beam spot size and a few per-mil beam energy resolution. The beam intensity is thus defined by the number of positrons on target (NPOT). The beam bunches have length ranging from to roughly , depending on the configuration of the LINAC gun and the accelerating RF in its four power stations, with a fine micro-bunch structure given by the of the RF. The repetition rate is : in one second 49 pulses are delivered to the BTF line, and one is diverted by a pulsed dipole to a spectrometer line for monitoring the central value and spread of the beam momentum.
To simulate the interaction of beam particles with the active target, events with user-defined NPOT can be generated and transported into the BTF beam line. To cope with the different running conditions of PADME Run I and Run II, the simulation allows for the tuning of all relevant beam parameters:
-
•
Total duration and internal time structure of the positron bunch;
-
•
Energy spread, spatial distribution, beam emittance, and energy spread of the beam spot at the target.
2.1 Simulation physics
The PADME list of simulated physical processes is derived from the standard QGSP_BERT physics list provided by the Geant4 package. It includes multiple scattering, Coulomb scattering (Bhabha S and T channels), ionization, Bremsstrahlung emission, two-photon annihilation, synchrotron radiation emission, and, optionally, tracking of optical photons. Specific datacards allow the inclusion of photonuclear interactions and the selection of the high-precision neutron transport library to use.
Simulation of exotic particle production, such as annihilation with dark photon emission , is not part of the Geant4 physics package, and is handled instead by custom generators configurable via datacards. Higher-order radiative corrections to electromagnetic processes are also not implemented in Geant4, but can produce relevant background in searches for rare processes such as dark particle production. In the PADME Monte Carlo simulation, the kinematics of the three-gamma final state is produced externally to Geant4 using the CalcHEP [7] and BabaYaga [8, 9] generators.
3 The PADME beam line Monte Carlo simulation
The problem of conciliating the simulation of beam dynamics with beam-related backgrounds is of crucial importance to the larger HEP community, in particular for future very high-energy and intense beams. Few solutions to this problem exist; one example is G4BeamLine [10], which is not commonly used by the particle physics community. Recently, the BDSim framework, also based on Geant4, has been gaining momentum [11]. Although some beam line simulations using Geant4 were successfully realized in the past (e.g., the HARP experiment), in PADME we have achieved for the first time a simultaneous simulation within a single Geant4 program of both beam line and experiment, containing a full description of the transport line.
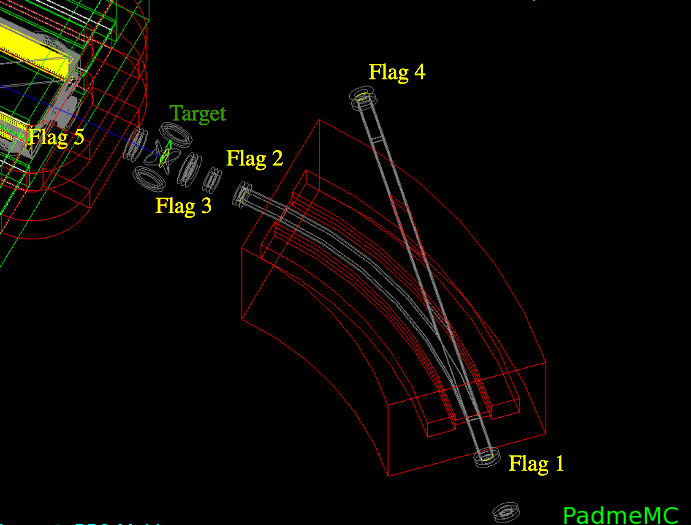
When compared to the PADME experimental data of Run I, simulations starting only from the target interaction were unable to reproduce the observed background, which was dominantly produced from the beam halo interaction with beam line materials. To identify the sources of such a beam background, a complete description of the last of the transfer line of the BTF was implemented in the simulation, adapting existing Geant4 classes. On the beam line, a set of virtual detectors called “Flags” (see Fig. 1) was introduced to monitor the effect of the optical elements on the beam spot size and shape.
3.1 Run I beam line simulation
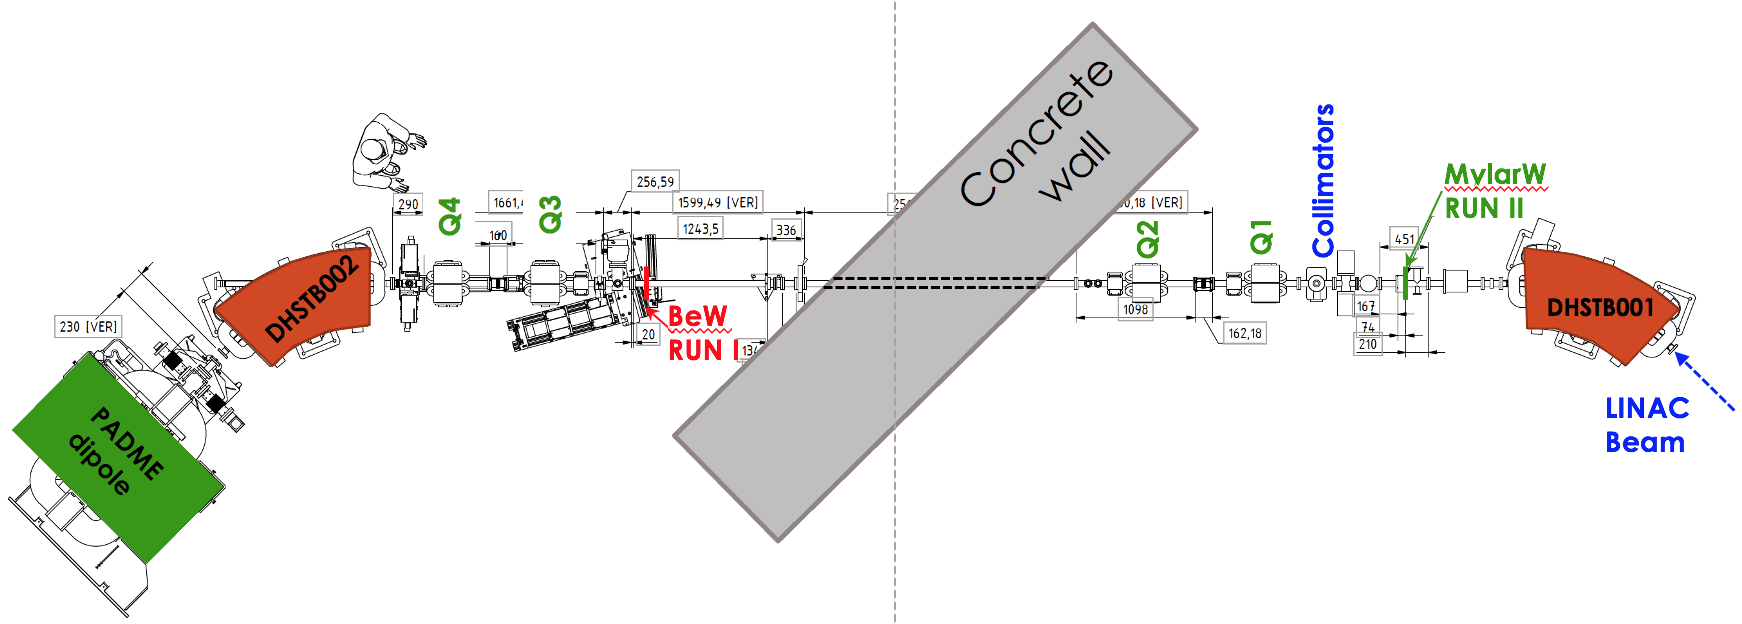
During Run I the beam transport line entering the PADME experiment was separated from the LINAC vacuum by means of a thick Berillium (Be) window, to protect the LINAC from possible vacuum leaks in the experimental setup. The window was placed inside the BTF hall just before the last quadrupole pair. This location is represented by a red line in Fig. 2. The Be window was suspected as the origin of the main component of the observed beam-related background, and therefore the line was initially simulated starting from this position.
3.2 Run II beam line simulation
To reduce the background on the detector, the PADME beam line was modified for Run II based on the simulation results. The main interventions were:
The main elements of the updated line were implemented in the new PADME beam line simulation, including the optics of the two pairs of quadrupoles ( and ).

In Fig. 3 the dipole magnets DHSTB001 and DHSTB002 are shown in red, the four quadrupoles (Q1-Q4) in green, the collimators (SLTB) in blue, and the MYLAR window flange also in red. To get a better understanding of the beam halo background, the two collimators SLTB3 (vertical, placed from the MYLAR window) and SLTB4 (horizontal, placed from the MYLAR window) were also simulated to more accurately reproduce the actual beam shape and energy resolution. The concrete wall separating the LINAC tunnel from the BTF hall is also simulated, to screen the experiment from background generated by the interaction between beam halo and collimators.
4 Beam line Monte Carlo simulation results
The PadmeMC beam line simulation has been used to study several aspects of the experiment:
-
•
Beam background levels during Run I and Run II;
-
•
Effect of the MYLAR window thickness;
-
•
Quadrupole settings of the transport line;
-
•
Beam energy resolution;
-
•
Absolute value of the positron beam energy.
In the next section we describe the capability of the simulation to reproduce the background generated in the experiment by interactions of the beam halo with beam line components and passive materials in the experiment. We also show how the simulation helps to understand the origin of the beam halo and how a significant reduction has been achieved.
4.1 Beam halo generation
During the last days of Run I and for the entirety of Run II, the experiment used a primary positron beam, i.e., the beam came directly from the LINAC instead of being generated via the secondary target. This choice was aimed at minimizing the production of background photons in the experimental area. For the same reason, the use of collimators to select a narrow momentum band of % was limited to the region downstream of the first bending magnet DHSTB001 (see Fig. 2), separated from the experimental area by a concrete wall more than a meter thick. All these conditions excluded the possibility that the photon background observed in the PADME calorimeter came from outside the beam pipe.
Using the Monte Carlo simulation of the beam transport along the line, the energy distribution of the beam was compared before and after the Be window. In a second step, the beam was also observed at the exit of the DHSTB002 dipole (Flag 2 in Fig. 1) just before the PADME target. Fig. 4 shows the effect of beam transport on the beam energy profile under these different conditions. Starting from the originally simulated pure Gaussian energy resolution of % (black distribution), the beam develops a low-energy tail after crossing the Be window (green distribution), which is partially cut off by the output flange of the DHSTB002 magnet (red distribution). The Be window thus generated significant Bremsstrahlung tails in the beam energy distribution, and the simulation also demonstrated that the low-energy tails were cut off due to particles hitting the border of the DHSTB002 exit vacuum pipe and connection flange.
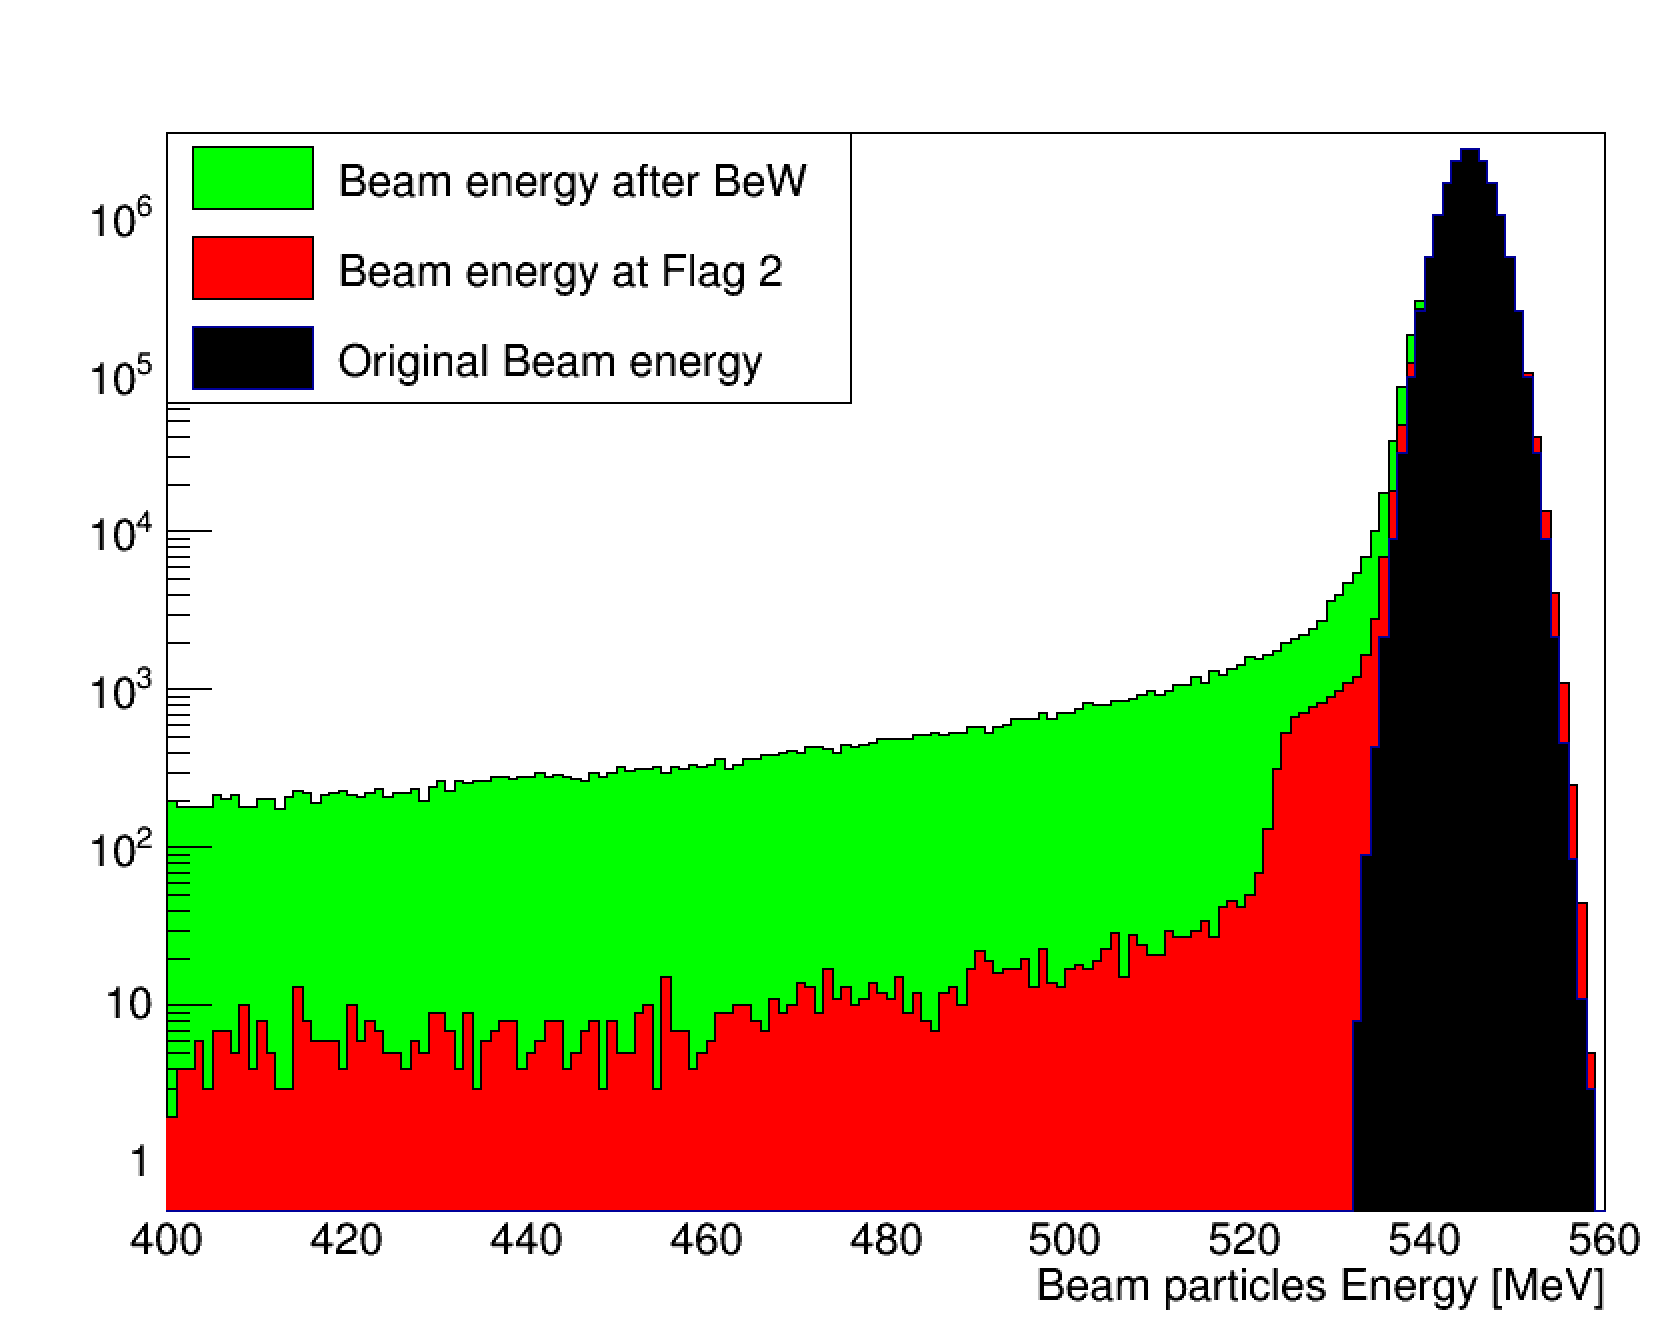
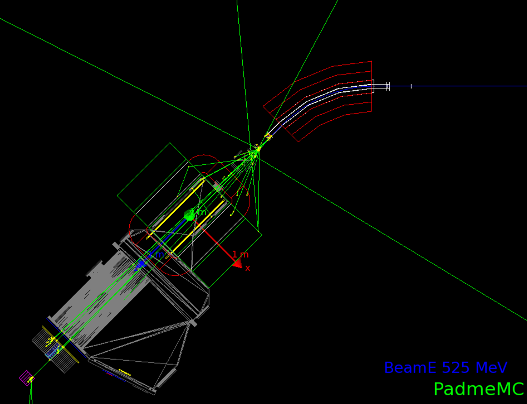
The low-energy tail corresponds to positrons losing a substantial fraction of their energy () in the interaction with the Be window, leaving the nominal beam trajectory and finally crashing onto the DHSTB002 exit vacuum pipe, as shown in Fig. 5. Some high-energy photons, generated by the interactions just described, were also able to reach the ECal by traveling inside the PADME vacuum system.
Therefore, before the start of Run II PADME decided to move the vacuum separation window farther upstream, closer to the DHSTB001 magnet, and to replace the Be window with a thinner MYLAR window.
4.2 Effect of the MYLAR window thickness on beam backgrounds
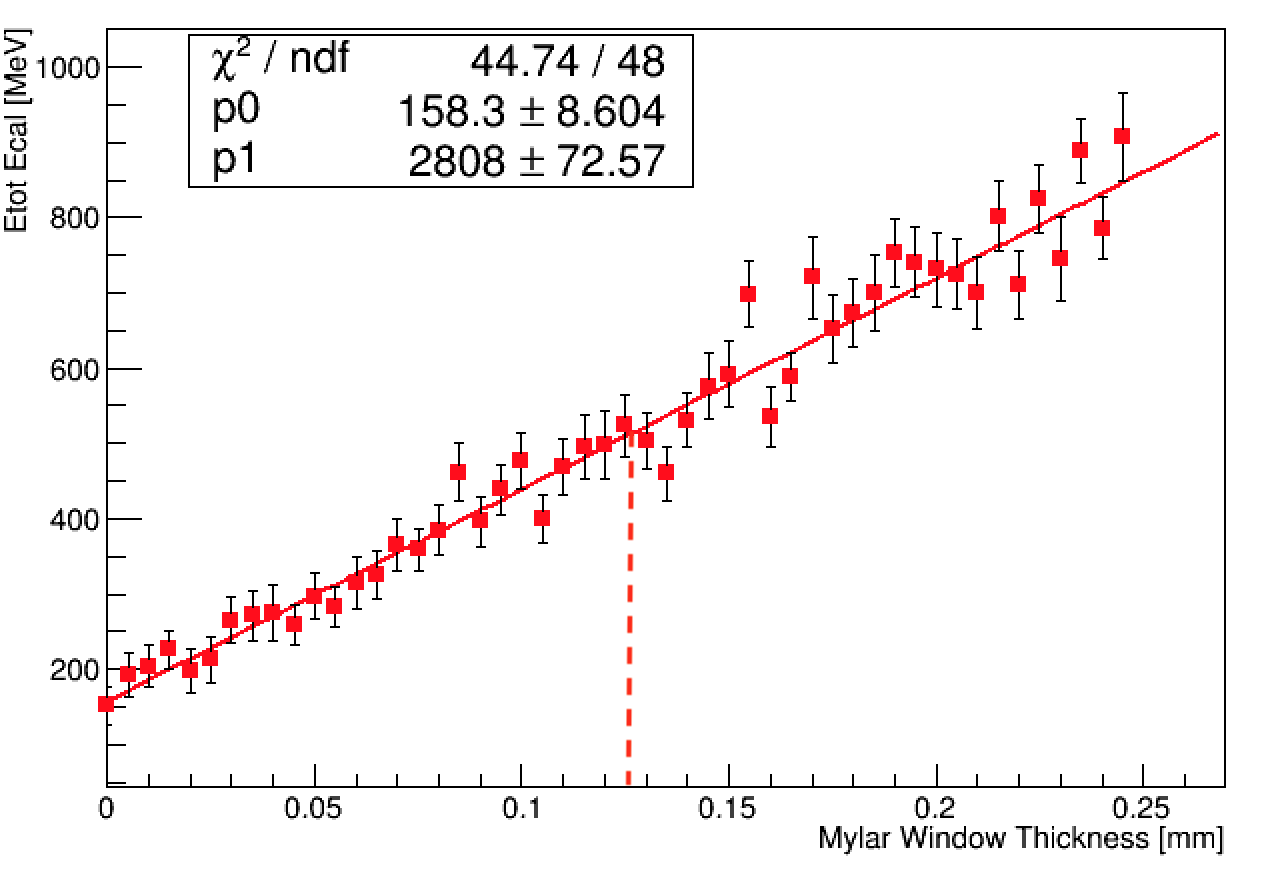
In Run II, the LINAC vaccuum was separated from the experiment vaccuum using a MYLAR window (shown as a green bar in Fig. 2). The effect of the thickness of the window on the background energy observed in the PADME ECal was studied in order to find the maximum allowable thickness, which corresponds to the maximum allowable background. In Fig. 6 the total energy deposit in the calorimeter is shown as a function of window thickness in mm. The plot was obtained by simulating one thousand events of POT each for every step in window thickness. The energy deposit observed for thickness is produced by the interaction of the beam with the diamond target. Using the simulation, and after laboratory tests of the window mechanical strength, the minimum window thickness was fixed to (red-dashed line). The simulation predicted an average energy deposit of per POT, in very good agreement with the measurement performed during Run II data taking.
4.3 Beam background reduction
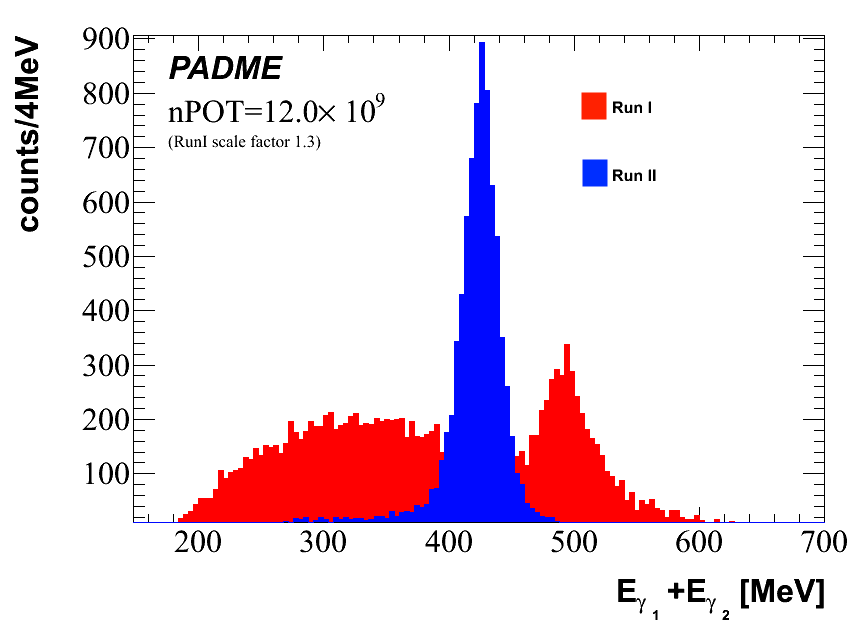
With the new beam line configured for Run II by the Beam Test Facility staff, a considerable reduction of the beam-related background was achieved. Fig. 7 shows the total energy of two clusters for late Run I (red) and Run II (green) with different beam line configurations. Events were selected by requiring the two clusters to be within of each other; inside the fiducial region of the calorimeter; and with an energy center-of-gravity below . The peak in the distribution is produced by and corresponds to the different beam energies: for Run I and for Run II. The low-energy region is dominated by pile-up background. The green distribution shows strong event suppression in the background region. This represents the main achievement obtained by moving the vacuum separation window and replacing of Be with of MYLAR. The improvement in the peak resolution and the absence of high-energy tails in the Run II distribution (green) are additional consequences of the lower pile-up.
4.4 Data vs. Monte Carlo simulation comparison
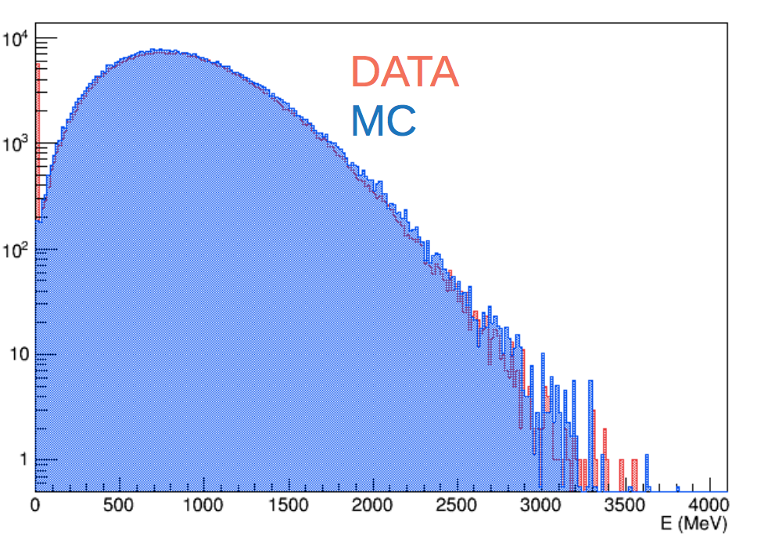
To test the quality of the background description achieved by the beam line MC simulation, we compared the distribution of the total cluster energy obtained from simulation with that obtained from data in Run II. The data sample was collected with standard beam conditions: positrons on target and bunch length. The data distribution, in red in Fig. 8, is well described by the simulated one in blue. Even in the high-energy region, where the MC slightly overestimates the data, the agreement is still good.
4.5 Quadrupole gradient tuning
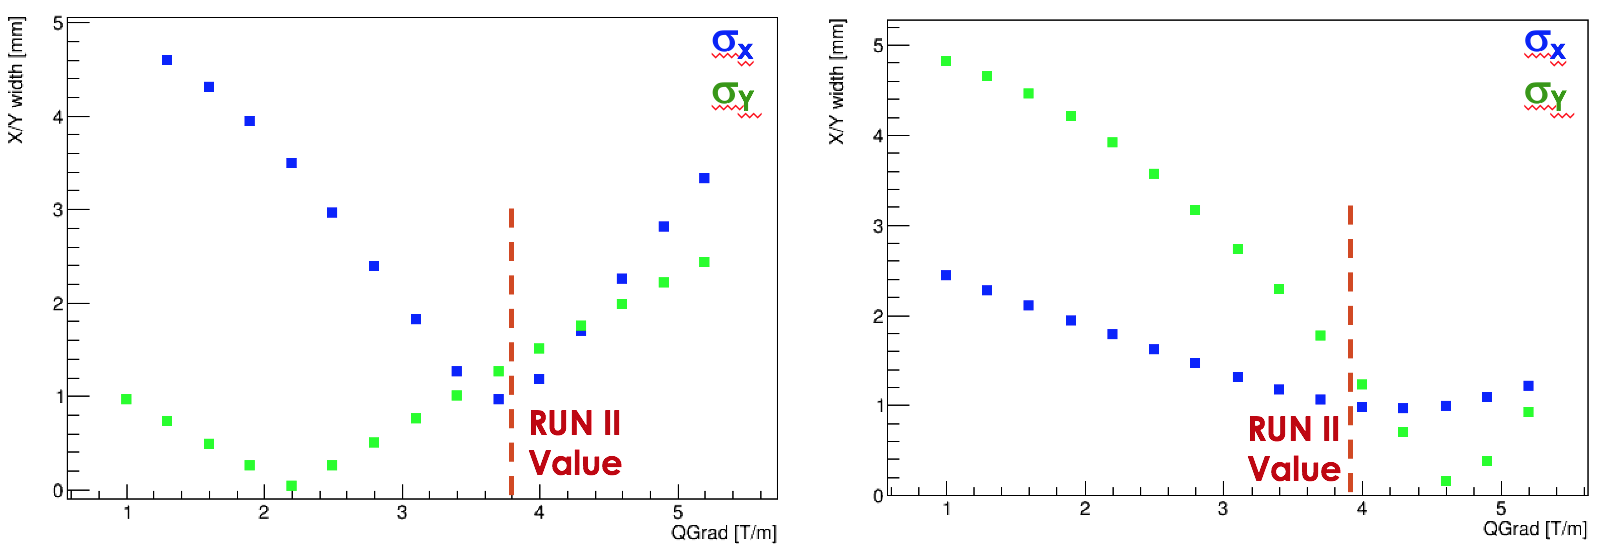
To verify the quality of the optics simulated by the PADME beam line MC simulation, we performed a scan of quadrupole gradient fields. The BTF line uses two quadrupole pairs: Q1 and Q2 in the LINAC region, and Q3 and Q4 in the BTF hall (see Fig. 3). The beam dimensions measured at the PADME target with simulation were compared to the ones measured experimentally. During Run II, the beam dimensions at the target were vertically and horizontally. After a first gradient scan, it was established that the shape of the beam at the target can be adjusted by changing only the gradient of the last two quadrupoles. Fixing the gradients of the first two quadrupoles Q1 and Q2 to the actual values used during Run II, we scanned the gradients of Q3 and Q4, searching for the values providing horizontal and vertical spot sizes of . The scan ranged from in 15 steps of .
In Fig. 9, the results of the scan are shown for Q3 and Q4. On the Y axis of the plot, the RMS of the beam spot size at the PADME target is represented for different values of the quadrupole gradient field. According to the scan, the best value for the Q3 gradient is roughly , compared to the actually used. For Q4, the set of possible gradients is somewhat larger but the value that leads to both X and Y RMS closest to is , very close to the actually used.
4.6 Beam energy dispersion estimates
One way to estimate the accepted beam energy range generated by the BTF transport line is to use the dispersion created by DHSTB001 and the aperture of the horizontal downstream collimator SLTB4. Using the Monte Carlo simulation of the beam bending through the DHSTB001 dipole, we derived the correlation coefficient of the impact position at the collimator vs. particle energy. Given the aperture of the horizontal collimator SLBT4, placed just after the DHSTB001 dipole, the energy dispersion of the PADME beam was estimated with the formula:
| (1) |
where is the horizontal collimator aperture in mm and . Using the value set during Run II (), we obtain a nominal beam energy spread of . Dividing by the beam energy of then gives . The result is confirmed in simulation by studying the total amount of energy deposited in the ECal. After tuning the beam optics, we performed a simulation scan to measure the total energy in the calorimeter as function of beam energy spread, from % in 15 steps. The background level in the ECal remains stable and compatible with that observed in Run II data as long as the beam energy spread stays below %.
An independent estimate can be obtained analytically using Eq. (3) of Ref. [13], which also takes into account the entrance angle at DHSTB001:
| (2) |
Here, is the radius of the dipole, and are the distance and aperture of the downstream collimator SLTB4, and is the aperture of the upstream collimator SLTB2. In the BTF case, and . Using the collimator apertures and , typical values used during Run II, and a beam spot size , we obtain an estimated energy spread of , in very good agreement with the simulation estimate.
4.7 Absolute measurement of the beam energy
The description of the magnetic field of the PADME dipole in the experiment simulation is extremely accurate and uses a detailed field map obtained using remote-controlled Hall probes. The PADME magnet is a CERN MBP-S dipole with an increased vertical gap of .
To evaluate the impact on the magnetic field, the dipole magnetic volume was scanned at LNF in 3D in steps of a few mm in each of the three coordinates, including the fringe field regions. The excitation curve was also measured allowing the conversion of magnet current (I) into magnetic field (B) at the center of the coils:
| (3) |
The dipole current was monitored by the PADME Detector Control System (DCS) every few seconds during all of Run I and Run II.
With the beam position measured by the target before the dipole entrance and close to the beam dump by means of a TimePix detector [14], an absolute measurement of the beam energy can be obtained. The measured dipole magnet current and the beam impact position on the active target were fed to the simulation as input. To predict the impact point at the TimePix, simulation samples with different positron beam energies in the range were generated. Fig. 10 shows the correlation of the predicted impact point on the TimePix detector as a function of the primary positron energy.
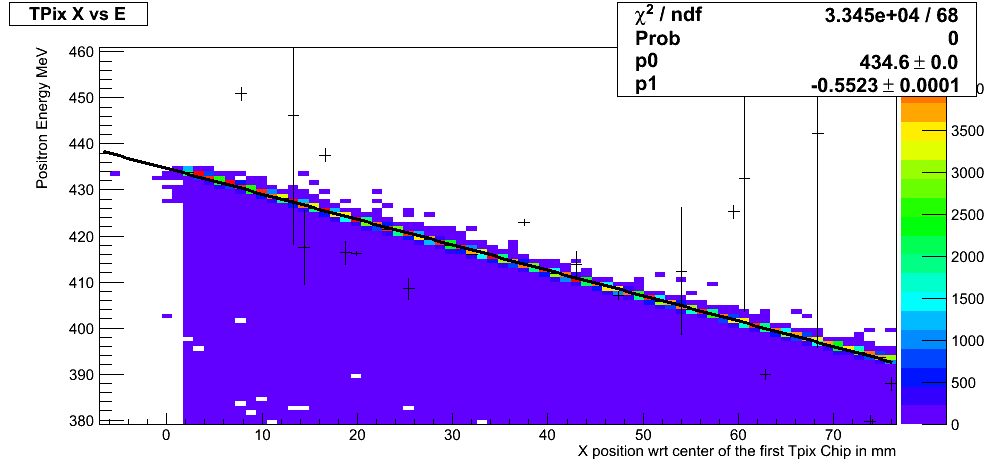
Profiling and fitting the distribution of Fig. 10 we obtain a function converting the beam impact point position on the TimePix detector (X) into a beam energy as follows:
| (4) |
During a dedicated test, we measured the impact point with the TimePix detector to be in local detector coordinates, with negligible error. Using Eq. 4 yields , less than away from the measured with the LINAC hodoscope in the July 2020 technical run [12]. The measurement was obtained with the same LINAC settings and transfer line used during Run II.
The statistical errors due to the fit are small and the error on the position of the beam at the target is just [3], while the position of the target itself is known to accuracy. The dominant systematic uncertainty comes from possible variations in the real position of the TimePix detector with respect to the simulation model, estimated to be . Another source of systematic error is the value of the fit parameters extracted in Fig. 10 and used in Eq. 4. Changing the fit procedure and the fit binning, relative variations of % were observed. The final result for the PADME beam energy measurement in Run II is:
| (5) |
A separate method to determine the beam energy exploits the DHSTB002 dipole magnet bending and the position of the beam at the target. This method is currently less precise due to the unknown position of the beam at the entrance of DHSTB002, and the shorter distance between the DHSTB002 entrance and the target. In 2020, a new horizontal collimator was added at the entrance of DHSTB002, allowing us to fix the beam position with higher precision.
The PADME experiment plans a dedicated run to search for the recently postulated X17 particle [15]. In fact, it has been pointed out in Ref. [16] that using resonant production, , it would be possible to improve the experiment sensitivity to X17. In this type of search, establishing the exact resonance mass () is vital. Thus the ability to measure the beam energy with sub-percent precision is key. With the present energy determination method, and , corresponding to a beam energy of , the uncertainty on the beam energy will be %, or , which translates to a mass uncertainty of .
Improvements that will help in further reducing the error on the energy measurement are still possible by, e.g., increasing the precision of the TimePix detector positioning and of the MC simulation magnetic field maps.
5 Conclusions
The PADME beam line Monte Carlo simulation implements a full Geant4-based simulation of the DANE Beam Test Facility transport line, from the end of the LINAC to the target of the PADME experiment. The simulation is able to reproduce the beam optics, to predict the correct quadrupole magnetic setting, and to account for the beam halo background observed in the experiment calorimeter. Furthermore, it has been used to measure the absolute beam energy () MeV and its spread, %, with high accuracy. These improvements will allow the simulation to produce reliable background predictions in different configurations, helping to plan the PADME Run III setup.
6 Acknowledgments
We warmly thank all of the BTF and LINAC teams of Laboratori Nazionali di Frascati for providing an excellent quality beam and full support during data taking and simulation development.
This work is partly supported by the Italian Ministry of Foreign Affairs and International Cooperation (MAECI) under the grant PRG00226 (CUP I86D16000060005), the BG-NSF KP-06-DO02/4 from 15.12.2020 as part of MUCCA, CHIST-ERA-19-XAI-009, and TA-LNF as part of STRONG-2020 EU Grant Agreement 824093 projects.
References
- [1] M. Raggi and V. Kozhuharov, Proposal to Search for a Dark Photon in Positron on Target Collisions at DANE Linac, Adv. High Energy Phys. 2014 (2014) 959802 [1403.3041].
- [2] M. Raggi, V. Kozhuharov and P. Valente, The PADME experiment at LNF, EPJ Web Conf. 96 (2015) 01025 [1501.01867].
- [3] PADME collaboration, Operation and performance of the active target of PADME, Nucl. Instrum. Meth. A (2019) 162354.
- [4] P. Albicocco et al., Characterisation and performance of the PADME electromagnetic calorimeter, JINST 15 (2020) T10003 [2007.14240].
- [5] GEANT4 collaboration, GEANT4–a simulation toolkit, Nucl. Instrum. Meth. A 506 (2003) 250.
- [6] E. Leonardi, V. Kozhuharov, M. Raggi and P. Valente, GEANT4-based full simulation of the PADME experiment at the DANE BTF, J. Phys. Conf. Ser. 898 (2017) 042025.
- [7] A. Belyaev, N.D. Christensen and A. Pukhov, CalcHEP 3.4 for collider physics within and beyond the Standard Model, Comput. Phys. Commun. 184 (2013) 1729 [1207.6082].
- [8] G. Balossini, C. Bignamini, C.M.C. Calame, G. Montagna, O. Nicrosini and F. Piccinini, Photon pair production at flavour factories with per mille accuracy, Phys. Lett. B 663 (2008) 209 [0801.3360].
- [9] G. Balossini, C.M. Carloni Calame, G. Montagna, O. Nicrosini and F. Piccinini, Matching perturbative and parton shower corrections to Bhabha process at flavour factories, Nucl. Phys. B 758 (2006) 227 [hep-ph/0607181].
- [10] T.J. Roberts, K.B. Beard, D. Huang, S. Ahmed, D.M. Kaplan and L.K. Spentzouris, G4Beamline Particle Tracking in Matter-dominated Beam Lines, Conf. Proc. C 0806233 (2008) WEPP120.
- [11] L.J. Nevay et al., BDSIM: An accelerator tracking code with particle–matter interactions, Comput. Phys. Commun. 252 (2020) 107200 [1808.10745].
- [12] L. Foggetta et al., The Extended Operative Range of the LNF LINAC and BTF Facilities, in 12th International Particle Accelerator Conference , 8, 2021, DOI.
- [13] A. Ghigo, G. Mazzitelli, F. Sannibale, P. Valente and G. Vignola, Commissioning of the DAFNE beam test facility, Nucl. Instrum. Meth. A 515 (2003) 524.
- [14] T. Poikela, J. Plosila, T. Westerlund, M. Campbell, M.D. Gaspari, X. Llopart et al., Timepix3: a 65k channel hybrid pixel readout chip with simultaneous ToA/ToT and sparse readout, Journal of Instrumentation 9 (2014) C05013.
- [15] A.J. Krasznahorkay et al., Observation of Anomalous Internal Pair Creation in Be8 : A Possible Indication of a Light, Neutral Boson, Phys. Rev. Lett. 116 (2016) 042501 [1504.01527].
- [16] E. Nardi, C.D.R. Carvajal, A. Ghoshal, D. Meloni and M. Raggi, Resonant production of dark photons in positron beam dump experiments, Phys. Rev. D 97 (2018) 095004 [1802.04756].