Glass Segmentation with RGB-Thermal Image Pairs
Abstract
This paper proposes a new glass segmentation method utilizing paired RGB and thermal images. Due to the large difference between the transmission property of visible light and that of the thermal energy through the glass where most glass is transparent to the visible light but opaque to thermal energy, glass regions of a scene are made more distinguishable with a pair of RGB and thermal images than solely with an RGB image. To exploit such a unique property, we propose a neural network architecture that effectively combines an RGB-thermal image pair with a new multi-modal fusion module based on attention, and integrate CNN and transformer to extract local features and non-local dependencies, respectively. As well, we have collected a new dataset containing 5551 RGB-thermal image pairs with ground-truth segmentation annotations. The qualitative and quantitative evaluations demonstrate the effectiveness of the proposed approach on fusing RGB and thermal data for glass segmentation. Our code and data are available at https://github.com/Dong-Huo/RGB-T-Glass-Segmentation.
Index Terms:
RGB-Thermal, glass segmentation, sensor fusion.I Introduction
Human-made environments are full of architectural elements constructed from glass materials such as glass windows, doors, railings, and walls. Accurately identifying and distinguishing these objects has numerous applications in robotics [1], manufacturing [2] and assistive care [3]. Compared to opaque materials, transparent glasses do not have their own colors and their appearances are acquired from the background, posing inconsistent visual features if the background or viewpoint is changed. Therefore, glass objects with background-dependent appearances often pose challenges for visual recognition methods that are tailored to opaque objects.
With the emergence of deep neural networks, recent data-driven methods are capable of segmenting glass regions from a single RGB image and have utilized contextual information [4], reflection detection [5] and boundary supervision [6]. While neural networks are powerful, they are based on unreliable RGB colors or directly adopt the learning frameworks for opaque materials, resulting in limited accuracy enhancement. Several methods seek to leverage alternative cues such as depth [7], light-field [8] or polarized light [9]. However, these methods are not robust enough for clear glass recognition, which could lead to a noisy segmentation mask (holes, rough boundaries) and a high false positive rate.
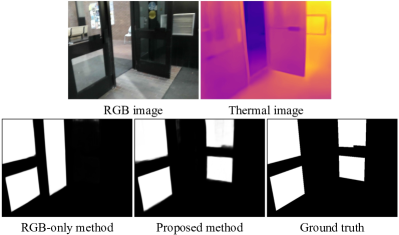
This paper takes a step towards fusing RGB and thermal (RGB-T) images for glass segmentation, which is the core contribution. Compared to visible light, which has 100% transmission, thermal radiation which has the wavelength in the range from 8 to 12 cannot pass through the glass, i.e. 0% transmission. Such a unique physical difference between visible light and thermal energy makes glass easier to be detected if an RGB image and a thermal image are jointly processed instead of using the RGB image only. As expected, our experimental results validate our intuition that the proposed RGB-T fusion method outperforms the RGB-only solution by a large margin.
Concretely, we propose a neural network architecture that takes as input a pair of RGB and thermal images (in short RGB-T) and predicts a binary segmentation mask for the glass regions. Following the encoder-decoder framework, our architecture employs (1) two ResNet encoders for feature extraction of the two images, (2) a novel transformer-based fusion module that uses self-attention for correlating the two images at the feature level, and (3) a decoder that uses convolution-based spatial attention for adaptively selecting features for the final mask generation.
We have collected a new dataset consisting of 5551 aligned RGB-T image pairs captured by an off-the-shelf RGB-T camera, where the ground-truth (GT) segmentation masks are obtained by manual annotation. Our dataset is diverse and contains 40 categories of scenes taken from shopping malls, university campuses, residential houses, apartments, public libraries, streets, etc. The quantitative and qualitative evaluation results demonstrate the effectiveness of using RGB-T image pairs on glass segmentation. Our neural network architecture also excels in multi-modal fusion compared to existing fusion solutions. We also showcase that our approach can greatly improve existing solutions to research problems beyond glass segmentation (e.g., monocular 3D reconstruction and semantic segmentation) when simply applying it as a pre-processing or post-processing step in existing pipelines.
II Related Work
In this section, we discuss related techniques in three areas: transparent object/glass recognition, RGB-T fusion applications and salient object segmentation.
II-A Transparent Object/Glass Recognition
Methods using RGB only: Traditional algorithms detect glass by analyzing local edge/region characteristics, which exhibit issues in the wild [10, 11, 12, 13]. Since the recent progress of deep learning in computer vision, researchers start to collect large-scale transparent object datasets [14, 4, 5, 15] and train their proposed neural networks for glass-like object detection and segmentation from a single RGB image, where contextual feature [4, 16] and boundary supervision [14, 6, 17] are both popular ways for boosting accuracy. Multi-task learning also has been adopted for transparent object detection and segmentation, where object segmentation is jointly tackled with other related problems such as refractive flow estimation [18], reflection detection [5] and scene understanding [3].
Methods using modalities beyond RGB: The seemingly simple visual appearance of the glass is deceptive because its appearance interacts with the background, which motivates the use of more reliable sensors other than RGB cameras. Existing methods have utilized the refractive distortions captured by a light-field camera [8] and the high contrast of edges in a polarization image [9] for transparent object segmentation. RGB-Depth (RGB-D) fusion also has been used in both traditional optimization methods [7] and recent learning-based methods [19, 1]. However, depth cameras suffer from severe sensor failures for transparent surfaces due to light refraction. A backlight with AprilTag is employed to enhance RGB-D 3D scanning [20]. This paper adopts a similar spirit of sensor fusion using a low-cost but robust solution by integrating RGB and thermal images.
II-B Salient Object Detection
Salient object detection (SOD) aims to segment the most prominent object in a given scene. Early methods [21, 22, 23] heavily rely on hand-crafted features from a single RGB image. Recent data-driven methods [24, 25, 26, 27, 28] have dominated this field. Integrating RGB and depth images has significantly improved the performance of SOD methods. Among them, direct concatenation [29, 30, 31, 32], addition [33], spatial/channel attention [34, 35, 36, 37, 38], prediction guidance [39], affine transformation [40, 41], message passing [42], mutual information minimization [43], and self/cross attention [44, 45, 46] have been utilized for feature fusion.
In addition to depth images, thermal images are also exploited to compensate RGB images for SOD. Tu et al. [47] regard deep features of superpixels as graph nodes to cluster the foreground and background with collaborative graph learning. Zhang et al. [48] learn to generate spatial attention mask for modality fusion of multi-scale features. Zhou et al. [49] utilize different dilation rates to extract features from two modalities and combine spatial and channel attention for modality fusion. Zhou et al. [50] adopt a three-branch architecture to generate salient masks from RGB, thermal and fusion features separately and use the weighted summation of three masks as the final results. Sun et al. [51] utilize sine-cosine functions to extract features from two modalities. This paper focuses on extracting binary masks for glass to tackle the same task of binary segmentation as in SOD. Wu et al. [52] exploit channel attention weights learned from one modality to enhance the other which can better complement features from two modalities. Tu et al. [53] propose a modality alignment module for weakly alignment-free RGB-T image pairs.
II-C RGB-T Fusion Applications
RGB-T image pairs are widely used in many vision tasks to compensate the low-quality of RGB images under poor illumination or occlusion, such as object tracking [54, 55, 56, 57, 58, 59, 60], moving object detection [61, 62, 63, 64], face recognition [65], semantic segmentation [66, 67, 68, 69, 70, 71, 72], scene understanding [73, 74, 75, 76, 77], crowd counting [78, 79, 80, 81] and salient object detection [82, 83, 84, 85, 86, 87, 88, 89]. To our best knowledge, our proposed method is the first RGB-T method for glass segmentation. As well, we also collected the first dataset for such an application.
III Glass Definition, Scope and Why RGB-T?
Glass could have different meanings, broad or narrow, and different type of glass has different properties and applications. In this section, we first explain the different glass types, their applications and optical properties. Then we narrow down the glass type to daily transparent glass as the focus of this paper which is also the most difficult to segment. Lastly, we introduce our RGB-T fusion idea and discuss the limitations of other alternative solutions.
Glass is non-crystalline and can be categorized into two types based on its compositions [91]. (1) Silicate glass, based on silicon dioxide (\ceSiO2) which is abundant on earth in the form of quartz and beach sands. \ceSiO2 has a very high melting temperature (), which is hard to work with, and hence, other substances are often added, e.g. \ceNa2O, \ceCaO, etc., to lower the melting temperature and to tailor to different applications: vitreous silica (100% \ceSiO2) is used for furnace tubes, soda-lime silicate (72% \ceSiO2 with \ceNa2O and \ceCaO) is used for windows, containers and tableware, “crown” (69% \ceSiO2 with \ceNa2O, \ceB2O3 and \ceK2O) is used for optical lens, and aluminosilicate (53% \ceSiO2 with \ceAl2O3) is used for fibreglass, etc. (2) Non-silicate based glass includes amorphous metals, chalcogenides, fluorides, polymers, etc.
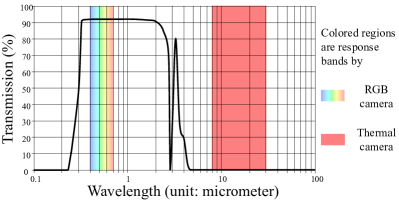
For optical property, glass is transparent to visible light because there are no grain boundaries (the interface between two crystals formed during cooling) which scatter light in polycrystalline materials [92]. Meanwhile, silicate glasses absorb light with wavelengths longer than 4, which makes them opaque to long infrared light111In this paper, these words are interchangeable, “thermal radiation, thermal energy, long infrared light, long-wave infrared light”, all referring to electromagnetic radiation of 8 to 12 . (Fig. 2). Non-silicate glass could sometimes transmit long infrared light, e.g., fluoride glasses and chalcogenide glasses can transmit light up to 7 and 18, respectively, but they are used for infrared imaging, infrared fiber, and CD/DVDs.
Some processing can change the transparency slightly. Glass equally transmits visible light at different wavelengths (Fig. 2), but can appear tinted after adding some metallic oxides that absorb light of certain wavelengths, e.g., blue by cobalt, green by chromium. Sandblasting or acid etching clear glass creates frosted glass which is translucent. Low-emissivity (Low-e) glass is glass with a thin coating layer to prevent transmission of light over 780 and is usually used as a window to the outside. Note that no coating can increase the transmission rate.
In this paper, we limit the scope to daily transparent glass, i.e., the plate glass normally seen in our daily life such as glass windows, doors and tables, which is the most difficult to detect and segment. The daily glass in human-made environments is mostly silicate-based, more specifically, soda-lime silicate (\ceSiO2 + \ceNa2O + \ceCaO). Silica glass is like a band-pass optical filter which has a cut-on wavelength 350 and a cut-off wavelength 4 (Fig. 2). It has high transmission in the visible band () but low in the thermal band ().
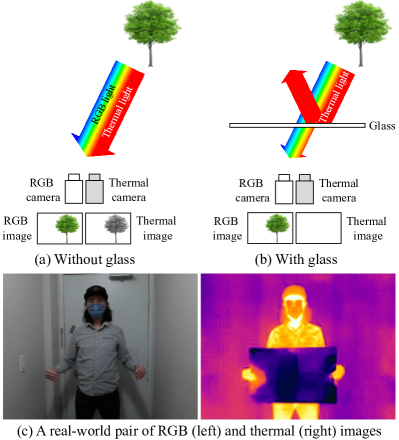
Motivated by this fact, we propose to use an RGB-T image pair to detect and segment glass. A toy example is shown in Fig. 3(a, b). The tree behind the glass is visible to the RGB camera but not to the thermal camera, which is not the case when the glass is removed. As a result, images captured by thermal cameras have less arbitrary textures than RGB cameras on glass regions, while keeping similar textures on non-glass regions. Fig. 3(c) shows a real example.
RGB-T is better than the alternative methods. The problem of RGB-UV is that there is limited UV light indoor. The problem of RGB-MWIR (middle-wave IR) is that the MWIR camera is very costly ($ per pixel [93]). RGB-Near IR (NIR) only works for some Low-e glass. In contrast, RGB-T works for any silicate glass, works indoors and is low cost (), and it is extensible to traditional glass alternatives. We do not know whether some glass in our collected data is made of polymers like plastics and acrylic because we could not check, but acrylic and plastics of several millimeters thick are also opaque to thermal radiation. In the future, there could be new technologies to make glass windows and glass doors; RGB-T should still work because the new materials are expected to have high visibility and low heat transmission, i.e. opaque to heat to keep heat out in summer and to prevent heat loss in winter.
IV RGB-T Glass Segmentation Dataset
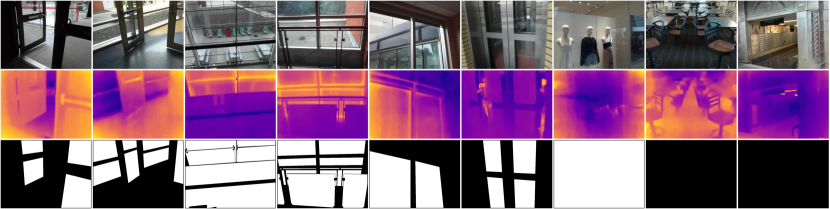
Coupled RGB-T image pairs is a new idea for robust glass segmentation, for which this paper contributes a new RGB-T dataset with GT segmentation masks (see Fig. 4).
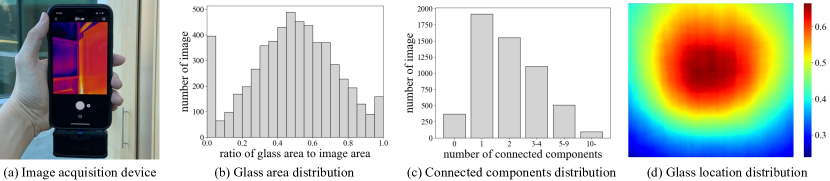
Dataset construction: We capture RGB-T pairs with a FLIR ONE Pro camera [94], which consists of a nearly collocated RGB sensor and a thermal sensor. The thermal and RGB images are aligned with the FLIR Thermal Studio software [95] and both are saved at a resolution of 222The raw thermal image resolution is . The camera software performs super resolution for the thermal image and resizes it to .. During capturing, the camera is connected to an iPhoneXR for real-time image display (See Fig 5(a)). We use LabelMe [96] to manually annotate segmentation masks over RGB images. Pixels of raw thermal images (only one channel) represent the absolute temperature in the range , we calculate the min and max values of each thermal image and normalize it to using min-max normalization for obtaining the relative temperature before inputting to the algorithm, which is less sensitive to the variation of ambient temperature. Pseudocolor of thermal images shown in the paper is rendered from grayscale using Matplotlib [97].
Our new dataset covers a variety of scenes, such as libraries, shopping malls, galleries, train stations, museums, streets and houses, yielding 5551 RGB-T image pairs from 40 scenes. Among them, we capture 370 pairs without glass in 7 scenes. To generate the train and test split, we randomly select 23 scenes with glass and 5 scenes without glass for training and the others are used for testing (4427/1124 RGB-T pairs for train/test). Note that for the test split, we manually select some images with structures that visually look like glass, e.g., door openings, holes in a wall. Such challenging examples increase the segmentation difficulty for RGB-only solutions and better reflect the merit of our RGB-T fusion idea (e.g., door openings have very different appearances with glass in thermal images).
Dataset statistics: Following [4, 5], below we conduct some statistical analyses using GT segmentation masks from our dataset:
Glass area distribution. For each mask, we calculate the ratio of the glass area to the entire image area, where a ratio of 0 and 1 indicate, respectively, images without glass and images with glass at all pixels. As shown in Fig. 5(b), most of the captured images have ratios in the range of . There are also quite a few images with a ratio of 0 or 1, which are extreme cases that we captured on purpose.
Connected components distribution. An image may contain several glass regions. We compute the number of connected components in each binary mask and show the histogram in Fig. 5(c). The majority of images have 04 connected components and 52 at most. Images with more than 10 connected components are usually from complex scenes such as that in a shopping mall.
Glass location distribution. Fig. 5(d) shows the probability map of each pixel to be glass. The center region has the highest probability.
V RGB-T Glass Segmentation Network
V-A Overall Architecture
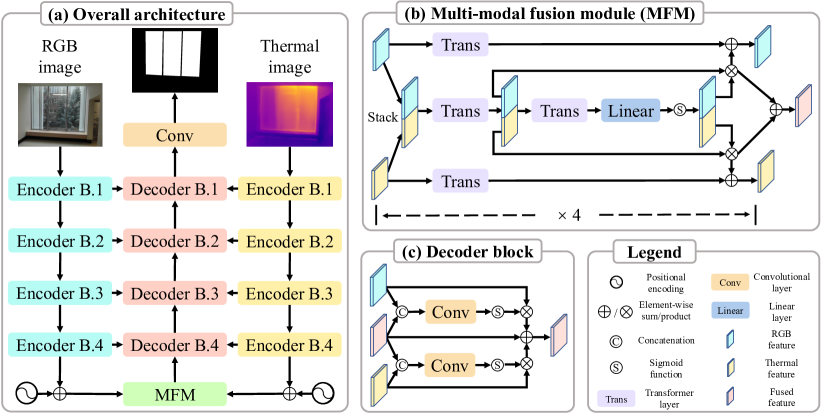
Our architecture follows the standard encoder-decoder framework with skip-connections for dense segmentation [98], which consists of two encoding branches, one decoding branch and a multi-modal fusion module (MFM) as the bridge, as shown in Fig. 6(a). Specifically, we apply two ResNet-50 [99] encoders to convert the RGB and thermal input images into two feature volumes, where and , respectively, denote the height, the width and the channel size. In our implementation, and are varying and depend on the input image resolution, and . We supplement the two features with sinusoidal positional encodings [100] and produce a fused feature volume by the MFM. The fused feature further passes through a decoding branch with four decoder blocks and is progressively upsampled to the resolution of the input images. Finally, a convolution layer with a sigmoid function converts the results to the final segmentation. Note that all convolution layers other than those before the sigmoid functions are followed by a batch normalization layer and a ReLU function, which are omitted in Fig. 6. The Binary Cross-Entropy loss is used for training. Please refer to the supplemental materials for more architectural details.
V-B Multi-modal Fusion Module (MFM)
The foundation of our RGB-T fusion is the attention mechanism in Transformer, which is known to be powerful in combining information from different modalities [101, 46]. As shown in Fig. 6(b), our MFM contains four iterative blocks and the th () block takes in an RGB feature and a thermal feature both with the same resolution of 333 and are reshaped from the feature volumes from the two encoders.. We stack and and use a transformer layer to obtain a feature map . We then generate a weight vector by passing through a transformer layer followed by a linear layer and a sigmoid function. Such a weight vector is further used to update the RGB and thermal features. Formally, the above process can be summarized as:
| (1) | ||||
| (2) | ||||
| (3) | ||||
| (4) |
where trans(), linear(), sigmoid(), stack() denote the transformer layer, the linear layer, the sigmoid function and the stack operation, respectively. The symbol denotes the element-wise multiplication. The transformer layer consists of a multi-head self-attention and a feed-forward network [102] (See the supplemental materials for details). Lastly, at the th iteration, the fused feature is computed as and reshaped back to .
In our MFM, transformer blocks from the top and the bottom branches extract non-local intra-modality dependencies from the RGB feature and the thermal feature , respectively, and we utilize an additional transformer block in the middle branch to extract non-local inter-modality dependencies from the stack of and . Considering the discrepancy of two modalities, deficiencies of one modality should be properly compensated by the other. Instead of directly unstacking the multi-modal features along the first dimension and feed them to each modality, we generate a weight vector as the spatial attention mask to remove the detrimental features and keep the beneficial ones. We apply the weight vector (spatial attention mask) on multi-modal features using residual multiplication following Lee et al. [103].
| Method | #Params | Inference time | Model size | Images with glass | Images without glass | All images | |||||
|---|---|---|---|---|---|---|---|---|---|---|---|
| MAE | IOU | F | BER | MAE | IOU | FPR | MAE | ||||
| RTFNet [70] | 185.23M | 0.016s | 708Mb | 0.068 | 88.92 | 0.936 | 6.675 | 0.188 | 83.69 | 0.89 | 0.058 |
| ShapeConv [104] | 41.21M | 0.534s | 161Mb | 0.059 | 87.65 | 0.930 | 6.940 | 0.019 | 98.24 | 0.41 | 0.054 |
| ESANet [105] | 46.88M | 0.022s | 359Mb | 0.051 | 90.15 | 0.945 | 5.863 | 0.030 | 97.70 | 0.25 | 0.040 |
| CMX [106] | 66.56M | 0.035s | 255Mb | 0.031 | 92.40 | 0.956 | 5.421 | 0.004 | 99.70 | 0.06 | 0.029 |
| Segformer [107] | 34.07M | 0.017s | 131Mb | 0.052 | 89.22 | 0.934 | 7.208 | 0.063 | 93.72 | 0.34 | 0.053 |
| Segmenter [108] | 103.15M | 1.067s | 784Mb | 0.072 | 85.83 | 0.912 | 8.451 | 0.303 | 92.06 | 0.31 | 0.072 |
| MCNet [109] | 54.64M | 0.266s | 210Mb | 0.177 | 67.45 | 0.782 | 19.934 | 0.118 | 89.51 | 0.60 | 0.172 |
| DPANet [110] | 92.40M | 0.019s | 354Mb | 0.241 | 71.51 | 0.838 | 15.051 | 0.291 | 83.56 | 0.90 | 0.154 |
| HAINet [111] | 59.82M | 0.023s | 229Mb | 0.078 | 87.16 | 0.932 | 7.247 | 0.069 | 94.44 | 0.48 | 0.062 |
| Zhang et al. [48] | 38.87M | 0.053s | 445Mb | 0.156 | 75.13 | 0.842 | 14.141 | 0.488 | 51.57 | 1.00 | 0.163 |
| SSF [35] | 32.93M | 0.028s | 126Mb | 0.081 | 84.53 | 0.909 | 8.068 | 0.356 | 64.47 | 0.96 | 0.097 |
| UCNet [30] | 31.26M | 0.026s | 120Mb | 0.079 | 84.70 | 0.913 | 8.324 | 0.028 | 97.24 | 0.14 | 0.071 |
| CoNet [112] | 43.66M | 0.021s | 168Mb | 0.118 | 79.94 | 0.876 | 9.336 | 0.533 | 46.83 | 1.00 | 0.145 |
| ATSA [45] | 32.16M | 0.021s | 124Mb | 0.088 | 83.87 | 0.903 | 8.185 | 0.276 | 73.57 | 1.00 | 0.098 |
| DANet [31] | 26.68M | 0.007s | 102Mb | 0.082 | 85.63 | 0.915 | 7.982 | 0.045 | 96.36 | 0.36 | 0.069 |
| HDFNet [33] | 54.77M | 0.019s | 419Mb | 0.055 | 89.56 | 0.941 | 5.673 | 0.019 | 98.49 | 0.59 | 0.048 |
| FRDT [113] | 72.81M | 0.013s | 279Mb | 0.094 | 82.53 | 0.890 | 9.050 | 0.313 | 69.49 | 0.96 | 0.107 |
| RD3D [32] | 46.90M | 0.013s | 180Mb | 0.064 | 88.94 | 0.938 | 6.610 | 0.037 | 97.13 | 0.26 | 0.045 |
| DCFNet [38] | 108.49M | 0.064s | 373Mb | 0.059 | 88.13 | 0.930 | 6.757 | 0.036 | 96.45 | 0.21 | 0.056 |
| UTA [114] | 48.61M | 0.023s | 98Mb | 0.051 | 89.59 | 0.933 | 6.060 | 0.069 | 93.00 | 0.23 | 0.052 |
| EBS [115] | 118.96M | 0.036s | 467Mb | 0.041 | 91.24 | 0.946 | 5.528 | 0.031 | 96.97 | 0.21 | 0.040 |
| VST [46] | 83.83M | 0.034s | 321Mb | 0.050 | 90.03 | 0.939 | 5.857 | 0.026 | 97.47 | 0.15 | 0.044 |
| CLNet [43] | 246.13M | 0.142s | 941Mb | 0.045 | 91.01 | 0.945 | 4.983 | 0.021 | 98.03 | 0.14 | 0.041 |
| SPNet [41] | 175.29M | 0.058s | 671Mb | 0.044 | 90.76 | 0.947 | 5.064 | 0.035 | 96.68 | 0.40 | 0.041 |
| EBLNet [6] | 48.36M | 0.012s | 185Mb | 0.113 | 80.54 | 0.880 | 10.301 | 0.129 | 88.67 | 0.72 | 0.104 |
| Ours (Thermal-only) | 65.14M | 0.039s | 238Mb | 0.189 | 68.63 | 0.781 | 19.315 | 0.136 | 86.68 | 0.55 | 0.177 |
| Ours (RGB-only) | 65.14M | 0.039s | 238Mb | 0.056 | 88.94 | 0.929 | 6.618 | 0.016 | 98.42 | 0.11 | 0.052 |
| Ours (RGB-T) | 85.02M | 0.048s | 328Mb | 0.027 | 93.80 | 0.965 | 4.078 | 0.003 | 99.73 | 0.08 | 0.024 |
V-C Decoder
Our decoder consists of four blocks, where each block takes in (1) an RGB feature volume from the RGB encoder, (2) a thermal feature from the thermal encoder, and (3) a fused feature from the previous decoder block. We concatenate and and use three convolution layers and a sigmoid function to compute a single-channel weight volume , which has the same height and width as that of . We apply the same operation to and and obtain another weight . Finally, the output of the block is calculated as . Similar to the weight vector in MFM, and are used as the spatial attention mask for feature fusion.
Note that we could have chosen transformer layers for feature fusion in the decoder as that in MFM, but we opt for a convolution-based spatial attention scheme due to the intensive memory constraints of self-attention in high resolution [116]. In addition, each decoder block is further followed by a convolution layer and a bilinear upsampling to gradually recover the spatial dimension, the detail of which is omitted in Fig. 6(c).
VI Experiments
We have implemented our method in PyTorch [117]. The ImageNet-pretrained ResNet-50 backbone (encoder block 14) is loaded from torchvision. The batch size is 16. The learning rate is initialized as and changed to after 200 epochs. We use random flipping, resizing and cropping for data augmentation. Our model is trained with the AdamW [118] optimizer for 300 epochs, which takes around 35 hours on an NVIDIA RTX A6000 GPU with 48GB of RAM.
VI-A Evaluation Metrics
We adopt standard segmentation metrics: mean absolute error (MAE), intersection over union (IOU), maximum F-measure () and balanced error rate (BER). These four metrics are commonly used in previous glass segmentation papers [4, 5, 6], whereas only MAE is valid for evaluating images without glass (i.e., GT mask is black). To assess our performance on those images without glass in our new dataset, together with MAE, we use inverse intersection over union (IOU∗) and false positive rate (FPR). IOU∗ takes inverse masks and is defined as . FPR is calculated as the ratio of the number of false positives (i.e., glass are wrongly detected) to the total number of images without glass. Because MAE is commonly used, we use it to evaluate on all images.
| Method | MAE | IOU | BER |
|---|---|---|---|
| MirrorNet [119] | 0.094 | 81.3 | 8.98 |
| GDNet [4] | 0.088 | 82.6 | 8.42 |
| Translab [14] | 0.081 | 85.1 | 7.43 |
| EBLNet [6] | 0.074 | 86.0 | 6.90 |
| Ours (RGB-only) | 0.072 | 86.6 | 7.35 |
VI-B Quantitative Evaluations
RGB-T image pairs are new cues for glass segmentation. We compare three variants of our method with 24 state-of-the-art methods from other related areas, which include ShapeConv [104], ESANet [105] and CMX [106] for RGB-D semantic segmentation, RTFNet [70] for RGB-T semantic segmentation, Segformer [107] and Segmenter [108] for RGB-only semantic segmentation, MCNet [109] for thermal-only semantic segmentation, DPANet [110], HAINet [111], SSF [35], UCNet [30], CoNet [112], ATSA [45], DANet [31], HDFNet [33], FRDT [113], RD3D [32], DCFNet [38], UTA [114], EBS [115], VST [46], CLNet [43] and SPNet [41] for RGB-D salient object detection, and Zhang et al. [48] for RGB-T saliency detection. All of these competing methods are retrained with our dataset using RGB-T pairs as input. We also compare with a state-of-the-art RGB-only glass segmentation method EBLNet444Other recent glass segmentation methods [119, 4, 5] did not provide training codes for their models. [6], which is retrained with the RGB images in our dataset.
As shown in Table I, the last three rows give the ablation results of our full RGB-T method and its two variants that use either thermal or RGB data only. Albeit the thermal-only variant is the worst, it can significantly boost the performance when it is combined with RGB images. For example, the MAE of our RGB-T method on glass images is and better than the two variants, which demonstrates the effectiveness of our RGB-T fusion idea for glass segmentation. Please refer to the Section VI-F for more ablation studies.
Our approach consistently outperforms previous methods on most metrics by a large margin. Similar to our method, CMX, EBS and Segformer utilize a combination of convolution and transformer (hybrid) in their architectures, which achieve superior performance in the evaluations of RGB-T and RGB-only, respectively. We attribute it to the hybrid architecture [120, 121], while pure convolution (e.g., ESANet, CLNet, SPNet, EBLNet) or transformer (e.g., VST, Segmenter) architectures obtain inferior results.
The performance of our thermal-only variant and MCNet is much worse than that of other RGB-only and RGB-T methods. We believe that there are two reasons. First, the resolution of thermal images is lower than that of RGB images. Hence, the segmentation results of thermal images are poor. Second, even though the glass is opaque to the thermal light, we need to compare it with the RGB images to see the contrast. Hence, it is difficult, if not impossible, to distinguish glass and other opaque objects using a single thermal image.
| Method | VT5000 [122] | VT1000 [47] | ||||
|---|---|---|---|---|---|---|
| MAE | S | F | MAE | S | F | |
| MTMR [83] | 0.114 | 0.680 | 0.662 | 0.119 | 0.706 | 0.755 |
| M3S-NIR [84] | 0.188 | 0.631 | 0.607 | 0.151 | 0.717 | 0.734 |
| SGDL [47] | 0.089 | 0.750 | 0.738 | 0.090 | 0.787 | 0.807 |
| ADF [122] | 0.048 | 0.864 | 0.864 | 0.034 | 0.910 | 0.923 |
| MIDD [89] | 0.043 | 0.868 | 0.872 | 0.027 | 0.915 | 0.926 |
| APNet [50] | 0.035 | 0.876 | 0.875 | 0.021 | 0.921 | 0.930 |
| ECFFNet [49] | 0.038 | 0.874 | 0.872 | 0.021 | 0.923 | 0.930 |
| MIA-DPD [123] | 0.040 | 0.879 | 0.880 | 0.025 | 0.924 | 0.935 |
| DCNet [53] | 0.035 | 0.872 | 0.870 | 0.021 | 0.922 | 0.928 |
| Ours | 0.036 | 0.881 | 0.881 | 0.020 | 0.929 | 0.941 |
VI-C Qualitative Evaluations
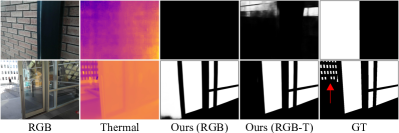
Figure 7 shows the qualitative comparison results. Our method is able to accurately segment the glass regions in various challenging scenes, while previous methods and the RGB-only variant produce a plethora of noticeable errors: (1) blurry segmentation results and fuzzy boundaries, (2) under-segmentation masks due to the influence by the background behind glass, and (3) over-segmentation results where cabinet or door openings are wrongly identified as glass. The last two rows show two extreme cases where the scenes are completely covered by glass. The human bodies in the thermal images are reflections of the photographer, which are invisible in the RGB images, further validating the different transmission models of visual and thermal light through glass. Our thermal-only variant tends to recognize the distinct boundaries which may mislead the segmentation. We provide more visual results in the supplementary materials.
| Method | Images with glass | Images without glass | All images | |||||
|---|---|---|---|---|---|---|---|---|
| MAE | IOU | F | BER | MAE | IOU | FPR | MAE | |
| Thermal-only | 0.189 | 68.63 | 0.781 | 19.315 | 0.136 | 86.68 | 0.55 | 0.018 |
| Dual-Thermal | 0.189 | 68.47 | 0.783 | 19.120 | 0.120 | 88.34 | 0.50 | 0.018 |
| RGB-only | 0.056 | 88.94 | 0.929 | 6.618 | 0.016 | 98.42 | 0.11 | 0.052 |
| Dual-RGB | 0.055 | 89.21 | 0.932 | 6.250 | 0.018 | 98.25 | 0.10 | 0.050 |
| RGB-T (Ours) | 0.027 | 93.80 | 0.965 | 4.078 | 0.003 | 99.73 | 0.07 | 0.024 |
VI-D Evaluations on GDD dataset [4]
Table II compares our RGB-only variant with four state-of-the-art glass segmentation methods: MirrorNet [119], GDNet [4], Translab [14] and EBLNet [6]. Both our variant and compared methods are trained and tested on the RGB-only glass segmentation dataset GDD [4]. Our RGB-only variant removes the thermal branch from our RGB-T architecture and the resulted RGB-only architecture is a combination of convolution and transformer, while the four existing methods adopt convolution only. Our RGB-only variant achieves the best in IOU and MAE and the second best in BER, echoing recent other recognition methods (e.g., object detection [120], wireframe parsing [121]) which also demonstrate the effectiveness of the hybrid structure of convolution and transformer.
VI-E Evaluations on RGB-T SOD datasets
To show the versatility of our method on other RGB-T tasks, we retrain our model on the 2500 training images from VT5000 dataset [122] for RGB-T salient object detection (SOD), then evaluate on the 2500 testing images from VT5000 dataset and 1000 images from VT1000 dataset [47]. Nine state-of-the-art RGB-T SOD methods are compared including three conventional graph-based methods (MTMR [83], M3S-NIR [84], SGDL [47]) and six deep learning based methods (ADF [122], MIDD [89], APNet [50], ECFFNet [49], MIA-DPD [123], DCNet [53]). We take the mean absolute error (MAE), S-measure () [124], and maximum F-measure () to evaluate the SOD results. As shown in Table III, our method is comparable with others specifically designed for RGB-T SOD.
| Method | Images with glass | Images without glass | All images | |||||
|---|---|---|---|---|---|---|---|---|
| MAE | IOU | F | BER | MAE | IOU | FPR | MAE | |
| SFS | 0.058 | 89.88 | 0.946 | 5.865 | 0.041 | 96.08 | 0.29 | 0.045 |
| SFC | 0.052 | 90.47 | 0.945 | 5.588 | 0.025 | 98.15 | 0.36 | 0.043 |
| PAF [9] | 0.038 | 91.73 | 0.954 | 5.188 | 0.010 | 99.04 | 0.05 | 0.035 |
| AT [40] | 0.038 | 91.96 | 0.953 | 4.885 | 0.016 | 98.48 | 0.20 | 0.033 |
| MFM-EGFNet [74] | 0.030 | 92.82 | 0.960 | 5.328 | 0.006 | 99.42 | 0.10 | 0.028 |
| MFM-DS | 0.031 | 93.06 | 0.959 | 4.392 | 0.004 | 99.59 | 0.05 | 0.027 |
| MFM-DC | 0.033 | 92.75 | 0.958 | 4.565 | 0.003 | 99.69 | 0.06 | 0.029 |
| MFM (Ours) | 0.027 | 93.80 | 0.965 | 4.078 | 0.003 | 99.73 | 0.07 | 0.024 |
| Method | Images with glass | Images without glass | All images | |||||
|---|---|---|---|---|---|---|---|---|
| MAE | IOU | F | BER | MAE | IOU | FPR | MAE | |
| ResNet-18 | 0.033 | 92.34 | 0.956 | 5.388 | 0.006 | 99.48 | 0.09 | 0.031 |
| ResNet-34 | 0.031 | 92.96 | 0.959 | 5.049 | 0.011 | 98.90 | 0.12 | 0.030 |
| ResNet-101 | 0.030 | 93.14 | 0.961 | 4.982 | 0.010 | 99.04 | 0.07 | 0.029 |
| ResNet-50 w/o pretraining | 0.057 | 87.29 | 0.924 | 8.063 | 0.064 | 94.02 | 0.50 | 0.057 |
| ResNet-50 (Ours) | 0.027 | 93.80 | 0.965 | 4.078 | 0.003 | 99.73 | 0.07 | 0.024 |
| Method | Images with glass | Images without glass | All images | |||||
|---|---|---|---|---|---|---|---|---|
| MAE | IOU | F | BER | MAE | IOU | FPR | MAE | |
| Decoder-DS | 0.033 | 92.87 | 0.960 | 4.460 | 0.007 | 99.30 | 0.11 | 0.030 |
| Decoder-DC | 0.034 | 92.42 | 0.956 | 4.907 | 0.008 | 99.24 | 0.10 | 0.031 |
| Decoder (Ours) | 0.027 | 93.80 | 0.965 | 4.078 | 0.003 | 99.73 | 0.07 | 0.024 |
| Method | Images with glass | Images without glass | All images | |||||
|---|---|---|---|---|---|---|---|---|
| MAE | IOU | F | BER | MAE | IOU | FPR | MAE | |
| Training w/ glass images only | 0.029 | 93.03 | 0.960 | 5.116 | 0.006 | 99.36 | 0.09 | 0.028 |
| Training w/ all images (Ours) | 0.027 | 93.80 | 0.965 | 4.078 | 0.003 | 99.73 | 0.07 | 0.024 |
VI-F Ablation Studies and Limitations
Below we evaluate the contributions of different components of our architecture, followed by limitation analysis.
Impact of inputs: In Table I, we obtain our RGB-only or thermal-only variant by removing the corresponding encoders from our architecture. To verify that the performance decrease is not due to the architectural change, we additionally train another two models by inputting the same RGB/thermal images to both encoders (dual-RGB/thermal). Table IV shows that the differences between RGB/thermal-only and dual-RGB/thermal are negligible, validating that the accuracy gap is because of using single modality rather than architectural differences.
Effectiveness of MFM: We compare our method with four simple baselines by replacing the MFM with the simple feature summation (SFS), simple feature concatenation (SFC), the pixel-wise attention fusion (PAF) [9] and affine transform (AT) [40]. The multi-modal fusion module from EGFNet [74] for RGB-T fusion are also utilized to replace our MFM. We also modify our MFM by replacing the weighted summation with direct summation (DS) or direct concatenation (DC), where the attention weights are discarded in the two variants. As shown in Table V, our variants using the MFM (the last row) achieves the best performance.
Selection of backbones: Following other related methods [110, 111, 35, 30, 112], we exploit a pretrained ResNet backbone. In Table VI, we evaluate different pretrained backbones and the ResNet-50 backbone without pretraining. We can see that pretraining is critical for the performance and the ResNet-50 yields the best results. We believe that the performance decrease of ResNet-101 is due to over-parameterization which makes it hard to train.
Variants of our decoder: Similar to the evaluation of the weighted summation in MFM, we also replace the weighted summation in decoder blocks with direct summation (DS) or direct concatenation (DC). As shown in Table VII, our decoder that uses weighted summation outperforms the other two variants.
Images without glass: To reduce the false positive segmentation, our training data includes 370 RGB-thermal images pairs without any glass. As shown in Table VIII, the model trained on only glass images has an obvious performance decrease on both images with and without glass, which demonstrates the necessity of such samples.
Failure cases: The first row in Fig. 8 shows that our method fails when the visual appearances of glass and non-glass regions are highly similar in both RGB and thermal images, which is also a difficult, if not impossible, task for the human eye to differentiate without looking at the GT mask beforehand. Our method also fails to detect small glass regions, as highlighted by the red arrow in the second row.
VII Application
VII-A Monocular 3D Reconstruction
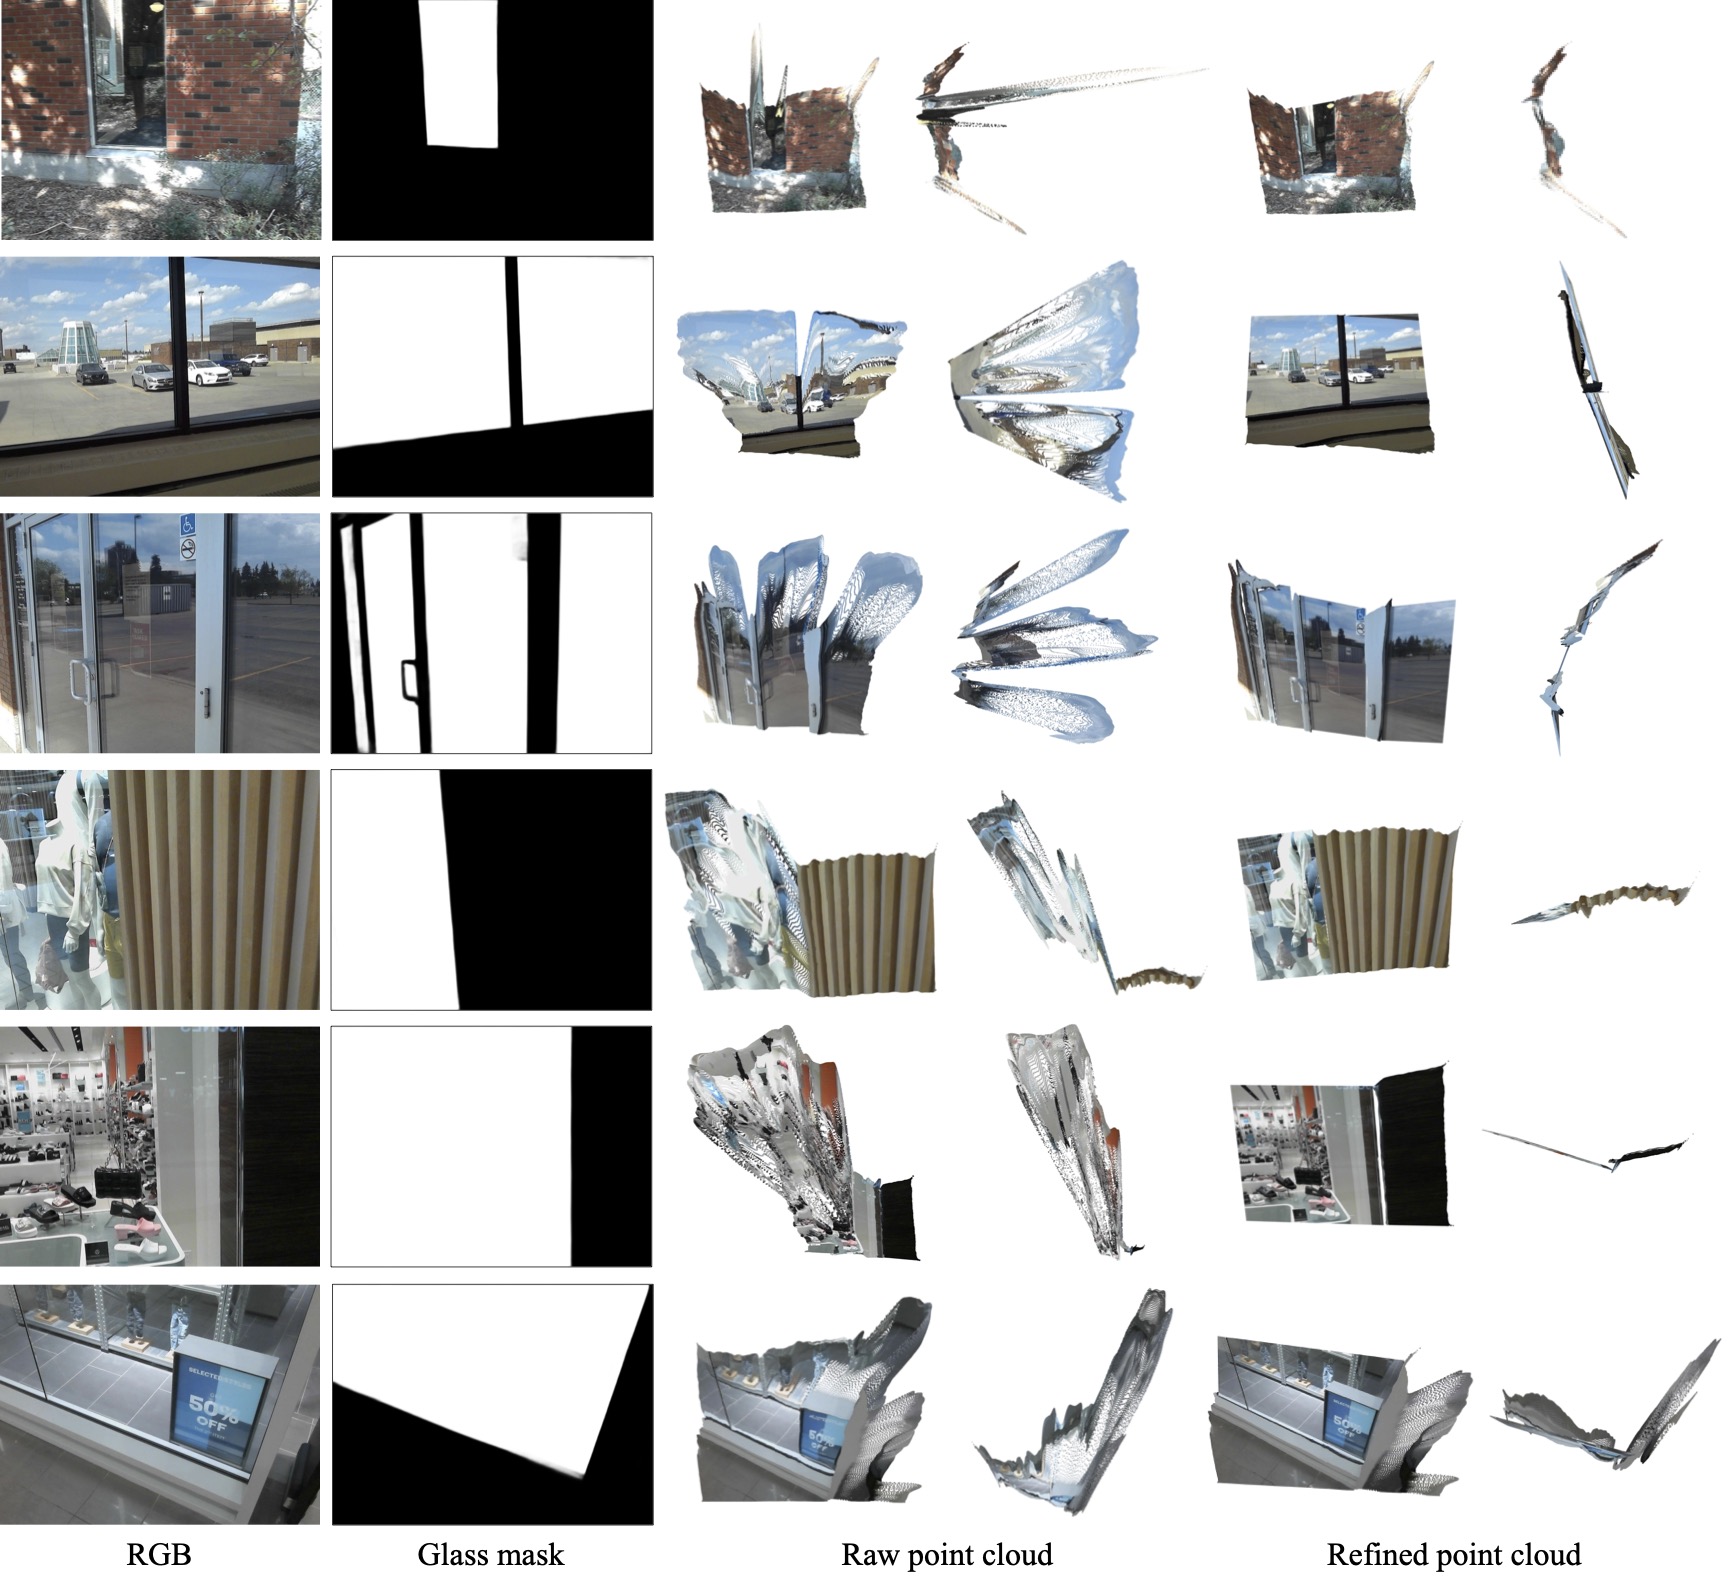
State-of-the-art 3D reconstruction approaches including recent deep-learning-based ones [125, 126, 127] exhibit challenges when handling scenes with glass (e.g., urban buildings, indoor scenes). While it seems that glass elements occupy a relatively small region in an entire scene, inaccurate glass geometry is catastrophic to the overall 3D reconstruction performance (see Fig. 9), leading to undesirable geometry artifacts and subsequent unpleasant user experiences in downstream applications including augmented reality, gaming, navigation, rendering.
To correct such reconstruction errors in glass regions, we apply our RGB-T glass segmentation method and recover each glass region as a 3D plane. Specifically, we first adopt a recent monocular reconstruction method [125] for depth estimation. We then follow Mirror3D [128] and estimate the 3D glass plane parameters based on the depths of the boundary pixels of glass regions. The final 3D point clouds are generated with pre-defined camera intrinsics in Open3D [129]. As shown in Fig. 9, by accurately segmenting glass surfaces, our plane-based depth correction strategy significantly improves 3D reconstruction results compared to the raw point clouds from [125].
VII-B Semantic Segmentation
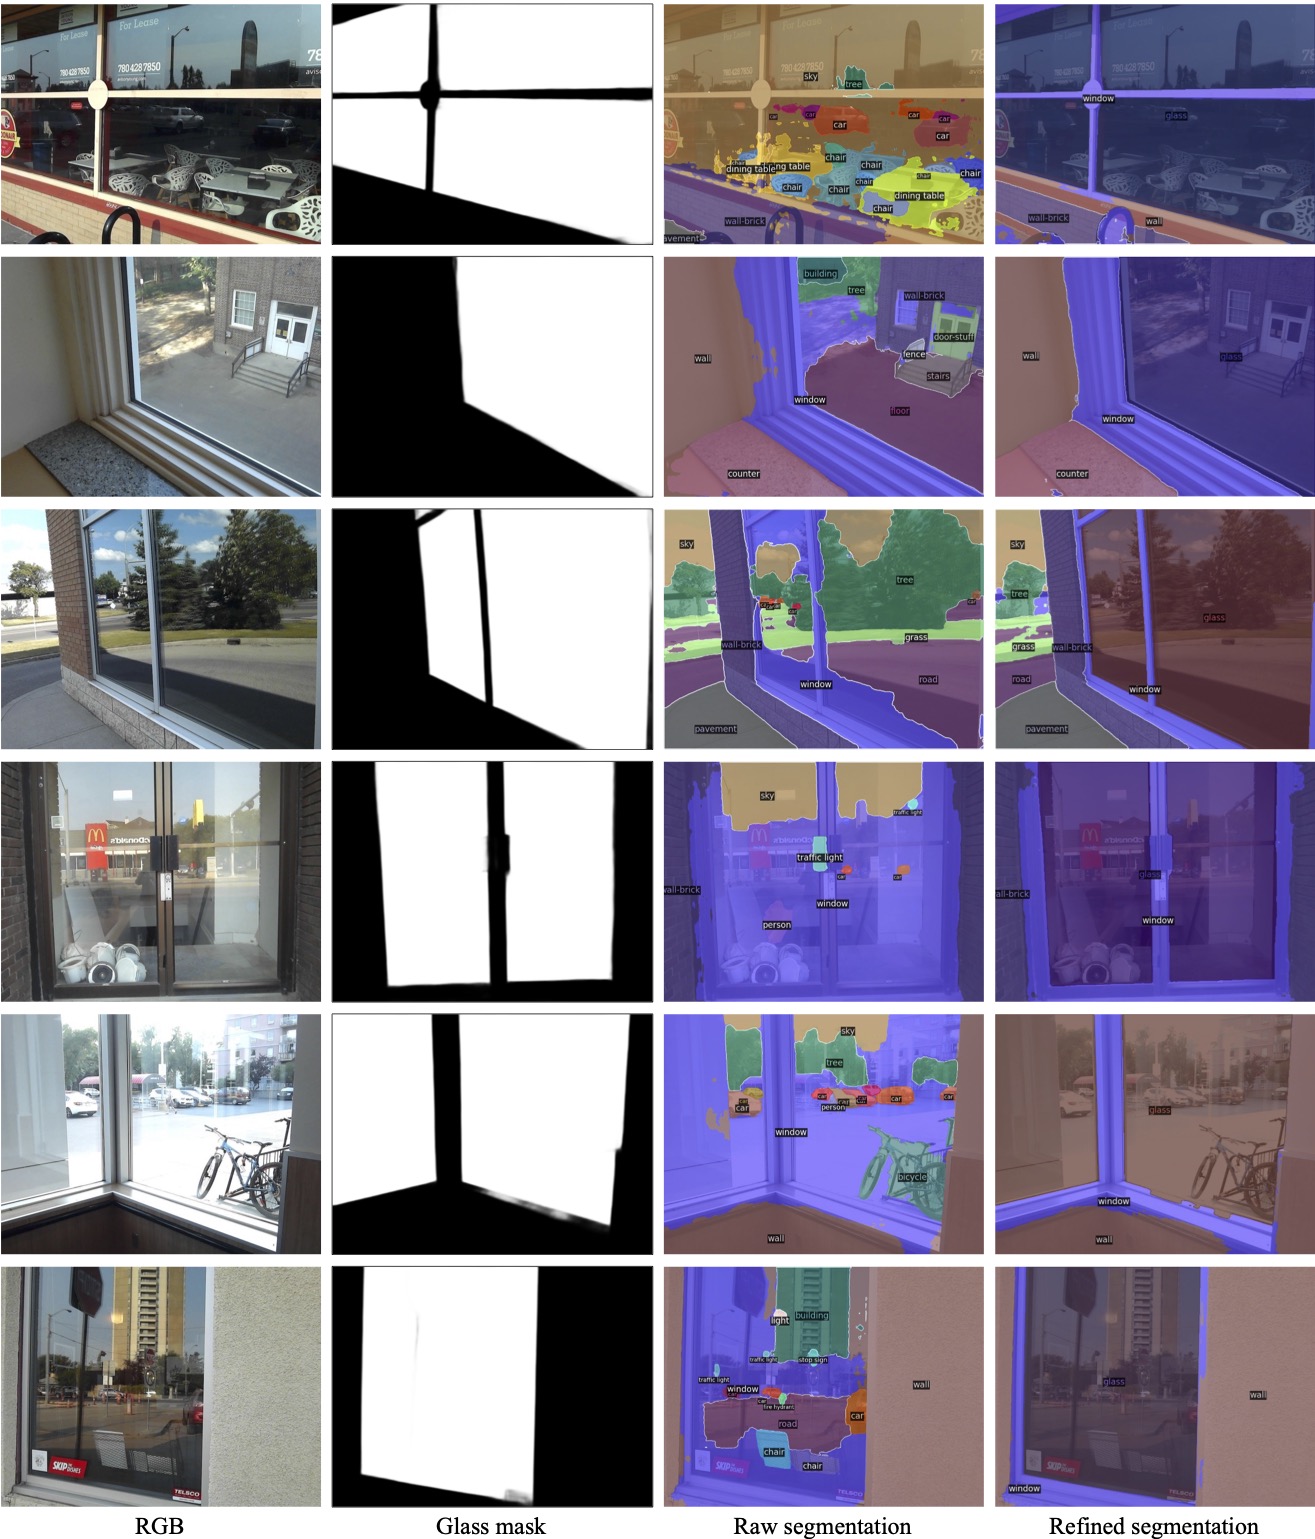
Similar problems also arise in semantic image segmentation [120, 130, 66], as shown in Fig. 10 where the reflections on glass surfaces are mis-recognized. To correct those errors, we first utilize our RGB-T segmentation method to obtain glass masks and set the glass regions of RGB images to zero, which serve as inputs to a transformer architecture DETR [120] (designed for both object detection and semantic segmentation) to get the refined semantic segmentation results. As shown in Fig. 10, such a simple strategy effectively eliminate inaccurate semantic segmentation.
VIII Conclusion and future work
The paper presents the idea of leveraging RGB-T image pairs for glass segmentation. We propose a novel neural architecture for fusing features of the RGB and thermal modalities. We also contribute the first RGB-T glass scene dataset with GT masks. Our extensive evaluations reveal the significantly better performance of using an RGB-T pair over using a single RGB image, and demonstrate the superiority of our cross-modality fusion method against existing fusion methods using the same RGB-T input. Polarization method has drawbacks in that detection is sparse for a plate glass, which can be confused by glass and other dielectric surfaces, and might not work when transmission reflection. Since polarization and our method use completely different cues, they can be combined as “RGB + polarization + thermal” (polarized RGB like [9] or polarized thermal [131]) to improve the result, which is an interesting future work. We could also add an invisible thermal light to handle the limitation of our methods, which becomes an active method. As shown in the first row of Fig. 8, glass and non-glass regions are highly similar in both RGB and thermal images. Considering the different smoothness of glass surface and other materials like brick wall, the thermal camera should obtain clear reflection of the thermal light source on glass while a blurry light cone on others.
IX Acknowledgments
The authors would like to thank Steve Sutphen for his technical support and the Natural Sciences and Engineering Research Council of Canada, the University of Alberta and the University of Manitoba for the partial financial funding.
References
- [1] S. Sajjan, M. Moore, M. Pan, G. Nagaraja, J. Lee, A. Zeng, and S. Song, “Clear grasp: 3d shape estimation of transparent objects for manipulation,” in 2020 IEEE International Conference on Robotics and Automation (ICRA). IEEE, 2020, pp. 3634–3642.
- [2] S. S. Martínez, J. G. Ortega, J. G. García, A. S. García, and E. E. Estévez, “An industrial vision system for surface quality inspection of transparent parts,” The International Journal of Advanced Manufacturing Technology, vol. 68, no. 5-8, pp. 1123–1136, 2013.
- [3] J. Zhang, K. Yang, A. Constantinescu, K. Peng, K. Muller, and R. Stiefelhagen, “Trans4trans: Efficient transformer for transparent object segmentation to help visually impaired people navigate in the real world,” in Proceedings of the IEEE/CVF International Conference on Computer Vision, 2021, pp. 1760–1770.
- [4] H. Mei, X. Yang, Y. Wang, Y. Liu, S. He, Q. Zhang, X. Wei, and R. W. Lau, “Don’t hit me! glass detection in real-world scenes,” in Proceedings of the IEEE/CVF Conference on Computer Vision and Pattern Recognition, 2020, pp. 3687–3696.
- [5] J. Lin, Z. He, and R. W. Lau, “Rich context aggregation with reflection prior for glass surface detection,” in Proceedings of the IEEE/CVF Conference on Computer Vision and Pattern Recognition, 2021, pp. 13 415–13 424.
- [6] H. He, X. Li, G. Cheng, J. Shi, Y. Tong, G. Meng, V. Prinet, and L. Weng, “Enhanced boundary learning for glass-like object segmentation,” in Proceedings of the IEEE/CVF International Conference on Computer Vision (ICCV), October 2021, pp. 15 859–15 868.
- [7] T. Wang, X. He, and N. Barnes, “Glass object segmentation by label transfer on joint depth and appearance manifolds,” in 2013 IEEE International Conference on Image Processing. IEEE, 2013, pp. 2944–2948.
- [8] Y. Xu, H. Nagahara, A. Shimada, and R.-i. Taniguchi, “Transcut: Transparent object segmentation from a light-field image,” in Proceedings of the IEEE International Conference on Computer Vision, 2015, pp. 3442–3450.
- [9] A. Kalra, V. Taamazyan, S. K. Rao, K. Venkataraman, R. Raskar, and A. Kadambi, “Deep polarization cues for transparent object segmentation,” in Proceedings of the IEEE/CVF Conference on Computer Vision and Pattern Recognition, 2020, pp. 8602–8611.
- [10] M. Fritz, G. Bradski, S. Karayev, T. Darrell, and M. Black, “An additive latent feature model for transparent object recognition,” Advances in Neural Information Processing Systems, vol. 22, pp. 558–566, 2009.
- [11] K. McHenry and J. Ponce, “A geodesic active contour framework for finding glass,” in 2006 IEEE Computer Society Conference on Computer Vision and Pattern Recognition (CVPR’06), vol. 1. IEEE, 2006, pp. 1038–1044.
- [12] K. McHenry, J. Ponce, and D. Forsyth, “Finding glass,” in 2005 IEEE Computer Society Conference on Computer Vision and Pattern Recognition (CVPR’05), vol. 2. IEEE, 2005, pp. 973–979.
- [13] C. J. Phillips, K. G. Derpanis, and K. Daniilidis, “A novel stereoscopic cue for figure-ground segregation of semi-transparent objects,” in 2011 IEEE International Conference on Computer Vision Workshops (ICCV Workshops). IEEE, 2011, pp. 1100–1107.
- [14] E. Xie, W. Wang, W. Wang, M. Ding, C. Shen, and P. Luo, “Segmenting transparent objects in the wild,” in Computer Vision–ECCV 2020: 16th European Conference, Glasgow, UK, August 23–28, 2020, Proceedings, Part XIII 16. Springer, 2020, pp. 696–711.
- [15] E. Xie, W. Wang, W. Wang, P. Sun, H. Xu, D. Liang, and P. Luo, “Segmenting transparent object in the wild with transformer,” arXiv preprint arXiv:2101.08461, 2021.
- [16] C. Zheng, D. Shi, X. Yan, D. Liang, X. Yang, Y. Guo, H. Xie et al., “Glassnet: Label decoupling-based three-stream neural network for robust image glass detection,” arXiv preprint arXiv:2108.11117, 2021.
- [17] Y. Zhu, J. Qiu, and B. Ren, “Transfusion: A novel slam method focused on transparent objects,” in Proceedings of the IEEE/CVF International Conference on Computer Vision, 2021, pp. 6019–6028.
- [18] G. Chen, K. Han, and K.-Y. K. Wong, “Tom-net: Learning transparent object matting from a single image,” in Proceedings of the IEEE Conference on Computer Vision and Pattern Recognition, 2018, pp. 9233–9241.
- [19] V. Seib, A. Barthen, P. Marohn, and D. Paulus, “Friend or foe: exploiting sensor failures for transparent object localization and classification,” in 2016 International Conference on Robotics and Machine Vision, vol. 10253. International Society for Optics and Photonics, 2017, p. 102530I.
- [20] T. Whelan, M. Goesele, S. J. Lovegrove, J. Straub, S. Green, R. Szeliski, S. Butterfield, S. Verma, R. A. Newcombe, M. Goesele et al., “Reconstructing scenes with mirror and glass surfaces.” ACM Trans. Graph., vol. 37, no. 4, pp. 102–1, 2018.
- [21] Y. Li, X. Hou, C. Koch, J. M. Rehg, and A. L. Yuille, “The secrets of salient object segmentation,” in Proceedings of the IEEE conference on computer vision and pattern recognition, 2014, pp. 280–287.
- [22] F. Perazzi, P. Krähenbühl, Y. Pritch, and A. Hornung, “Saliency filters: Contrast based filtering for salient region detection,” in 2012 IEEE conference on computer vision and pattern recognition. IEEE, 2012, pp. 733–740.
- [23] Q. Yan, L. Xu, J. Shi, and J. Jia, “Hierarchical saliency detection,” in Proceedings of the IEEE conference on computer vision and pattern recognition, 2013, pp. 1155–1162.
- [24] X. Qin, Z. Zhang, C. Huang, C. Gao, M. Dehghan, and M. Jagersand, “Basnet: Boundary-aware salient object detection,” in Proceedings of the IEEE/CVF Conference on Computer Vision and Pattern Recognition, 2019, pp. 7479–7489.
- [25] Y. Pang, X. Zhao, L. Zhang, and H. Lu, “Multi-scale interactive network for salient object detection,” in Proceedings of the IEEE/CVF Conference on Computer Vision and Pattern Recognition, 2020, pp. 9413–9422.
- [26] H. Zhou, X. Xie, J.-H. Lai, Z. Chen, and L. Yang, “Interactive two-stream decoder for accurate and fast saliency detection,” in Proceedings of the IEEE/CVF Conference on Computer Vision and Pattern Recognition, 2020, pp. 9141–9150.
- [27] L. Tang, B. Li, Y. Zhong, S. Ding, and M. Song, “Disentangled high quality salient object detection,” in Proceedings of the IEEE/CVF International Conference on Computer Vision, 2021, pp. 3580–3590.
- [28] A. Siris, J. Jiao, G. K. Tam, X. Xie, and R. W. Lau, “Scene context-aware salient object detection,” in Proceedings of the IEEE/CVF International Conference on Computer Vision, 2021, pp. 4156–4166.
- [29] K. Fu, D.-P. Fan, G.-P. Ji, and Q. Zhao, “Jl-dcf: Joint learning and densely-cooperative fusion framework for rgb-d salient object detection,” in Proceedings of the IEEE/CVF conference on computer vision and pattern recognition, 2020, pp. 3052–3062.
- [30] J. Zhang, D.-P. Fan, Y. Dai, S. Anwar, F. S. Saleh, T. Zhang, and N. Barnes, “Uc-net: Uncertainty inspired rgb-d saliency detection via conditional variational autoencoders,” in Proceedings of the IEEE/CVF conference on computer vision and pattern recognition, 2020, pp. 8582–8591.
- [31] X. Zhao, L. Zhang, Y. Pang, H. Lu, and L. Zhang, “A single stream network for robust and real-time rgb-d salient object detection,” in European Conference on Computer Vision. Springer, 2020, pp. 646–662.
- [32] Q. Chen, Z. Liu, Y. Zhang, K. Fu, Q. Zhao, and H. Du, “Rgb-d salient object detection via 3d convolutional neural networks,” in Proceedings of the AAAI Conference on Artificial Intelligence, vol. 35, 2021, pp. 1063–1071.
- [33] Y. Pang, L. Zhang, X. Zhao, and H. Lu, “Hierarchical dynamic filtering network for rgb-d salient object detection,” in Computer Vision–ECCV 2020: 16th European Conference, Glasgow, UK, August 23–28, 2020, Proceedings, Part XXV 16. Springer, 2020, pp. 235–252.
- [34] Y. Piao, Z. Rong, M. Zhang, W. Ren, and H. Lu, “A2dele: Adaptive and attentive depth distiller for efficient rgb-d salient object detection,” in Proceedings of the IEEE/CVF Conference on Computer Vision and Pattern Recognition, 2020, pp. 9060–9069.
- [35] M. Zhang, W. Ren, Y. Piao, Z. Rong, and H. Lu, “Select, supplement and focus for rgb-d saliency detection,” in Proceedings of the IEEE/CVF Conference on Computer Vision and Pattern Recognition, 2020, pp. 3472–3481.
- [36] D.-P. Fan, Y. Zhai, A. Borji, J. Yang, and L. Shao, “Bbs-net: Rgb-d salient object detection with a bifurcated backbone strategy network,” in European Conference on Computer Vision. Springer, 2020, pp. 275–292.
- [37] P. Sun, W. Zhang, H. Wang, S. Li, and X. Li, “Deep rgb-d saliency detection with depth-sensitive attention and automatic multi-modal fusion,” in Proceedings of the IEEE/CVF Conference on Computer Vision and Pattern Recognition, 2021, pp. 1407–1417.
- [38] W. Ji, J. Li, S. Yu, M. Zhang, Y. Piao, S. Yao, Q. Bi, K. Ma, Y. Zheng, H. Lu et al., “Calibrated rgb-d salient object detection,” in Proceedings of the IEEE/CVF Conference on Computer Vision and Pattern Recognition, 2021, pp. 9471–9481.
- [39] S. Chen and Y. Fu, “Progressively guided alternate refinement network for rgb-d salient object detection,” in European Conference on Computer Vision. Springer, 2020, pp. 520–538.
- [40] C. Li, R. Cong, Y. Piao, Q. Xu, and C. C. Loy, “Rgb-d salient object detection with cross-modality modulation and selection,” in European Conference on Computer Vision. Springer, 2020, pp. 225–241.
- [41] T. Zhou, H. Fu, G. Chen, Y. Zhou, D.-P. Fan, and L. Shao, “Specificity-preserving rgb-d saliency detection,” in Proceedings of the IEEE/CVF International Conference on Computer Vision, 2021, pp. 4681–4691.
- [42] A. Luo, X. Li, F. Yang, Z. Jiao, H. Cheng, and S. Lyu, “Cascade graph neural networks for rgb-d salient object detection,” in European Conference on Computer Vision. Springer, 2020, pp. 346–364.
- [43] J. Zhang, D.-P. Fan, Y. Dai, X. Yu, Y. Zhong, N. Barnes, and L. Shao, “Rgb-d saliency detection via cascaded mutual information minimization,” in Proceedings of the IEEE/CVF International Conference on Computer Vision, 2021, pp. 4338–4347.
- [44] N. Liu, N. Zhang, and J. Han, “Learning selective self-mutual attention for rgb-d saliency detection,” in Proceedings of the IEEE/CVF Conference on Computer Vision and Pattern Recognition, 2020, pp. 13 756–13 765.
- [45] M. Zhang, S. X. Fei, J. Liu, S. Xu, Y. Piao, and H. Lu, “Asymmetric two-stream architecture for accurate rgb-d saliency detection,” in European Conference on Computer Vision. Springer, 2020, pp. 374–390.
- [46] N. Liu, N. Zhang, K. Wan, L. Shao, and J. Han, “Visual saliency transformer,” in Proceedings of the IEEE/CVF International Conference on Computer Vision, 2021, pp. 4722–4732.
- [47] Z. Tu, T. Xia, C. Li, X. Wang, Y. Ma, and J. Tang, “Rgb-t image saliency detection via collaborative graph learning,” IEEE Transactions on Multimedia, vol. 22, no. 1, pp. 160–173, 2019.
- [48] Q. Zhang, T. Xiao, N. Huang, D. Zhang, and J. Han, “Revisiting feature fusion for rgb-t salient object detection,” IEEE Transactions on Circuits and Systems for Video Technology, vol. 31, no. 5, pp. 1804–1818, 2020.
- [49] W. Zhou, Q. Guo, J. Lei, L. Yu, and J.-N. Hwang, “Ecffnet: Effective and consistent feature fusion network for rgb-t salient object detection,” IEEE Transactions on Circuits and Systems for Video Technology, vol. 32, no. 3, pp. 1224–1235, 2021.
- [50] W. Zhou, Y. Zhu, J. Lei, J. Wan, and L. Yu, “Apnet: Adversarial learning assistance and perceived importance fusion network for all-day rgb-t salient object detection,” IEEE Transactions on Emerging Topics in Computational Intelligence, 2021.
- [51] F. Sun, W. Zhou, L. Ye, and L. Yu, “Hierarchical decoding network based on swin transformer for detecting salient objects in rgb-t images,” IEEE Signal Processing Letters, vol. 29, pp. 1714–1718, 2022.
- [52] J. Wu, W. Zhou, X. Qian, J. Lei, L. Yu, and T. Luo, “Mfenet: Multitype fusion and enhancement network for detecting salient objects in rgb-t images,” Digital Signal Processing, vol. 133, p. 103827, 2023.
- [53] Z. Tu, Z. Li, C. Li, and J. Tang, “Weakly alignment-free rgbt salient object detection with deep correlation network,” IEEE Transactions on Image Processing, 2022.
- [54] C. Li, X. Liang, Y. Lu, N. Zhao, and J. Tang, “Rgb-t object tracking: Benchmark and baseline,” Pattern Recognition, vol. 96, p. 106977, 2019.
- [55] L. Zhang, M. Danelljan, A. Gonzalez-Garcia, J. van de Weijer, and F. Shahbaz Khan, “Multi-modal fusion for end-to-end rgb-t tracking,” in Proceedings of the IEEE/CVF International Conference on Computer Vision Workshops, 2019, pp. 0–0.
- [56] C. Wang, C. Xu, Z. Cui, L. Zhou, T. Zhang, X. Zhang, and J. Yang, “Cross-modal pattern-propagation for rgb-t tracking,” in Proceedings of the IEEE/CVF Conference on Computer Vision and Pattern Recognition, 2020, pp. 7064–7073.
- [57] P. Zhang, J. Zhao, C. Bo, D. Wang, H. Lu, and X. Yang, “Jointly modeling motion and appearance cues for robust rgb-t tracking,” IEEE Transactions on Image Processing, vol. 30, pp. 3335–3347, 2021.
- [58] F. Zhang, S. Ma, Z. Li, and Y. Zhang, “Rgb-t tracking via multi-expert correlation filters using spatial-temporal robustness,” in 2020 5th International Conference on Mechanical, Control and Computer Engineering (ICMCCE). IEEE, 2020, pp. 360–364.
- [59] Z. Tu, W. Pan, Y. Duan, J. Tang, and C. Li, “Rgbt tracking via reliable feature configuration,” Science China Information Sciences, vol. 65, no. 4, pp. 1–13, 2022.
- [60] X. Zhang, P. Ye, S. Peng, J. Liu, and G. Xiao, “Dsiammft: An rgb-t fusion tracking method via dynamic siamese networks using multi-layer feature fusion,” Signal Processing: Image Communication, vol. 84, p. 115756, 2020.
- [61] C. Li, X. Wang, L. Zhang, J. Tang, H. Wu, and L. Lin, “Weighted low-rank decomposition for robust grayscale-thermal foreground detection,” IEEE Transactions on Circuits and Systems for Video Technology, vol. 27, no. 4, pp. 725–738, 2016.
- [62] B. Zhao, Z. Li, M. Liu, W. Cao, and H. Liu, “Infrared and visible imagery fusion based on region saliency detection for 24-hour-surveillance systems,” in 2013 IEEE International Conference on Robotics and Biomimetics (ROBIO). IEEE, 2013, pp. 1083–1088.
- [63] S. Yang, B. Luo, C. Li, G. Wang, and J. Tang, “Fast grayscale-thermal foreground detection with collaborative low-rank decomposition,” IEEE Transactions on Circuits and Systems for Video Technology, vol. 28, no. 10, pp. 2574–2585, 2017.
- [64] T. Alldieck, C. H. Bahnsen, and T. B. Moeslund, “Context-aware fusion of rgb and thermal imagery for traffic monitoring,” Sensors, vol. 16, no. 11, p. 1947, 2016.
- [65] S. Gundimada, V. K. Asari, and N. Gudur, “Face recognition in multi-sensor images based on a novel modular feature selection technique,” Information Fusion, vol. 11, no. 2, pp. 124–132, 2010.
- [66] W. Zhou, J. Liu, J. Lei, L. Yu, and J.-N. Hwang, “Gmnet: graded-feature multilabel-learning network for rgb-thermal urban scene semantic segmentation,” IEEE Transactions on Image Processing, vol. 30, pp. 7790–7802, 2021.
- [67] Q. Zhang, S. Zhao, Y. Luo, D. Zhang, N. Huang, and J. Han, “Abmdrnet: Adaptive-weighted bi-directional modality difference reduction network for rgb-t semantic segmentation,” in Proceedings of the IEEE/CVF Conference on Computer Vision and Pattern Recognition, 2021, pp. 2633–2642.
- [68] Q. Ha, K. Watanabe, T. Karasawa, Y. Ushiku, and T. Harada, “Mfnet: Towards real-time semantic segmentation for autonomous vehicles with multi-spectral scenes,” in 2017 IEEE/RSJ International Conference on Intelligent Robots and Systems (IROS). IEEE, 2017, pp. 5108–5115.
- [69] S. S. Shivakumar, N. Rodrigues, A. Zhou, I. D. Miller, V. Kumar, and C. J. Taylor, “Pst900: Rgb-thermal calibration, dataset and segmentation network,” in 2020 IEEE International Conference on Robotics and Automation (ICRA). IEEE, 2020, pp. 9441–9447.
- [70] Y. Sun, W. Zuo, and M. Liu, “Rtfnet: Rgb-thermal fusion network for semantic segmentation of urban scenes,” IEEE Robotics and Automation Letters, vol. 4, no. 3, pp. 2576–2583, 2019.
- [71] Z. Kütük and G. Algan, “Semantic segmentation for thermal images: A comparative survey,” in Proceedings of the IEEE/CVF Conference on Computer Vision and Pattern Recognition, 2022, pp. 286–295.
- [72] Y. Sun, W. Zuo, P. Yun, H. Wang, and M. Liu, “Fuseseg: Semantic segmentation of urban scenes based on rgb and thermal data fusion,” IEEE Transactions on Automation Science and Engineering, vol. 18, no. 3, pp. 1000–1011, 2020.
- [73] T. Gong, W. Zhou, X. Qian, J. Lei, and L. Yu, “Global contextually guided lightweight network for rgb-thermal urban scene understanding,” Engineering Applications of Artificial Intelligence, vol. 117, p. 105510, 2023.
- [74] W. Zhou, S. Dong, C. Xu, and Y. Qian, “Edge-aware guidance fusion network for rgb–thermal scene parsing,” in Proceedings of the AAAI Conference on Artificial Intelligence, vol. 36, no. 3, 2022, pp. 3571–3579.
- [75] W. Zhou, X. Lin, J. Lei, L. Yu, and J.-N. Hwang, “Mffenet: Multiscale feature fusion and enhancement network for rgb–thermal urban road scene parsing,” IEEE Transactions on Multimedia, vol. 24, pp. 2526–2538, 2021.
- [76] W. Zhou, S. Dong, J. Lei, and L. Yu, “Mtanet: Multitask-aware network with hierarchical multimodal fusion for rgb-t urban scene understanding,” IEEE Transactions on Intelligent Vehicles, 2022.
- [77] Y.-L. Hou, Y. Jia, Z. Hou, X. Hao, and Y. Shen, “Iaffnet: Illumination-aware feature fusion network for all-day rgb-thermal semantic segmentation of road scenes,” IEEE Access, 2022.
- [78] W. Zhou, Y. Pan, J. Lei, L. Ye, and L. Yu, “Defnet: Dual-branch enhanced feature fusion network for rgb-t crowd counting,” IEEE Transactions on Intelligent Transportation Systems, vol. 23, no. 12, pp. 24 540–24 549, 2022.
- [79] L. Liu, J. Chen, H. Wu, G. Li, C. Li, and L. Lin, “Cross-modal collaborative representation learning and a large-scale rgbt benchmark for crowd counting,” in Proceedings of the IEEE/CVF conference on computer vision and pattern recognition, 2021, pp. 4823–4833.
- [80] E. Pahwa, S. Kapadia, A. Luthra, and S. Sheeranali, “Conditional rgb-t fusion for effective crowd counting,” in 2022 IEEE International Conference on Image Processing (ICIP). IEEE, 2022, pp. 376–380.
- [81] Z. Liu, Y. Tan, W. Wu, and B. Tang, “Dilated high-resolution network driven rgb-t multi-modal crowd counting,” Signal Processing: Image Communication, p. 116915, 2022.
- [82] Q. Zhang, N. Huang, L. Yao, D. Zhang, C. Shan, and J. Han, “Rgb-t salient object detection via fusing multi-level cnn features,” IEEE Transactions on Image Processing, vol. 29, pp. 3321–3335, 2019.
- [83] G. Wang, C. Li, Y. Ma, A. Zheng, J. Tang, and B. Luo, “Rgb-t saliency detection benchmark: Dataset, baselines, analysis and a novel approach,” in Chinese Conference on Image and Graphics Technologies. Springer, 2018, pp. 359–369.
- [84] Z. Tu, T. Xia, C. Li, Y. Lu, and J. Tang, “M3s-nir: Multi-modal multi-scale noise-insensitive ranking for rgb-t saliency detection,” in 2019 IEEE Conference on Multimedia Information Processing and Retrieval (MIPR). IEEE, 2019, pp. 141–146.
- [85] W. Gao, G. Liao, S. Ma, G. Li, Y. Liang, and W. Lin, “Unified information fusion network for multi-modal rgb-d and rgb-t salient object detection,” IEEE Transactions on Circuits and Systems for Video Technology, 2021.
- [86] Q. Guo, W. Zhou, J. Lei, and L. Yu, “Tsfnet: Two-stage fusion network for rgb-t salient object detection,” IEEE Signal Processing Letters, vol. 28, pp. 1655–1659, 2021.
- [87] F. Huo, X. Zhu, L. Zhang, Q. Liu, and Y. Shu, “Efficient context-guided stacked refinement network for rgb-t salient object detection,” IEEE Transactions on Circuits and Systems for Video Technology, 2021.
- [88] J. Wang, K. Song, Y. Bao, L. Huang, and Y. Yan, “Cgfnet: Cross-guided fusion network for rgb-t salient object detection,” IEEE Transactions on Circuits and Systems for Video Technology, 2021.
- [89] Z. Tu, Z. Li, C. Li, Y. Lang, and J. Tang, “Multi-interactive dual-decoder for rgb-thermal salient object detection,” IEEE Transactions on Image Processing, vol. 30, pp. 5678–5691, 2021.
- [90] M. Vollmer and K.-P. Möllmann, Infrared thermal imaging: fundamentals, research and applications. Germany, Wiley, 2017.
- [91] A. K. Varshneya, “Industrial glass,” Encyclopedia Britannica, May 10, 2016.
- [92] C. B. Carter and M. G. Norton, Ceramic materials: science and engineering. United Kingdom, Springer, 2007.
- [93] M. Gehm and D. Brady, “Compressive sensing in the eo/ir,” Applied optics, vol. 54, no. 8, pp. C14–C22, 2015.
- [94] FLIR, “Flir one pro,” Retrieved from https://www.flir.com/products/flir-one-pro/, 2021.
- [95] ——, “Flir thermal studio suite,” Retrieved from https://www.flir.com/products/flir-thermal-studio-suite/, 2021.
- [96] B. C. Russell, A. Torralba, K. P. Murphy, and W. T. Freeman, “Labelme: a database and web-based tool for image annotation,” International journal of computer vision, vol. 77, no. 1-3, pp. 157–173, 2008.
- [97] S. Tosi, Matplotlib for Python developers. Packt Publishing Ltd, 2009.
- [98] O. Ronneberger, P. Fischer, and T. Brox, “U-net: Convolutional networks for biomedical image segmentation,” in International Conference on Medical image computing and computer-assisted intervention. Springer, 2015, pp. 234–241.
- [99] K. He, X. Zhang, S. Ren, and J. Sun, “Deep residual learning for image recognition,” in Proceedings of the IEEE conference on computer vision and pattern recognition, 2016, pp. 770–778.
- [100] N. Parmar, A. Vaswani, J. Uszkoreit, L. Kaiser, N. Shazeer, A. Ku, and D. Tran, “Image transformer,” in International Conference on Machine Learning. PMLR, 2018, pp. 4055–4064.
- [101] A. Prakash, K. Chitta, and A. Geiger, “Multi-modal fusion transformer for end-to-end autonomous driving,” in Proceedings of the IEEE/CVF Conference on Computer Vision and Pattern Recognition, 2021, pp. 7077–7087.
- [102] A. Vaswani, N. Shazeer, N. Parmar, J. Uszkoreit, L. Jones, A. N. Gomez, Ł. Kaiser, and I. Polosukhin, “Attention is all you need,” in Advances in neural information processing systems, 2017, pp. 5998–6008.
- [103] Y. Lee and J. Park, “Centermask: Real-time anchor-free instance segmentation,” in Proceedings of the IEEE/CVF conference on computer vision and pattern recognition, 2020, pp. 13 906–13 915.
- [104] J. Cao, H. Leng, D. Lischinski, D. Cohen-Or, C. Tu, and Y. Li, “Shapeconv: Shape-aware convolutional layer for indoor rgb-d semantic segmentation,” in Proceedings of the IEEE/CVF International Conference on Computer Vision, 2021, pp. 7088–7097.
- [105] D. Seichter, M. Köhler, B. Lewandowski, T. Wengefeld, and H.-M. Gross, “Efficient rgb-d semantic segmentation for indoor scene analysis,” in 2021 IEEE International Conference on Robotics and Automation (ICRA). IEEE, 2021, pp. 13 525–13 531.
- [106] H. Liu, J. Zhang, K. Yang, X. Hu, and R. Stiefelhagen, “Cmx: Cross-modal fusion for rgb-x semantic segmentation with transformers,” arXiv preprint arXiv:2203.04838, 2022.
- [107] E. Xie, W. Wang, Z. Yu, A. Anandkumar, J. M. Alvarez, and P. Luo, “Segformer: Simple and efficient design for semantic segmentation with transformers,” Advances in Neural Information Processing Systems, vol. 34, pp. 12 077–12 090, 2021.
- [108] R. Strudel, R. Garcia, I. Laptev, and C. Schmid, “Segmenter: Transformer for semantic segmentation,” in Proceedings of the IEEE/CVF International Conference on Computer Vision, 2021, pp. 7262–7272.
- [109] H. Xiong, W. Cai, and Q. Liu, “Mcnet: Multi-level correction network for thermal image semantic segmentation of nighttime driving scene,” Infrared Physics & Technology, vol. 113, p. 103628, 2021.
- [110] Z. Chen, R. Cong, Q. Xu, and Q. Huang, “Dpanet: Depth potentiality-aware gated attention network for rgb-d salient object detection,” IEEE Transactions on Image Processing, 2020.
- [111] G. Li, Z. Liu, M. Chen, Z. Bai, W. Lin, and H. Ling, “Hierarchical alternate interaction network for rgb-d salient object detection,” IEEE Transactions on Image Processing, vol. 30, pp. 3528–3542, 2021.
- [112] W. Ji, J. Li, M. Zhang, Y. Piao, and H. Lu, “Accurate rgb-d salient object detection via collaborative learning,” in Computer Vision–ECCV 2020: 16th European Conference, Glasgow, UK, August 23–28, 2020, Proceedings, Part XVIII 16. Springer, 2020, pp. 52–69.
- [113] M. Zhang, Y. Zhang, Y. Piao, B. Hu, and H. Lu, “Feature reintegration over differential treatment: A top-down and adaptive fusion network for rgb-d salient object detection,” in Proceedings of the 28th ACM International Conference on Multimedia, 2020, pp. 4107–4115.
- [114] Y. Zhao, J. Zhao, J. Li, and X. Chen, “Rgb-d salient object detection with ubiquitous target awareness,” IEEE Transactions on Image Processing, vol. 30, pp. 7717–7731, 2021.
- [115] J. Zhang, J. Xie, N. Barnes, and P. Li, “Learning generative vision transformer with energy-based latent space for saliency prediction,” Advances in Neural Information Processing Systems, vol. 34, pp. 15 448–15 463, 2021.
- [116] N. Kitaev, L. Kaiser, and A. Levskaya, “Reformer: The efficient transformer,” in International Conference on Learning Representations, 2019.
- [117] A. Paszke, S. Gross, F. Massa, A. Lerer, J. Bradbury, G. Chanan, T. Killeen, Z. Lin, N. Gimelshein, L. Antiga et al., “Pytorch: An imperative style, high-performance deep learning library,” Advances in neural information processing systems, vol. 32, pp. 8026–8037, 2019.
- [118] I. Loshchilov and F. Hutter, “Decoupled weight decay regularization,” arXiv preprint arXiv:1711.05101, 2017.
- [119] X. Yang, H. Mei, K. Xu, X. Wei, B. Yin, and R. W. Lau, “Where is my mirror?” in Proceedings of the IEEE/CVF International Conference on Computer Vision, 2019, pp. 8809–8818.
- [120] N. Carion, F. Massa, G. Synnaeve, N. Usunier, A. Kirillov, and S. Zagoruyko, “End-to-end object detection with transformers,” in European Conference on Computer Vision. Springer, 2020, pp. 213–229.
- [121] Y. Xu, W. Xu, D. Cheung, and Z. Tu, “Line segment detection using transformers without edges,” in Proceedings of the IEEE/CVF Conference on Computer Vision and Pattern Recognition, 2021, pp. 4257–4266.
- [122] Z. Tu, Y. Ma, Z. Li, C. Li, J. Xu, and Y. Liu, “Rgbt salient object detection: A large-scale dataset and benchmark,” IEEE Transactions on Multimedia, 2022.
- [123] Y. Liang, G. Qin, M. Sun, J. Qin, J. Yan, and Z. Zhang, “Multi-modal interactive attention and dual progressive decoding network for rgb-d/t salient object detection,” Neurocomputing, vol. 490, pp. 132–145, 2022.
- [124] D.-P. Fan, M.-M. Cheng, Y. Liu, T. Li, and A. Borji, “Structure-measure: A new way to evaluate foreground maps,” in Proceedings of the IEEE international conference on computer vision, 2017, pp. 4548–4557.
- [125] S. F. Bhat, I. Alhashim, and P. Wonka, “Adabins: Depth estimation using adaptive bins,” in Proceedings of the IEEE/CVF Conference on Computer Vision and Pattern Recognition, 2021, pp. 4009–4018.
- [126] M. Ramamonjisoa, M. Firman, J. Watson, V. Lepetit, and D. Turmukhambetov, “Single image depth prediction with wavelet decomposition,” in Proceedings of the IEEE/CVF Conference on Computer Vision and Pattern Recognition, 2021, pp. 11 089–11 098.
- [127] A. Zhang and J. Sun, “Joint depth and defocus estimation from a single image using physical consistency,” IEEE Transactions on Image Processing, vol. 30, pp. 3419–3433, 2021.
- [128] J. Tan, W. Lin, A. X. Chang, and M. Savva, “Mirror3d: Depth refinement for mirror surfaces,” in Proceedings of the IEEE/CVF Conference on Computer Vision and Pattern Recognition, 2021, pp. 15 990–15 999.
- [129] Q.-Y. Zhou, J. Park, and V. Koltun, “Open3d: A modern library for 3d data processing,” arXiv preprint arXiv:1801.09847, 2018.
- [130] A. Douillard, Y. Chen, A. Dapogny, and M. Cord, “Plop: Learning without forgetting for continual semantic segmentation,” in Proceedings of the IEEE/CVF Conference on Computer Vision and Pattern Recognition, 2021, pp. 4040–4050.
- [131] J.-H. Zhang, Y. Zhang, and Z. Shi, “Long-wave infrared polarization feature extraction and image fusion based on the orthogonality difference method,” Journal of Electronic Imaging, vol. 27, no. 2, p. 023021, 2018.