Assessing the communication gap between AI models and healthcare professionals: explainability, utility and trust in AI-driven clinical decision-making
Abstract
This paper contributes with a pragmatic evaluation framework for explainable Machine Learning (ML) models for clinical decision support. The study revealed a more nuanced role for ML explanation models, when these are pragmatically embedded in the clinical context. Despite the general positive attitude of healthcare professionals (HCPs) towards explanations as a safety and trust mechanism, for a significant set of participants there were negative effects associated with confirmation bias, accentuating model over-reliance and increased effort to interact with the model. Also, contradicting one of its main intended functions, standard explanatory models showed limited ability to support a critical understanding of the limitations of the model. However, we found new significant positive effects which repositions the role of explanations within a clinical context: these include reduction of automation bias, addressing ambiguous clinical cases (cases where HCPs were not certain about their decision) and support of less experienced HCPs in the acquisition of new domain knowledge.
Keywords explainable model, explainable AI, ML in healthcare, user study, clinical decision support, automation bias, confirmation bias, explanation’s impact, clinical performance, usability
1 Introduction
Clinical predictive models based on machine learning (ML) bring the promise of integrating real world evidence into clinical decision-making, balancing individual clinical experience with data-driven evidence. The dialogue between evidence, which is systematically collected and analysed, and in clinical practice, allows for a continuous evolution of the understanding of disease and treatment response. This is particularly important in the context of new diseases (e.g, COVID-19), new treatments or in understanding personalised responses (e.g. multi-morbidity or diverse populations).
Effective communication between healthcare professionals (HCPs) and ML models depends on the ability of the former to have a faithful mental representation of the latter and a critical ability to assess the strengths and limitations of ML models.
Explainability [1, 2, 3, 4, 5, 6] emerged as a research area aiming to address interpretability bottlenecks in ML models resulting from the fact that many of them can be effective in predicting an outcome, but not in explaining their underlying reasoning, which limits their practical application in critical areas. In recent work by [7] Verification and Explainability Methods were identified as one of the three main frontier topics in the area of medical AI (together with Complex Networks and their Inference and Graph Causal models and Counterfactuals) in order to satisfy the need for trustworthiness at multiple levels of the medical workflow. Whilst recent explainable ML methods [8, 9, 10, 11, 12, 13, 14, 15] are instrumenting ML models to be more transparent, the perceived utility and suitability of explanation models has not been systematically investigated in the clinical context.
We aimed to address this research gap by conducting a user study on the effectiveness of current modalities of ML explainability amongst healthcare professionals for data-driven decision support. The study was performed using an explainable ML clinical decision support tool designed to help manage the admissions of patients with cancer and COVID-19: CORONET (COVID-19 Risk in ONcology Evaluation Tool [16]). In contrast to existing explainability studies performed over simplified tasks [17, 18, 19, 20], our experiment closely mimicked a real-world clinical scenario [21], where the decision is made based on multiple factors supported by a recommendation.
As part of the contributions, we propose a novel methodology to assess the pragmatic utility of explanations, which accounts for a systematic understanding of the interaction between a clinician’s mental model and the explainable ML model. Additionally, we introduce a framework for evaluating the impact of ML explanations on perceived utility and usability in clinical context [22]. We present the results of an experiment conducted involving 23 HCPs, who were presented with 10 scenarios and had to decide whether to admit/discharge a patient with cancer and COVID-19 supported by a model firstly without an explanation (colour bar + score) and with explanation (+contributing features).
2 Methods
2.1 Framework for pragmatic evaluation of the model’s explanation

We introduce a framework for pragmatic evaluation of the model’s explanation, outlining the key components from the model’s output (including its explanatory components) to the model’s usefulness in a clinical setting (see Fig.1). It allows for investigating key aspects of the user’s attitude that impact the perceived utility of the model in a clinical decision-making setting. Our end-to-end approach allows for the evaluation of the change in perception of the overall system’s clinical suitability, i.e. evaluation of system-level effect, instead of item-level effect (single recommendation) [21].
In general explainability is about transparency and traceability, highlighting decision-relevant parts of the representations within the algorithm, both for the dataset (population) or particular observation (individual patient). Explanation is often used interchangeably with interpretation, however the distinction must be made as the first is product by the second. Explanation is a collection of features from the interpretable domain that contributes to the production of an abstract statement. Interpretation is a process of mapping this statement into the domain the human expert can perceive, comprehend, and understand (for more detailed definition refer to [22]). In our framework, first, the ease of interpretation of the tool’s output is evaluated, which is a prerequisite for understanding, satisfaction and trust [23, 24]. Note, that in the clinical decision-making process, the cognitive load due to the model output is one of many disjointed contextual factors and thus should not require the full working memory of the user [25].
Then questions regarding trust, satisfaction and model understanding are systematically assessed. Trust in the model leads to its high persuasive power and reassurance in cases where the user is less certain about the right decision [26]. Understanding the model’s reasoning process supports the critical assessment of the model (i.e. understanding when the tool provide incorrect recommendations). Satisfaction measures how well the provided output corresponds the user’s expectations.
Trust may be enhanced by providing the explanation [7, 27, 28, 29], uncertainty of the model’s recommendation [29, 26] and/or by ensuring the high performance of the model at a given task [30]. The last aspect can be characterised by the declared performance by the model’s developer in testing and validation, and the subjective performance perceived by the user during the experiment [31, 21]. However, excessive trust may have negative effects, i.e. confirmation bias [32] and automation bias [33, 34]. These are evaluated via the concordance between user’s action, recommendation and correct action, and via time spent on decisions.
Finally, all aspects account for the perceived pragmatic utility of the model, evaluated via asking whether HCPs would use the model in their clinical practice. The pragmatic utility aggregates model’s usability, defined as how effective, efficient and satisfying the model is in a specified context [22], and clinical performance, defined as the ability to deliver results that are correlated to a specific clinical condition and target population in experiments performed by medical experts [35].
The output of the model may consist of three main components: i) recommendation (R, i.e. prediction, prognosis or classification); ii) uncertainty of the model’s recommendation (U); iii) explanation (Exp); and can be presented to the user as: R, R+U, R+Exp and R+U+Exp. In our empirical analysis, as the CORONET model does not communicate its uncertainty, we put aside this aspect and performed a ‘R then R+Exp’ within-subject scenario with one group of HCPs. Although one of the visual components of the explanation (i.e. scatter plot, described in 2.2) makes the user aware of the model’s imperfect performance (predicted scores for the whole training cohort, including incorrect recommendations), we did not evaluate this aspect directly. We did not provide explicitly any performance metric to the HCPs. Similarly, the perceived performance of the model was not measured. Thus, we did not evaluate the contribution of the model’s performance to the HCPs’ attitude towards the model. Individual characteristics of the user, such as user’s background, knowledge and expectations that may impact their attitude [36] were evaluated.
Guided by the framework, we investigate the overall pragmatic impact of the explanations on the clinical decision by targeting the following research questions:
-
RQ1
Does the explanation improve understanding of the model’s reasoning mechanisms?
-
RQ2
Does the explanation lead to an increase in model satisfaction?
-
RQ3
Does the explanation lead to an increase in trust?
-
RQ4
Do explanations improve the HCPs’ critical understanding of the model?
-
RQ5
Do explanations enable improved clinical understanding?
-
RQ6
How do explanations impact the automation bias?
-
RQ7
Does the explanation increase the confirmation bias?
This study indicates that there is a major unaddressed communication gap between explainable ML models and healthcare professionals and elicits priority areas for investigation.
2.2 Clinical setting & supporting model
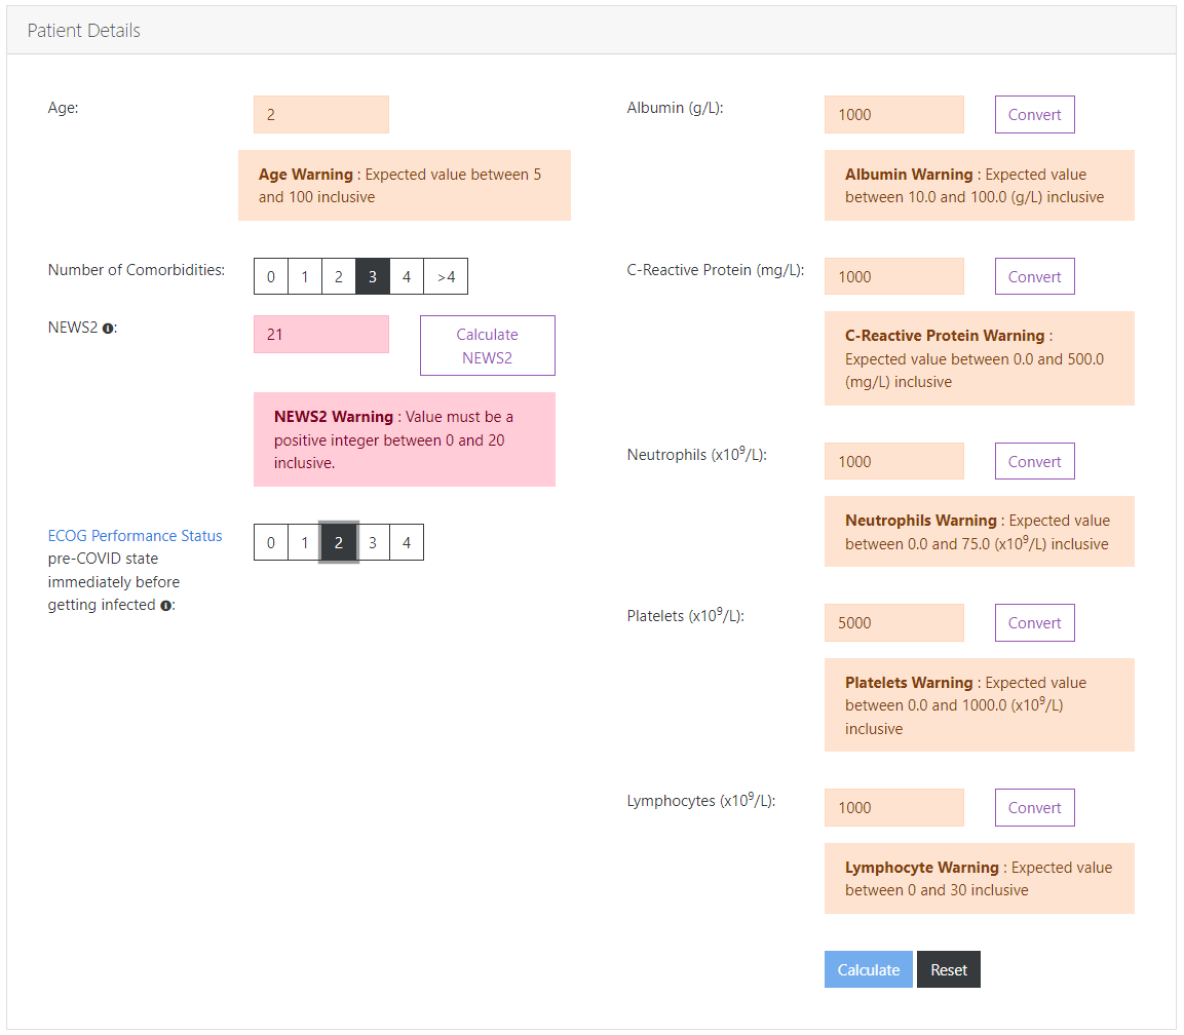
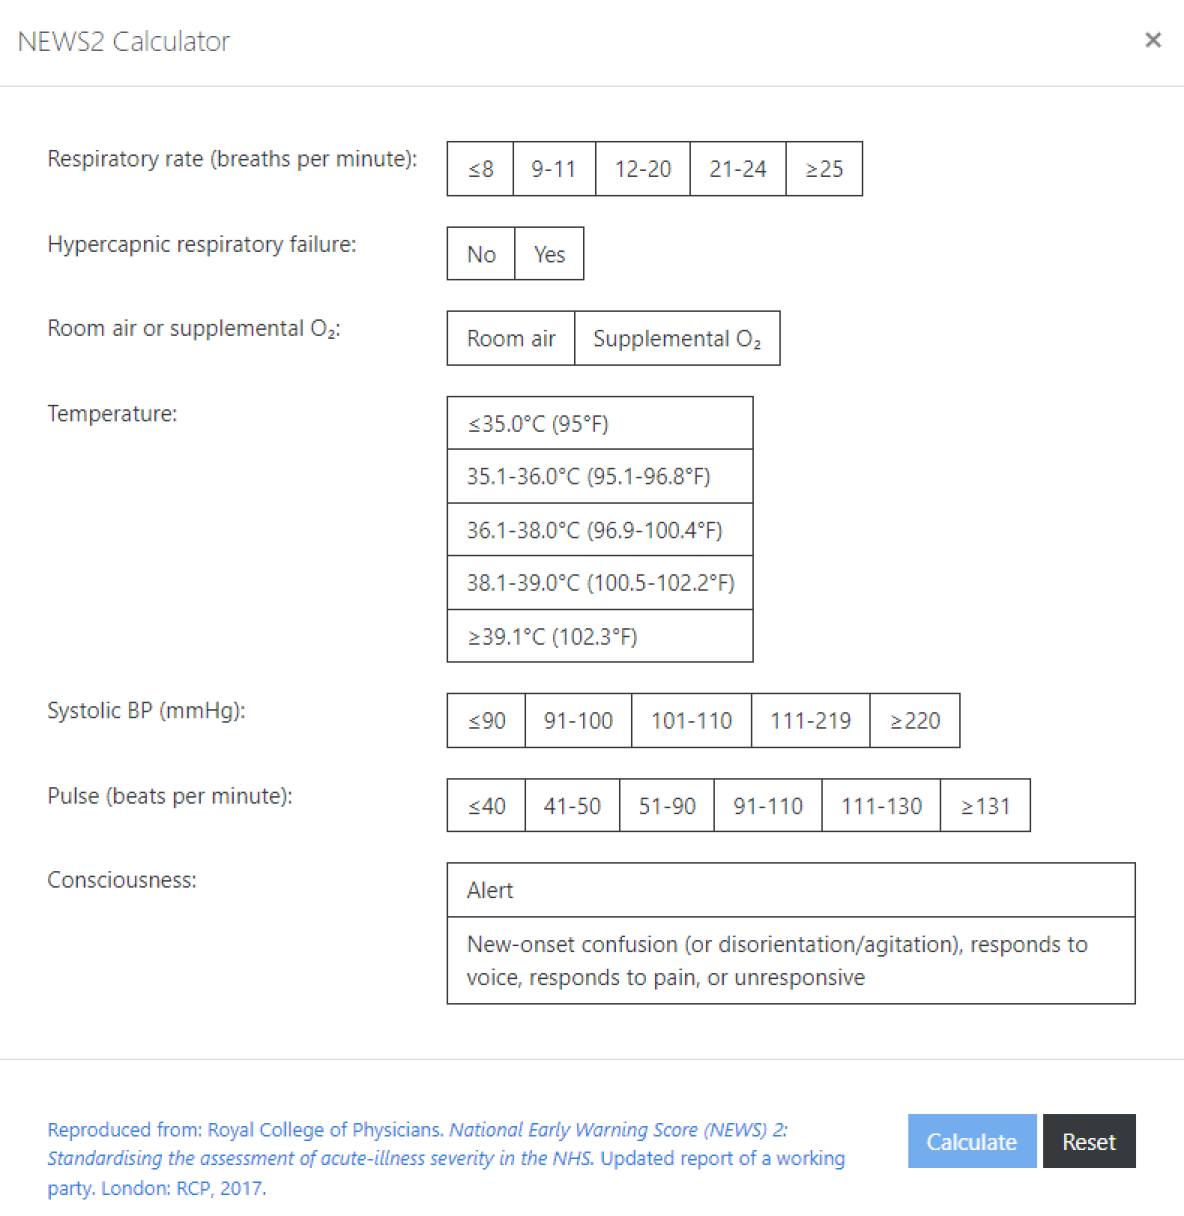
CORONET model: In this study we used CORONET (COVID-19 Risk in ONcology Evaluation Tool [16]) which was developed to help determine the need to admit patients to hospital on the bases of their likelihood of needing oxygen (as generally oxygen is only given in hospital) and their severity of COVID-19, as indicated by predictions for required oxygen and/or death [37, 38, 39]. As a result, four key outcomes were established, arranged in a 0–3 point ordinal scale: discharged, admitted ( h inpatient), admitted+O2 requirement (including ventilator support), and admitted+O2+died (with the death directly attributable to COVID-19 disease, not to cancer). These four outcomes were used as measures of disease severity. Contrary to an analysis of binary outcomes (e.g., need for oxygen vs. no need for oxygen), this strategy improved the ability to provide a complete clinical picture that was important for overall decision-making regarding hospital admission. During development, the model was first validated on an external cohort [16], and later on the most recent data from Omicron variant [40]. The CORONET tool is available online111https://coronet.manchester.ac.uk providing an interactive user interface with cross-device compatibility. The user interface is depicted in Fig. 2 (for more details please see Fig. S.7, S.8 and Suppl Methods User interface design).
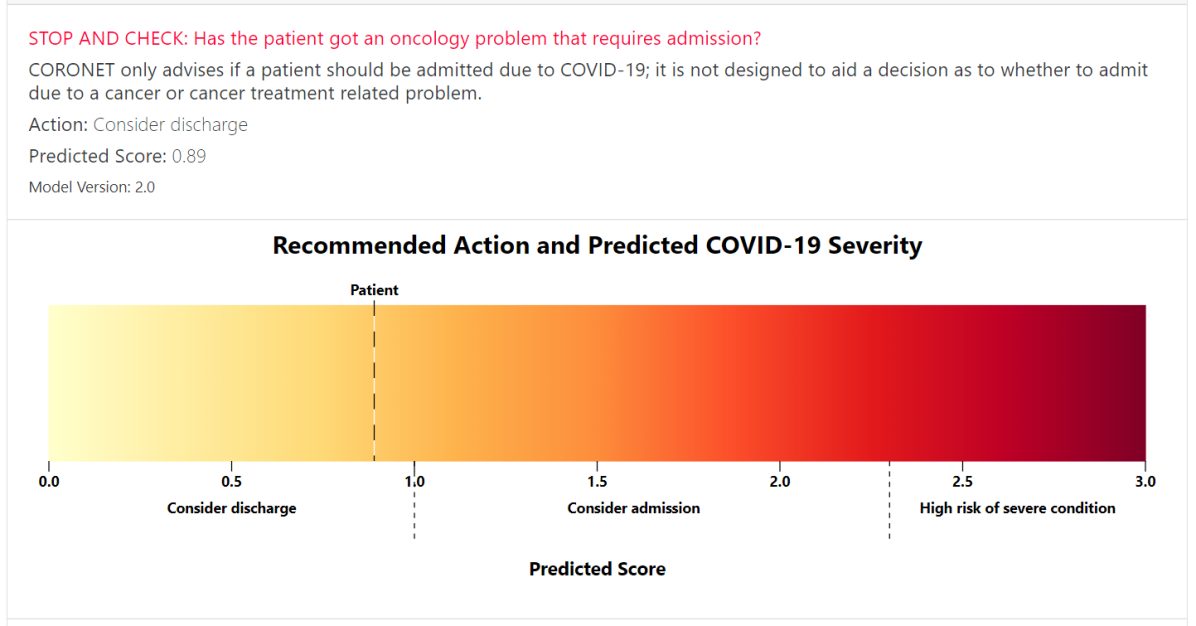
Recommendation (R): The basic output of the model is the recommended action and the CORONET score, which defines action. The score is presented on a colour bar, scaled 0-3 with decision thresholds (Fig.3(a)). The score below 1.0 recommends discharge, above 1.0 admission, and above 2.3 suggests high risk of severe COVID-19 illness. Critically, this is in a group of patients who may also present to hospital with cancer or treatment related problems and not just COVID-19. This therefore adds complexity to the decision-making for the HCP. However, CORONET is only built to aid decisions regarding COVID-19 severity and requirement for admission. The CORONET model is a regression random forest, which was trained using the ordinal 0-1-2-3 scale as a dependent variable. True outcomes used as y are: 0-patient discharged; 1-patient admitted; 2-admitted and required supplemental oxygen; 3-admitted, required O2 and died. Thus, the model predicts the score in range 0-3 and the recommended action is delivered based on a pragmatically defined threshold [16, 41, 42].
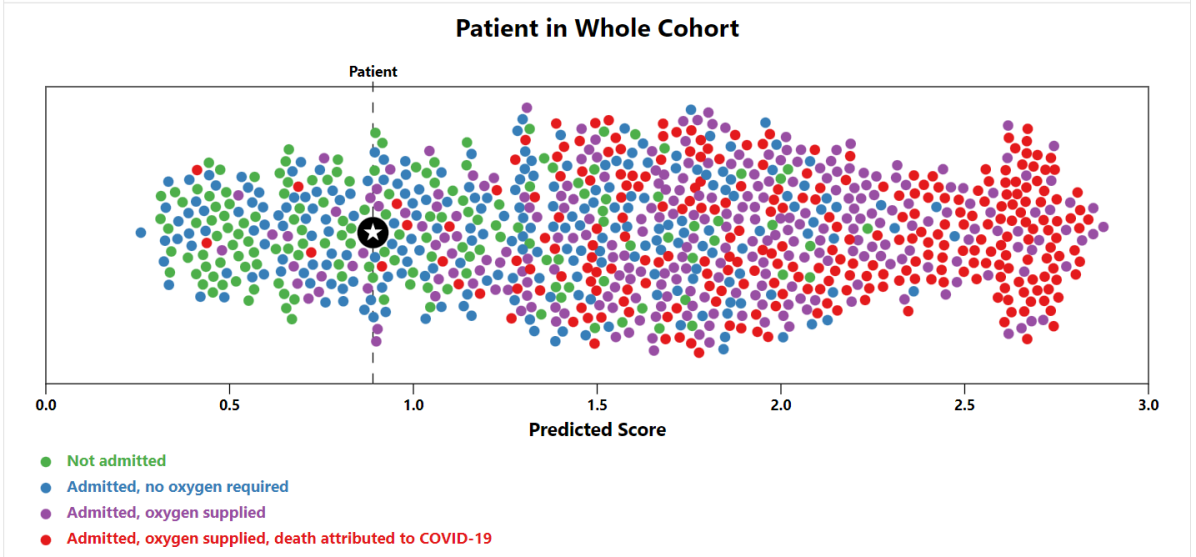
Model explanation (Exp): The explanation of the output consists of two visual components. Firstly, it shows a scatter plot (Fig.3(b)) with the predicted score on the x axis for all patients used in model derivation (scores predicted in Leave-One-Out Cross Validation [16]). Each dot represents an individual patient and the colour corresponds to their true outcome. All patients are sorted from left to right according to their predicted score. The plot allows the user to locate the patient in question (marked by a star) in the whole cohort, considering both true outcomes and model’s recommendations. The point distribution elicits the model’s errors, i.e. some recommendations may be incorrect. For several ‘death outcomes’ the model predicted scores below admission threshold. Similarly, for some discharged patients the tool recommended admission. This reveals the performance of the model to the user.
Second, the explanation shows a bar plot with features contributing to the individual prediction (later referred to as contribution plot, Fig.3(c)). The length of the bar represents the magnitude obtained using SHAP explanation [8]. The colour shows the direction of the contribution (towards discharge or admission). Features are ordered from top to bottom depending on the contribution. The figure serves as a local explanation of the model, where the bars change for each individual recommendation. The contribution plot is produced only for the patient in question, i.e. to see feature contribution for other cases the user needs to input new values. The contribution plot’s layout was iteratively derived from discussions between user user experience designers and oncologists in order to produce the most intuitive visualisation. Among other considered layouts were: one side bar plot, waterfall plot [8], force plot [8], Partial Dependence plots [43] and Individual Conditional Expectation plots [44].

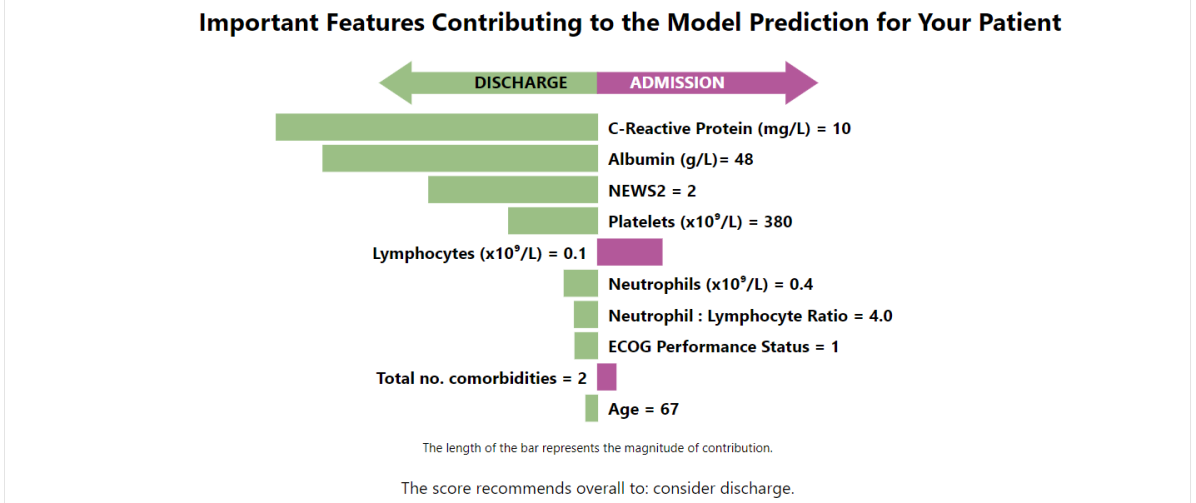
Overall, the model’s output consists of three cognitive chunks [28] organized in a three-step hierarchy : i) colour bar with the score; ii) scatter plot; iii) contribution plot. The derivation of the model and its associated source code are available at https://github.com/digital-ECMT/CORONET_tool.
2.3 Study design
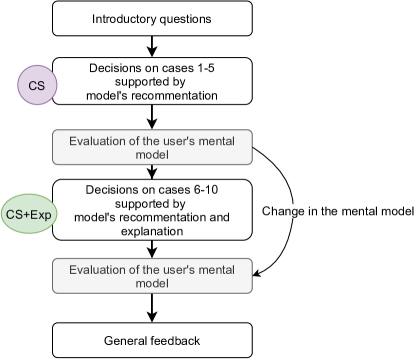
The study follows a within-subject design whereby each participant uses the tool in two conditions. Firstly, the participant is provided information in the form of a recommended action and a score on a scale of 0-3 (later referred to as CS - CORONET score), and told that the higher the patient’s score, the more severe the predicted outcome is. Secondly, the participant is then provided with the recommendation, the CORONET score and an explanation of how the tool has arrived at this score for the patient (later referred to as CS+Exp - CORONET score plus explanation). This approach minimises any random noise introduced by the variability on user’s clinical and technological exposure and previous experience. The order of presented cases was the same for all participants. The study design is depicted in the Fig.4.
The online questionnaire consisted of six stages: i) introductory questions refering to the HCP’s background and expectations ii) five artificial patient cases with only the recommendation provided; iii) questions evaluating the model’s usefulness; iv) another five artificial cases this time provided with the recommendation and explanation; v) questions evaluating the model’s usefulness (same as in iii) vi) overall impressions of the tool. The questions were designed specifically for this study.
Ten artificial patient case scenarios were constructed, reviewed and approved by a senior oncology fellow and a consultant oncologist. The decision to admit or discharge was based on clinical guidelines and best practice. The scenarios were similarly structured and comprised an introduction to the patient (including demographics, presenting complaint, and relevant past medical history - all 10 cases are detailed in the supplementary material), the patient’s parameters from observations (vital signs), and blood test results.
Two of the ten patient cases (Daniel in CS, and Christine in CS+Exp scenarios) were intentionally built in a way that the model would wrongly discharge the patient, as CORONET considers features of COVID-19 severity only [37] and not oncological emergencies which might be concomitant e.g. neutropenic sepsis. In these cases, the healthcare professional should be able to apply their clinical judgement and recognise the patient would require admission for oncological reasons and subsequently override the model’s decision. In Daniel’s case, the admission is due to renal dysfunction and tumor lysis syndrome following chemotherapy received three days prior for his diagnosis of diffuse large B cell lymphoma. Therefore, this is a scenario where CORONET is thought to potentially ‘wrongly discharge’ the patient as it does not take into consideration oncological emergencies as part of it’s recommendation.. In Christine’s case the admission is due to her recent chemotherapy course. Again, because CORONET does not take other types of infections and treatment related presentations, this is a situation where CORONET is not adequate in making an accurate decision.
These cases were included to assess for over-reliance on the model (automation bias). We analysed the concordance between clinicians’ decisions, and the model’s recommendations and the correct actions approved by our team of experts.
We tracked the time spent on each part of the questionnaire ensuring that it was not quickly skipped when the user lost interest or was engaged with external tasks. It also allowed for tracking the time spent on decision of each patient case.
2.4 Selection of participants
This research project was ethically approved by the research ethics committee [REC reference: 20/WA/0269]. Participants were required to be clinically active healthcare professionals (determined as having patient contact in at least 10% of their working hours) and currently working with patients with cancer presenting with COVID-19. This included senior doctors, junior doctors, physician associates, pharmacists, advanced practitioner nurses, and staff nurses. Any participants who failed to meet these inclusion criteria were excluded. Participants were recruited via email invitations to NHS Trusts, clinician networks, and social media groups. Although CORONET was already available online by the time of the experiment, to the best of our knowledge the participants were not using the tool prior to the experiment. The familiarity with the tool and/or with the preprint [41] was not required. Knowledge related to ML, computational methods or statistics was not required.
3 Results
3.1 Participants
23 healthcare professionals participated in the experiment, with various level of experience and expertise (Table 1). The median knowledge regarding managing patients with COVID-19 was five (in one to seven scale), evaluated via direct question. Most of the HCPs felt very comfortable using new technologies. 35% of participants perform statistical analysis at work, and majority of participants do use online calculators or scoring systems, similar to CORONET (83% and 65%, more in Supp Table S.1).
| Age group | n | ||
| 21-30 | 6 | ||
| 31-40 | 10 | ||
| 41-50 | 3 | ||
| 51-60 | 4 | ||
| n | |||
| Advanced Nurse Practitioner or higher | 2 | ||
| Consultant / attending physician | 5 | ||
| Doctor (within 2-4 years of graduating / specialty trainee (ST) / fellow | 2 | ||
| Doctor within first year of graduating (FY1) / intern | 1 | ||
| General practitioner / GPST / community doctor | 3 | ||
| Pharmacist | 1 | ||
| Registered Nurse | 1 | ||
| Specialist Nurse | 1 | ||
| Specialist registrar / ST 3+ / senior resident/senior fellow | 7 | ||
| Median [min,max] | |||
| How comfortable you feel when using new technology? | 6 [3,7] | ||
|
5 [2,7] |
3.2 HCPs want to know both contributing features and uncertainty. Uncertainty was considered to be more important than contributing features
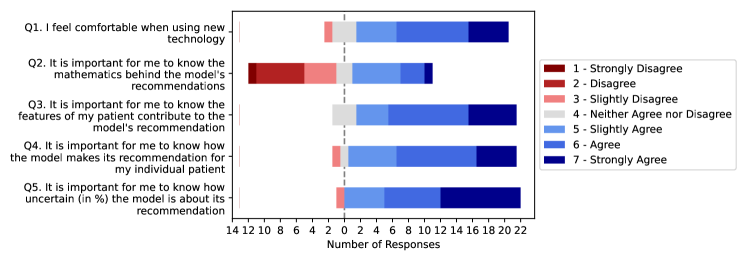
The responses regarding the expectations for the ML-based DSS are depicted in Fig.5. 87% (20/23) of HCPs were interested in knowing the features contributing to the model’s recommendation, three HCPs had neutral opinions. 91% (21/23) considered the model’s explanation of an individual recommendation as important. Apart from knowing why the model recommends such action, the uncertainty behind the recommendation was even more essential for the HCPs: 96% (22/23) of them at least slightly agreed, and 43% (10/23) strongly agreed, which is the highest ‘strongly agree’ proportion in the study.
Knowing the mathematical framework behind the model is significantly less important than the local/global explanation and the model’s uncertainty (, Kruskal-Wallis test, Supp Table LABEL:tab:expectation_stats). Intriguingly, 73% of HCPs who were not interested in the mathematics behind the model would like to see an associated model explanation and uncertainty. This points into largely unaddressed research questions on the dialogue between explanations and safety properties (such as a representation for uncertainty) as proxies for risk assessment.
3.3 Visual explanations were easy to interpret
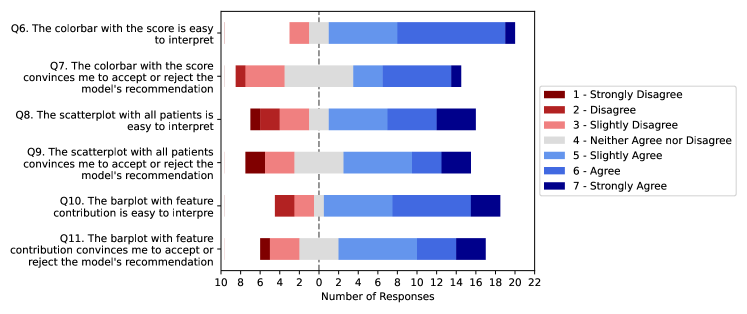
Explanation visualisations were easy to interpret and contributed to convincing HCPs to accept or reject the model’s recommendation (Fig. 6, Supp Table LABEL:tab:visual_stats). This aspect was measured via direct questions for each visualisation: i) whether it was easy to interpret and ii) it was convincing to accept of reject the recommendation. For the majority of HCPs, the colour bar was easy to interpret (83%; 19/23). Interestingly, the CS (score without further explanation) presented on 0-3 colour scale convinces 48% (11/23) HCPs to accept/reject the recommendation. Among these 11 convinced by CS, the average response to questions regarding expectations are high (5.7).
We found no significant difference between the ease of interpretation of the colour bar, scatterplot or contribution plot, as well as no difference in their persuasive power (, Supp Table S.3). We did not find any significant correlation between questions related to the visual output and either knowledge on the management of patients with cancer who have developed COVID-19, nor to expectations for ML-based DSS (Supp Table S.4). Thus, the perception of the visual output was not affected by expectations, nor the competence in the task.
3.4 Explanations did not significantly impact on the decision-making
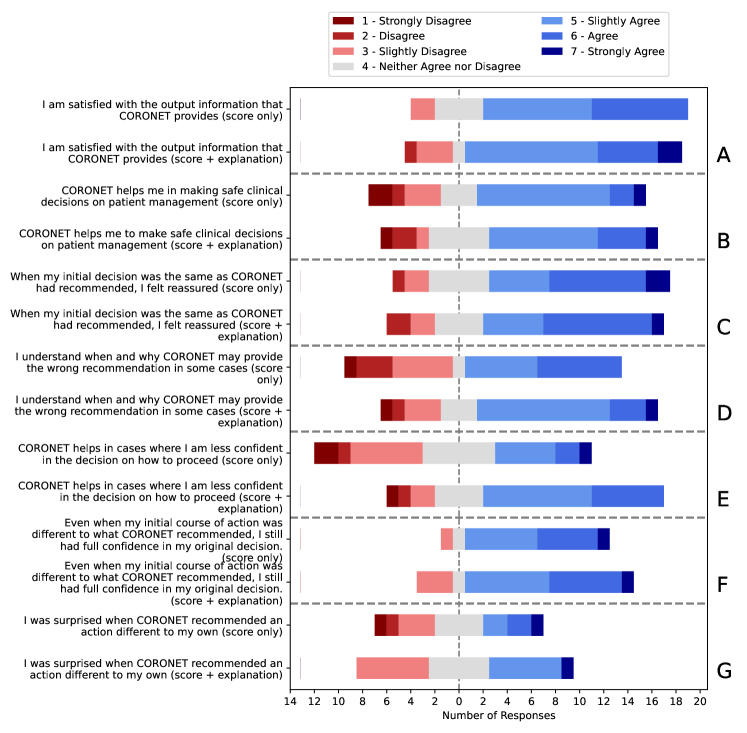
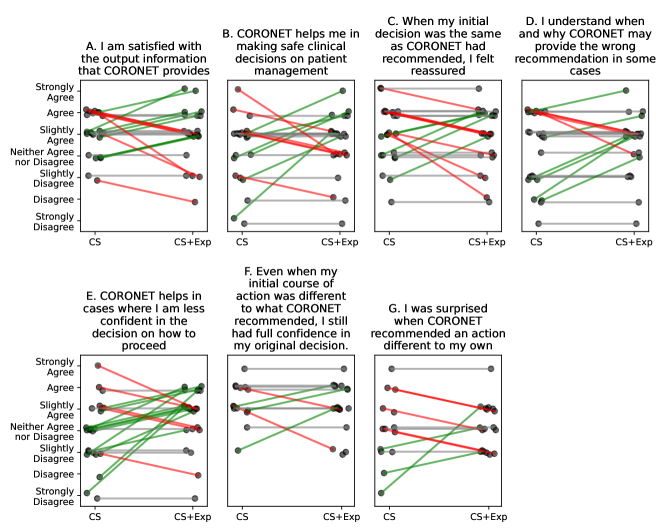
In the pairwise comparison of responses between CS and CS+Exp scenarios, we did not find a statistically significant change in the HCPs’ attitude towards the model (i.a. satisfaction, trust, understanding, reassurance). The results are summarized in Fig. 7, Fig.S.1, Supp Table S.6.
The explanation did not improve satisfaction (RQ2, Fig.7 question A), trust (RQ3, Fig.7 questions B,C,E) nor the understanding of how the model produced the recommendation (RQ1, Fig.7 questions D,F,G). Of note, we observe a slight but not significant positive change () in ‘help in cases where I am less confident in the decision on how to proceed’.
The majority of HCPs replied positively (57-74% answers at least ‘Slightly agree’ in quest. A-C) regarding the CS output alone. We established the following associations between positive responses and HCPs’ expertise and expectations:
-
•
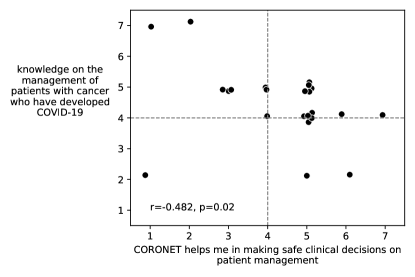
The lower the expertise, the more helpful the tool appeared to be, even when no explanation is provided (, , Fig.S.2).
- •
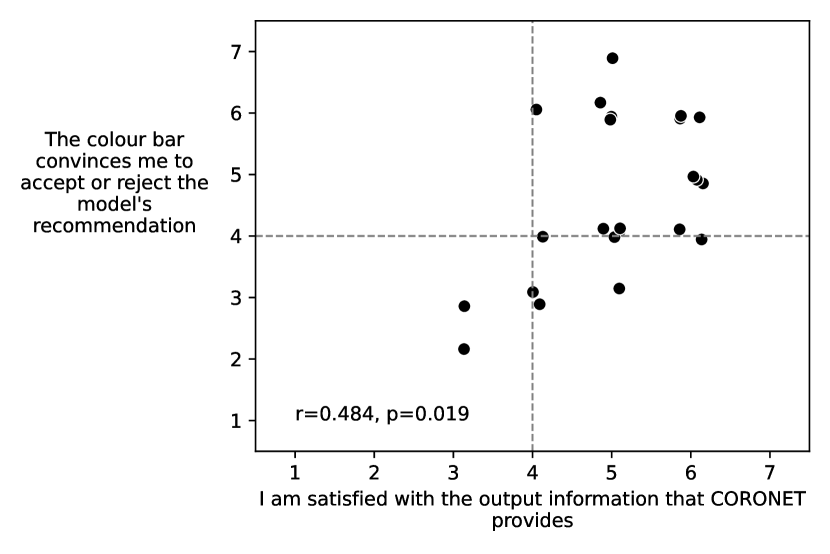
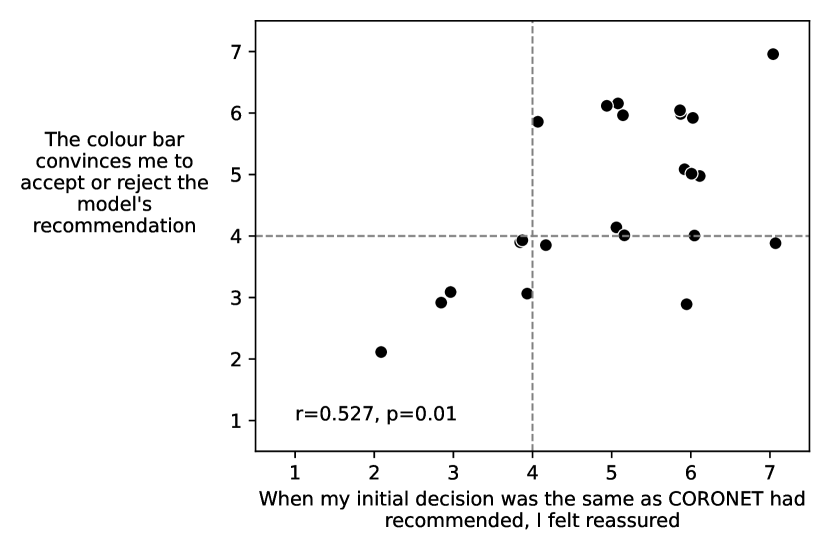
Additionally, being convinced by the colour bar was correlated with satisfaction and reassurance in the CS only scenario (, and , , Fig.S.4).
3.5 Model explanations may have an adverse effect on HCPs
CS-Exp output of the model led to both positive and negative changes in satisfaction, helpfulness of the model, reassurance and understanding. 34% HCPs were more satisfied with CS+Exp than CS, but in 23% their satisfaction decreased (RQ2). Higher satisfaction was weakly correlated with ease in the interpretation of the contribution plot (, ), but not correlated with being convinced by it (). HCPs who were convinced by the contribution plot in the CS+Exp scenario (65%; 15/23), showed high levels of satisfaction both without (average 5.4) and an with explanation (average 5.6). This is also true regarding the scatter plot.
26% of HCPs said that the tool with CS+Exp was more helpful in making safe clinical decisions, with 26% stating the opposite. There was a positive correlation , , ) between change in satisfaction and change in help in making safe decisions. 22% of HCPs felt more reassured in the CS+Exp scenario, while 35% felt the opposite.
The provided explanations did not change the level of understanding of when and why the model produces wrong recommendations for 57% (13/23) of HCPs (RQ1). For 17% the explanation even led to lower understanding. This cannot be attributed to the time spent on the patients’ analyses, nor ease in interpreting the diagrams ().
The change in understanding wrong recommendations was associated with the change in the reassuring utility of the tool (, , ), which is the strongest correlation found between changes (Supp Table S.7).
The highest percentage - 52% of positive changes was observed to help in cases where the HCP is less confident. Among them, there were three HCPs who rated their knowledge of managing patients with COVID-19 as 2 (RQ5). However, 22% found CS+Exp less helpful.
3.6 Over-reliance on the model’s recommendation leads to wrong decisions
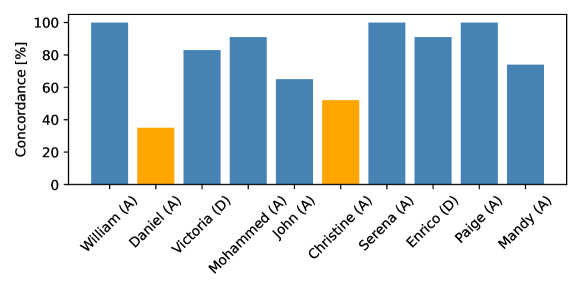
There are only three cases where all the HCPs made the correct decision, and six cases where the concordance with the correct decisions was more than 80% (Fig.8). Of note, the concordance does not depend on whether a patient should be admitted or not when the tool recommends correctly (on average 88% vs 87%, p=0.73).
However, the lowest concordance with the correct decision was observed for cases where CORONET recommended the wrong action (RQ6, Fig.8). In Daniel’s case 65% (15/23) HCPs decided to discharge, as CORONET recommended, while for Christine this accounted for 48% (11/23). As the level of complexity and difficulty in decisions across the cases 1-10 was similar, we argue that the lowest concordance for Daniel and Christine is caused by the wrong recommendation provided by the model. The results strongly suggest that for both types of output (CS and CS+Ex) HCPs over-relied in the recommendation provided by the model.
3.7 Quicker decisions due to over-reliance on explanations
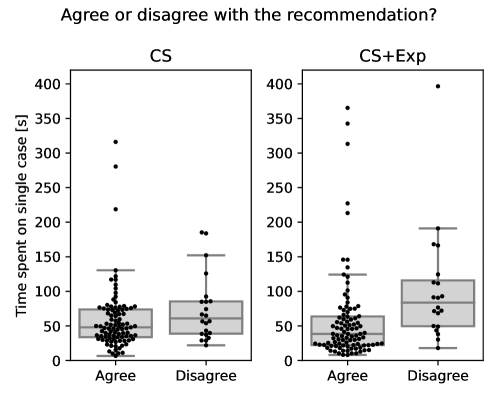
Decisions which were in agreement with the model recommendation required less time (RQ6, Table 2, Fig.S.5). For cases 1-5, where the tool provides only the CS, the median time spent on one case was 48s when the user agreed with the tool, and 61s otherwise. For cases 6-10, where the CS+Exp was provided, we observed a statistically significant difference: decisions required 38s for decisions aligned with and 84s (median values) for decisions opposed to the tool’s recommendation (, , MWU test).
As described in the previous section, some respondents needed less time when deciding on cases where the explanation was delivered. Further investigation of the agreement with the model reveals that when the HCP agrees with the recommendation (RQ7), the combined CS+Exp output leads to significantly quicker decisions than CS output: 38s for CS+Exp and 48s for CS (, ). Moreover, when the explanation is provided, it takes more time to decide when the model contradicts the user’s decision, but the difference to CS is not significant. Median time for CS output was 61s, compared to 84s for CS+Exp (, MWU test).
|
|
|
p | Significance | ||||||
|---|---|---|---|---|---|---|---|---|---|---|
| Cases 1-5, output: CS | 48 [34,74] | 61 [39,85] | 0.097 | ns | ||||||
| Cases 6-10, output: CS+Exp | 38 [22,64] | 84 [50,116] | 0.000 | *** | ||||||
| p | 0.042 | 0.170 | ||||||||
| Significance | * | ns | ||||||||
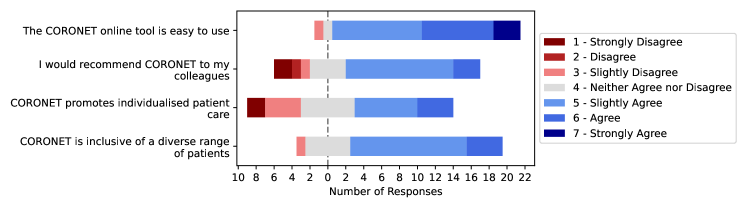
3.8 Positive feedback, but no attribution to the explanatory model
General feedback regarding the CORONET model is positive (Fig.9). The model and supporting interface is considered easy to use, and the majority of respondents would recommend the tool to their colleagues.
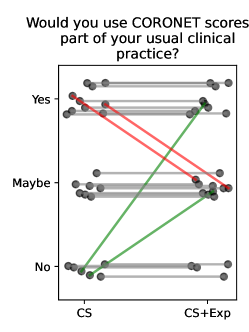
We found no impact of the explanatory component on the clinical utility of the model (Fig.10), as the explanation did not improve the attitude towards whether to use the CORONET in clinical practice or not (RQ5, , Wilcoxon signed-rank test).
3.9 Respondents’ engagement
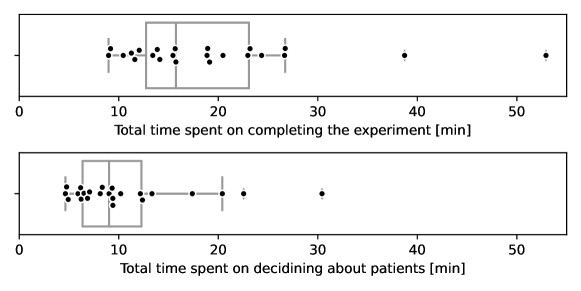
Our experiment is supported by an online questionnaire, which is to be completed without direct supervision and time limits. Although the questionnaire is estimated to require min, the actual average completion time was min (median 16 min, Fig.11). Of note, nine HCPs completed it in less than 15 min, spending less than six min on deciding about 10 patients. We also identified several anomalies in the time spent in particular sections which we manually curated (see details in supplementary material). Most likely they were caused by occasional interruptions, which are inherent in the experiment conducted in the clinical setting, where the respondents may be distracted by more urgent matters.
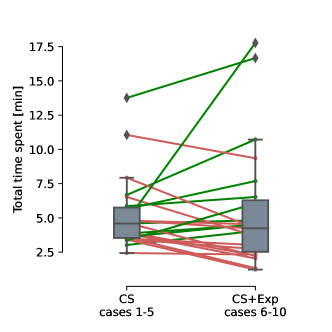
Overall, we did not find a significant difference between total time spent on deciding on patient cases between CS and CS+Exp (, Wilcoxon signed-rank test, Fig.S.6). However, 56% (13/23) HCPs spent less time when CS+Exp was provided. We did not find any correlation between this decrease and other aspects investigated in previous paragraphs.
4 Discussion: Pragmatic clinical embedding of explainable ML models
CORONET explanation among the existing taxonomies
The empirical analysis conducted in this study fits into a domain expert experiment with the exact application task, which is an application-grounded evaluation, with real humans and real tasks (according to the taxonomy introduced in [28]).
In designing the CORONET output, we followed the perceptive interpretability framework [45], emphasising an immediate interpretation: you see, and you know. We argue that the contribution plot follows this assumption.
According to taxonomies established in [5] and [19], the output of the tool investigated in this study delivers:
-
•
modularity: each interpretable element of the output (cognitive chunk) appears as a separate visual component. In the contribution plot, each bar delivers a meaningful portion of information and can be interpreted independently (e.g. low contribution of albumin level to recommendation of ‘admission’)
-
•
relevance: it provides insight for a particular audience, in this case clinicians seeking a patient’s characteristics critical for the decision (contribution plot), and also how the patient in question can be located in the whole cohort (scatter plot). Additionally, the colour bar and score describe how severe the patient’s outcome is expected to be.
However, CORONET’s output does not deliver:
-
•
simulatability: a model is simulatable when the user can reason and simulate how the model produces the output for an arbitrary input. It could be possible (assuming limited complexity of the model) for algorithms such decision tree or a set of rules. However, as CORONET uses a Random Forest regression model, with multiple (100) decision trees used to arrive at the prediction, the user cannot precisely elicit the formal decision process.
-
•
unambiguity: CORONET provides local explanations, focusing on individualised patient care. Based on that, it is not possible to reveal how the model behaves in various parts of the feature space. Such behavior was investigated during model derivation [16] with the support of dependency plots. However, these are not presented to the user in the context of this study.
Analogously to unambiguity, the user is not able to evaluate the descriptive accuracy [5], which measures how well the relationship learned by the model is reflected in the explanation. Such evaluation was performed during model development, and then intentionally excluded from the cognitive chunks presented to the user. We argue that additional cognitive load would hamper the benefit of such information [46, 24].
Characterising HCPs’ attitude on the explanations
More than 87% of participants stated that knowing the contribution of features is important, both for the overall model and individual recommendations. The most important aspect, with the highest number of ‘strongly agree’ answers, is to know the model’s uncertainty. This could suggest that HCPs, are self-reportedly more comfortable in assessing risks and uncertainty, rather than interpreting the feature contribution to the output of the ML model. Hence, delivering a model’s uncertainty may contribute more to building trust in comparison to a break-down explanation of the features’ contributions. However, this conclusion is solely based on the proportion of ‘strongly Agree’, as we did not find significant differences between expectations regarding uncertainty, feature contribution and individual recommendation (p0.05, Kruskal-Wallis test, Supp Table LABEL:tab:expectation_stats). An intuition on the mathematical principles behind the model is perceived as significantly less important (p0.05).
Showing uncertainty increases trust and the likelihood of following the model prediction [26], under a low cognitive load setting [29]. Limited cognitive investment in the model interpretation would result in a reduced understanding of the output. While the model used in our study does not explicitly provide uncertainty of its prediction, it recommends a binary action based on a numeric score and a threshold, which are shown to the HCPs. We argue it serves for the user as a proxy of the model’s recommendation confidence.
Unmet need to build pragmatically grounded explanatory models
Although the majority of HCPs (78%; 18/23) found the explanation component accounting for the features’ contributions easy to interpret, still 17% of HCPs found the explanation of the modelmodel difficult (RQ2). This points to opportunities for the design and optimisation of explanatory models from the point of view of end-user interaction. Contemporary explanation methods such as SHAP or LIME focus on the calculation of a faithful explanation for the model, abstracting away the pragmatic aspects of this explanation (e.g. their interaction with domain experts). Recent work binding representation design and cognitive models [47, 48] may provide a formal avenue for designing more pragmatically efficient explanatory models.
Explanations in the form of feature importance may act as a safety feature, drawing the user’s attention to features omitted by initial judgment but marked as highly relevant by the model [49]. According to [50] the feature-based explanatory models can be in one of three groups: desired (expected by included in the model), ambivalent (user is indifferent about whether they are included or not) or prohibited features (expected to be omitted, following ethical ML principles). Displaying contributing features allows the user to verify whether the model utilises expected features instead of inconsistent or irrelevant features, based on supporting domain knowledge. In our study, we asked the HCPs explicitly whether the model included all desired features. Additionally, no prohibited features were recognized in the model. One of the downsides of feature importance is that it may lead to confirmation bias, both in the model derivation phase [51] and in the post-hoc interpretation of the output. Practically, it is caused by noticing only the features that confirm previous assumptions and overlooking other, potentially incorrect features.
Ambiguity on the utility and perceived value of explanations
A considerable number of HCPs did not change or even worsen their attitude towards the model after the explanation was provided (RQ1). 57% of them reported the same level of understanding, and 17% were understanding even less why the model provides recommendations different to their own. Satisfaction remained the same for 43%, while 23% were less satisfied with the explanation. A possible explanation is an information overload (cognitive effort) effect or simply not meeting the expectations regarding the explanation model.
For 48% and 26% of HCPs the model with and without explanation was considered the same in terms of support for making safe clinical decisions and helping in ambiguous cases, respectively. For 26% and 22% the explanation even decreased the helpfulness. As high as 35% felt less reassured when model provided the same recommendation as initial decision. We hypothesise, that the explanation could introduce further uncertainty in the clinical judgment, as it may have differed from the clinical assessment in particular cases. This highlights previous adoption barriers towards ML-based decision support tools, i.e. lack of agreement with the model, lack of knowledge of the model, HCPs’ attitude toward the model [36, 52, 53]. Despite the widespread notion on the need for safe and explainable models, we found in our study that a step towards such models remained unnoticed or negatively perceived among almost half of the participants (RQ3). As suggested in [53], initial skepticism regarding ML-based models may have caused such a rejection.
This implies that explainable ML researchers should further move from an algorithm-centric perspective [45], to a pragmatic perspective, i.e. prioritising their pragmatic embedding within the experts’ decision-making process. Feature contribution, well-received in the data science community, is not necessarily acknowledged among HCPs. Intensifying the dialog and creating feedback loops between explainable AI researchers and domain experts will be an essential part of the development of pragmatically relevant explainable ML models.
Although explainable ML is advocated as the methodological silver bullet for addressing transparency issues [1], some user studies, similarly to this paper, show evidence of a limited or even no impact of the explanation on performance in a task [54, 18, 55, 56, 57]. This highlights the direction of further research in what explanation is expected depending on the context, e.g. clinical setting. Our study shows that we should be careful about our preconceived notions about what needs to be explained.
For many HCPs, explanations did not deliver a critical understanding of the model
Explanations did not improve the critical understanding on why the model recommends a different action to the HCPs for 57% of the participants (RQ4). One possible reason may be a misunderstanding of the difference between local and global explanations. The barplot used to visualise feature importance shows the magnitude of the contribution of each feature to the recommendation for an individual patient. For each analysed case the bars can be reordered. This may lead to an extra complexity in interpretation and shows the simplistic design of standard explanation visualisation devices. However, when promoting more individualised patient care one should also expect higher variation in local explanations of the model. Second, the tool is oversimplifying the complexity of the patient and does not refer to the underlying deep biological processes which may explain a biomarker and its relation to the recommended action. The tool is focused on one aspect of the patient (in this scenario COVID-19) and a finite set of predictors. This is often overlooked by the HCPs, and the limitations of the model remained unidentified even with the explanation provided.
Explainable models help HCPs to address ambiguous cases
The highest number of positive changes between CS and CS+Exp was observed to support clinical cases where HCPs were less confident in their decisions (RQ5). Interestingly, less experienced HCPs tended to trust the model more. This confirms the findings of [58] and [59] where less experienced clinicians are more likely to rely on the recommendation, changing their initial decision. This suggests that the main function of a ML-based (data-driven) clinical decision support system, such as CORONET, is to be helpful when the user is uncertain, pragmatically positioning the model within the clinical workflow [60]. This is aligned with the direct feedback received from HCPs (see Supp Feedback from Healthcare Professionals). The recommended action, together with the explanation, may deliver new evidence and justifications for more ambiguous cases.
Explainable models help HCPs to acquire new domain knowledge
When the user still lacks a consolidated domain prior knowledge, the explanation may act as a guideline or a source of new evidence-based knowledge, pointing into a second function of explainable ML models (RQ5). In [20] explanations only had an impact on HCPs who felt they had insufficient knowledge to achieve their given task, which may signify that the knowledge gap was addressed by the model’s output.
Quicker decisions for explanatory models in contrast to black-box models
57% (13/23) of HCPs spent less time on decisions for cases 6-10 (the cases with explanations), when more information was delivered to end-users (RQ6). Potential reasons are: i) lost interest in the experiment; ii) gained fluency in interpreting the provided information. After the firstfivecases, HCPs familiarized with the layout of the decryption were able to decide on upcoming cases quicker; iii) provided explanations expedited the decision due to over-reliance on the tool. The questionnaire was not designed to verify points i) and ii) leaving this point of ambiguity. Cases 6-10 reflect the same level of difficulty from cases 1-5.
Models and explanations can increase confirmation bias
The results suggest that when the recommendation agrees with their initial decision, HCPs decide quicker, when compared to a model disagreement setting (RQ6). Furthermore, when explanations are provided, the decision is comparatively quicker. When the tool contradicts the clinician, explanations lead to a longer reflection on the decision. This highlights the risk of confirmation bias, possibly caused by the explanation that increases the reassurance on the decision (RQ7). This aligns to the results in [1] where users tend to use the explanation to support the justification of their prior decision. The authors found that users reinforced pre-existing beliefs when the explanation supported them but did not abandon them when it was the opposite. Of note, model accuracy also affects the likelihood of adjusting prior beliefs. The risk of confirmation bias is particularly high when the explanation closely matches HCP’s expectations [53]. In some cases, the explanation may appear reassuring even if it does not explain the model [61].
Evidence of explanations reducing automation bias
On the other hand, explanations drove users to reflect longer on the decision when disagreeing with the model outcome (RQ6). More time may indicate cognitive forcing, which is reported to reduce over-reliance on the model [24]. At the same time, to reduce the automation bias, the explanation must reduce the cognitive load [46, 34]. Working memory constraints, together with increased cognitive load, lead to higher uncertainty in decision-making processes, thus increasing automation bias. This is particularly true in clinical settings where multiple contextual factors affect the reasoning process of HCPs [27].
Over-reliance on the model’s recommendation
Some evidence in the literature suggests models that use explainability techniques can hamper the user’s ability to detect when a serious error is made [56]. The explanation may excessively increase users’ confidence in an algorithmic decision, communicating a false impression of correctness and rigour and resulting in decreased vigilance and auditing of the output [62, 63]. In addition, [33] and [64] reported higher error rates when decisions relied too heavily on automation, resulting in bias towards a wrong action despite, evidence available which should have resulted in the user overriding the model. Automation bias is also linked to higher cognitive load and to consistently higher accuracy of the model [46], and familiarity with the task [20]. In our study, we identified over-reliance on the model for the cases where CORONET was intentionally wrong (RQ6). For these incorrect recommendations, the HCP should have overridden the decision and admitted the patient. Only 35% (CS scenario) and 52% (CS+Ex) HCPs took that critical perspective over the model.
4.1 Assumptions & limitations of this study
General concordance among clinical judgment. In the assessment of AI models for decision support in healthcare, a well-known challenge is the definition of a ground truth [65], as decisions may vary across HCPs. Thus, a panel of HCPs is recommended rather than a small number of annotators. In our study, the ‘correct’ actions were defined by a panel of two experienced oncologists.
Lack of controlled environment. An ideal environment for HCPs to participate would be at a face-to-face setting. Due to the pandemic and social distancing measures, the study was developed in an online setup. In this context, devices used by individual HCPs could not be controlled, which may have impacted on the consistency and the quantity of the usability feedback on each type of device. Despite this, the developers of CORONET designed its interface for cross-device compatibility (e.g. phones, tablets, and computers), and therefore by undertaking this method of design, we were able to capture feedback on CORONET’s usability based on a mixture of device types. Due to remote setting and lack of control, potential additional factors may have impacted the results. However, the experimental design assumes performing a task that HCPs are familiarized with: admit or discharge a patient based on a detailed clinical description. Thus we argue that all participants had very good understanding of the task.
Rush in completing the questionnaire. We argue that attempting to understand the model and therefore building trust in the tool require a substantial time commitment for some HCPs. Designing a study which is supervised, better controlled, and which better incentiveses HCPs for a longer time commitment would improve the current study design.
Use of simulated patient cases. To preserve the confidentiality of the patients, artificial patient case scenarios were used instead of real-life data. The cases were constructed in a clinically consistent manner by two domain experts. However, this does not take away the fact that in real life, a HCP would undertake clinical observations of the patient and account for any visible signs of distress and illness, such as any skin changes, unusual responses, and patient examination findings, which is not possible to reproduce in an artificial setting.
5 Conclusions
In addition to the acceptability of the predictive model [32, 66], a pragmatic evaluation of the user-model interaction is key to a successful deployment of ML-based recommendation tools in healthcare. The deployment depends not only on a explanation-interfaces [22] designed by software developers but to a greater extend, as shown in this study, on clinical performance evaluated by biomedical experts, initial attitudes and biases. This paper contributes a pragmatic evaluation framework for explainable ML models for clinical decision support. The study used a within-subject design involving 23 healthcare professionals and compared an explainable ML model with a black-box model. Such a relatively small number of participants and their heterogeneity (i.e. various backgrounds and levels of expertise) may hinder drawing statistically robust conclusions. However, we argue that the study points into the direction of a more nuanced role of ML explanation models when these are pragmatically embedded in the clinical context and the results settle a solid base for further research. HCPs acknowledged the role of explanations as a safety and trust mechanism. Communicating the uncertainty behind the model emerged as a stronger requirement, when compared to the explanations.
Despite the general positive attitude towards explanations, for a significant set of participants (17-35%), an undesirable effect for the explanations was observed, possibly due to an increase in cognitive effort. Moreover, explanations did not improve the critical understanding of the model for 57% of the participants (i.e. their ability to detect an error in the model). We also found that explanations can increase confirmation bias, possibly accentuating over-reliance in the model. On the other hand, explanations drove HCPs to reflect longer on the decision when disagreeing with the model outcome, evidencing explanations as a possible mechanism for reducing automation bias. There was strong evidence that explainable models better supported HCPs to address ambiguous clinical cases (cases where HCPs were not certain about their decision). Also, explainable models helped less experienced HCPs to acquire new domain knowledge.
This work points to still open research questions in the area, including the need for further pragmatic evaluation of explainable models in complex clinical workflows, the co-development of models of explanations with domain experts and a better understanding of the dialogue between other model safety mechanisms and explanations.
Acknowledgements
We would like to express our great gratitude to the healthcare professionals who participated in the experiment. We appreciate that they voluntary devoted their time, so limited in the time of pandemic, to complete the experiment. This paper and the research behind it would not have been possible without the significant feedback they delivered.
Funding
This project has received funding from the European Union’s Horizon 2020 research and innovation programme under grant agreement No 965397. Funding for developing the CORONET online tool has been provided by The Christie Charitable fund (1049751). Dr Rebecca Lee is supported by the National Institute for Health Research.
References
- [1] Kevin Bauer, Moritz Zahn and Oliver Hinz “Expl(Ai)Ned: The Impact of Explainable Artificial Intelligence on Cognitive Processes” In SSRN Electronic Journal, 2021 DOI: 10/gm9786
- [2] Zachary C. Lipton “The Mythos of Model Interpretability”, 2017 arXiv: http://arxiv.org/abs/1606.03490
- [3] Leilani H. Gilpin et al. “Explaining Explanations: An Overview of Interpretability of Machine Learning” In 2018 IEEE 5th International Conference on Data Science and Advanced Analytics (DSAA), 2018, pp. 80–89 DOI: 10/ggccrr
- [4] Wojciech Samek and Klaus-Robert Müller “Towards Explainable Artificial Intelligence” In Explainable AI: Interpreting, Explaining and Visualizing Deep Learning 11700, Lecture Notes in Computer Science Cham: Springer International Publishing, 2019, pp. 5–22 DOI: 10.1007/978-3-030-28954-6˙1
- [5] W. Murdoch et al. “Definitions, Methods, and Applications in Interpretable Machine Learning” In Proceedings of the National Academy of Sciences 116.44, 2019, pp. 22071–22080 DOI: 10/ggbhmq
- [6] Mokanarangan Thayaparan, Marco Valentino and André Freitas “A survey on explainability in machine reading comprehension” In arXiv preprint arXiv:2010.00389, 2020
- [7] Andreas Holzinger et al. “Information Fusion as an Integrative Cross-Cutting Enabler to Achieve Robust, Explainable, and Trustworthy Medical Artificial Intelligence” In Information Fusion 79, 2022, pp. 263–278 DOI: 10.1016/j.inffus.2021.10.007
- [8] Scott M Lundberg and Su-In Lee “A Unified Approach to Interpreting Model Predictions” In Advances in Neural Information Processing Systems 30 Curran Associates, Inc., 2017 URL: https://proceedings.neurips.cc/paper/2017/hash/8a20a8621978632d76c43dfd28b67767-Abstract.html
- [9] Marco Tulio Ribeiro, Sameer Singh and Carlos Guestrin “Anchors: High-precision model-agnostic explanations” In Proceedings of the AAAI conference on artificial intelligence 32.1, 2018
- [10] Satoshi Hara and Kohei Hayashi “Making Tree Ensembles Interpretable: A Bayesian Model Selection Approach” In Proceedings of the Twenty-First International Conference on Artificial Intelligence and Statistics PMLR, 2018, pp. 77–85
- [11] Arnaud Van Looveren and Janis Klaise “Interpretable Counterfactual Explanations Guided by Prototypes” arXiv, 2020 arXiv:1907.02584 [cs, stat]
- [12] Amit Dhurandhar et al. “Explanations Based on the Missing: Towards Contrastive Explanations with Pertinent Negatives” arXiv, 2018 arXiv:1802.07623 [cs]
- [13] Kazuaki Hanawa, Sho Yokoi, Satoshi Hara and Kentaro Inui “Evaluation of Similarity-based Explanations” arXiv, 2021 arXiv:2006.04528 [cs, stat]
- [14] Daniel W. Apley and Jingyu Zhu “Visualizing the Effects of Predictor Variables in Black Box Supervised Learning Models” arXiv, 2019 arXiv:1612.08468 [stat]
- [15] Heinrich Jiang, Been Kim, Melody Y. Guan and Maya Gupta “To Trust or Not to Trust a Classifier” In Proceedings of the 32nd International Conference on Neural Information Processing Systems, NIPS’18 Red Hook, NY, USA: Curran Associates Inc., 2018, pp. 5546–5557
- [16] Rebecca J. Lee et al. “Establishment of CORONET, COVID-19 Risk in Oncology Evaluation Tool, to Identify Patients With Cancer at Low Versus High Risk of Severe Complications of COVID-19 Disease On Presentation to Hospital” PMID: 35609228 In JCO Clinical Cancer Informatics, 2022, pp. e2100177 DOI: 10.1200/CCI.21.00177
- [17] Yasmeen Alufaisan et al. “Does Explainable Artificial Intelligence Improve Human Decision-Making?”, 2020 DOI: 10.31234/osf.io/d4r9t
- [18] Samuel Carton, Qiaozhu Mei and Paul Resnick “Feature-Based Explanations Don’t Help People Detect Misclassifications of Online Toxicity” In Proceedings of the International AAAI Conference on Web and Social Media 14, 2020, pp. 95–106 URL: https://ojs.aaai.org/index.php/ICWSM/article/view/7282
- [19] Himabindu Lakkaraju, Ece Kamar, Rich Caruana and Jure Leskovec “Faithful and Customizable Explanations of Black Box Models” In Proceedings of the 2019 AAAI/ACM Conference on AI, Ethics, and Society Honolulu HI USA: ACM, 2019, pp. 131–138 DOI: 10/ggvzms
- [20] James Schaffer et al. “I Can Do Better than Your AI: Expertise and Explanations” In Proceedings of the 24th International Conference on Intelligent User Interfaces, IUI ’19 New York, NY, USA: Association for Computing Machinery, 2019, pp. 240–251 DOI: 10/ggkkjj
- [21] Eoin M. Kenny, Courtney Ford, Molly Quinn and Mark T. Keane “Explaining Black-Box Classifiers Using Post-Hoc Explanations-by-Example: The Effect of Explanations and Error-Rates in XAI User Studies” In Artificial Intelligence 294, 2021, pp. 103459 DOI: 10.1016/j.artint.2021.103459
- [22] Andreas Holzinger and Heimo Müller “Toward Human–AI Interfaces to Support Explainability and Causability in Medical AI” In Computer 54.10, 2021, pp. 78–86 DOI: 10.1109/MC.2021.3092610
- [23] Antoine Hudon et al. “Explainable Artificial Intelligence (XAI): How the Visualization of AI Predictions Affects User Cognitive Load and Confidence” In Information Systems and Neuroscience 52, Lecture Notes in Information Systems and Organisation Cham: Springer International Publishing, 2021, pp. 237–246 DOI: 10.1007/978-3-030-88900-5˙27
- [24] Zana Buçinca, Maja Barbara Malaya and Krzysztof Z. Gajos “To Trust or to Think: Cognitive Forcing Functions Can Reduce Overreliance on AI in AI-assisted Decision-making” In Proceedings of the ACM on Human-Computer Interaction 5, 2021, pp. 188:1–188:21 DOI: 10.1145/3449287
- [25] Mark A. Musen, Blackford Middleton and Robert A. Greenes “Clinical Decision-Support Systems” In Biomedical Informatics: Computer Applications in Health Care and Biomedicine Cham: Springer International Publishing, 2021, pp. 795–840 DOI: 10.1007/978-3-030-58721-5˙24
- [26] Sean McGrath et al. “When Does Uncertainty Matter?: Understanding the Impact of Predictive Uncertainty in ML Assisted Decision Making”, 2020 arXiv: http://arxiv.org/abs/2011.06167
- [27] Divya Ramani et al. “Examining the Patterns of Uncertainty across Clinical Reasoning Tasks: Effects of Contextual Factors on the Clinical Reasoning Process” In Diagnosis 7.3, 2020, pp. 299–305 DOI: 10/gm9785
- [28] Finale Doshi-Velez and Been Kim “Considerations for Evaluation and Generalization in Interpretable Machine Learning” In Explainable and Interpretable Models in Computer Vision and Machine Learning, The Springer Series on Challenges in Machine Learning Cham: Springer International Publishing, 2018, pp. 3–17 DOI: 10.1007/978-3-319-98131-4˙1
- [29] Jianlong Zhou, Syed Z. Arshad, Simon Luo and Fang Chen “Effects of Uncertainty and Cognitive Load on User Trust in Predictive Decision Making” In Human-Computer Interaction – INTERACT 2017 10516 Cham: Springer International Publishing, 2017, pp. 23–39 DOI: 10.1007/978-3-319-68059-0˙2
- [30] Onur Asan, Alparslan Emrah Bayrak and Avishek Choudhury “Artificial Intelligence and Human Trust in Healthcare: Focus on Clinicians” In Journal of Medical Internet Research 22.6, 2020, pp. e15154 DOI: 10/ghxwzf
- [31] Taehyun Ha, Young June Sah, Yuri Park and Sangwon Lee “Examining the effects of power status of an explainable artificial intelligence system on users’ perceptions” In Behaviour & Information Technology 0.0 Taylor & Francis, 2020, pp. 1–13 DOI: 10.1080/0144929X.2020.1846789
- [32] Marzyeh Ghassemi, Luke Oakden-Rayner and Andrew L. Beam “The False Hope of Current Approaches to Explainable Artificial Intelligence in Health Care” In The Lancet Digital Health 3.11 Elsevier, 2021, pp. e745–e750 DOI: 10/gm8bdh
- [33] Linda J. Skitka, Kathleen L. Mosier and Mark Burdick “Does Automation Bias Decision-Making?” In International Journal of Human-Computer Studies 51.5, 1999, pp. 991–1006 DOI: 10/bg5rb7
- [34] Kate Goddard, Abdul Roudsari and Jeremy Wyatt “Automation Bias - A Hidden Issue for Clinical Decision Support System Use” In Studies in health technology and informatics 164, 2011, pp. 17–22 DOI: 10.3233/978-1-60750-709-3-17
- [35] Heimo Müller et al. “Explainability and Causability for Artificial Intelligence-Supported Medical Image Analysis in the Context of the European In Vitro Diagnostic Regulation” In New Biotechnology 70, 2022, pp. 67–72 DOI: 10.1016/j.nbt.2022.05.002
- [36] Srikant Devaraj et al. “Barriers and Facilitators to Clinical Decision Support Systems Adoption: A Systematic Review” In Journal of Business Administration Research 3.2; https://web.archive.org/web/20220303231827/https://www.sciedu.ca/journal/index.php/jbar/article/view/5217, 2014, pp. 36 DOI: 10.5430/jbar.v3n2p36
- [37] R.J. Lee et al. “Longitudinal characterisation of haematological and biochemical parameters in cancer patients prior to and during COVID-19 reveals features associated with outcome” In ESMO Open 6.1, 2021, pp. 100005 DOI: https://doi.org/10.1016/j.esmoop.2020.100005
- [38] Hannah Burke et al. “Biomarker Identification Using Dynamic Time Warping Analysis: A Longitudinal Cohort Study of Patients with COVID-19 in a UK Tertiary Hospital” In BMJ Open 12.2, 2022, pp. e050331 DOI: 10.1136/bmjopen-2021-050331
- [39] Anna Freeman et al. “Wave Comparisons of Clinical Characteristics and Outcomes of COVID-19 Admissions - Exploring the Impact of Treatment and Strain Dynamics” In Journal of Clinical Virology 146, 2022, pp. 105031 DOI: 10.1016/j.jcv.2021.105031
- [40] Oskar Wysocki et al. “An International Comparison of Presentation, Outcomes and CORONET Predictive Score Performance in Patients with Cancer Presenting with COVID-19 across Different Pandemic Waves” In Cancers 14.16, 2022, pp. 3931 DOI: 10.3390/cancers14163931
- [41] R.J. Lee et al. “Establishment of CORONET; COVID-19 Risk in Oncology Evaluation Tool to identify cancer patients at low versus high risk of severe complications of COVID-19 infection upon presentation to hospital” In medRxiv Cold Spring Harbor Laboratory Press, 2020 DOI: 10.1101/2020.11.30.20239095
- [42] Rebecca Lee et al. “CORONET; COVID-19 in Oncology evaluatiON Tool: Use of machine learning to inform management of COVID-19 in patients with cancer.” In Journal of Clinical Oncology 39.15_suppl, 2021, pp. 1505–1505 DOI: 10.1200/JCO.2021.39.15“˙suppl.1505
- [43] Jerome H Friedman “Greedy function approximation: a gradient boosting machine” In Annals of statistics JSTOR, 2001, pp. 1189–1232
- [44] Alex Goldstein, Adam Kapelner, Justin Bleich and Emil Pitkin “Peeking Inside the Black Box: Visualizing Statistical Learning With Plots of Individual Conditional Expectation” In Journal of Computational and Graphical Statistics 24.1, 2015, pp. 44–65 DOI: 10.1080/10618600.2014.907095
- [45] Erico Tjoa and Cuntai Guan “A Survey on Explainable Artificial Intelligence (XAI): Toward Medical XAI” In IEEE Transactions on Neural Networks and Learning Systems 32.11, 2021, pp. 4793–4813 DOI: 10.1109/TNNLS.2020.3027314
- [46] David Lyell and Enrico Coiera “Automation Bias and Verification Complexity: A Systematic Review” In Journal of the American Medical Informatics Association: JAMIA 24.2, 2017, pp. 423–431 DOI: 10/gng5ps
- [47] Daniel Raggi et al. “Dissecting Representations” Springer International Publishing, 2020 DOI: 10.17863/CAM.57293; https://web.archive.org/web/20220314103546/https://www.repository.cam.ac.uk/handle/1810/310207
- [48] Peter C.-H. Cheng et al. “Cognitive Properties of Representations: A Framework” In Diagrammatic Representation and Inference, Lecture Notes in Computer Science Cham: Springer International Publishing, 2021, pp. 415–430 DOI: 10.1007/978-3-030-86062-2˙43
- [49] Hilde J.. Weerts, Werner Ipenburg and Mykola Pechenizkiy “A Human-Grounded Evaluation of SHAP for Alert Processing”, 2019 arXiv: http://arxiv.org/abs/1907.03324
- [50] Himabindu Lakkaraju and Osbert Bastani “”How Do I Fool You?”: Manipulating User Trust via Misleading Black Box Explanations” In Proceedings of the AAAI/ACM Conference on AI, Ethics, and Society New York NY USA: ACM, 2020, pp. 79–85 DOI: 10/ghj6hb
- [51] I. Kumar, Suresh Venkatasubramanian, Carlos Scheidegger and Sorelle Friedler “Problems with Shapley-value-based Explanations as Feature Importance Measures” In Proceedings of the 37th International Conference on Machine Learning PMLR, 2020, pp. 5491–5500 URL: https://proceedings.mlr.press/v119/kumar20e.html
- [52] Reed T. Sutton et al. “An Overview of Clinical Decision Support Systems: Benefits, Risks, and Strategies for Success” In npj Digital Medicine 3.1, 2020, pp. 17 DOI: 10.1038/s41746-020-0221-y
- [53] Theodore Evans et al. “The Explainability Paradox: Challenges for xAI in Digital Pathology” In Future Generation Computer Systems 133, 2022, pp. 281–296 DOI: 10.1016/j.future.2022.03.009
- [54] Jasper Waa, Elisabeth Nieuwburg, Anita Cremers and Mark Neerincx “Evaluating XAI: A Comparison of Rule-Based and Example-Based Explanations” In Artificial Intelligence 291, 2021, pp. 103404 DOI: 10/gjm97h
- [55] Ben Green and Yiling Chen “The Principles and Limits of Algorithm-in-the-Loop Decision Making” In Proc. ACM Hum.-Comput. Interact. 3.CSCW New York, NY, USA: Association for Computing Machinery, 2019 DOI: 10.1145/3359152
- [56] Forough Poursabzi-Sangdeh et al. “Manipulating and Measuring Model Interpretability”, 2021 arXiv: http://arxiv.org/abs/1802.07810
- [57] Yunfeng Zhang, Q. Liao and Rachel K.. Bellamy “Effect of Confidence and Explanation on Accuracy and Trust Calibration in AI-assisted Decision Making” In Proceedings of the 2020 Conference on Fairness, Accountability, and Transparency, FAT* ’20 New York, NY, USA: Association for Computing Machinery, 2020, pp. 295–305 DOI: 10/ggjpcr
- [58] Kate Goddard, Abdul Roudsari and Jeremy C. Wyatt “Automation Bias: Empirical Results Assessing Influencing Factors” In International Journal of Medical Informatics 83.5, 2014, pp. 368–375 DOI: 10/f2wz3k
- [59] Dawn Dowding et al. “Nurses’ Use of Computerised Clinical Decision Support Systems: A Case Site Analysis” In Journal of Clinical Nursing 18.8, 2009, pp. 1159–1167 DOI: 10.1111/j.1365-2702.2008.02607.x
- [60] Qian Yang, Aaron Steinfeld and John Zimmerman “Unremarkable AI: Fitting Intelligent Decision Support into Critical, Clinical Decision-Making Processes” In Proceedings of the 2019 CHI Conference on Human Factors in Computing Systems, CHI ’19 New York, NY, USA: Association for Computing Machinery, 2019, pp. 1–11 DOI: 10.1145/3290605.3300468
- [61] Julius Adebayo et al. “Sanity Checks for Saliency Maps”, 2020 arXiv: http://arxiv.org/abs/1810.03292
- [62] Marzyeh Ghassemi et al. “ClinicalVis: Supporting Clinical Task-Focused Design Evaluation”, 2018 arXiv: http://arxiv.org/abs/1810.05798
- [63] Malin Eiband, Daniel Buschek, Alexander Kremer and Heinrich Hussmann “The Impact of Placebic Explanations on Trust in Intelligent Systems” In Extended Abstracts of the 2019 CHI Conference on Human Factors in Computing Systems, CHI EA ’19 New York, NY, USA: Association for Computing Machinery, 2019, pp. 1–6 DOI: 10/gmv78z
- [64] Ericka Rovira, Kathleen McGarry and Raja Parasuraman “Effects of Imperfect Automation on Decision Making in a Simulated Command and Control Task” In Human Factors 49.1 SAGE Publications Inc, 2007, pp. 76–87 DOI: 10/fmh7q6
- [65] Po-Hsuan Cameron Chen, Craig H Mermel and Yun Liu “Evaluation of Artificial Intelligence on a Reference Standard Based on Subjective Interpretation” In The Lancet Digital Health 3.11, 2021, pp. e693–e695 DOI: 10/gmv7xj
- [66] Alex John London “Artificial Intelligence and Black-Box Medical Decisions: Accuracy versus Explainability” In Hastings Center Report 49.1, 2019, pp. 15–21 DOI: 10/ghvzdb
Supplementary Information
Supplementary Methods
List of questions
Below we list all questions from the experiment, that are relevant in the analysis aiming to answer broader research questions from the previous section. The questions were produced by both computer scientists and oncologists, same as involved in designing clinical cases.
Questions related to demographics:
-
•
D1. What is your job title?
-
•
D2. What is your age group?
-
•
D3. Which of the following tasks do you perform on computers at work?
-
•
D4. Rate your knowledge on the management of patients with cancer who have developed COVID-19
Questions related to expectations:
-
•
Q1. I feel comfortable when using new technology
-
•
Q2. It is important for me to know the mathematics behind the model’s recommendations
-
•
Q3. It is important for me to know the features of my patient contribute to the model’s recommendation
-
•
Q4. It is important for me to know how the model makes its recommendation for my individual patient
-
•
Q5. It is important for me to know how uncertain (in %) the model is about its recommendation
Questions related to the visual representation:
-
•
Q6. The colour bar with the score is easy to interpret
-
•
Q7. The colour bar with the score convinces me to accept or reject the model’s recommendation
-
•
Q8. The scatterplot with all patients is easy to interpret
-
•
Q9. The scatterplot with all patients convinces me to accept or reject the model’s recommendation
-
•
Q10. The barplot with feature contribution is easy to interpret
-
•
Q11. The barplot with feature contribution convinces me to accept or reject the model’s recommendation
Questions related to the user’s attitude towards the model:
-
•
A. I am satisfied with the output information that CORONET provides
-
•
B. CORONET helps me in making safe clinical decisions on patient management
-
•
C. When my initial decision was the same as CORONET had recommended, I felt reassured
-
•
D. I understand when and why CORONET may provide the wrong recommendation in some cases
-
•
E. CORONET helps in cases where I am less confident in the decision on how to proceed
-
•
F. Even when my initial course of action was different to what CORONET recommended, I still had full confidence in my original decision.
-
•
G. I was surprised when CORONET recommended an action different to my own
Feedback from Healthcare Professionals
Below we quote received feedback regarding the usability of the tool from the Healthcare Professionals:
-
•
This could be a very useful tool to aid the clinician’s decision. With every risk stratification score/tool - I’m used to using the MASCC score for febrile neutropenia, it helps your final decision. If my gut said admit, irrespective of any score, I would admit. Tools can be great to add confidence to a less obvious choice of admit/discharge.
-
•
With all the patients I would have discharged home, I still would have asked my team to safety-net call for the next 10-14 days.
-
•
I don’t think this can be proposed in clinical practice
-
•
decision to admit a cancer patient is complex and multifactorial - often dependent on social support, patient engagement and both cancer and treatment related complications
-
•
Really good tool. Very easy to use. It would be great to get individual hospital trusts to consider adding it to hospital guidelines so doctors felt safer using it to base decisions off.
-
•
Easy to use but differed a lot with my clinical assessment
-
•
Having played with the app a little, it seems like the biggest impact on score comes from NEWS, so I think for many patients it won’t add much, but can be a useful adjunct.
-
•
An interesting concept but not one that I think would be used in its current format in clinical care-too formulaic and not individualized to patient risk factors
Additionally, at the end of the experiment Healthcare Professionals were asked about aspects in which the tool could be improved in the future. Below we quote received feedback:
-
•
Inclusion in guidelines, clarify the legal implications
-
•
CORONET is a standalone ‘App’ - to be useful (and used) it has to integrate with patient EPRs (Electronic Patient Record) so HCPs are not copying electronic information from EPR to CORONET - this not only takes time but prone to errors - This would be a major factor in my decision to recommend CORONET
-
•
May be useful to separate high risk and low risk comorbidities. For example, some conditions such as COPD will cause more severe issues when combined with COVID than other conditions such as diabetes.
-
•
It does not seem to take into account oxygen requirements independently of NEWS2; it is difficult to discharge someone who is needing 4L of oxygen!
-
•
Take into consideration if they are active chemotherapy/immunotherapy. As even with a covid positive test, they still require iv antibiotics and monitoring. Higher risk of deterioration, especially lung cancers, if discharged home.
-
•
The wording on the red/yellow diagram seems to be inconsistent re categories. 1st and 2nd are actions e.g. ‘consider’ admit/discharge, the 3rd is commenting on the disease severity. These are different categories, so the third should be more like ‘consider level 2+ care’ or another type of action
-
•
The labeling of the red/yellow score is a bit hard to follow, suggest removing the bottom legend
User interface design
The CORONET tool available at https://coronet.manchester.ac.uk/ was developed following general principles of usability and universal design in order to meet level 2 (AA) of the Web Content Accessibility Guidelines (WCAG) 2.1 (https://www.w3.org/TR/WCAG21/). More details regarding the web accessibility are available at https://www.manchester.ac.uk/web-accessibility/.
Supplementary Tables
|
Advanced Nurse Practitioner or higher |
Advanced Nurse Practitioner or higher |
Consultant / attending physician |
Consultant / attending physician |
Consultant / attending physician |
Consultant / attending physician |
Consultant / attending physician |
Doctor within first year of graduating (FY1) / intern |
Doctor (within 2-4 years of graduating / specialty trainee (ST) / fellow |
Doctor (within 2-4 years of graduating / specialty trainee (ST) / fellow |
General practitioner / GPST / community doctor |
General practitioner / GPST / community doctor |
General practitioner / GPST / community doctor |
Other (please enter text) |
Registered Nurse |
Specialist Nurse |
Specialist registrar / ST 3+ / senior resident/senior fellow |
Specialist registrar / ST 3+ / senior resident/senior fellow |
Specialist registrar / ST 3+ / senior resident/senior fellow |
Specialist registrar / ST 3+ / senior resident/senior fellow |
Specialist registrar / ST 3+ / senior resident/senior fellow |
Specialist registrar / ST 3+ / senior resident/senior fellow |
Specialist registrar / ST 3+ / senior resident/senior fellow |
|
|
| Emailing | x | x | x | x | x | x | x | x | x | x | x | x | x | x | x | x | x | x | x | x | x | x | 96% | |
| Accessing clinical guidelines | x | x | x | x | x | x | x | x | x | x | x | x | x | x | x | x | x | x | x | x | x | 91% | ||
| Viewing test results | x | x | x | x | x | x | x | x | x | x | x | x | x | x | x | x | x | x | x | x | x | x | 96% | |
| Viewing drug charts | x | x | x | x | x | x | x | x | x | x | x | x | x | x | x | x | x | 74% | ||||||
| Online clinical calculators | x | x | x | x | x | x | x | x | x | x | x | x | x | x | x | x | x | x | x | 83% | ||||
| Online scoring systems and/or algorithms | x | x | x | x | x | x | x | x | x | x | x | x | x | x | x | 65% | ||||||||
| Statistical analysis | x | x | x | x | x | x | x | x | 35% |
|
||||
|---|---|---|---|---|
|
6 [5,6] | |||
|
4 [4,6] | |||
|
5 [3.5,6] | |||
|
5 [4,5.5] | |||
|
5 [5,6] | |||
|
5 [4,6] | |||
| p>0.05 | ||||
| Friedman test |
| p (Kruskal–Wallis) | |||||||||
|
vs. |
|
0.131 | ||||||
|
vs. |
|
0.716 | ||||||
|
vs. |
|
0.244 | ||||||
|
vs. |
|
0.387 | ||||||
|
vs. |
|
0.281 | ||||||
|
vs. |
|
0.740 |
| Spearman correlation r |
|
|
|
|
|
|
|||||||||||||||||||||||
|---|---|---|---|---|---|---|---|---|---|---|---|---|---|---|---|---|---|---|---|---|---|---|---|---|---|---|---|---|---|
|
0.026 | -0.101 | -0.199 | -0.109 | -0.003 | -0.187 | |||||||||||||||||||||||
|
-0.214 | 0.062 | -0.195 | 0.031 | 0 | -0.011 | |||||||||||||||||||||||
|
-0.105 | 0.333 | -0.122 | -0.309 | 0.085 | -0.107 | |||||||||||||||||||||||
|
-0.156 | 0.433 | -0.054 | -0.283 | 0.059 | -0.167 | |||||||||||||||||||||||
|
-0.368 | 0.077 | -0.288 | -0.06 | -0.164 | -0.044 | |||||||||||||||||||||||
|
-0.255 | 0.388 | -0.268 | -0.124 | -0.038 | -0.081 |
|
|||||
|---|---|---|---|---|---|
|
4 [2,5] | b | |||
|
6 [5,6.5] | a | |||
|
6 [5,6] | a | |||
|
6 [5.5, 7] | a | |||
| p<0.001 | p<0.001 | ||||
| Friedman test | posthoc Kruskal-Wallis |
| Index | Question |
|
|
||||||
|---|---|---|---|---|---|---|---|---|---|
|
|
p | significance* | ||||||
| A |
|
5 [4.5,6] | 5 [5,6] | 0.976 | ns | ||||
| B |
|
5 [3.5,5] | 5 [4,5] | 0.425 | ns | ||||
| C |
|
5 [4,6] | 5 [4,6] | 0.746 | ns | ||||
| D |
|
5 [3,6] | 5 [4,5] | 0.275 | ns | ||||
| E |
|
4 [3,5] | 5 [4,5.5] | 0.056 | ns | ||||
| F |
|
5 [5,6] | 5 [5,6] | 0.890 | ns | ||||
| G |
|
4 [3,5] | 4 [3,5] | 0.821 | ns | ||||
| Change in: | Change in: |
|
p |
|
significance | ||||
|---|---|---|---|---|---|---|---|---|---|
| Reassurance | Understanding wrong recommendation | 0.762 | 0.000 | 0.003 | ** | ||||
| Satisfaction with the output | Help in making safe decisions | 0.632 | 0.001 | 0.135 | ns | ||||
| Reassurance | Help when HCP is less confident | 0.549 | 0.007 | 0.553 | ns | ||||
| Satisfaction with the output | Reassurance | 0.513 | 0.012 | 0.771 | ns | ||||
| Help in making safe decisions | Help when HCP is less confident | 0.418 | 0.047 | 0.997 | ns |
Supplementary Figures