Assessment of Massively Multilingual Sentiment Classifiers
Abstract
Models are increasing in size and complexity in the hunt for SOTA. But what if those 2% increase in performance does not make a difference in a production use case? Maybe benefits from a smaller, faster model outweigh those slight performance gains. Also, equally good performance across languages in multilingual tasks is more important than SOTA results on a single one. We present the biggest, unified, multilingual collection of sentiment analysis datasets. We use these to assess 11 models and 80 high-quality sentiment datasets (out of 342 raw datasets collected) in 27 languages and included results on the internally annotated datasets. We deeply evaluate multiple setups, including fine-tuning transformer-based models for measuring performance. We compare results in numerous dimensions addressing the imbalance in both languages coverage and dataset sizes. Finally, we present some best practices for working with such a massive collection of datasets and models from a multilingual perspective.
1 Introduction
Multilingual text representations are becoming increasingly important in science as well as the business community. However how universal and versatile they truly are? Can we use them to train one, multilingual, production-ready sentiment classifier? To verify this research question, we gathered a massive collection of sentiment analysis datasets and evaluated 11 different models on them. We want to assess the performance of fine-tuning languages models as well as language models as feature extractors for simpler, even linear models.
Sentiment analysis is subjective and both domain and language-dependent, hence there is an even greater need to understand the behaviour and performance of the multilingual setup. We focused on multilingual sentiment classification because our business use cases involve the analysis of texts in multiple languages across the world. Moreover, one universal model in a production environment is much easier to deploy, maintain, monitor, remove biases or improve the model’s fairness - especially in cases when the load differs between languages and could change over time. We want to compare state-of-the-art multilingual embedding methods and select the ones with the best performance across languages.
The main objective of this article is to answer the following Research Questions: (RQ1) Are we able to create a single multilingual sentiment classifier, that performs equally well for each language? (RQ2) Does fine-tuning of transformer-based models significantly improve sentiment classification results? (RQ3) What is the relationship between model size and performance? Is bigger always better?
Our main contribution includes 3 main points. Firstly, we perform a large scoping review of published sentiment datasets. Using a set of rigid inclusion and exclusion criteria, we filter the initial pool of 342 datasets down to 80 high-quality datasets representing 27 languages. Secondly, we evaluated how universal and versatile multilingual text representations are for the sentiment classification problem. Finally, we compared many deep learning-based approaches with fine-tuning and without it for multilingual sentiment classification.
The remainder of this paper is organized as follows: Section 2 presents a literature review on the topic of multilingual sentiment analysis; Section 3 describes the language models, datasets, and our evaluation methodology; Section 4 describes the conducted experiments and summarizes the results; Section 5 discusses the results in terms of research questions; Section 6 presents conclusions and describes further works.
2 Related Work
Multilingual Text Representations.
Initially, multilingual text representations were obtained using multilingual word embeddings Ruder et al. (2019). These were created using various training techniques, parallel corpora, and dictionaries, for example by aligning the monolingual Word2Vec Mikolov et al. (2013a) vector spaces with linear transformations using small parallel dictionaries Mikolov et al. (2013b).
To better represent longer texts, modern approaches use more complex contextual language models like BiLSTM Artetxe and Schwenk (2019) and Transformers Feng et al. (2020); Conneau et al. (2020); Devlin et al. (2019); Xue et al. (2021); Yang et al. (2020). Their multilingual capabilities result from pretraining on multilingual objective tasks like machine translation Artetxe and Schwenk (2019), translation language modelling (TLM) Conneau et al. (2020); Conneau and Lample (2019) or translation ranking Feng et al. (2020); Yang et al. (2019). Details of the models used in our experiments are described in Section 3.1.
The quality of multilingual text representations is usually evaluated with cross- and multilingual tasks like cross-lingual natural language inference Conneau et al. (2018), question answering Lewis et al. (2020), named entity recognition Tjong Kim Sang (2002); Tjong Kim Sang and De Meulder (2003) or parallel text extraction Zweigenbaum et al. (2017); Ziemski et al. (2016).
Another important benchmark is XTREME Hu et al. (2020), which is designed for testing the abilities of cross-lingual transfer across 40 languages and 9 tasks. Despite its massive character, XTREME lacks benchmarking task of sentiment analysis, also only mBERT, XLM, XLM-R, and MMTE are used as baseline models. We try to fill this gap with our work.
K et al. (2020) performed extensive research on the cross-lingual ability of mBERT. Wu and Dredze (2020) compared mBERT with monolingual models and found that it under-performs on low-resource languages. Liu et al. (2020) analyzed a cross-lingual ability of mBERT considering a contextual aspect of mBERT and dataset size. There is a significant lack of detailed analysis of characteristics of other language models, despite mBERT.
Multilingual Sentiment Analysis. In literature, there are several examples of reviews, which focus on traditional sentiment analysis methods (e.g., lexicon-based, lexical features engineering, shallow models), while not mentioning any embedding-based methods Dashtipour et al. (2016); Sagnika et al. (2020). They are a valuable source of information about sentiment datasets. However, modern NLP applications often utilize deep learning techniques, which were not covered there. An example of a deep learning-based approach was presented by Attia et al. (2018), who trained a convolutional neural network (CNN) on word-level embeddings of texts in English, German and Arabic, a separate model for each language. This approach requires many resources and computations as one has to create a separate embedding dictionary for each language. An alternative approach is to use character-level embeddings. Wehrmann et al. (2017) trained such a model to classify tweets written in English, German, Portuguese, and Spanish as either positive or negative. This approach requires fewer parameters than word embedding models.
Newer approaches to multilingual sentiment analysis use deep models and machine translation e.g. Can et al. (2018) trained a Recurrent Neural Network (RNN) on English reviews and evaluated it on machine-translated reviews in Russian, Spanish, Turkish and Dutch. They used the Google Translation API and pre-trained GloVe embeddings for English. Kanclerz et al. (2020) used LASER sentence embeddings to learn a sentiment classifier on Polish reviews and used this classifier to predict sentiment on reviews translated into other languages. As we can see most of the research covers only a couple of languages for sentiment analysis. Hence, we decided to gather a massive collection of 342 datasets in 27 languages.
| Model | Inf. time [s] | #params | #langs | basea | data | reference |
|---|---|---|---|---|---|---|
| mT5 | 1.69 | 277M | 101 | T5 | CCb | Xue et al. (2021) |
| LASER | 1.64 | 52M | 93 | BiLSTM | OPUSc | Artetxe and Schwenk (2019) |
| mBERT | 1.49 | 177M | 104 | BERT | Wiki | Devlin et al. (2019) |
| MPNet** | 1.38 | 278M | 53 | XLM-R | OPUSc, MUSEd, Wikititlese | Reimers and Gurevych (2020) |
| XLM-R-dist** | 1.37 | 278M | 53 | XLM-R | OPUSc, MUSEd, Wikititlese | Reimers and Gurevych (2020) |
| XLM-R | 1.37 | 278M | 100 | XLM-R | CC | Conneau et al. (2020) |
| LaBSE | 1.36 | 470M | 109 | BERT | CC, Wiki + mined bitexts | Feng et al. (2020) |
| DistilmBERT | 0.79 | 134M | 104 | BERT | Wiki | Sanh et al. (2020) |
| mUSE-dist** | 0.79 | 134M | 53 | DistilmBERT | OPUSc, MUSEd, Wikititlese | Reimers and Gurevych (2020) |
| mUSE-transformer* | 0.65 | 85M | 16 | transformer | mined QA + bitexts, SNLI | Yang et al. (2020) |
| mUSE-cnn* | 0.12 | 68M | 16 | CNN | mined QA + bitexts, SNLI | Yang et al. (2020) |
3 Evaluation Methodology
We conducted several experiments to answer if there is a truly universal multilingual text representation model (Table 1). We tested their performance based on the largest sentiment analysis dataset in the literature.
3.1 Multilingual Language Models
We used multiple language models as text representation methods (Table 1). We aimed to select models varied in terms of architecture, size, and type of data used in pre-training. We selected two models which do not use transformer architecture (CNN and BiLSTM) as a baseline. We also used models, based on multiple different transformer architectures (T5, BERT, RoBERTa). We also included models’ trained with multilingual knowledge distillation Reimers and Gurevych (2020) such as paraphrase-xlm-r-multilingual-v1 (XLM-R-dist), distiluse-base-multilingual-cased-v2 (mUSE-dist), paraphrase-multilingual-mpnet-base-v2 (MPNet). We also included models trained on multilingual corpus like Wikipedia (Wiki) or Common Crawl (CC) as well as models trained with the use of parallel datasets. Selected models differ in size - from LASER with 52M parameters to LaBSE with 470M. They also differ regarding covered languages, from 16 up to more than a hundred. By a number of languages, we mean how many were used to create a specific model, not all languages supported by the model (an example is MPNet, trained using 53 languages, but as it is based on XLM-R, it supports 100). We also compared inference time which was calculated as a mean of inference times of 500 randomly selected texts samples from all datasets. The hardware used is described in Section A.1. We searched for models comparison in similar tasks in literature but failed to find any, which compares more than 2 or 3 models. All models used are characterized in Table 1.
| Count | Category | Samples | Mean # | |||||||
|---|---|---|---|---|---|---|---|---|---|---|
| N | O | R | SM | NEG | NEU | POS | words | characters | ||
| English | 17 | 3 | 4 | 4 | 6 | 305,782 | 289,847 | 1,734,857 | 42 | 233 |
| Arabic | 9 | 0 | 1 | 4 | 4 | 139,173 | 192,463 | 600,439 | 28 | 159 |
| Spanish | 5 | 0 | 1 | 3 | 2 | 110,156 | 120,668 | 188,068 | 145 | 864 |
| Chinese | 2 | 0 | 0 | 2 | 0 | 118,023 | 68,953 | 144,726 | 48 | - |
| German | 6 | 0 | 0 | 1 | 5 | 105,416 | 99,291 | 111,180 | 19 | 131 |
| Polish | 4 | 0 | 0 | 2 | 2 | 78,309 | 61,041 | 97,338 | 39 | 245 |
| French | 3 | 0 | 0 | 1 | 2 | 84,324 | 43,097 | 83,210 | 19 | 108 |
| Japanese | 1 | 0 | 0 | 1 | 0 | 83,985 | 41,976 | 83,819 | 60 | - |
| Czech | 4 | 0 | 0 | 2 | 2 | 39,687 | 59,181 | 97,419 | 29 | 168 |
| Portuguese | 4 | 0 | 0 | 0 | 4 | 57,737 | 54,145 | 45,952 | 12 | 73 |
| Slovenian | 2 | 1 | 0 | 0 | 1 | 34,178 | 50,055 | 29,310 | 161 | 1054 |
| Russian | 2 | 0 | 0 | 0 | 2 | 32,018 | 47,852 | 31,060 | 11 | 73 |
| Croatian | 2 | 1 | 0 | 0 | 1 | 19,907 | 19,298 | 38,389 | 86 | 556 |
| Serbian | 3 | 0 | 0 | 2 | 1 | 25,580 | 31,762 | 19,026 | 176 | 1094 |
| Thai | 2 | 0 | 0 | 1 | 1 | 9,327 | 28,615 | 34,377 | 18 | 317 |
| Bulgarian | 1 | 0 | 0 | 0 | 1 | 14,040 | 28,543 | 19,567 | 12 | 85 |
| Hungarian | 1 | 0 | 0 | 0 | 1 | 9,004 | 17,590 | 30,088 | 11 | 83 |
| Slovak | 1 | 0 | 0 | 0 | 1 | 14,518 | 12,735 | 29,370 | 13 | 97 |
| Albanian | 1 | 0 | 0 | 0 | 1 | 6,958 | 14,675 | 22,651 | 13 | 90 |
| Swedish | 1 | 0 | 0 | 0 | 1 | 16,664 | 12,912 | 11,770 | 14 | 94 |
| Bosnian | 1 | 0 | 0 | 0 | 1 | 12,078 | 11,039 | 13,066 | 12 | 75 |
| Urdu | 1 | 0 | 1 | 0 | 0 | 5,244 | 8,580 | 5,836 | 13 | 69 |
| Hindi | 1 | 0 | 0 | 0 | 1 | 4,992 | 6,392 | 5,615 | 27 | 128 |
| Persian | 1 | 0 | 0 | 1 | 0 | 1,619 | 5,074 | 6,832 | 21 | 104 |
| Italian | 2 | 0 | 0 | 0 | 2 | 4,043 | 4,193 | 3,829 | 16 | 104 |
| Hebrew | 1 | 0 | 0 | 0 | 1 | 2,283 | 238 | 6,098 | 22 | 110 |
| Latvian | 1 | 0 | 0 | 0 | 1 | 1,379 | 2,617 | 1,794 | 20 | 138 |
3.2 Datasets
We gathered 342 sentiment analysis datasets containing texts from multiple languages, data sources and domains to check our research questions. We searched for datasets in various sources, like Google Scholar, GitHub repositories, and the HuggingFace datasets library. Such a large number of datasets allows us to estimate the quality of language models in various conditions with greater certainty. To the best of our knowledge, this is the largest sentiment analysis datasets collection currently gathered and researched in literature. After preliminary analysis, we selected 80 datasets of reasonable quality based on 5 criteria. (1) We rejected datasets containing weak annotations (e.g., datasets with labels based on emoji occurrence or generated automatically through classification by machine learning models), as our analysis showed that they may contain too much noise Northcutt et al. (2021). (2) We reject datasets without sufficient information about the annotation procedure (e.g., whether annotation was manual or automatic, number of annotators) because it is always a questionable decision to merge datasets created with different annotation guidelines. (3) We accepted reviews datasets and mapped their rating labels to sentiment values. The mapping rules are described in section 3.2.1. (4) We rejected 2-class only datasets (positive/negative without neutral), as our analysis showed their low quality in terms of 3-class usage. (5) Some datasets contain samples in multiple languages - we split them and treated each language as a separate dataset.
3.2.1 Data Preprocessing
Working with many datasets means that they could contain different types of text, various artefacts such as URL or HTML tags, or just different sentiment classes mappings. We applied a couple of preprocessing steps to each dataset to unify all datasets. We dropped duplicated texts. We removed URLs, Twitter mentions, HTML tags, and emails. During an exploratory analysis, we spotted that review-based datasets often contain many repeated texts with contradictory sentiment scores. We deduplicated such cases and applied a majority voting to choose a sentiment label. Finally, we unified labels from all datasets into 3-class (negative, neutral, positive). In the case of datasets containing user ratings (on a scale of 1-5) along with their review texts, we mapped the ratings to sentiment as follows: the middle value (3) of the rating scale was treated as a neutral sentiment, ratings below the middle as negative sentiment, and ratings above the middle as positive sentiment.
Presenting statistics of 80 datasets across 27 languages could be challenging. We checked different aggregating and sorting of datasets to make their statistics as readable as possible and easily usable for results discussion. We decided to group datasets by their language and next sorted them based on the number of examples in every aggregate - Table 2. In total, we selected 80 datasets containing 6,164,942 text samples. Most of the texts in the datasets are in English (2,330,486 samples across 17 datasets), Arabic (932,075 samples across 9 datasets), and Spanish (418,892 samples across 5 datasets). The datasets contain text from various categories: social media (44 datasets), reviews (24 datasets), news (5 datasets), and others (7 datasets). They also differ in the mean number of words and characters in examples. See the detailed information of datasets used is in Tables 5 and 6.
We also selected around 60k samples for training and validation and another 60k for testing. This is enough for training a small classifier on top of a frozen embedding or fine-tuning a transformer-based model (see Section 3.3). This was also done due to computation resources limitations.
| lang | samples | NEG | NEU | POS |
|---|---|---|---|---|
| pl | 2968 | 14% | 60% | 26% |
| en | 943 | 4% | 74% | 22% |
3.2.2 Internal Dataset
We have also used an internal dataset that was manually annotated. It is multi-domain and consists of texts from various Internet sources in Polish and English. It includes texts from social media, news sites, blogs and forums. We used this dataset as a gold standard. We need it because we do not know exact annotation guidelines from literature datasets and we assume that those guidelines differed between datasets. In our gold dataset, each text was annotated by 3 annotators with majority label selection. The annotators achieved a high agreement measured by Cohen’s kappa: and Krippendorff’s alpha: . Statistics of this dataset are presented in Table 3. All samples were trimmed to the length of 350 chars (mean length of 145 chars).
3.3 Experimental Scenarios
We wanted to compare multilingual models in different use cases. Firstly, we wanted to see how much information is stored in pre-trained embedding. In this scenario, we used each of the text representations models listed in Section 3.1 as a feature extractor and coupled them with only a small linear classification head. We used an average from a final layer as a text representation. We will refer to this scenario Just Head - Linear. In the second scenario, we replaced a linear classifier with a BiLSTM classifier, still using the text representation model as a feature extractor. We fed BiLSTM layer with outputs from the last layer of the feature extractor (Just Head - BiLSTM). LASER and mUSE do not provide per-token embeddings and therefore, were not included in this scenario. Since most of our models are transformer-based, we decided to test them in a fine-tuning setup. This last scenario evaluated the fine-tuning of all transformer-based models (referred to as fine-tuning), with an exception made for mUSE-transformer because it was not possible to do with our implementation in PyTorch with Huggingface models.
For each scenario, we prepared 3 test metrics, which we refer to as a whole test, average by dataset and internal. Each of them separately measures model performance but all of them are based on a macro F1-score. The whole test is calculated on all samples from datasets described in 3.2 combined. It is meant to reflect the real-life performance of a model because our real-world applications often deal with an imbalance in languages distribution (with English being the most popular language used on the Internet). On average by dataset, we first calculate the macro F1-score on each dataset and then calculate the average of those scores. This is meant to show whether the model was not too over-fitted for the majority of languages or the biggest datasets. Finally, in the internal scenario, we assess them on our internal dataset (described in 3.2.2) to measure performance in our domain-specific examples.
3.4 Evaluation Procedure
To show how each model performs in a bird’s eye view, we prepared Nemenyi diagrams Nemenyi (1963) for all three experimental setups. Nemeneyi post-hoc statistical test finds groups of models that differ. It was used on the top of multiple comparisons Friedman test Demšar (2006). The Nemeneyi test makes a pair-wise comparison of all model’s ranks. We used alpha equal to 5%. The Nemeneyi test provides critical distance for compared groups that are not significantly different from each other.
3.5 Models Setup
For each scenario, we adjusted hyperparameters. The hidden size was set to LM’s embedding size for linear and fine-tuning and 32 for BiLSTM. By hidden size, we mean middle linear layer size, or in the case of BiLSTM - its hidden size parameter. BiLSTM uses a smaller hidden size because our experiments showed that it does not hurt performance but increases efficiency. The learning rate was initially the same for all scenarios, at the well-established value of 1e-3. We then modified it for each version by decreasing it for fine-tuning (to 1e-5) and slightly increasing it for BiLSTM based model (5e-3). The batch size was determined by our GPU’s memory size. We used 200 for linear and BiLSTM and 6 for fine-tuning. We used dropout in classification head - 0.5 for BiLSTM and 0.2 for other scenarios. We trained our models for 5 epochs in the fine-tuning scenario and 15 in two others, as those were the max number of epochs before the models started overfitting. We tested with the best F1-score on a validation dataset.
4 Results
We divided our results into three layers. Firstly, we show a general bird’s eye view of all models - it helps to spot the best and the worst models. Then, we provide detailed results for each model aggregated per dataset. Finally, to dig deeper into the model’s performance, we show numerical results for each model for each language.
|
XLM-R |
LaBSE |
MPNet |
XLM-R-dist |
mT5 |
mBERT |
DistilmBERT |
mUSE-dist |
LASER |
mUSE-trans. |
mUSE-cnn |
|
| Just Head - Linear | |||||||||||
| W | 62 | 62 | 63 | 60 | 59 | 56 | 55 | 59 | 55 | 55 | 54 |
| A | 51 | 54 | 55 | 51 | 49 | 45 | 43 | 50 | 47 | 47 | 45 |
| I | 55 | 61 | 61 | 56 | 50 | 43 | 38 | 60 | 50 | 49 | 50 |
| Just Head - BiLSTM | |||||||||||
| W | 66 | 62 | 63 | 62 | 65 | 60 | 59 | 62 | - | - | - |
| A | 57 | 55 | 56 | 54 | 56 | 49 | 48 | 54 | - | - | - |
| I | 64 | 63 | 64 | 63 | 63 | 54 | 48 | 64 | - | - | - |
| Fine-tuning | |||||||||||
| W | 68 | 68 | 67 | 67 | 66 | 65 | 64 | 63 | - | - | - |
| A | 61 | 62 | 62 | 62 | 60 | 56 | 56 | 56 | - | - | - |
| I | 70 | 69 | 65 | 67 | 67 | 57 | 58 | 60 | - | - | - |
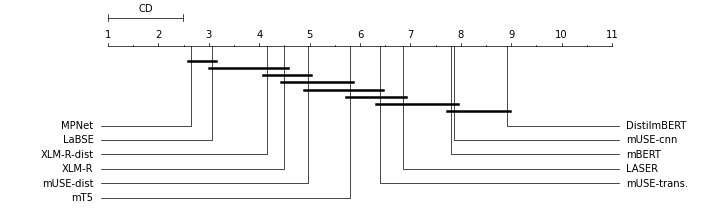
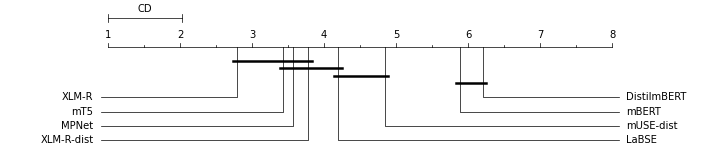
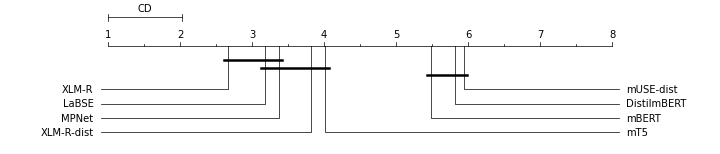
4.1 Bird’s Eye View
There is no significantly best embedding model in any of the tested scenarios based on the Nemenyi diagrams - Figure 1. However, we can see that the MPNet proved to be the best (for the linear scenario) and not significantly worse than the best - XLR-M model - in the other two scenarios. It is also worth mentioning that mBERT-based models (mBERT and DistillmBERT) proved to be the worst language models for our tasks.
4.2 Aggregated by Dataset
All models achieve better results with fine-tuning (up to 0.7 F1-score) than with extraction of vectors from text and then applying linear (up to 0.61) or BiLSTM (up to 0.64) layers, shows Table 4. The performance gains are higher when fine-tuning models pretrained on MLM and TLM tasks (like mBERT or XLM-R) compared to models, which were trained with sentence classification tasks, sentence similarity tasks or similar (like LaBSE). For example, mBERT had gains of 9, 11, and 14 percentage points (pp) on whole test, average by dataset and internal test cases, DistilmBERT - 9, 13 and 20pp, XLM-R - 6, 10, and 15pp. At the same time, LaBSE had only 6, 8, and 7pp and MPNet - 4, 7, 4pp. Still, those models achieve better overall performance. Fine-tuning reduces inequalities in the results between models (0.55 vs 0.43 for best and worst models in Just head - Linear setup, and 0.62 vs 0.56 after Fine-tuning for average by dataset metric). Those results were meant to show a general comparison between fine-tuned models against training just classification head.
The additional BiLSTM layer on top of transformer token embeddings improves the results of the model with only a linear layer in most cases. The differences are most clear in the case of the results for our internal dataset, where the result improved even by 13pp. (from 50% to 63%) for the mT5 model.
Those results show, that three models are the most promising choices: XLM-R, LaBSE and MPNet. They achieve comparable performance in all scenarios and test cases. Furthermore, they are better than other models in almost all test cases. XLM-R-dist was very close to those, but analysis with Nemenyi diagrams shows that it is slightly worse than those three.
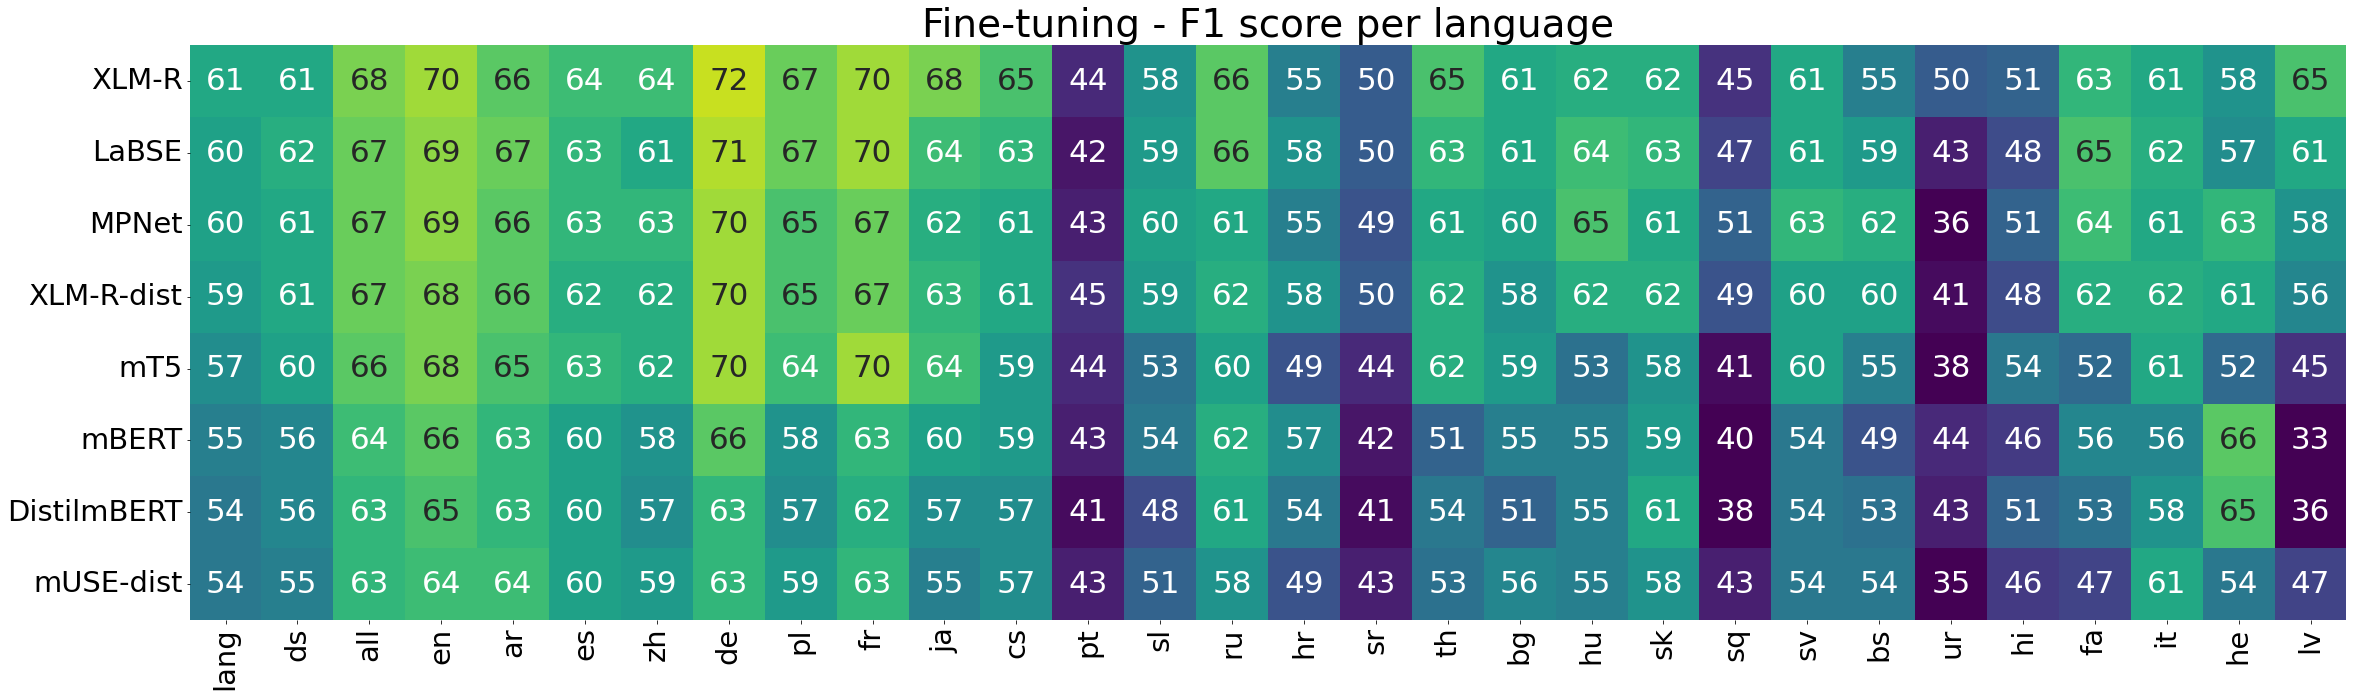
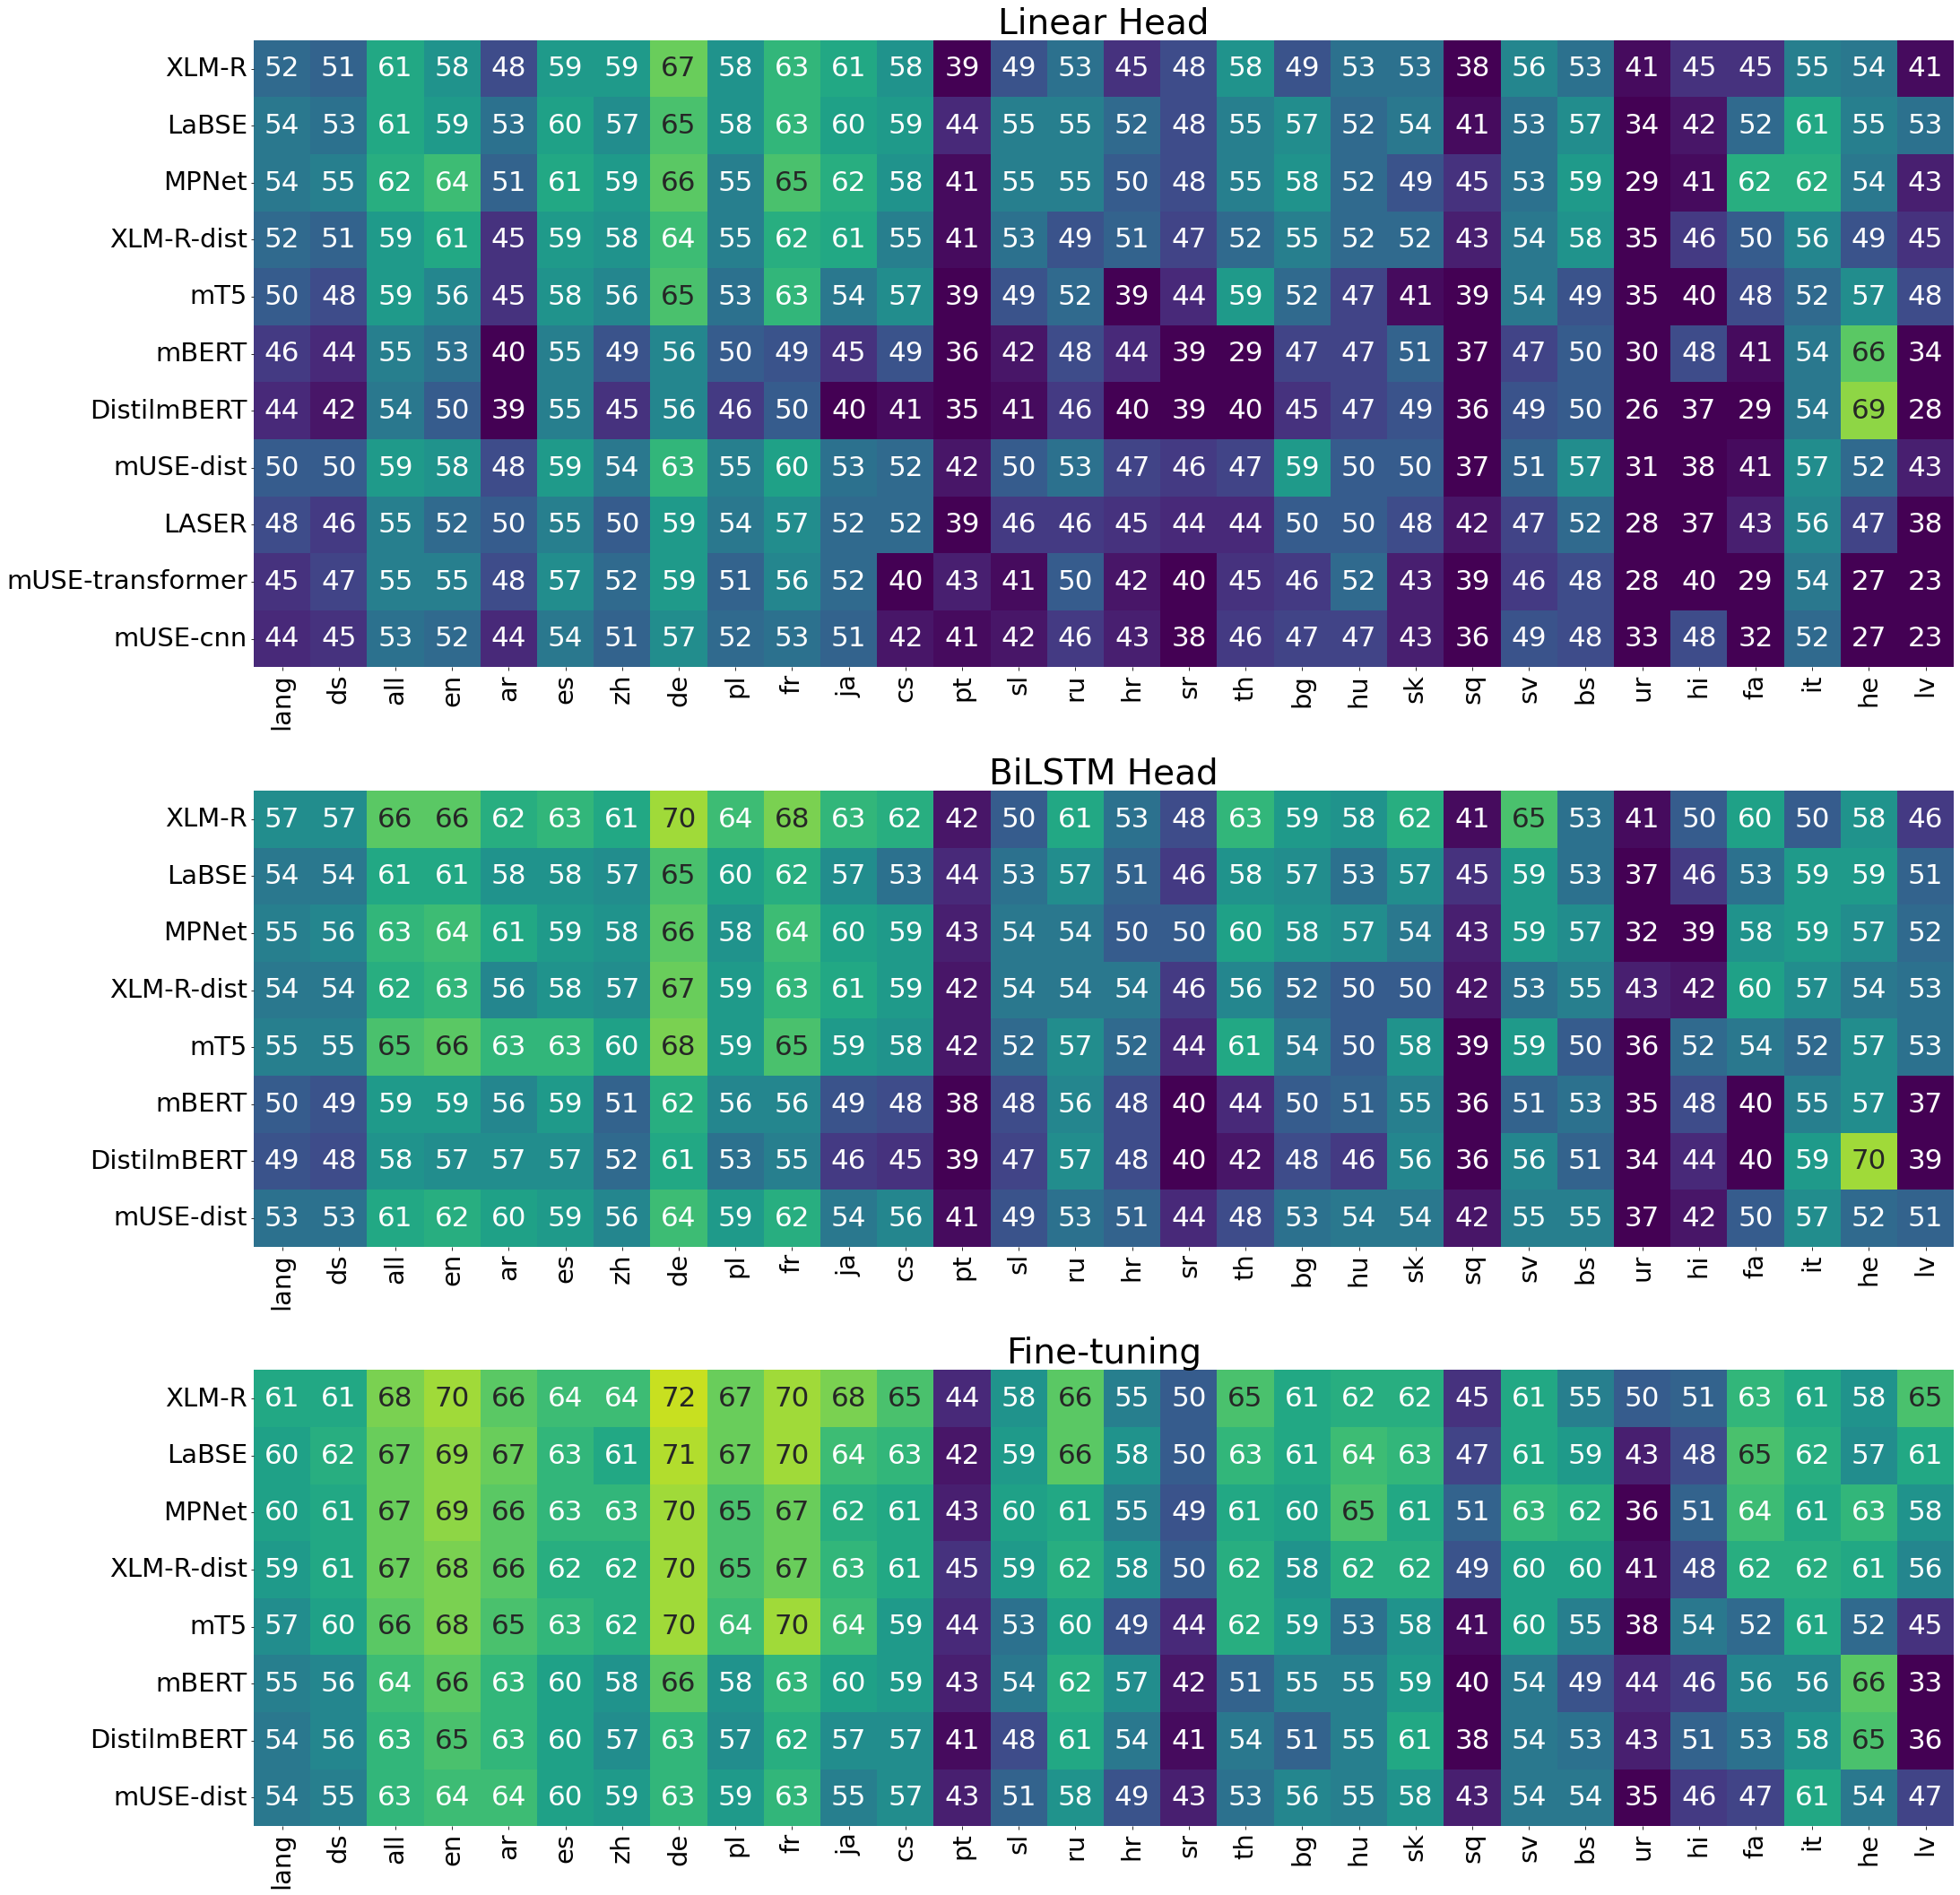
4.3 Every Model for Every Language
We assessed the performance of each model in each experimental scenario concerning the language. The texts were sub-sampled with stratification by language and class label so that language distribution in the test dataset reflects this in the whole dataset. It means that some languages are underrepresented. We also include the total Macro F1 score value in column "all". Results are presented in Figure 2 for fine-tuning scenario and in Figure 5 for others. Those results confirm conclusions from the previous section about the advantage of XLM-R, LaBSE and MPNet. They have the best performance in most languages and together with XLM-R-dist, there are no big differences between them.
5 Discussion
RQ1: Are we able to create a single multilingual sentiment classifier, performing equally well for each language?
When considering only the best models (XLM-R, LaBSE, MPNet) in the fine-tuning setup, we observed that they achieve best or close to best results in every language - Figure 5. In some languages, results are significantly worse than in others, but this is also true for other models evaluated as it may be caused by differences in the number of samples, quality, and difficulty of samples in those languages. Therefore, we can say that one model can work exceptionally well in all languages. On the other hand, statistical analysis which is presented in the form of Nemenyi diagrams in Figures 1(a), 1(b) and 1(c) showed that there is no statistical difference between top models in fine-tuning setup, so it is not possible to state which of those is the best one. We can rather state which group of models proved to be significantly better than others.
RQ2: Does fine-tuning of transformer-based models significantly improve sentiment classification results?
All models worked better when fine-tuned, but the performance gain varied from one to another. It was between 4 (mUSE-dist) and 9 (mBERT and DistilmBERT) pp. F1 on the benchmark test dataset, and between 0 (mUSE-dist) and 20 pp. (DistilmBERT) on our internal dataset. The 17, 15, and 14 pp. gain of mT5, XLM-R, and DistilmBERT on the internal dataset is also worth noting. In general, the most significant gain can be observed in models trained on language modelling only (MLM or TLM), such as XLM-R and mBERT.
RQ3: What is the relationship between model size and performance? Is bigger always better?
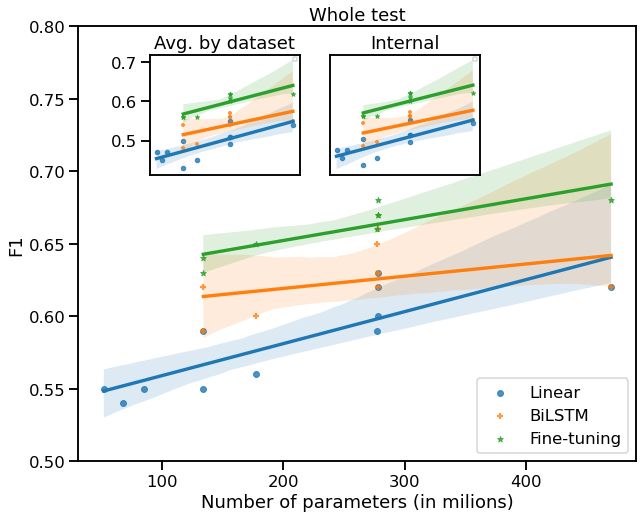
The results of our experiments showed that there exists a correlation between the classification result of the language model with its number of parameters. Figure 3 shows that, for all scenarios and test dataset types, bigger models achieve better performance in most cases. However, there are some counterexamples, e.g., mUSE-dist is smaller than mBERT but achieves better performance in Just head - Linear setup, for all dataset types. This indicates that the size of the model is an important factor in its performance, but other factors, like the domain and the type of pretraining task, may also affect the results. Moreover, we observed that this correlation is weaker after fine-tuning. We can often find the model with similar performance to the best one but significantly smaller and faster for the production environment.
Your Dataset Splits Matter
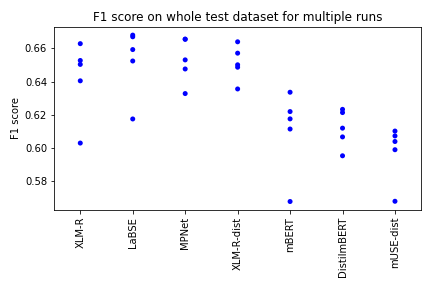
To determine which model works best, we repeated fine-tuning five times to remove a right/wrong random seed factor for each model and dataset subsampling. Due to computation resources limitations, we selected eight models available in Huggingface for fine-tuning. Interestingly, we can see that one of the samples looks like the outlier - Figure 4 for almost all the evaluated models. The F1-score for this sample is even 4 percentage points worse than other samples’ scores. We investigated this anomaly and spotted that it is always the same sample (the same seed for sample generation). As a reminder, since we collected a massive dataset and had limited computational resources, we sub-sampled texts for each of the five runs. Sub-samples between different models stay the same. It looks like the mentioned sample was more difficult than others or had distinctive characteristics. It is hard to tell why without in-depth analysis, hence we intend to conduct further research on the topic of data quality in sentiment analysis tasks using techniques like noise ratio Northcutt et al. (2021) or data cartography Swayamdipta et al. (2020). Here, we see an outstanding example of how vital the dataset’s preparation could be regarding split for train/dev/test sets.
6 Conclusions and Further Works
In this work we evaluated multilingual text representations for the task of sentiment classification by comparing multiple approaches, using different deep learning methods. In the process, we gathered the biggest collection of multi-lingual sentiment datasets - 80 datasets for 27 languages. We evaluated 11 models (language models and text vectorization techniques) in 3 different scenarios. We found out that it is possible to create one model which achieves the best or most competitive results in all languages in our collected dataset, but there is no statistical difference between top-performing models. We found out that there is a significant benefit from fine-tuning transformer-based language models and that a model size is correlated with performance.
While conducting experiments we identified further issues which we find worth addressing. Dataset quality assessment is in our opinion the most important one and we are planning to address it in further works. Meanwhile, we used datasets with a literature background and trust that they were carefully prepared and have decent quality annotations. We also found out that it is difficult to propose a coherent experiments methodology with such imbalance in languages and datasets sizes. Moreover, analyzing results is difficult, when one must address dimensions of datasets, languages, data sources, models, and experiments scenarios.
Finally, we found out that when sub-sampling a dataset for experiments, seeds play a significant role (see results in Figure 4). To analyze this phenomenon, we intend to launch further research and use noise ratio Northcutt et al. (2021) and data cartography Swayamdipta et al. (2020) to understand how this split differs from the others. This will be, in our opinion, a good start to a comprehensive analysis of datasets quality for the multi-lingual sentiment classification task which we intend to perform.
Acknowledgements
The work was partially supported by the Department of Artificial Intelligence at Wroclaw University of Science and Technology, and by European Regional Development Fund (ERDF) in RPO WD 2014-2020 (project no. RPDS.01.02.02-02-0065/20). We want to thank Mikołaj Morzy for an initial review and feedback. We want to thank our annotators team - Barbara Orłowska, Daria Szałamacha, Konrad Gajewski and Paweł Odrowąż-Sypniewski.
References
- Al Omari et al. (2019) Marwan Al Omari, Moustafa Al-Hajj, Nacereddine Hammami, and Amani Sabra. 2019. Sentiment classifier: Logistic regression for arabic services’ reviews in lebanon. In 2019 International Conference on Computer and Information Sciences (ICCIS), pages 1–5.
- Aly and Atiya (2013) Mohamed Aly and Amir Atiya. 2013. LABR: A large scale Arabic book reviews dataset. In Proceedings of the 51st Annual Meeting of the Association for Computational Linguistics (Volume 2: Short Papers), pages 494–498, Sofia, Bulgaria. Association for Computational Linguistics.
- Amram et al. (2018) Adam Amram, Anat Ben David, and Reut Tsarfaty. 2018. Representations and architectures in neural sentiment analysis for morphologically rich languages: A case study from Modern Hebrew. In Proceedings of the 27th International Conference on Computational Linguistics, pages 2242–2252, Santa Fe, New Mexico, USA. Association for Computational Linguistics.
- Artetxe and Schwenk (2019) Mikel Artetxe and Holger Schwenk. 2019. Massively Multilingual Sentence Embeddings for Zero-Shot Cross-Lingual Transfer and Beyond. Transactions of the Association for Computational Linguistics, 7:597–610.
- Attia et al. (2018) Mohammed Attia, Younes Samih, Ali Elkahky, and Laura Kallmeyer. 2018. Multilingual multi-class sentiment classification using convolutional neural networks. In Proceedings of the Eleventh International Conference on Language Resources and Evaluation (LREC 2018), Miyazaki, Japan. European Language Resources Association (ELRA).
- Baly et al. (2018) Ramy Baly, Alaa Khaddaj, Hazem M. Hajj, Wassim El-Hajj, and Khaled Bashir Shaban. 2018. ArSentD-LEV: A Multi-Topic Corpus for Target-based Sentiment Analysis in Arabic Levantine Tweets. In Proceedings of the Eleventh International Conference on Language Resources and Evaluation (LREC 2018), Paris, France. European Language Resources Association (ELRA).
- Barbieri et al. (2016) Francesco Barbieri, Valerio Basile, Danilo Croce, Malvina Nissim, Nicole Novielli, and Viviana Patti. 2016. Overview of the Evalita 2016 SENTIment POLarity Classification Task. In Proceedings of Third Italian Conference on Computational Linguistics (CLiC-it 2016) & Fifth Evaluation Campaign of Natural Language Processing and Speech Tools for Italian. Final Workshop (EVALITA 2016), Naples, Italy.
- Bastan et al. (2020) Mohaddeseh Bastan, Mahnaz Koupaee, Youngseo Son, Richard Sicoli, and Niranjan Balasubramanian. 2020. Author’s sentiment prediction. In Proceedings of the 28th International Conference on Computational Linguistics, pages 604–615, Barcelona, Spain (Online). International Committee on Computational Linguistics.
- Batanović et al. (2016) Vuk Batanović, Boško Nikolić, and Milan Milosavljević. 2016. Reliable baselines for sentiment analysis in resource-limited languages: The Serbian movie review dataset. In Proceedings of the Tenth International Conference on Language Resources and Evaluation (LREC’16), pages 2688–2696, Portorož, Slovenia. European Language Resources Association (ELRA).
- Batanović et al. (2020) Vuk Batanović, Miloš Cvetanović, and Boško Nikolić. 2020. A versatile framework for resource-limited sentiment articulation, annotation, and analysis of short texts. PLOS ONE, 15(11):1–30.
- Brum and Volpe Nunes (2018) Henrico Brum and Maria das Graças Volpe Nunes. 2018. Building a sentiment corpus of tweets in Brazilian Portuguese. In Proceedings of the Eleventh International Conference on Language Resources and Evaluation (LREC 2018), Miyazaki, Japan. European Language Resources Association (ELRA).
- Bučar et al. (2018) Jože Bučar, Martin Žnidaršič, and Janez Povh. 2018. Annotated news corpora and a lexicon for sentiment analysis in slovene. Language Resources and Evaluation, 52(3):895–919.
- Can et al. (2018) Ethem F. Can, Aysu Ezen-Can, and Fazli Can. 2018. Multilingual sentiment analysis: An RNN-based framework for limited data. Computing Research Repository, arXiv:1806.04511. Version 1.
- Chapuis et al. (2020) Emile Chapuis, Pierre Colombo, Matteo Manica, Matthieu Labeau, and Chloé Clavel. 2020. Hierarchical pre-training for sequence labelling in spoken dialog. In Findings of the Association for Computational Linguistics: EMNLP 2020, pages 2636–2648, Online. Association for Computational Linguistics.
- Cieliebak et al. (2017) Mark Cieliebak, Jan Milan Deriu, Dominic Egger, and Fatih Uzdilli. 2017. A Twitter corpus and benchmark resources for German sentiment analysis. In Proceedings of the Fifth International Workshop on Natural Language Processing for Social Media, pages 45–51, Valencia, Spain. Association for Computational Linguistics.
- Conneau et al. (2020) Alexis Conneau, Kartikay Khandelwal, Naman Goyal, Vishrav Chaudhary, Guillaume Wenzek, Francisco Guzmán, Edouard Grave, Myle Ott, Luke Zettlemoyer, and Veselin Stoyanov. 2020. Unsupervised cross-lingual representation learning at scale. In Proceedings of the 58th Annual Meeting of the Association for Computational Linguistics, pages 8440–8451, Online. Association for Computational Linguistics.
- Conneau and Lample (2019) Alexis Conneau and Guillaume Lample. 2019. Cross-lingual language model pretraining. In Proceedings of the 33rd International Conference on Neural Information Processing Systems, Red Hook, NY, USA. Curran Associates Inc.
- Conneau et al. (2018) Alexis Conneau, Ruty Rinott, Guillaume Lample, Adina Williams, Samuel Bowman, Holger Schwenk, and Veselin Stoyanov. 2018. XNLI: Evaluating cross-lingual sentence representations. In Proceedings of the 2018 Conference on Empirical Methods in Natural Language Processing, pages 2475–2485, Brussels, Belgium. Association for Computational Linguistics.
- Cruz et al. (2008) Fermin L Cruz, Jose A Troyano, Fernando Enriquez, and Javier Ortega. 2008. Experiments in sentiment classification of movie reviews in spanish. Procesamiento del Lenguaje Natural, 41:73–80.
- Dashtipour et al. (2016) Kia Dashtipour, Soujanya Poria, Amir Hussain, Erik Cambria, Ahmad YA Hawalah, Alexander Gelbukh, and Qiang Zhou. 2016. Multilingual sentiment analysis: state of the art and independent comparison of techniques. Cognitive computation, 8(4):757–771.
- Demšar (2006) Janez Demšar. 2006. Statistical comparisons of classifiers over multiple data sets. Journal of Machine Learning Research, 7:1–30.
- Devlin et al. (2019) Jacob Devlin, Ming-Wei Chang, Kenton Lee, and Kristina Toutanova. 2019. BERT: Pre-training of deep bidirectional transformers for language understanding. In Proceedings of the 2019 Conference of the North American Chapter of the Association for Computational Linguistics: Human Language Technologies, Volume 1 (Long and Short Papers), pages 4171–4186, Minneapolis, Minnesota. Association for Computational Linguistics.
- Elnagar and Einea (2016) Ashraf Elnagar and Omar Einea. 2016. BRAD 1.0: Book reviews in arabic dataset. In 2016 IEEE/ACS 13th International Conference of Computer Systems and Applications (AICCSA), pages 1–8.
- Elnagar et al. (2018) Ashraf Elnagar, Yasmin S. Khalifa, and Anas Einea. 2018. Hotel Arabic-Reviews Dataset Construction for Sentiment Analysis Applications. Springer International Publishing, Cham.
- Feng et al. (2020) Fangxiaoyu Feng, Yinfei Yang, Daniel Cer, Naveen Arivazhagan, and Wei Wang. 2020. Language-agnostic BERT Sentence Embedding. Computing Research Repository, arXiv:2007.01852. Version 2.
- Habernal et al. (2013) Ivan Habernal, Tomáš Ptáček, and Josef Steinberger. 2013. Sentiment analysis in Czech social media using supervised machine learning. In Proceedings of the 4th Workshop on Computational Approaches to Subjectivity, Sentiment and Social Media Analysis, pages 65–74, Atlanta, Georgia. Association for Computational Linguistics.
- Hosseini et al. (2018) Pedram Hosseini, Ali Ahmadian Ramaki, Hassan Maleki, Mansoureh Anvari, and Seyed Abolghasem Mirroshandel. 2018. SentiPers: A sentiment analysis corpus for persian. Computing Research Repository, arXiv:1801.07737. Version 2.
- Hu et al. (2020) Junjie Hu, Sebastian Ruder, Aditya Siddhant, Graham Neubig, Orhan Firat, and Melvin Johnson. 2020. XTREME: A massively multilingual multi-task benchmark for evaluating cross-lingual generalisation. In Proceedings of the 37th International Conference on Machine Learning, volume 119 of Proceedings of Machine Learning Research, pages 4411–4421. PMLR.
- Hutto and Gilbert (2014) Clayton J. Hutto and Eric Gilbert. 2014. VADER: A parsimonious rule-based model for sentiment analysis of social media text. In Proceedings of the International AAAI Conference on Web and Social Media, volume 8, pages 216–225.
- Inc. (2015) Crowdflower Inc. 2015. Twitter us airline sentiment.
- K et al. (2020) Karthikeyan K, Zihan Wang, Stephen Mayhew, and Dan Roth. 2020. Cross-lingual ability of multilingual bert: An empirical study. In International Conference on Learning Representations.
- Kanclerz et al. (2020) Kamil Kanclerz, Piotr Miłkowski, and Jan Kocoń. 2020. Cross-lingual deep neural transfer learning in sentiment analysis. Procedia Computer Science, 176:128–137. Knowledge-Based and Intelligent Information & Engineering Systems: Proceedings of the 24th International Conference KES2020.
- Keith Norambuena et al. (2019) Brian Keith Norambuena, Exequiel Lettura, and Claudio Villegas. 2019. Sentiment analysis and opinion mining applied to scientific paper reviews. Intelligent Data Analysis, 23:191–214.
- Keung et al. (2020) Phillip Keung, Yichao Lu, György Szarvas, and Noah A. Smith. 2020. The multilingual Amazon reviews corpus. In Proceedings of the 2020 Conference on Empirical Methods in Natural Language Processing (EMNLP), pages 4563–4568, Online. Association for Computational Linguistics.
- Kocoń et al. (2019) Jan Kocoń, Piotr Miłkowski, and Monika Zaśko-Zielińska. 2019. Multi-level sentiment analysis of PolEmo 2.0: Extended corpus of multi-domain consumer reviews. In Proceedings of the 23rd Conference on Computational Natural Language Learning (CoNLL), pages 980–991, Hong Kong, China. Association for Computational Linguistics.
- Lewis et al. (2020) Patrick Lewis, Barlas Oguz, Ruty Rinott, Sebastian Riedel, and Holger Schwenk. 2020. MLQA: Evaluating cross-lingual extractive question answering. In Proceedings of the 58th Annual Meeting of the Association for Computational Linguistics, pages 7315–7330, Online. Association for Computational Linguistics.
- Lin et al. (2015) Yiou Lin, Hang Lei, Jia Wu, and Xiaoyu Li. 2015. An empirical study on sentiment classification of Chinese review using word embedding. In Proceedings of the 29th Pacific Asia Conference on Language, Information and Computation: Posters, pages 258–266, Shanghai, China.
- Liu et al. (2020) Chi-Liang Liu, Tsung-Yuan Hsu, Yung-Sung Chuang, and Hung yi Lee. 2020. What makes multilingual bert multilingual? Computing Research Repository, arXiv:2010.10938. Version 1.
- Malo et al. (2014) Pekka Malo, Ankur Sinha, Pekka Korhonen, Jyrki Wallenius, and Pyry Takala. 2014. Good debt or bad debt: Detecting semantic orientations in economic texts. Journal of the Association for Information Science and Technology, 65(4):782–796.
- Mikolov et al. (2013a) Tomás Mikolov, Kai Chen, Greg Corrado, and Jeffrey Dean. 2013a. Efficient estimation of word representations in vector space. In 1st International Conference on Learning Representations, ICLR 2013, Scottsdale, Arizona, USA, May 2-4, 2013, Workshop Track Proceedings.
- Mikolov et al. (2013b) Tomas Mikolov, Quoc V. Le, and Ilya Sutskever. 2013b. Exploiting similarities among languages for machine translation. Computing Research Repository, arXiv:1309.4168. Version 1.
- Mozetič et al. (2016) Igor Mozetič, Miha Grčar, and Jasmina Smailović. 2016. Multilingual twitter sentiment classification: The role of human annotators. PLOS ONE, 11(5):1–26.
- Nabil et al. (2015) Mahmoud Nabil, Mohamed Aly, and Amir Atiya. 2015. ASTD: Arabic sentiment tweets dataset. In Proceedings of the 2015 Conference on Empirical Methods in Natural Language Processing, pages 2515–2519, Lisbon, Portugal. Association for Computational Linguistics.
- Narr et al. (2012) Sascha Narr, Michael Hülfenhaus, and Sahin Albayrak. 2012. Language-independent twitter sentiment analysis. In Workshop on Knowledge Discovery, Data Mining and Machine Learning (KDML-2012).
- Nemenyi (1963) Peter Nemenyi. 1963. Distribution-free Multiple Comparisons. Princeton University.
- Ni et al. (2019) Jianmo Ni, Jiacheng Li, and Julian McAuley. 2019. Justifying recommendations using distantly-labeled reviews and fine-grained aspects. In Proceedings of the 2019 Conference on Empirical Methods in Natural Language Processing and the 9th International Joint Conference on Natural Language Processing (EMNLP-IJCNLP), pages 188–197, Hong Kong, China. Association for Computational Linguistics.
- Northcutt et al. (2021) Curtis Northcutt, Lu Jiang, and Isaac Chuang. 2021. Confident learning: Estimating uncertainty in dataset labels. Journal of Artificial Intelligence Research, 70:1373–1411.
- Patwa et al. (2020) Parth Patwa, Gustavo Aguilar, Sudipta Kar, Suraj Pandey, Srinivas PYKL, Björn Gambäck, Tanmoy Chakraborty, Thamar Solorio, and Amitava Das. 2020. SemEval-2020 task 9: Overview of sentiment analysis of code-mixed tweets. In Proceedings of the Fourteenth Workshop on Semantic Evaluation, pages 774–790, Barcelona (online). International Committee for Computational Linguistics.
- Pelicon et al. (2020) Andraž Pelicon, Marko Pranjić, Dragana Miljković, Blaž Škrlj, and Senja Pollak. 2020. Zero-shot learning for cross-lingual news sentiment classification. Applied Sciences, 10(17).
- Reimers and Gurevych (2020) Nils Reimers and Iryna Gurevych. 2020. Making monolingual sentence embeddings multilingual using knowledge distillation. In Proceedings of the 2020 Conference on Empirical Methods in Natural Language Processing (EMNLP), pages 4512–4525, Online. Association for Computational Linguistics.
- Rogers et al. (2018) Anna Rogers, Alexey Romanov, Anna Rumshisky, Svitlana Volkova, Mikhail Gronas, and Alex Gribov. 2018. RuSentiment: An enriched sentiment analysis dataset for social media in Russian. In Proceedings of the 27th International Conference on Computational Linguistics, pages 755–763, Santa Fe, New Mexico, USA. Association for Computational Linguistics.
- Rosenthal et al. (2017) Sara Rosenthal, Noura Farra, and Preslav Nakov. 2017. SemEval-2017 task 4: Sentiment analysis in Twitter. In Proceedings of the 11th International Workshop on Semantic Evaluation (SemEval-2017), pages 502–518, Vancouver, Canada. Association for Computational Linguistics.
- Ruder et al. (2019) Sebastian Ruder, Ivan Vulić, and Anders Søgaard. 2019. A survey of cross-lingual word embedding models. Journal of Artificial Intelligence Research, 65:569–631.
- Rybak et al. (2020) Piotr Rybak, Robert Mroczkowski, Janusz Tracz, and Ireneusz Gawlik. 2020. KLEJ: Comprehensive benchmark for Polish language understanding. In Proceedings of the 58th Annual Meeting of the Association for Computational Linguistics, pages 1191–1201, Online. Association for Computational Linguistics.
- Sagnika et al. (2020) Santwana Sagnika, Anshuman Pattanaik, Bhabani Shankar Prasad Mishra, and Saroj K Meher. 2020. A review on multi-lingual sentiment analysis by machine learning methods. Journal of Engineering Science & Technology Review, 13(2):154–166.
- Salameh et al. (2015) Mohammad Salameh, Saif Mohammad, and Svetlana Kiritchenko. 2015. Sentiment after translation: A case-study on Arabic social media posts. In Proceedings of the 2015 Conference of the North American Chapter of the Association for Computational Linguistics: Human Language Technologies, pages 767–777, Denver, Colorado. Association for Computational Linguistics.
- Sanders (2011) Niek J Sanders. 2011. Sanders-Twitter Sentiment Corpus. Sanders Analytics LLC.
- Sanh et al. (2020) Victor Sanh, Lysandre Debut, Julien Chaumond, and Thomas Wolf. 2020. DistilBERT, a distilled version of BERT: smaller, faster, cheaper and lighter. Computing Research Repository, arXiv:1910.01108. Version 4.
- Schabus and Skowron (2018) Dietmar Schabus and Marcin Skowron. 2018. Academic-industrial perspective on the development and deployment of a moderation system for a newspaper website. In Proceedings of the Eleventh International Conference on Language Resources and Evaluation (LREC 2018), Miyazaki, Japan. European Language Resources Association (ELRA).
- Sharf and Rahman (2018) Zareen Sharf and Saif Ur Rahman. 2018. Performing natural language processing on roman urdu datasets. In International Journal of Computer Science and Network Security, volume 18, pages 141–148.
- Sheng and Uthus (2020) Emily Sheng and David Uthus. 2020. Investigating societal biases in a poetry composition system. In Proceedings of the Second Workshop on Gender Bias in Natural Language Processing, pages 93–106, Barcelona, Spain (Online). Association for Computational Linguistics.
- Sobkowicz and Sobkowicz (2012) Pawel Sobkowicz and Antoni Sobkowicz. 2012. Two-year study of emotion and communication patterns in a highly polarized political discussion forum. Social Science Computer Review, 30(4):448–469.
- Sprogis and Rikters (2020) Uga Sprogis and Matiss Rikters. 2020. What can we learn from almost a decade of food tweets. Computing Research Repository, arXiv:2007.05194. Version 2.
- Sprugnoli (2020) Rachele Sprugnoli. 2020. Multiemotions-it: a new dataset for opinion polarity and emotion analysis for italian. In Proceedings of the Seventh Italian Conference on Computational Linguistics.
- Suriyawongkul et al. (2019) Arthit Suriyawongkul, Ekapol Chuangsuwanich, Pattarawat Chormai, and Charin Polpanumas. 2019. Pythainlp/wisesight-sentiment: First release (v1.0). Zenodo.
- Swayamdipta et al. (2020) Swabha Swayamdipta, Roy Schwartz, Nicholas Lourie, Yizhong Wang, Hannaneh Hajishirzi, Noah A. Smith, and Yejin Choi. 2020. Dataset cartography: Mapping and diagnosing datasets with training dynamics. In Proceedings of the 2020 Conference on Empirical Methods in Natural Language Processing (EMNLP), pages 9275–9293, Online. Association for Computational Linguistics.
- Thelwall et al. (2012) Mike Thelwall, Kevan Buckley, and Georgios Paltoglou. 2012. Sentiment strength detection for the social web. J. Am. Soc. Inf. Sci. Technol., 63(1):163–173.
- Thongthanomkul et al. (2019) Ekkalak Thongthanomkul, Tanapol Nearunchorn, and Yuwat Chuesathuchon. 2019. wongnai-corpus. https://github.com/wongnai/wongnai-corpus.
- Tjong Kim Sang (2002) Erik F. Tjong Kim Sang. 2002. Introduction to the CoNLL-2002 shared task: Language-independent named entity recognition. In COLING-02: The 6th Conference on Natural Language Learning 2002 (CoNLL-2002).
- Tjong Kim Sang and De Meulder (2003) Erik F. Tjong Kim Sang and Fien De Meulder. 2003. Introduction to the CoNLL-2003 shared task: Language-independent named entity recognition. In Proceedings of the Seventh Conference on Natural Language Learning at HLT-NAACL 2003, pages 142–147.
- Wehrmann et al. (2017) Joonatas Wehrmann, Willian Becker, Henry E. L. Cagnini, and Rodrigo C. Barros. 2017. A character-based convolutional neural network for language-agnostic twitter sentiment analysis. In 2017 International Joint Conference on Neural Networks (IJCNN), pages 2384–2391.
- Wu and Dredze (2020) Shijie Wu and Mark Dredze. 2020. Are all languages created equal in multilingual BERT? In Proceedings of the 5th Workshop on Representation Learning for NLP, pages 120–130, Online. Association for Computational Linguistics.
- Xue et al. (2021) Linting Xue, Noah Constant, Adam Roberts, Mihir Kale, Rami Al-Rfou, Aditya Siddhant, Aditya Barua, and Colin Raffel. 2021. mT5: A massively multilingual pre-trained text-to-text transformer. In Proceedings of the 2021 Conference of the North American Chapter of the Association for Computational Linguistics: Human Language Technologies, pages 483–498, Online. Association for Computational Linguistics.
- Yang et al. (2020) Yinfei Yang, Daniel Cer, Amin Ahmad, Mandy Guo, Jax Law, Noah Constant, Gustavo Hernandez Abrego, Steve Yuan, Chris Tar, Yun-hsuan Sung, Brian Strope, and Ray Kurzweil. 2020. Multilingual universal sentence encoder for semantic retrieval. In Proceedings of the 58th Annual Meeting of the Association for Computational Linguistics: System Demonstrations, pages 87–94, Online. Association for Computational Linguistics.
- Yang et al. (2019) Yinfei Yang, Gustavo Hernandez Abrego, Steve Yuan, Mandy Guo, Qinlan Shen, Daniel Cer, Yun-hsuan Sung, Brian Strope, and Ray Kurzweil. 2019. Improving multilingual sentence embedding using bi-directional dual encoder with additive margin softmax. In Proceedings of the Twenty-Eighth International Joint Conference on Artificial Intelligence, IJCAI-19, pages 5370–5378. International Joint Conferences on Artificial Intelligence Organization.
- Ziemski et al. (2016) Michał Ziemski, Marcin Junczys-Dowmunt, and Bruno Pouliquen. 2016. The United Nations parallel corpus v1.0. In Proceedings of the Tenth International Conference on Language Resources and Evaluation (LREC’16), pages 3530–3534, Portorož, Slovenia. European Language Resources Association (ELRA).
- Zweigenbaum et al. (2017) Pierre Zweigenbaum, Serge Sharoff, and Reinhard Rapp. 2017. Overview of the second BUCC shared task: Spotting parallel sentences in comparable corpora. In Proceedings of the 10th Workshop on Building and Using Comparable Corpora, pages 60–67, Vancouver, Canada. Association for Computational Linguistics.
Appendix A Appendices
A.1 Hardware and Software
We performed our experiments using Python 3.9 and PyTorch (1.8.1) (and Tensorflow (2.3.0) for original mUSE). Our experimental setup consists of Intel(R) Xeon(R) CPU E5-2630 v4 @ 2.20GHz and Nvidia Tesla V100 16GB.
A.2 Detailed Datasets Information
A.3 Full Results for Languages
We include full results of our experiments with results for each language in Figure 5. Part with finetuning results was presented earlier in Figure 2.
| Paper | Lang | Cat. | HL | Samples | NEG/NEU/POS | #Words | #Char. |
|---|---|---|---|---|---|---|---|
| Al Omari et al. (2019) | ar | R | No | 3096 | 13.0/10.2/76.8 | 9 | 51 |
| Elnagar et al. (2018) | ar | R | No | 400101 | 13.0/19.9/67.1 | 22 | 127 |
| Aly and Atiya (2013) | ar | R | No | 6250 | 11.6/17.9/70.5 | 65 | 343 |
| Elnagar and Einea (2016) | ar | R | No | 504007 | 15.4/21.0/63.6 | 77 | 424 |
| Baly et al. (2018) | ar | SM | Yes | 2809 | 47.2/23.9/29.0 | 22 | 130 |
| Nabil et al. (2015) | ar | SM | Yes | 3224 | 50.9/25.0/24.1 | 16 | 94 |
| Salameh et al. (2015) | ar | SM | Yes | 1199 | 48.0/10.5/41.5 | 11 | 51 |
| Salameh et al. (2015) | ar | SM | Yes | 1998 | 67.5/10.1/22.4 | 20 | 107 |
| Habernal et al. (2013) | cs | R | No | 91140 | 32.4/33.7/33.9 | 50 | 311 |
| Habernal et al. (2013) | cs | R | No | 92758 | 7.9/23.4/68.7 | 20 | 131 |
| Habernal et al. (2013) | cs | SM | Yes | 9752 | 20.4/53.1/26.5 | 10 | 59 |
| Habernal et al. (2013) | cs | SM | Yes | 2637 | 30.8/60.6/8.6 | 33 | 170 |
| Cieliebak et al. (2017) | de | SM | Yes | 9948 | 16.3/59.2/24.6 | 11 | 86 |
| Schabus and Skowron (2018) | de | SM | Yes | 3598 | 47.3/51.5/1.2 | 33 | 237 |
| Chapuis et al. (2020) | en | C | Yes | 12138 | 31.8/46.5/21.7 | 12 | 48 |
| Chapuis et al. (2020) | en | C | Yes | 4643 | 22.3/48.9/28.8 | 15 | 71 |
| Malo et al. (2014) | en | N | Yes | 3448 | 12.2/62.1/25.7 | 22 | 124 |
| Bastan et al. (2020) | en | N | Yes | 5333 | 11.6/37.3/51.0 | 388 | 2129 |
| Hutto and Gilbert (2014) | en | N | No | 5190 | 29.3/52.9/17.8 | 17 | 104 |
| Sheng and Uthus (2020) | en | P | Yes | 1052 | 18.3/15.8/65.9 | 7 | 37 |
| Hutto and Gilbert (2014) | en | R | No | 3708 | 34.2/19.5/46.3 | 16 | 87 |
| Hutto and Gilbert (2014) | en | R | No | 10605 | 49.6/1.5/48.9 | 19 | 111 |
| Ni et al. (2019) | en | R | No | 1883238 | 8.3/8.0/83.7 | 70 | 382 |
| Sanders (2011) | en | SM | Yes | 3424 | 16.7/68.1/15.2 | 14 | 97 |
| Thelwall et al. (2012) | en | SM | Yes | 11759 | 28.0/34.0/38.0 | 26 | 147 |
| Inc. (2015) | en | SM | Yes | 14427 | 63.0/21.2/15.8 | 17 | 104 |
| Hutto and Gilbert (2014) | en | SM | No | 4200 | 26.9/17.0/56.1 | 13 | 79 |
| Keith Norambuena et al. (2019) | es | M | No | 163 | 33.7/33.7/32.5 | 135 | 835 |
| Keith Norambuena et al. (2019) | es | R | Yes | 399 | 44.4/27.8/27.8 | 167 | 1020 |
| Cruz et al. (2008) | es | R | No | 3871 | 32.9/32.3/34.9 | 511 | 3000 |
| Hosseini et al. (2018) | fa | R | Yes | 13525 | 12.0/37.5/50.5 | 21 | 104 |
| Amram et al. (2018) | he | SM | Yes | 8619 | 26.5/2.8/70.8 | 22 | 110 |
| Pelicon et al. (2020) | hr | N | Yes | 2025 | 22.5/61.4/16.0 | 161 | 1021 |
| Barbieri et al. (2016) | it | SM | Yes | 8926 | 36.7/41.7/21.6 | 14 | 101 |
| Sprugnoli (2020) | it | SM | Yes | 3139 | 24.4/14.9/60.6 | 17 | 106 |
| Sprogis and Rikters (2020) | lv | SM | Yes | 5790 | 23.8/45.2/31.0 | 20 | 138 |
| Rybak et al. (2020) | pl | R | No | 10074 | 30.8/13.2/56.0 | 80 | 494 |
| Kocoń et al. (2019) | pl | R | Yes | 57038 | 42.4/26.8/30.8 | 30 | 175 |
| Sobkowicz and Sobkowicz (2012) | pl | SM | Yes | 645 | 50.7/47.3/2.0 | 33 | 230 |
| Brum and Volpe Nunes (2018) | pt | SM | Yes | 10109 | 28.8/25.1/46.1 | 12 | 74 |
| Rogers et al. (2018) | ru | SM | Yes | 23226 | 16.8/54.6/28.6 | 12 | 79 |
| Bučar et al. (2018) | sl | N | Yes | 10417 | 32.0/52.0/16.0 | 309 | 2017 |
| Batanović et al. (2016) | sr | R | No | 4724 | 17.8/43.7/38.5 | 498 | 3097 |
| Batanović et al. (2020) | sr | R | Yes | 3948 | 30.3/18.1/51.5 | 18 | 105 |
| Thongthanomkul et al. (2019) | th | R | No | 46193 | 5.4/30.5/64.1 | 29 | 544 |
| Suriyawongkul et al. (2019) | th | SM | Yes | 26126 | 26.1/55.6/18.3 | 6 | 90 |
| Sharf and Rahman (2018) | ur | M | Yes | 19660 | 26.7/43.6/29.7 | 13 | 69 |
| Lin et al. (2015) | zh | R | No | 125725 | 28.6/21.9/49.5 | 51 | 128 |
| Paper | Cat. | Lang | HL | Samples | (NEG/NEU/POS) | #Words | #Char. |
|---|---|---|---|---|---|---|---|
| Narr et al. (2012) | SM | de | Yes | 953 | 10.0/75.1/14.9 | 12 | 80 |
| de | Yes | 1781 | 16.9/63.3/19.8 | 13 | 81 | ||
| en | Yes | 7073 | 17.4/60.0/22.6 | 14 | 78 | ||
| fr | Yes | 685 | 23.4/53.4/23.2 | 14 | 82 | ||
| fr | Yes | 1786 | 25.0/54.3/20.8 | 15 | 83 | ||
| pt | Yes | 759 | 28.1/33.2/38.7 | 14 | 78 | ||
| pt | Yes | 1769 | 30.7/33.9/35.4 | 14 | 78 | ||
| Keung et al. (2020) | R | de | No | 209073 | 40.1/20.0/39.9 | 33 | 208 |
| en | No | 209393 | 40.0/20.0/40.0 | 34 | 179 | ||
| es | No | 208127 | 40.2/20.0/39.8 | 27 | 152 | ||
| fr | No | 208160 | 40.2/20.1/39.7 | 28 | 160 | ||
| ja | No | 209780 | 40.0/20.0/40.0 | 2 | 101 | ||
| zh | No | 205977 | 39.8/20.1/40.1 | 1 | 50 | ||
| Rosenthal et al. (2017) | M | ar | Yes | 9391 | 35.5/40.6/23.9 | 14 | 105 |
| en | Yes | 65071 | 19.1/45.7/35.2 | 18 | 111 | ||
| Patwa et al. (2020) | SM | es | Yes | 14920 | 16.8/33.1/50.0 | 16 | 86 |
| hi | Yes | 16999 | 29.4/37.6/33.0 | 27 | 128 | ||
| Mozetič et al. (2016) | SM | bg | Yes | 62150 | 22.6/45.9/31.5 | 12 | 85 |
| bs | Yes | 36183 | 33.4/30.5/36.1 | 12 | 75 | ||
| de | Yes | 90534 | 19.7/52.8/27.4 | 12 | 94 | ||
| en | Yes | 85784 | 26.8/44.1/29.1 | 12 | 77 | ||
| es | Yes | 191412 | 11.8/37.9/50.3 | 14 | 92 | ||
| hr | Yes | 75569 | 25.7/23.9/50.4 | 12 | 91 | ||
| hu | Yes | 56682 | 15.9/31.0/53.1 | 11 | 83 | ||
| pl | Yes | 168931 | 30.0/26.1/43.9 | 11 | 82 | ||
| pt | Yes | 145197 | 37.2/35.0/27.8 | 10 | 61 | ||
| ru | Yes | 87704 | 32.0/40.1/27.8 | 10 | 67 | ||
| sk | Yes | 56623 | 25.6/22.5/51.9 | 13 | 97 | ||
| sl | Yes | 103126 | 29.9/43.3/26.8 | 13 | 91 | ||
| sq | Yes | 44284 | 15.7/33.1/51.1 | 13 | 90 | ||
| sr | Yes | 67696 | 34.8/42.8/22.4 | 13 | 81 | ||
| sv | Yes | 41346 | 40.3/31.2/28.5 | 14 | 94 |