Extending the Scope of Out-of-Domain: Examining QA models in multiple subdomains
Abstract
Past works that investigate out-of-domain performance of QA systems have mainly focused on general domains (e.g. news domain, wikipedia domain), underestimating the importance of subdomains defined by the internal characteristics of QA datasets. In this paper, we extend the scope of “out-of-domain” by splitting QA examples into different subdomains according to their several internal characteristics including question type, text length, answer position. We then examine the performance of QA systems trained on the data from different subdomains. Experimental results show that the performance of QA systems can be significantly reduced when the train data and test data come from different subdomains. These results question the generalizability of current QA systems in multiple subdomains, suggesting the need to combat the bias introduced by the internal characteristics of QA datasets.
1 Introduction
Examining the out-of-domain performance of QA systems is an important focus of the research community due to its direct connection to the generalizability and robustness of QA systems especially in production environments Jia and Liang (2017); Chen et al. (2017); Talmor and Berant (2019); Fisch et al. (2019); Shakeri et al. (2020); Lyu et al. (2021), Even though previous studies mostly focus on coarse-grained general domains Ruder and Sil (2021), the importance of finer-grained subdomains defined by the internal characteristics of QA datasets cannot be neglected. For example, several studies exploring specific internal characteristics of QA datasets have been carried out, including Ko et al. (2020), who reveal that the sentence-level answer position is a source of bias for QA models, and Sen and Saffari (2020) who investigate the effect of word-level question-context overlap.
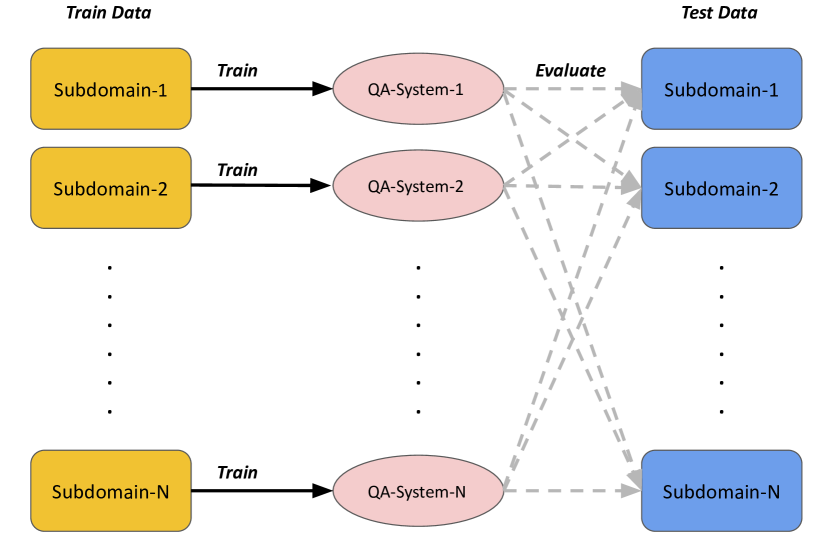
Building on this prior work as well as the definition and discussion of subdomain in Plank and Sima’an (2008); Plank (2016); Varis and Bojar (2021), we extend the scope of out-of-domain with a view to assessing the generalizability and robustness of QA systems by investigating their out-of-subdomain performance. As shown in Figure 1, we split the QA dataset into different subdomains based on its internal characteristics. Then we use the QA examples in each subdomain to train corresponding QA systems and evaluate their performance on all subdomains.
We focus on extractive QA (EQA) as it is not only an important task in itself Zhang et al. (2020) but also the crucial reader component in the retriever-reader model for Open-domain QA Chen et al. (2017); Chen and Yih (2020). In experiments with SQuAD 1.1 Rajpurkar et al. (2016) and NewsQA Trischler et al. (2017), we split the data into subdomains based on question type, text length (context, question and answer) and answer position. We then train QA systems on each subdomain and examine their performance on each subdomain. Results show that QA systems tend to perform worse when train and test data come from different subdomains, particularly those defined by question type, answer length and answer position.
2 Experiments
We employ the QA datasets SQuAD1.1 Rajpurkar et al. (2016) and NewsQA Trischler et al. (2017). For SQuAD1.1 we use the official dataset released by Rajpurkar et al. (2016) and for NewsQA we use the data from MRQA Fisch et al. (2019). For question classification, we use the dataset from Li and Roth (2002). We use the BERT-base-uncased model from Huggingface Wolf et al. (2019) for both question classification and QA.
We adopt the following setup for training and evaluation: We split the original training set into several disjoint subdomains ; Then we sample subsets from each subdomain using sample sizes in ascending order. The resulting subsets are denoted . We train QA systems on each subset . The QA system trained on is denoted . We evaluate each QA system on the test data which is also split into disjoint subdomains similar to the training data .
2.1 Question Type
| LOC | ENTY | HUM | NUM | DESC | ||
|---|---|---|---|---|---|---|
| SQuAD1.1 | Train set | 11.4 | 27.6 | 20.7 | 24.5 | 15.5 |
| Dev set | 10.5 | 27.6 | 21.0 | 23.0 | 17.4 | |
| NewsQA | Train set | 11.4 | 16.9 | 30.0 | 18.8 | 22.6 |
| Dev set | 12.3 | 16.9 | 32.2 | 17.8 | 20.5 |
In this experiment, we investigate how QA models learn from QA examples with different question types. We adopt question classification data (Li and Roth, 2002) to train a question classifier that categorizes questions into the following five classes: HUM, LOC, ENTY, DESC, NUM 111Definitions and examples provided in the Appendix.(Zhang and Lee, 2003). The QA examples in the training data are then partitioned into five categories according to their question type. Question type proportions for SQuAD1.1 and NewsQA are shown in Table 1, with a high proportion of ENTY and NUM questions in SQuAD1.1, while NewsQA has more HUM and DESC questions. We use QA examples of each question type to train a QA system increasing the training set size in intervals of 500 from 500 to 8000. We evaluate it on the test data, which is also divided into five categories according to question type.
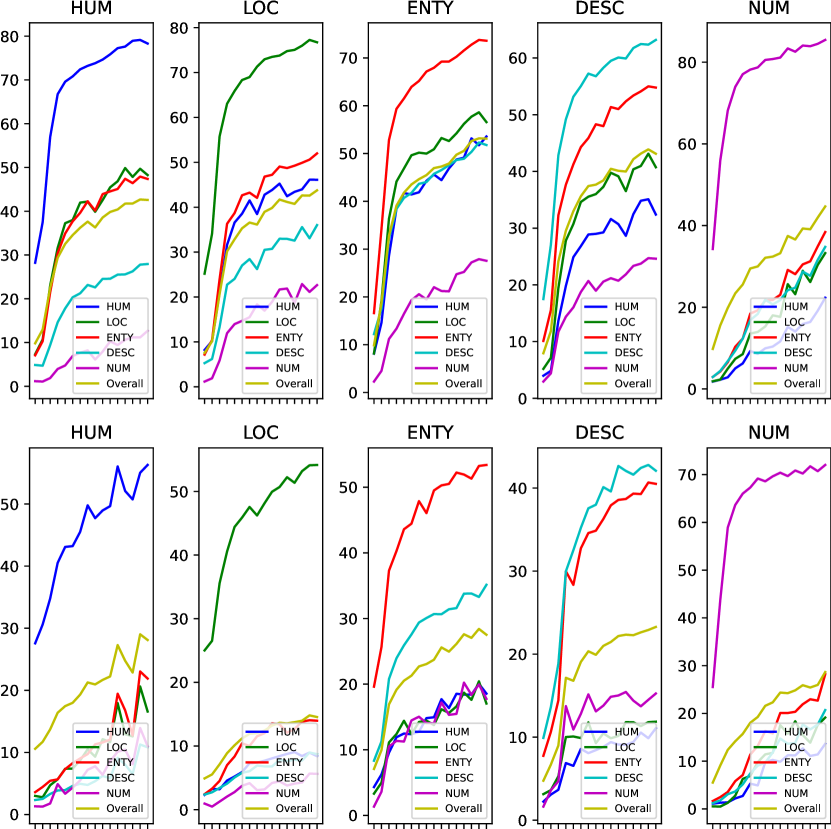
A visualisation of the resulting F-1 scores of the QA systems trained on each question type subdomain is shown in Figure 2, for both SQuAD1.1 and NewsQA. The x-axis represents the training set size, the y-axis is the F-1 score. The results show that a QA system learns to answer a certain type of question mainly from the examples of the same question type – this is particularly true for HUM and NUM questions in SQuAD1.1 and HUM, LOC and NUM questions in NewsQA. Taking NUM questions as an example, the rightmost plots in Figure 2 show that performance on other question types only results in a minor improvement as the training set size increases compared to performance improvements on that question type (NUM). In other words, the QA system gets most of the knowledge it needs to answer NUM questions from the NUM training examples and a similar pattern is also present for other question types. The results in Figure 2 show that the subdomains defined by question type is a source of bias when training and employing QA systems. We suspect that word use and narrative style varies over question types, which inject bias into QA systems when learning from QA examples with different question types. Therefore, we need to improve the diversity of question types when constructing and organising QA data.
2.2 Text Length
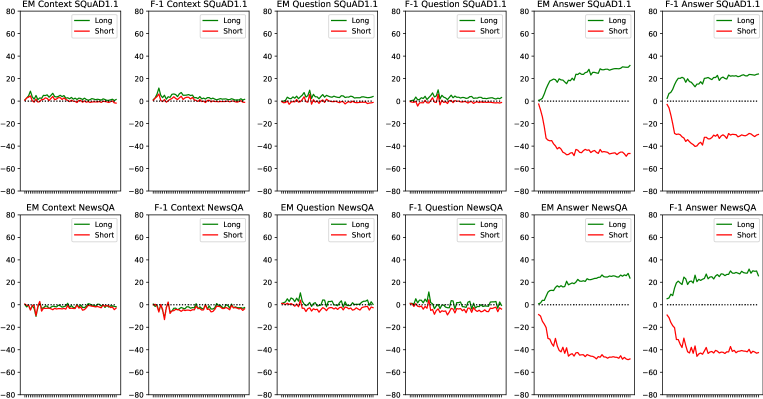
The effect of text length to the performance and generalizability of neural models has been discussed in text classification and machine translation Amplayo et al. (2019); Varis and Bojar (2021). As for QA, there are three components in a QA example: context, question, answer. The length of each component could potentially introduce additional bias and affect how QA systems learn from QA data. For example, a short context could be easy since a shorter context could reduce the search space for QA models to locate the answer; on the other hand, a short context could be hard as shorter context contains less information to find the answer. Therefore, the following question arises naturally: are short and long context/question/answer are equivalent?
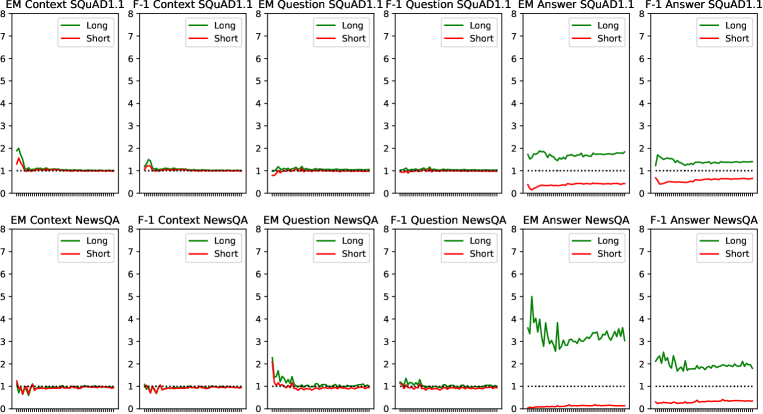
To answer this question, we split the QA datasets into short and long groups according to the median of the length of context, question, answer 222See more statistics in the Appendix.. Then we train QA systems on the QA examples sampled from short () and long () groups respectively, again increasing the training set size in intervals of 500 from 500 to 25000. The results are shown in Figure 3, where the x-axis is the data size and the y-axis is the ratio of the performance (EM and F-1 score) of the and corresponding systems on the text length subdomains of context, question, answer. If and have no obvious difference in terms of performance on long and short groups respectively, the ratio of their performance should be close to . The results show that the performances of and trained on the subdomains of context and question length have no obvious difference as all the three curves converge to , although there are fluctuations when the sample sizes are small. In contrast, and trained on the subdomains of answer length behave differently – see the subplots in the two rightmost columns of Figure 3. performs much better than on the test examples with long answers and performs much worse than on the test examples with short answers. The results in Figure 3 show that the length of answer introduces strong bias to QA systems. We think this stems from the fact that tends to predict longer answers, whereas tends to predict shorter answers, and they thus underperform in the counterpart subdomain. We show the average length of the predicted answers of QA systems trained on long and short groups in Table 2. Therefore, it is important to control the length distribution of answers when constructing and organising QA dataset especially using NER tools in the answer extraction phase since they tend to find shorter answers.
| Context | Question | Answer | |||||||
|---|---|---|---|---|---|---|---|---|---|
| Long | Short | Long | Short | Long | Short | ||||
| SQuAD1.1 | 4.03 | 4.13 | 4.00 | 4.23 | 6.41 | 2.78 | |||
| NewsQA | 5.46 | 5.33 | 5.16 | 5.87 | 9.57 | 3.51 | |||
2.3 Answer Position
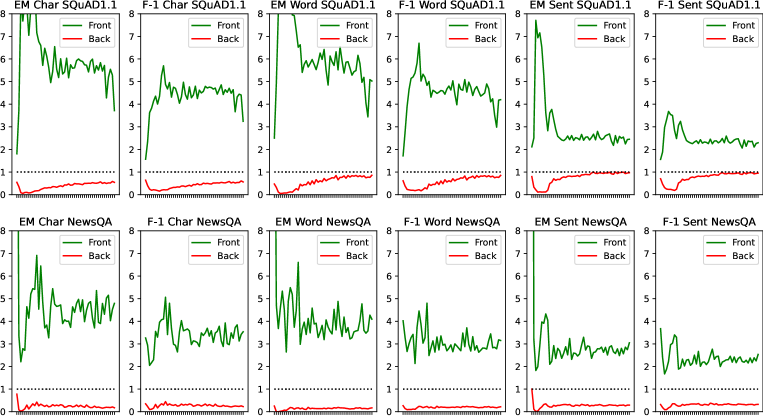
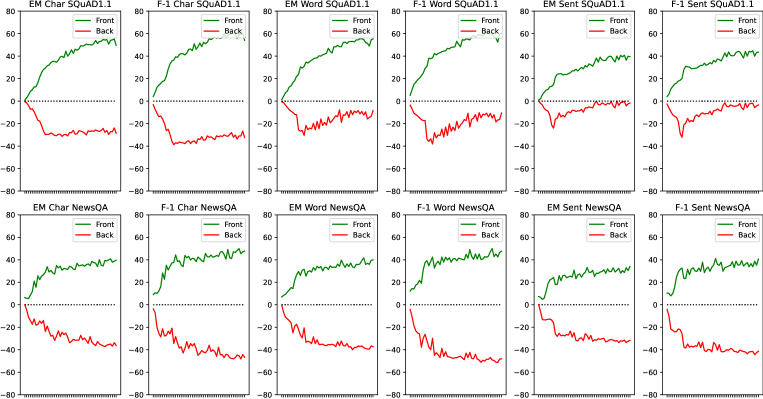
Ko et al. (2020) study the effect of sentence-level answer position. Building on their analysis, we study the effect of two more types of answer position: character-level position and word-level position. We split the training set into front and back groups based on the median of the answer start positions at the character, word and sentence level 333See more statistics in the Appendix.. Then we train QA systems on the examples sampled from front () and back () groups respectively , increasing the training set size in intervals of 500 from 500 to 25000. We show the results in Figure 4, where the x-axis is the training set size and the y-axis is the ratio of the performance (EM and F-1 score) of and on the answer position subdomains at the character, word and sentence level.
The results show that answer position on all three levels are a source of bias. performs much better than on test instances with answer positions in the front, whereas performs much better than on test instances with answer positions at the back. The effect of bias is more serious at the character and word level. We think this answer position bias is happening because words in different positions have different position embeddings, which could also affect word semantics in transformer architectures Vaswani et al. (2017); Wang et al. (2020). This suggests the need to make sure answer position distribution is balanced as well as the need to develop QA systems that are more robust to answer position variation.
3 Discussion and Conclusion
We presented a series of experiments investigating the out-of-subdomain performance of QA systems on two popular English extractive QA datasets: SQuAD1.1 and NewsQA. The experimental results show that the subdomains defined by question type, answer length, answer position inject strong bias into QA systems, with the result that the performance of QA systems is negatively impacted when train and test data come from different subdomains. The experiments provide useful information on how to control question diversity, answer length distribution as well as the answer positions when constructing QA datasets and employing QA systems. In future work, we aim to apply our analysis to multilingual data to explore how QA models behave across different languages and we plan to investigate other types of QA beyond extractive QA.
Acknowledgements
This work was funded by Science Foundation Ireland through the SFI Centre for Research Training in Machine Learning (18/CRT/6183). We thank James Barry for his proofreading and helpful comments. We also thank the reviewers for their helpful comments.
References
- Amplayo et al. (2019) Reinald Kim Amplayo, Seonjae Lim, and Seung-won Hwang. 2019. Text length adaptation in sentiment classification. In Asian Conference on Machine Learning, pages 646–661. PMLR.
- Chen et al. (2017) Danqi Chen, Adam Fisch, Jason Weston, and Antoine Bordes. 2017. Reading Wikipedia to answer open-domain questions. In Proceedings of the 55th Annual Meeting of the Association for Computational Linguistics (Volume 1: Long Papers), pages 1870–1879, Vancouver, Canada. Association for Computational Linguistics.
- Chen and Yih (2020) Danqi Chen and Wen-tau Yih. 2020. Open-domain question answering. In Proceedings of the 58th Annual Meeting of the Association for Computational Linguistics: Tutorial Abstracts, pages 34–37, Online. Association for Computational Linguistics.
- Fisch et al. (2019) Adam Fisch, Alon Talmor, Robin Jia, Minjoon Seo, Eunsol Choi, and Danqi Chen. 2019. MRQA 2019 shared task: Evaluating generalization in reading comprehension. In Proceedings of the 2nd Workshop on Machine Reading for Question Answering, pages 1–13, Hong Kong, China. Association for Computational Linguistics.
- Jia and Liang (2017) Robin Jia and Percy Liang. 2017. Adversarial examples for evaluating reading comprehension systems. In Proceedings of the 2017 Conference on Empirical Methods in Natural Language Processing, pages 2021–2031, Copenhagen, Denmark. Association for Computational Linguistics.
- Ko et al. (2020) Miyoung Ko, Jinhyuk Lee, Hyunjae Kim, Gangwoo Kim, and Jaewoo Kang. 2020. Look at the first sentence: Position bias in question answering. In Proceedings of the 2020 Conference on Empirical Methods in Natural Language Processing (EMNLP), pages 1109–1121, Online. Association for Computational Linguistics.
- Li and Roth (2002) Xin Li and Dan Roth. 2002. Learning question classifiers. In COLING 2002: The 19th International Conference on Computational Linguistics.
- Lyu et al. (2021) Chenyang Lyu, Lifeng Shang, Yvette Graham, Jennifer Foster, Xin Jiang, and Qun Liu. 2021. Improving unsupervised question answering via summarization-informed question generation. arXiv preprint arXiv:2109.07954.
- Plank (2016) Barbara Plank. 2016. What to do about non-standard (or non-canonical) language in NLP. In Proceedings of the 13th Conference on Natural Language Processing, KONVENS 2016, Bochum, Germany, September 19-21, 2016, volume 16 of Bochumer Linguistische Arbeitsberichte.
- Plank and Sima’an (2008) Barbara Plank and Khalil Sima’an. 2008. Subdomain sensitive statistical parsing using raw corpora. In Proceedings of the International Conference on Language Resources and Evaluation, LREC 2008, 26 May - 1 June 2008, Marrakech, Morocco. European Language Resources Association.
- Rajpurkar et al. (2016) Pranav Rajpurkar, Jian Zhang, Konstantin Lopyrev, and Percy Liang. 2016. SQuAD: 100,000+ questions for machine comprehension of text. In Proceedings of the 2016 Conference on Empirical Methods in Natural Language Processing, pages 2383–2392, Austin, Texas. Association for Computational Linguistics.
- Ruder and Sil (2021) Sebastian Ruder and Avi Sil. 2021. Multi-domain multilingual question answering. In Proceedings of the 2021 Conference on Empirical Methods in Natural Language Processing: Tutorial Abstracts, pages 17–21, Punta Cana, Dominican Republic & Online. Association for Computational Linguistics.
- Sen and Saffari (2020) Priyanka Sen and Amir Saffari. 2020. What do models learn from question answering datasets? In Proceedings of the 2020 Conference on Empirical Methods in Natural Language Processing (EMNLP), pages 2429–2438, Online. Association for Computational Linguistics.
- Shakeri et al. (2020) Siamak Shakeri, Cicero Nogueira dos Santos, Henghui Zhu, Patrick Ng, Feng Nan, Zhiguo Wang, Ramesh Nallapati, and Bing Xiang. 2020. End-to-end synthetic data generation for domain adaptation of question answering systems. In Proceedings of the 2020 Conference on Empirical Methods in Natural Language Processing (EMNLP), pages 5445–5460, Online. Association for Computational Linguistics.
- Talmor and Berant (2019) Alon Talmor and Jonathan Berant. 2019. MultiQA: An empirical investigation of generalization and transfer in reading comprehension. In Proceedings of the 57th Annual Meeting of the Association for Computational Linguistics, pages 4911–4921, Florence, Italy. Association for Computational Linguistics.
- Trischler et al. (2017) Adam Trischler, Tong Wang, Xingdi Yuan, Justin Harris, Alessandro Sordoni, Philip Bachman, and Kaheer Suleman. 2017. NewsQA: A machine comprehension dataset. In Proceedings of the 2nd Workshop on Representation Learning for NLP, pages 191–200, Vancouver, Canada. Association for Computational Linguistics.
- Varis and Bojar (2021) Dusan Varis and Ondřej Bojar. 2021. Sequence length is a domain: Length-based overfitting in transformer models. In Proceedings of the 2021 Conference on Empirical Methods in Natural Language Processing, pages 8246–8257, Online and Punta Cana, Dominican Republic. Association for Computational Linguistics.
- Vaswani et al. (2017) Ashish Vaswani, Noam Shazeer, Niki Parmar, Jakob Uszkoreit, Llion Jones, Aidan N. Gomez, Lukasz Kaiser, and Illia Polosukhin. 2017. Attention is all you need. CoRR, abs/1706.03762.
- Wang et al. (2020) Benyou Wang, Lifeng Shang, Christina Lioma, Xin Jiang, Hao Yang, Qun Liu, and Jakob Grue Simonsen. 2020. On position embeddings in bert. In International Conference on Learning Representations.
- Wolf et al. (2019) Thomas Wolf, Lysandre Debut, Victor Sanh, Julien Chaumond, Clement Delangue, Anthony Moi, Pierric Cistac, Tim Rault, R’emi Louf, Morgan Funtowicz, and Jamie Brew. 2019. Huggingface’s transformers: State-of-the-art natural language processing. ArXiv, abs/1910.03771.
- Zhang and Lee (2003) Dell Zhang and Wee Sun Lee. 2003. Question classification using support vector machines. In Proceedings of the 26th annual international ACM SIGIR conference on Research and development in informaion retrieval, pages 26–32.
- Zhang et al. (2020) Zhuosheng Zhang, Hai Zhao, and Rui Wang. 2020. Machine reading comprehension: The role of contextualized language models and beyond.
Appendix A Appendix
A.1 Experimental Setup
We use bert-based-uncased as our QA model, the learning rate is set to 3e-5, the maximum sequence length is set to 384, the doc stride length is set to 128, we run the training process for 2 epochs for training each QA system in experiments, the training was conducted on one GeForce GTX 3090 GPU, the training batch size is 48.
A.2 Average Text Length and Answer Position for All Question Types
We show the average text length of context, question and answer as well as the average answer position on character-level, word-level and sentence-level for QA examples in all question types in SQuAD1.1 and NewsQA in Table 3 and Table 4.
| Context | Question | Answer | ||
|---|---|---|---|---|
| SQuAD1.1 | HUM | 123.20 | 9.79 | 2.82 |
| LOC | 117.18 | 9.62 | 2.78 | |
| DESC | 119.32 | 9.91 | 5.82 | |
| ENTY | 117.43 | 10.54 | 3.04 | |
| NUM | 121.09 | 10.11 | 2.08 | |
| NewsQA | HUM | 495.79 | 6.55 | 2.82 |
| LOC | 478.84 | 6.34 | 2.87 | |
| DESC | 513.00 | 6.25 | 7.62 | |
| ENTY | 505.94 | 6.76 | 4.27 | |
| NUM | 476.23 | 7.20 | 2.07 |
| Char-Level | Word-Level | Sent-Level | ||
|---|---|---|---|---|
| SQuAD1.1 | HUM | 317.85 | 54.90 | 1.61 |
| LOC | 308.81 | 53.71 | 1.53 | |
| DESC | 342.97 | 60.00 | 1.79 | |
| ENTY | 317.75 | 55.16 | 1.63 | |
| NUM | 315.78 | 56.19 | 1.67 | |
| NewsQA | HUM | 532.11 | 101.02 | 3.71 |
| LOC | 566.02 | 107.99 | 3.95 | |
| DESC | 844.13 | 160.05 | 5.98 | |
| ENTY | 751.48 | 143.90 | 5.49 | |
| NUM | 763.73 | 145.26 | 5.47 |
| Context | Question | Answer | |
|---|---|---|---|
| SQuAD1.1 | 110 | 10 | 2 |
| NewsQA | 534 | 6 | 2 |
| LOC | ENTY | HUM | NUM | DESC | ||
|---|---|---|---|---|---|---|
| SQuAD1.1 | Long | 11.11 | 26.68 | 21.65 | 24.8 | 15.43 |
| Short | 11.73 | 28.42 | 19.68 | 24.2 | 15.52 | |
| NewsQA | Long | 10.4 | 18.08 | 29.94 | 16.81 | 24.71 |
| Short | 12.38 | 15.86 | 30.24 | 20.9 | 20.55 |
| LOC | ENTY | HUM | NUM | DESC | ||
|---|---|---|---|---|---|---|
| SQuAD1.1 | Long | 10.36 | 28.59 | 20.37 | 24.73 | 15.63 |
| Short | 12.11 | 26.90 | 20.84 | 24.35 | 15.37 | |
| NewsQA | Long | 9.45 | 18.29 | 29.70 | 23.66 | 18.90 |
| Short | 12.96 | 15.91 | 30.40 | 14.98 | 25.63 |
| LOC | ENTY | HUM | NUM | DESC | ||
|---|---|---|---|---|---|---|
| SQuAD1.1 | Long | 10.87 | 27.32 | 19.69 | 21.8 | 19.86 |
| Short | 11.79 | 27.72 | 21.29 | 26.29 | 12.55 | |
| NewsQA | Long | 9.37 | 19.87 | 23.16 | 9.31 | 38.17 |
| Short | 13.13 | 14.48 | 36.03 | 27.05 | 9.29 |
| Context | Question | Answer | ||
|---|---|---|---|---|
| SQuAD1.1 | Long | 84.53 | 9.99 | 3.09 |
| Short | 155.88 | 10.14 | 3.23 | |
| NewsQA | Long | 350.44 | 6.54 | 3.79 |
| Short | 641.35 | 6.69 | 4.25 |
| Context | Question | Answer | ||
|---|---|---|---|---|
| SQuAD1.1 | Long | 119.12 | 7.8 | 3.25 |
| Short | 120.76 | 13.57 | 3.03 | |
| NewsQA | Long | 491.15 | 4.96 | 4.45 |
| Short | 501.55 | 8.66 | 3.49 |
| Context | Question | Answer | ||
|---|---|---|---|---|
| SQuAD1.1 | Long | 119.08 | 10.18 | 1.42 |
| Short | 120.79 | 9.88 | 5.77 | |
| NewsQA | Long | 489.32 | 6.82 | 1.5 |
| Short | 503.34 | 6.37 | 6.95 |
| Char | Word | Sent | ||
|---|---|---|---|---|
| SQuAD1.1 | Long | 402.02 | 70.36 | 2.14 |
| Short | 239.75 | 41.78 | 1.17 | |
| NewsQA | Long | 864.85 | 165.73 | 6.40 |
| Short | 510.58 | 95.94 | 3.37 |
| Char | Word | Sent | ||
|---|---|---|---|---|
| SQuAD1.1 | Long | 342.02 | 59.70 | 1.74 |
| Short | 305.65 | 53.45 | 1.58 | |
| NewsQA | Long | 726.78 | 138.64 | 5.22 |
| Short | 655.98 | 124.50 | 4.61 |
| Char | Word | Sent | ||
|---|---|---|---|---|
| SQuAD1.1 | Long | 324.65 | 57.77 | 1.71 |
| Short | 316.70 | 54.65 | 1.60 | |
| NewsQA | Long | 795.46 | 150.20 | 5.61 |
| Short | 595.00 | 114.17 | 4.26 |
A.3 Question Type Proportions, Average Text Length and Average Answer Position for Long and Short Text Length
The median of the context, question, answer is shown in Table 5. We show the question type proportion, average text length for context, question and answer as well as the average answer position on character-level, word-level and sentence-level for QA examples in long and short groups of context, question, answer in SQuAD1.1 and NewsQA in Table 6, Table 7, Table 8, Table 9 Table 10, Table 11, Table 12, Table 13, Table 14.
A.4 Question Type Proportions, Average Text Length and Average Answer Position for QA examples with Front and Back Answer Positions
The median of the answer position on character-level, word-level and sentence-level is shown in Table 15. We show the question type proportion, average text length for context, question and answer as well as the average answer position on character-level, word-level and sentence-level for QA examples in front and back groups of answer positions in character-level, word-level and sentence-level in SQuAD1.1 and NewsQA in Table 16, Table 17, Table 18, Table 19, Table 20, Table 21, Table 22, Table 23, Table 24.
| Char | Word | Sent | |
|---|---|---|---|
| SQuAD1.1 | 262 | 46 | 1 |
| NewsQA | 358 | 67 | 2 |
| LOC | ENTY | HUM | NUM | DESC | ||
|---|---|---|---|---|---|---|
| SQuAD1.1 | Front | 11.74 | 27.8 | 20.25 | 24.97 | 14.81 |
| Back | 11.11 | 27.32 | 21.06 | 24.02 | 16.14 | |
| NewsQA | Front | 13.07 | 15.59 | 37.2 | 15.61 | 18.46 |
| Back | 9.71 | 18.36 | 22.97 | 22.1 | 26.8 |
| LOC | ENTY | HUM | NUM | DESC | ||
|---|---|---|---|---|---|---|
| SQuAD1.1 | Front | 11.76 | 28.05 | 20.28 | 24.49 | 14.99 |
| Back | 11.16 | 27.08 | 21.00 | 24.45 | 15.94 | |
| NewsQA | Front | 13.02 | 15.59 | 37.20 | 15.64 | 18.48 |
| Back | 9.74 | 18.43 | 22.85 | 22.11 | 26.81 |
| LOC | ENTY | HUM | NUM | DESC | ||
|---|---|---|---|---|---|---|
| SQuAD1.1 | Front | 11.72 | 27.83 | 20.60 | 24.48 | 14.95 |
| Back | 11.04 | 27.18 | 20.71 | 24.56 | 16.15 | |
| NewsQA | Front | 13.19 | 15.76 | 36.08 | 16.36 | 18.54 |
| Back | 9.56 | 18.54 | 23.11 | 22.06 | 26.67 |
| Char | Word | Sent | ||
|---|---|---|---|---|
| SQuAD1.1 | Front | 116.25 | 20.6 | 0.44 |
| Back | 524.15 | 91.3 | 2.85 | |
| NewsQA | Front | 145.24 | 28.72 | 0.61 |
| Back | 1230.24 | 232.96 | 9.15 |
| Char | Word | Sent | ||
|---|---|---|---|---|
| SQuAD1.1 | Front | 127.4 | 19.34 | 0.44 |
| Back | 515.71 | 93.09 | 2.88 | |
| NewsQA | Front | 151.46 | 28.04 | 0.65 |
| Back | 1229.77 | 234.74 | 9.17 |
| Char | Word | Sent | ||
|---|---|---|---|---|
| SQuAD1.1 | Front | 158.46 | 26.12 | 0.4 |
| Back | 532.52 | 95.11 | 3.28 | |
| NewsQA | Front | 183.56 | 35.56 | 0.63 |
| Back | 1280.56 | 242.86 | 9.89 |
| Context | Question | Answer | ||
|---|---|---|---|---|
| SQuAD1.1 | Front | 108.80 | 9.83 | 3.06 |
| Back | 130.77 | 10.30 | 3.26 | |
| NewsQA | Front | 473.52 | 6.50 | 3.28 |
| Back | 518.08 | 6.72 | 4.75 |
| Context | Question | Answer | ||
|---|---|---|---|---|
| SQuAD1.1 | Front | 109.21 | 9.84 | 3.03 |
| Back | 130.50 | 10.28 | 3.30 | |
| NewsQA | Front | 473.13 | 6.50 | 3.32 |
| Back | 518.72 | 6.72 | 4.72 |
| Context | Question | Answer | ||
|---|---|---|---|---|
| SQuAD1.1 | Front | 110.14 | 9.93 | 3.04 |
| Back | 132.44 | 10.23 | 3.33 | |
| NewsQA | Front | 474.28 | 6.52 | 3.58 |
| Back | 521.11 | 6.73 | 4.54 |
A.5 Question type definition and examples
We show the definitions of question type HUM, LOC, ENTY, DESC, NUM and some examples from the question classification data444https://cogcomp.seas.upenn.edu/Data/QA/QC/ and predictions of SQuAD1.1 and NewsQA in Table 25.
| Question type | Definition | Examples |
|---|---|---|
| HUM | people, individual, group, title |
What contemptible scoundrel stole the cork from my lunch ?
Which professor sent the first wireless message in the USA ? Who was sentenced to death in February ? |
| LOC | location, city, country, mountain, state |
Where is the Kalahari desert ?
Where is the theology library at Notre Dame ? Where was Cretan when he heard screams ? |
| ENTY | animal, body, color, creation, currency, disease/medical, event, food, instrument, language, plant, product, religion, sport, symbol, technique, term, vehicle |
What relative of the racoon is sometimes known as the cat-bear ?
What is the world’s oldest monographic music competition ? What was the name of the film about Jack Kevorkian ? |
| DESC | definition, description, manner, reason |
What is Eagle ’s syndrome styloid process ?
How did Beyonce describe herself as a feminist ? What are suspects blamed for ? |
| NUM | code, count, date, distance, money, order, other, percent, period, speed, temperature, size, weight |
How many calories are there in a Big Mac ?
What year did Nintendo announce a new Legend of Zelda was in the works for Gamecube ? How many tons of cereal did Kelloggs donate ? |
A.6 QA examples with long answers and short answers
| Answer Length | Question | Context |
|---|---|---|
| Long | Where was the main focus of Pan-Slavism? | Pan-Slavism, a movement which came into prominence in the mid-19th century, emphasized the common heritage and unity of all the Slavic peoples. The main focus was in the Balkans where the South Slavs had been ruled for centuries by other empires: the Byzantine Empire, Austria-Hungary, the Ottoman Empire, and Venice. The Russian Empire used Pan-Slavism as a political tool; as did the Soviet Union, which gained political-military influence and control over most Slavic-majority nations between 1945 and 1948 and retained a hegemonic role until the period 1989–1991. |
| Long | What is one reason for homologs to appear? | Genes with a most recent common ancestor, and thus a shared evolutionary ancestry, are known as homologs. These genes appear either from gene duplication within an organism’s genome, where they are known as paralogous genes, or are the result of divergence of the genes after a speciation event, where they are known as orthologous genes,:7.6 and often perform the same or similar functions in related organisms. It is often assumed that the functions of orthologous genes are more similar than those of paralogous genes, although the difference is minimal. |
| Long | How does the water vapor that rises in warm air turn into clouds? | Solar radiation is absorbed by the Earth’s land surface, oceans – which cover about 71% of the globe – and atmosphere. Warm air containing evaporated water from the oceans rises, causing atmospheric circulation or convection. When the air reaches a high altitude, where the temperature is low, water vapor condenses into clouds, which rain onto the Earth’s surface, completing the water cycle. The latent heat of water condensation amplifies convection, producing atmospheric phenomena such as wind, cyclones and anti-cyclones. Sunlight absorbed by the oceans and land masses keeps the surface at an average temperature of 14 °C. By photosynthesis green plants convert solar energy into chemically stored energy, which produces food, wood and the biomass from which fossil fuels are derived. |
| Answer Length | Question | Context |
|---|---|---|
| Short | Who led the Exodus? | According to the Hebrew Bible narrative, Jewish ancestry is traced back to the Biblical patriarchs such as Abraham, Isaac and Jacob, and the Biblical matriarchs Sarah, Rebecca, Leah, and Rachel, who lived in Canaan around the 18th century BCE. Jacob and his family migrated to Ancient Egypt after being invited to live with Jacob’s son Joseph by the Pharaoh himself. The patriarchs’ descendants were later enslaved until the Exodus led by Moses, traditionally dated to the 13th century BCE, after which the Israelites conquered Canaan. |
| Short | When did the Duke of Kent die? | Victoria was the daughter of Prince Edward, Duke of Kent and Strathearn, the fourth son of King George III. Both the Duke of Kent and King George III died in 1820, and Victoria was raised under close supervision by her German-born mother Princess Victoria of Saxe-Coburg-Saalfeld. She inherited the throne aged 18, after her father’s three elder brothers had all died, leaving no surviving legitimate children. The United Kingdom was already an established constitutional monarchy, in which the sovereign held relatively little direct political power. Privately, Victoria attempted to influence government policy and ministerial appointments; publicly, she became a national icon who was identified with strict standards of personal morality. |
| Short | What is the evaluator called in a breed show? | In conformation shows, also referred to as breed shows, a judge familiar with the specific dog breed evaluates individual purebred dogs for conformity with their established breed type as described in the breed standard. As the breed standard only deals with the externally observable qualities of the dog (such as appearance, movement, and temperament), separately tested qualities (such as ability or health) are not part of the judging in conformation shows. |
A.7 QA examples with front answers and back answers
We give some QA examples with character-level answer positions in front group and back group in Table 28 and Table 29.
| Answer Position | Question | Context |
|---|---|---|
| Front | What are the first names of the men that invented youtube? | According to a story that has often been repeated in the media, Hurley and Chen developed the idea for YouTube during the early months of 2005, after they had experienced difficulty sharing videos that had been shot at a dinner party at Chen’s apartment in San Francisco. Karim did not attend the party and denied that it had occurred, but Chen commented that the idea that YouTube was founded after a dinner party ẅas probably very strengthened by marketing ideas around creating a story that was very digestible.̈ |
| Front | Who became Chairman of the Council of Ministers in 1985? | In the fall of 1985, Gorbachev continued to bring younger and more energetic men into government. On September 27, Nikolai Ryzhkov replaced 79-year-old Nikolai Tikhonov as Chairman of the Council of Ministers, effectively the Soviet prime minister, and on October 14, Nikolai Talyzin replaced Nikolai Baibakov as chairman of the State Planning Committee (GOSPLAN). At the next Central Committee meeting on October 15, Tikhonov retired from the Politburo and Talyzin became a candidate. Finally, on December 23, 1985, Gorbachev appointed Yeltsin First Secretary of the Moscow Communist Party replacing Viktor Grishin. |
| Front | During what seasons is fog common in Boston? | Fog is fairly common, particularly in spring and early summer, and the occasional tropical storm or hurricane can threaten the region, especially in late summer and early autumn. Due to its situation along the North Atlantic, the city often receives sea breezes, especially in the late spring, when water temperatures are still quite cold and temperatures at the coast can be more than 20 °F (11 °C) colder than a few miles inland, sometimes dropping by that amount near midday. Thunderstorms occur from May to September, that are occasionally severe with large hail, damaging winds and heavy downpours. Although downtown Boston has never been struck by a violent tornado, the city itself has experienced many tornado warnings. Damaging storms are more common to areas north, west, and northwest of the city. Boston has a relatively sunny climate for a coastal city at its latitude, averaging over 2,600 hours of sunshine per annum. |
| Answer Position | Question | Context |
|---|---|---|
| Back | How many murders did Detroit have in 2015? | Detroit has struggled with high crime for decades. Detroit held the title of murder capital between 1985-1987 with a murder rate around 58 per 100,000. Crime has since decreased and, in 2014, the murder rate was 43.4 per 100,000, lower than in St. Louis, Missouri. Although the murder rate increased by 6% during the first half of 2015, it was surpassed by St Louis and Baltimore which saw much greater spikes in violence. At year-end 2015, Detroit had 295 criminal homicides, down slightly from 299 in 2014. |
| Back | Who was leading the Conservatives at this time? | Despite being a persistent critic of some of the government’s policies, the paper supported Labour in both subsequent elections the party won. For the 2005 general election, The Sun backed Blair and Labour for a third consecutive election win and vowed to give him öne last chanceẗo fulfil his promises, despite berating him for several weaknesses including a failure to control immigration. However, it did speak of its hope that the Conservatives (led by Michael Howard) would one day be fit for a return to government. This election (Blair had declared it would be his last as prime minister) resulted in Labour’s third successive win but with a much reduced majority. |
| Back | Who lost the 2015 Nigerian presidential election? | Nigeria is a Federal Republic modelled after the United States, with executive power exercised by the president. It is influenced by the Westminster System model[citation needed] in the composition and management of the upper and lower houses of the bicameral legislature. The president presides as both Head of State and head of the national executive; the leader is elected by popular vote to a maximum of two 4-year terms. In the March 28, 2015 presidential election, General Muhammadu Buhari emerged victorious to become the Federal President of Nigeria, defeating then incumbent Goodluck Jonathan. |