Rheological model for the alpha relaxation of glass-forming liquids and its comparison to data for DC704 and DC705
Abstract
Dynamic shear-modulus data are presented for the two silicone oils DC704 and DC705 for frequencies between 1 mHz and 10 kHz at temperatures covering more than five decades of relaxation-time variation. The data are fitted to the alpha part of a phenomenological model previously shown to describe well the dynamic shear modulus of squalane, which has a large beta process [Hecksher et al., J. Chem. Phys. 146, 154504 (2017)]; that model is characterized by additivity of the alpha and beta shear compliance and by a high-frequency decay of the alpha process in proportion to in which is the angular frequency. The fits of the alpha part of this model to the DC704 and DC705 data are compared to fits by a Havriliak-Negami type model, the Barlow-Erginsav-Lamb model, and a Cole-Davidson type model. At all temperatures the best fit is obtained by the alpha part of the squalane model. This strengthens the conjecture that so-called -relaxation, leading to high-frequency decays proportional to , is a general characteristic of the alpha relaxation of supercooled liquids [Dyre, Phys. Rev. E 74, 021502 (2006); Nielsen et al., J. Chem. Phys. 130, 154508 (2009); Pabst et al., J. Phys. Chem. Lett. 12, 3685 (2021)].
I Introduction
Dynamic shear properties are central for the description of glass-forming liquids Barlow et al. (1967); Harrison (1976); Christensen and Olsen (1995); Deegan et al. (1999); Jakobsen et al. (2005); Dyre (2006a). Historically, many different expressions have been fitted to the dynamic shear modulus in which is the angular frequency. In a paper published in 2017 we proposed an expression for the dynamic shear compliance , which was shown to fit well to squalane data over a sizable range of temperatures and frequencies Hecksher et al. (2017). The model also describes well data for 1-propanol Weigl et al. (2021).
Squalane, which is a reference liquid for rheological measurements Comunas et al. (2013); Schmidt et al. (2015), has a strong beta process. The model proposed in Ref. Hecksher et al., 2017 was based on two assumptions: 1) The dynamic shear compliance is additive in the alpha and beta processes; 2) for the alpha process obeys for its imaginary part or, equivalently, . The second property can be justified by different arguments, many of which date far back in time Glarum (1960); Isakovich and Chaban (1966); Barlow et al. (1967); Doremus (1970); Montrose and Litovitz (1970); Majumbar (1971); Kimmich and Voigt (1978); Lamb (1978); Wyllie (1979); Cunat (1988); Condat (1989); Lishchuk and Malomuzh (1997); Dyre (2006b, 2007); this so-called -relaxation recently received strong support from light-scattering measurements on 16 supercooled liquids of quite different chemistry Pabst et al. (2021). An high-frequency decay of a dynamic response function corresponds via the fluctuation-dissipation theorem to a short-time behavior of the relevant time-autocorrelation function that deviates from a constant by a term proportional to the square root of the time, hence the name -relaxation. Dielectric data also indicate that this short-time/high-frequency behavior of the alpha process may be universal Nielsen et al. (2009), but the experimental evidence is here less convincing than for light scattering.
The model proposed in Ref. Hecksher et al., 2017 was based on an electrical equivalent circuit, which is reproduced in the Appendix where its translation into a rheological circuit is given. It leads to the following expression for the dynamic shear compliance in which and are the characteristic times for the alpha and beta processes and is the high-frequency limit of the compliance (often denoted by )
| (1) |
The first term is the contribution from the alpha process, which is a sum of a constant, a dc flow term, and a Cole-Cole type term Cole and Cole (1941) with exponent 1/2. The second term is the contribution from the beta process with compliance strength , which is a Cole-Cole type term with exponent . Equation (1) has a total of seven parameters; the alpha term has four parameters: two of dimension ( and ) and the two dimensionless shape parameters and .
An obvious question is the following: Is the excellent fit of Eq. (1) to squalane data Hecksher et al. (2017) due to the many fit parameters or does it reflect physical reality? If the latter is the case, the model provides a good starting point for arriving at a better understanding of the physics of supercooled liquids, for instance described in terms of independent and additive single-particle mean-square displacements deriving from the alpha and beta processes Hecksher et al. (2017). That would imply additivity of the alpha and beta response to an external field coupling to the single-particle motion, which by a Stokes-Einstein type argument translates into additivity of the shear compliance contributions from the alpha and the beta processes. Whether or not such an additivity of compliance reflects an element of physical reality cannot be judged from the squalane data of Ref. Hecksher et al., 2017, however, because of the sizable beta process.
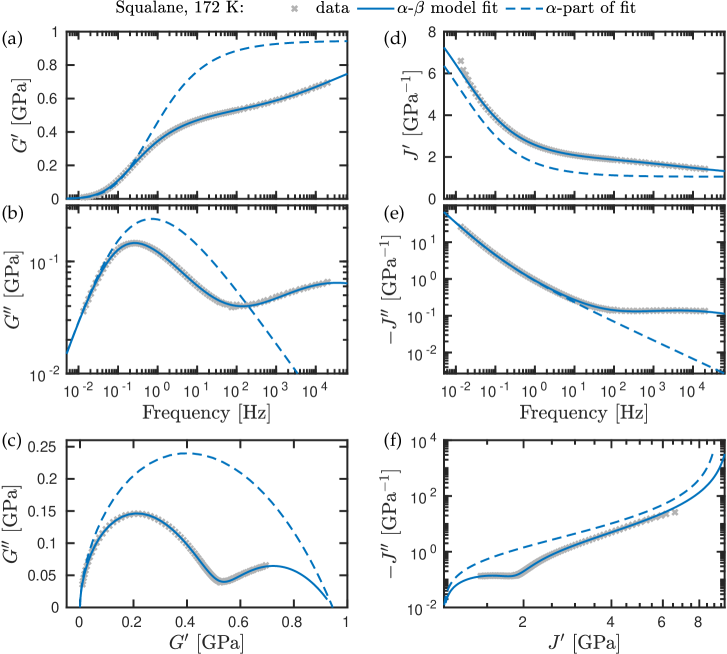
To illustrate this we plot in Fig. 1 squalane data for the dynamic shear modulus at the temperature K. (a) and (b) show the real and imaginary parts as functions of the frequency () while (c) shows a Nyquist plot, i.e., with the real part along the x-axis and the imaginary part along the y-axis. The data, which in (d), (e), and (f) are given in the compliance representation, are marked as gray crosses while the full curves are the best-fit model predictions (with the same parameters for both representations). The dashed curves are the predictions of the alpha part of Eq. (1). This analysis does not confirm that the alpha process of Eq. (1) has independent physical reality. In order to properly investigate whether the first term of Eq. (1) corresponds to an element of physical reality, one should compare this term to data for liquids with little or no mechanical beta relaxations. Although such liquids are rare, they do exist. This paper presents new data for the two silicone diffusion pump oils DC704 (tetramethyltetraphenyl trisiloxane) and DC705 (trimethylpentaphenyl trisiloxane). These liquids have no observable beta relaxation in the shear mechanics when probed with our PSG shear transducer covering more than six decades of frequency Christensen and Olsen (1995), and they are therefore ideal for testing the alpha part of Eq. (1). We show below that this “alpha model” fits well to the data and conclude that the alpha-beta additivity of the dynamic compliance of Eq. (1) is a physically meaningful assumption.
II Data and model fits
Data for the dynamic shear-mechanical properties of DC704 and DC705 were obtained by the three-disc piezo-ceramic shear transducer described in Refs. Christensen and Olsen, 1995 and Hecksher et al., 2013; references Igarashi et al., 2008a and Igarashi et al., 2008b give details about the cryostat and the impedance-measuring setup. Data were obtained with 2 K intervals using a home-built cryostat that keeps the temperature stable within 10 mK. The data are from previously unpublished measurements but consistent with published data Hecksher et al. (2013).
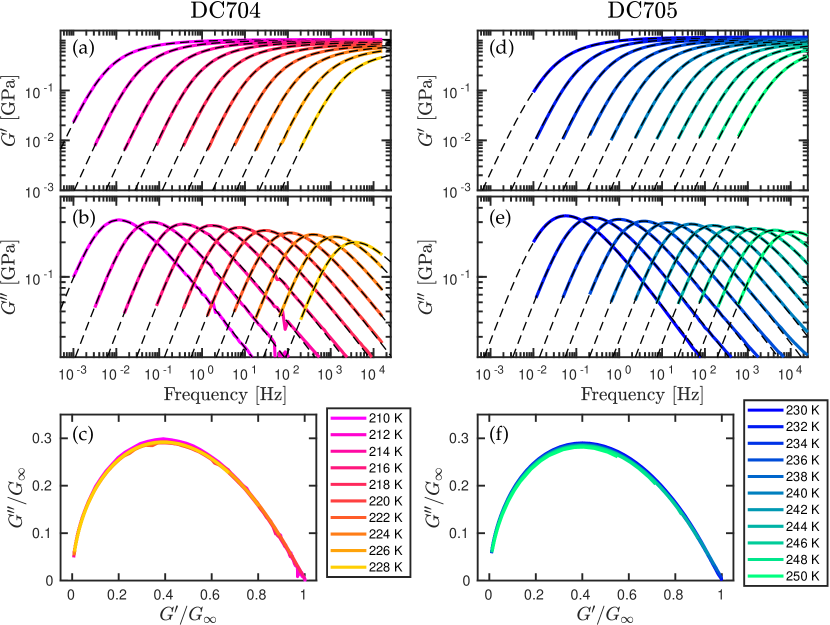
Figure 2 shows the dynamic shear modulus data as colored symbols in which the color reflects the temperature. The four upper figures show the real and negative imaginary parts of , while (c) and (f) show the corresponding normalized Nyquist plots. The latter are sensitive to changes in the relaxation-time distribution, i.e., to violations of time-temperature superposition (TTS). While there is not exact TTS for either liquid, the deviations are minor. We observe a slight narrowing of the loss as the temperature is lowered, but it should be emphasized that this happens while at the same time the average relaxation time changes by more than five decades. In Fig. 2 the dashed curves are fits by the alpha part of Eq. (1), i.e., by in which
| (2) |
The rheological circuit corresponding to Eq. (2) is given in the Appendix.
In the low-frequency limit of Eq. (2) one has . Since the dynamic shear viscosity is calculated from the shear compliance by means of Harrison (1976), the dc viscosity is given by
| (3) |
In the high-frequency limit, Eq. (2) implies which means that the high-frequency plateau modulus is given by
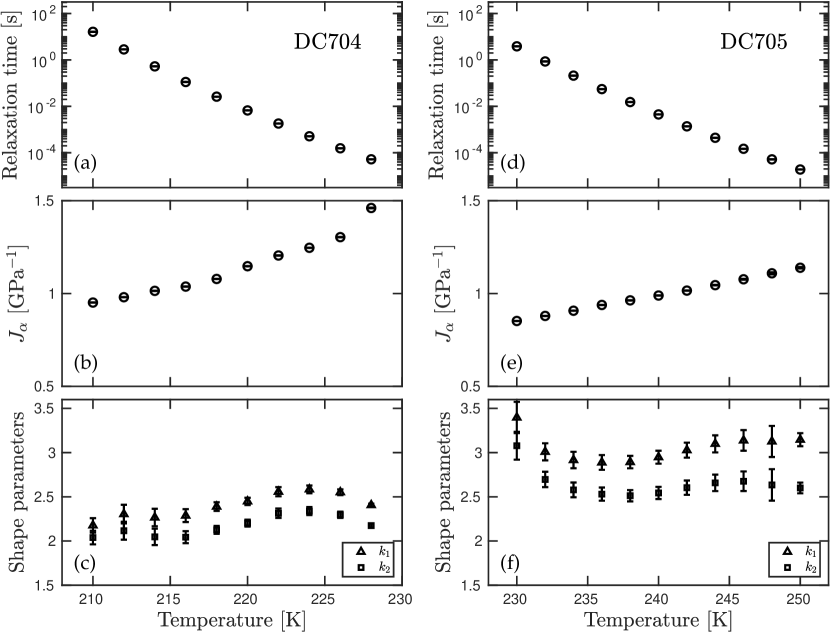
Figure 3 shows the best-fit parameters as functions of the temperature. The increase of with temperature is consistent with the well-known fact that usually decreases as the temperature is increased Dyre et al. (1996); Dyre (2006a). The shape parameters are not entirely constant, confirming the already mentioned fact that TTS is slightly violated.
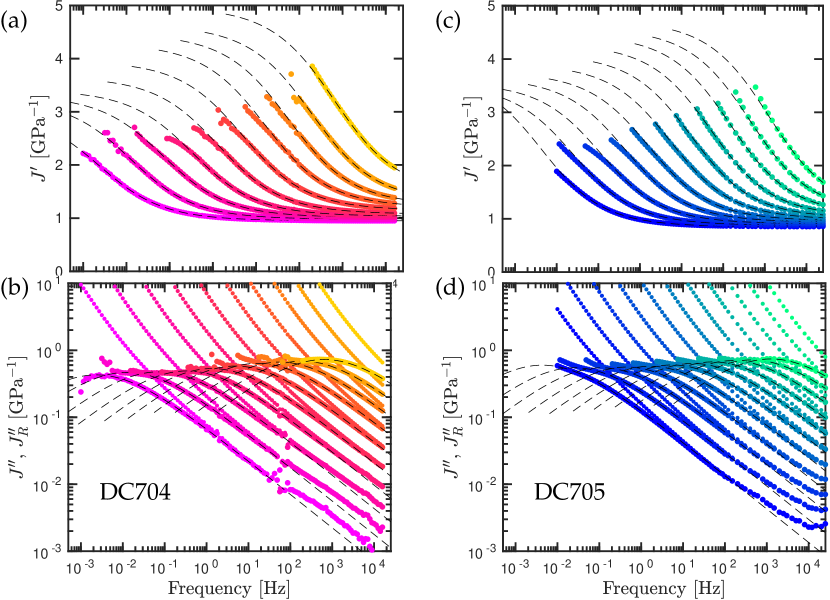
The dynamic shear modulus has a different emphasis than the dynamic shear compliance , and it is important to investigate whether the model also fits data well in the latter representation. Figure 4 shows the real and imaginary parts of where the colored symbols are the data and the black dashed lines are the model fits (with the same parameters as in Fig. 2, compare Fig. 3). The model predicts a low-frequency plateau for , compare Eq. (1), which is not possible to measure with our setup that is optimized for moduli above Pa. The data do not show evidence for the plateau prediction, but they also do not contradict it. If the purely imaginary flow term is subtracted from to form the “recoverable shear compliance” Plazek (1965); Buchenau (2016, 2017), which except for a constant is identical to the so-called retardational compliance Harrison (1976), i.e.,
| (5) |
there are hints of a peak in the imaginary part as predicted by the model (Fig. 4(b) and (d)).
III Comparing to fits by three other models
This section compares to fits by other models. Recalling that , it is sometimes convenient to formulate a model in terms of one or the other representation, e.g., writing the dynamic shear modulus as minus a function commonly used for fitting dielectric relaxation data, as done in two cases below. For all three functions, the dynamic shear-modulus goes to zero at low frequencies and reaches a plateau at high frequencies as required for any realistic model of an alpha process.
-
•
The Havriliak-Negami (HN) type model is defined Hecksher et al. (2017) by
(6) -
•
The Barlow-Erginsav-Lamb (BEL) model is defined Barlow et al. (1967) by
(7) This can be obtained from the alpha model Eq. (2) by substituting and and replacing unity by zero in the last denominator. The latter corresponds to removing a spring in the rheological circuit, compare the Appendix, thus arriving at
(8) From this perspective, Eq. (2) may be regarded as an extension of the BEL model by introducing two shape parameters.
-
•
The Cole-Davidson (CD) type model is defined by
(9)
In all cases is the high-frequency limit of and .
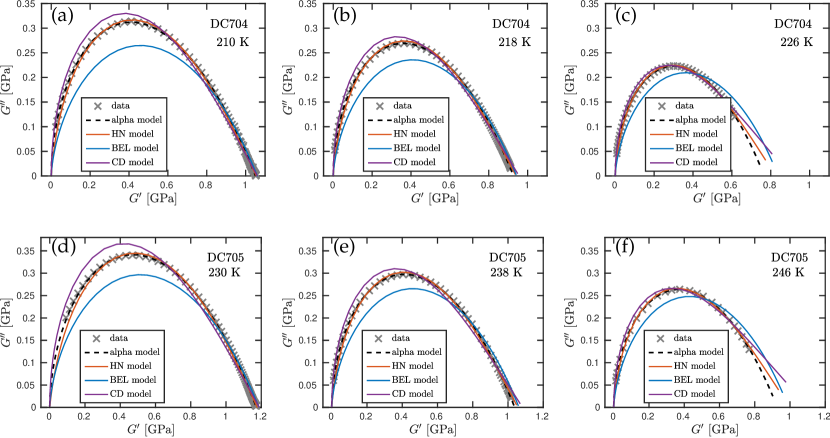
All models have two parameters of dimension, one determining the scale of the time and one determining the scale of the compliance. In regard to the number of shape parameters, the alpha and HN models have two such parameters, the BEL model has none, and the CD model has one. This, of course, influences the quality of the fits obtained, compare Fig. 5 that shows all data and fits in Nyquist plots of the dynamic shear modulus. We see generally good fits of the alpha and HN models, while the BEL and and CD models do not give good fits.
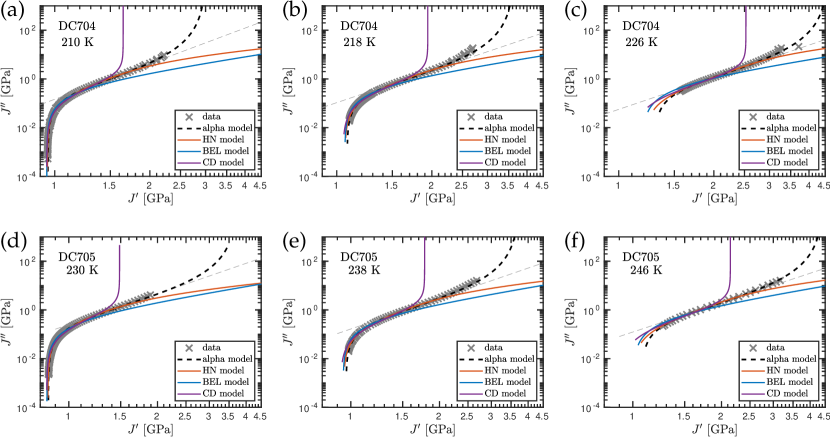
In order to better be able to compare the two best models according to Fig. 5 – the alpha and HN models – we introduce in Fig. 6 a “log-compliance” Nyquist plot. This way of showing data has a different focus than the standard Nyquist plot of Fig. 5. In particular, one can here investigate the low-frequency real part of the compliance, which has a plateau for the alpha and CD models, but not for the BEL and HN models. Figure 6 shows that the approach to a plateau is best represented by the alpha model.
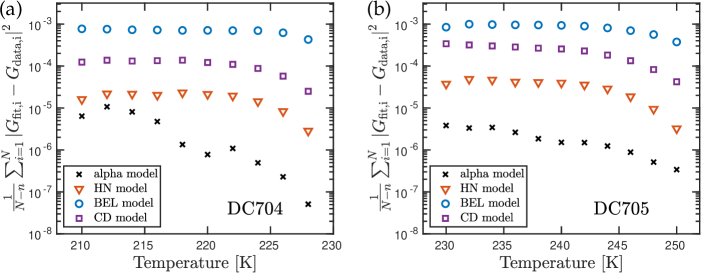
Figure 7 compares the quality of all fits by giving at each temperature the average deviation between data and best-fit predictions. For both liquids the alpha model is best at all temperatures.
IV Summary
Using shear-dynamical data for DC704 and DC705 this paper has investigated the question to which extent the separation of the compliance function proposed in Ref. Hecksher et al., 2017 into additive alpha and a beta parts makes sense physically. If this were the case, then the alpha part of the model should fit well to data for liquids with no mechanical beta relaxations. The two silicone oils studied here fall into this category.
The alpha model fits data well for both DC704 and DC705. We take this as a confirmation that the simple high-frequency behavior of the imaginary parts of the modulus and compliance reflects an important characteristic of the two liquids studied, confirming previous and recent works Dyre (2007); Nielsen et al. (2009); Pabst et al. (2021). An important further test of the alpha model would be to check whether the predicted low-frequency plateau in the real part of the shear compliance exists and is predicted correctly, because this feature distinguishes the alpha model from some of the other models studied here. Our shear transducer Christensen and Olsen (1995) is optimized for high-modulus samples and cannot be used for reliable measurements at the relevant low frequencies, unfortunately. Such measurements are important also because they would allow for testing the prediction of the alpha model that the Nyquist plot of (Eq. (5)) is symmetrical and identical to the standard dielectric relaxation Nyquist plot of the Cole-Cole function with exponent 1/2 Cole and Cole (1941).
Acknowledgements.
This work was supported by the VILLUM Foundation’s Matter grant (16515).Data availability
The data that support the findings of this study are available from the corresponding authors upon request.
Appendix: Diagrams
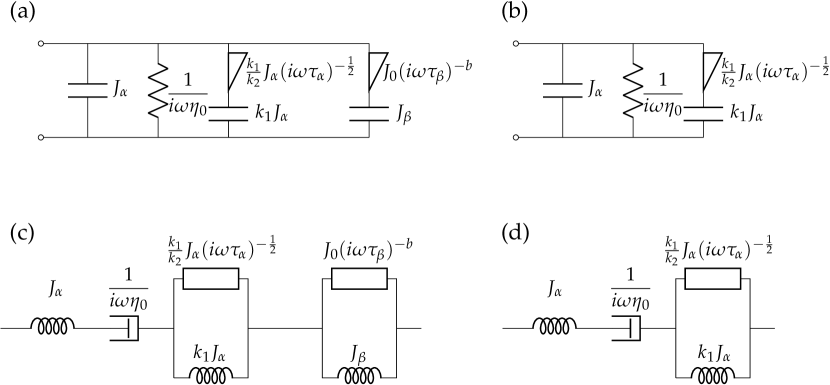
This Appendix presents the rheological model behind Eq. (1) in two equivalent formulations: the electrical-equivalent circuit used in Ref. Hecksher et al., 2017 and the spring-dashpot formulation that is standard in rheology. Even though not visually obvious, these two formulations are mathematically equivalent. In the present case of highly viscous glass-forming liquids where intertia plays no role, a parallel combination of electrical circuit elements corresponds to a mechanical series combination and vice versa. This is because currents are additive for an electrical parallel combination and velocities (currents) are additive in a mechanical series combination. Likewise, the potential drop across an electrical series combination is additive and forces/stresses (potential drops) are additive for a mechanical parallel combination.
For translating between the two types of circuits, besides the above parallel/series interchange one reasons as follows. Electrical charge corresponds to (shear) displacement and electrical current corresponds to shear rate. A resistor in an electrical circuit is an element for which the current is proportional to the potential drop. This corresponds to a dashpot in a rheological circuit, the element characterized by a constant frequency-independent viscosity for which the shear rate is proportional to the force (stress). A capacitor in an electrical circuit is an element for which the charge is proportional to the potential drop, which translates into a spring in a rheological circuit for which the (shear) displacement is proportional to the force (stress).
With this in mind, Fig. 8 shows the relevant diagrams. Figure 8(a) reproduces the electrical equivalent circuits of Ref. Hecksher et al., 2017 and (b) is the alpha part of this circuit. Note that these electrical diagrams are equivalent diagrams of the mechanical response; they are not diagrams for the dielectric response. In particular, no additivity is implied for the alpha and beta dielectric responses. The rheological diagram of the alpha model is given in (d), corresponding to the electrical equivalent circuit (b). To arrive at Eq. (1) for the (shear) compliance one uses the fact that compliances are additive for a mechanical series connection (the force is the same for each element while displacements are added).
References
- Barlow et al. (1967) A. J. Barlow, A. Erginsav, and J. Lamb, “Viscoelastic relaxation of supercooled liquids,” Proc. R. Soc. London 298, 481 (1967).
- Harrison (1976) G. Harrison, The Dynamic Properties of Supercooled Liquids (Academic (New York), 1976).
- Christensen and Olsen (1995) T. Christensen and N. B. Olsen, “A rheometer for the measurement of a high shear modulus covering more than seven decades of frequency below 50 kHz ,” Rev. Sci. Instrum. 66, 5019–5031 (1995).
- Deegan et al. (1999) R. D. Deegan, R. L. Leheny, N. Menon, S. R. Nagel, and D. C. Venerus, “Dynamic shear modulus of tricresyl phosphate and squalane,” J. Phys. Chem. B 103, 4066–4070 (1999).
- Jakobsen et al. (2005) B. Jakobsen, K. Niss, and N. B. Olsen, “Dielectric and shear mechanical alpha and beta relaxations in seven glass-forming liquids,” J. Chem. Phys. 123, 234511 (2005).
- Dyre (2006a) J. C. Dyre, “The glass transition and elastic models of glass-forming liquids,” Rev. Mod. Phys. 78, 953–972 (2006a).
- Hecksher et al. (2017) T. Hecksher, N. B. Olsen, and J. C. Dyre, “Model for the alpha and beta shear-mechanical properties of supercooled liquids and its comparison to squalane data,” J. Chem. Phys. 146, 154504 (2017).
- Weigl et al. (2021) P. Weigl, T. Hecksher, J. C. Dyre, T. Walther, and T. Blochowicz, “Identity of the local and macroscopic dynamicelastic responses in supercooled 1-propanol,” Phys. Chem. Chem. Phys. 23, 16537–16541 (2021).
- Comunas et al. (2013) M. J. P. Comunas, X. Paredes, F. M. Gacino, J. Fernandez, J. P. Bazile, C. Boned, J. L. Daridon, G. Galliero, J. Pauly, K. R. Harris, M. J. Assael, and S. K. Mylona, “Reference correlation of the viscosity of squalane from 273 to 373 K at 0.1 MPa,” J. Phys. Chem. Ref. Data 42, 033101 (2013).
- Schmidt et al. (2015) K. A. G. Schmidt, D. Pagnutti, M. D. Curran, A. Singh, J. P. M. Trusler, G. C. Maitland, and M. McBride-Wright, “New experimental data and reference models for the viscosity and density of squalane,” J. Chem. Eng. Data 60, 137–150 (2015).
- Glarum (1960) S. H. Glarum, “Dielectric relaxation of isoamyl bromide,” J. Chem. Phys. 33, 639–643 (1960).
- Isakovich and Chaban (1966) M. A. Isakovich and I. A. Chaban, “Propagation of sound in strongly viscous liquids,” Sov. Phys. JETP 50, 1343–1363 (1966).
- Doremus (1970) R. H. Doremus, “Delayed elasticity in ionic conductors,” J. Appl. Phys. 41, 3366–3371 (1970).
- Montrose and Litovitz (1970) C. J. Montrose and T. A. Litovitz, “Structural-relaxation dynamics in liquids,” J. Acoust. Soc. Am. 47, 1250–1257 (1970).
- Majumbar (1971) C. K. Majumbar, “Stress relaxation function of glass,” Solid State Commun. 9, 1087–1090 (1971).
- Kimmich and Voigt (1978) R. Kimmich and G. Voigt, “Defect diffusion models in NMR and dielectric relaxation,” Z. Naturforsch. 33A, 1294–1306 (1978).
- Lamb (1978) J. Lamb, “Viscoelasticity and lubrication: A review of liquid properties,” J. Rheol. 22, 317–347 (1978).
- Wyllie (1979) G. Wyllie, “Relaxation by defect diffusion in an elastic amorphous medium,” J. Chim. Phys. 76, 1017–1022 (1979).
- Cunat (1988) C. Cunat, “Thermodynamic treatment of relaxation in frozen-in systems. “Universality” of the distribution law for relaxation times,” Z. Phys. Chem. 157, 419–423 (1988).
- Condat (1989) C. A. Condat, “Defect diffusion and closed-time distributions for ionic channels in cell membranes,” Phys. Rev. A 39, 2112–2125 (1989).
- Lishchuk and Malomuzh (1997) S. V. Lishchuk and N. P. Malomuzh, “Clusterization in supercooled states of glycerol-like liquids and its manifestations in different phenomena,” J. Chem. Phys. 106, 6160–6170 (1997).
- Dyre (2006b) J. C. Dyre, “Solidity of viscous liquids. IV. Density fluctuations,” Phys. Rev. E 74, 021502 (2006b).
- Dyre (2007) J. C. Dyre, “Solidity of viscous liquids. V. Long-wavelength dominance of the dynamics,” Phys. Rev. E 76, 041508 (2007).
- Pabst et al. (2021) F. Pabst, J. P. Gabriel, T. Böhmer, P. Weigl, A. Helbling, T. Richter, P. Zourchang, T. Walther, and T. Blochowicz, “Generic structural relaxation in supercooled liquids,” J. Phys. Chem. Lett. 12, 3685–3690 (2021).
- Nielsen et al. (2009) A. I. Nielsen, T. Christensen, B. Jakobsen, K. Niss, N. B. Olsen, R. Richert, and J. C. Dyre, “Prevalence of approximate relaxation for the dielectric process in viscous organic liquids,” J. Chem. Phys. 130, 154508 (2009).
- Cole and Cole (1941) K. S. Cole and R. H. Cole, “Dispersion and absorption in dielectrics I. Alternating current characteristics,” J. Chem. Phys. 9, 341–351 (1941).
- Hecksher et al. (2013) T. Hecksher, N. B. Olsen, K. A. Nelson, J. C. Dyre, and T. Christensen, “Mechanical spectra of glass-forming liquids. I. Low-frequency bulk and shear moduli of DC704 and 5-PPE measured by piezoceramic transducers,” J. Chem. Phys. 138, 12A543 (2013).
- Igarashi et al. (2008a) B. Igarashi, T. Christensen, E. H. Larsen, N. B. Olsen, I. H. Pedersen, T. Rasmussen, and J. C. Dyre, “A cryostat and temperature control system optimized for measuring relaxations of glass-forming liquids,” Rev. Sci. Instrum. 79, 045105 (2008a).
- Igarashi et al. (2008b) B. Igarashi, T. Christensen, E. H. Larsen, N. B. Olsen, I. H. Pedersen, T. Rasmussen, and J. C. Dyre, “An impedance-measurement setup optimized for measuring relaxations of glass-forming liquids,” Rev. Sci. Instrum. 79, 045106 (2008b).
- Dyre et al. (1996) J. C. Dyre, N. B. Olsen, and T. Christensen, “Local elastic expansion model for viscous-flow activation energies of glass-forming molecular liquids,” Phys. Rev. B 53, 2171–2174 (1996).
- Plazek (1965) D. J. Plazek, “Temperature dependence of the viscoelastic behavior of polystyrene,” J. Phys. Chem. 69, 3480–3487 (1965).
- Buchenau (2016) U. Buchenau, “Retardation and flow at the glass transition,” Phys. Rev. E 93, 032608 (2016).
- Buchenau (2017) U. Buchenau, “Pragmatical access to the viscous flow of undercooled liquids,” Phys. Rev. E 95, 062603 (2017).