*\dbfootnotehttps://github.com/BiDAlab/ChildCIdb_v1 \DeclareFixedFootnote*\gafootnotehttps://github.com/BiDAlab/GeneticAlgorithm
ChildCI Framework: Analysis of Motor and Cognitive Development in Children-Computer Interaction for Age Detection
Abstract
This article presents a comprehensive analysis of the different tests proposed in the recent ChildCI framework\dbfootnote, proving its potential for generating a better understanding of children’s neuromotor and cognitive development along time, as well as their possible application in other research areas such as e-Health and e-Learning. In particular, we propose a set of over 100 global features related to motor and cognitive aspects of the children interaction with mobile devices, some of them collected and adapted from the literature.
Furthermore, we analyse the robustness and discriminative power of the proposed feature set including experimental results for the task of children age group detection based on their motor and cognitive behaviors. Two different scenarios are considered in this study: i) single-test scenario, and ii) multiple-test scenario. Results over 93% accuracy are achieved using the publicly available ChildCIdb_v1 database (over 400 children from 18 months to 8 years old), proving the high correlation of children’s age with the way they interact with mobile devices.
Index Terms:
Child-Computer Interaction, e-Health, e-Learning, ChildCIdb, Age ClassificationI Introduction
Technology has become a very important aspect of our lives in recent decades. In particular, mobile devices play an essential role in our daily basis (e.g., work, relationships, communications, business, etc.). This also affects children, who are exposed to these devices from an early age [1]. Recent studies corroborate this fact [2, 3]. For example, Kabali et al. conducted a study in [2] with 350 children aged 6 months to 4 years concluding that 96.6% of children use mobile devices, and most started using them before the age of 1 year. In addition, around 75% of children by the age of 4 years already have their own mobile device. Similar conclusions were obtained in [3], where 422 parents of children aged from birth to 5 years were interviewed and 75.6% of them indicated that their children had already used mobile devices at that age. Moreover, and due to the global pandemic of COVID-19 since 2020, the use of mobile devices has been rapidly increased as preschools, kindergartens, and schools were closed down for several months in most countries around the world. As a result, traditional face-to-face education was replaced to virtual learning environments (e-Learning) [4].
Despite the high technological evolution and the application of it in children scenarios, the assessment of the correct motor and cognitive development of children is still evaluated using traditional approaches that are manual, time-consuming, and provide qualitative results that are difficult to interpret. This is one of the main motivations of our ChildCI framework [5]: the proposal of automatic methods that quantify the motor and cognitive development of the children through the interaction with mobile devices, using both the stylus and the finger/touch. As a first step towards that future goal, in this article we first evaluate the discriminative power of the tests proposed in the ChildCI framework, trying to shed some light on the following questions: Is there any relationship between children’s chronological age and their motor and cognitive development when interacting with the tests proposed in ChildCI framework? Is there any relationship between the age, the type of test, and writing input (stylus/finger) considered? The answers to these questions could provide very interesting insights for the research community and the proposal of automatic and user-friendly methods to better quantify the development of the children.
The main contributions of the present work are:
-
•
An in-depth revision of recent works studying children’s interactions on mobile devices (using both finger and stylus), as well as the analysis of motor and cognitive development.
-
•
Validate the potential of the different tests included in the ChildCI framework in terms of the motor and cognitive development of the children. We propose a feature set with over 100 global features based on cognitive and motor aspects of children while interacting with mobile devices, some of them collected and adapted from the literature.
-
•
Analyse whether there is any relationship between the chronological age of the children and their motor and cognitive development while interacting with the tests included in ChildCI. To shed some light on this, experiments are carried out for the task of children age group detection based on their motor and cognitive behaviors. Three groups are considered: 1 to 3 years, 3 to 6 years, and 6 to 8 years. Different acquisition inputs are considered in the analysis, i.e., stylus and finger. In addition, single- and multiple-test experiments are studied. Experiments are performed including several automatic feature selection techniques and machine learning approaches.
The remainder of the article is organised as follows. Sec. II summarises previous studies on children’s touch and stylus interaction, as well as some sets of features successfully used in literature for different lines of work. In the following, we describe in Sec. III the ChildCI framework and database used in the experimental work carried out. Sec. IV describes the proposed feature set based on motor and cognitive aspects of the children. Sec. V describes the experimental protocol and the results achieved for the task of children age group detection. Finally, Sec. VI draws the final conclusions and future work.
II Related Works
II-A Children Interaction: Stylus vs Finger
From such an early age and throughout their development, children experience different evolutionary stages in which their physiological and cognitive capacities improve through continuous interaction with the world they live. Piaget and Inhelder were the leaders of the study of children’s motor and cognitive development and, according to their theory [6], children pass in a fixed sequence through four universal stages of development: i) Sensorimotor (from birth to 2 years), children focus on acquiring knowledge by using their senses to touch, smell, see, taste, and hear the objects around them; ii) Preoperational (2-7 years), their language and thinking improve together with their motor skills. In addition, at this age children are egocentric in their thinking and it is still difficult for them to empathise with other people’s feelings; iii) Concrete Operational (7-11 years), children begin to use more logical thinking to solve problems, starting to improve their empathic abilities significantly; and iv) Formal Operational (11 years to adulthood), they gain the ability to use abstract cognitive functions to think more about moral, philosophical, ethical, social, and political issues.
Children’s interaction with mobile devices has been evaluated and analysed by multiple research studies in recent decades. Focusing on the first stage of Piaget’s theory (Sensoriomotor, 0-2 years) there is not much work on the interaction analysis of children under the age of 2 with touchscreen devices, mainly due to the difficulty of capturing data with children at that age. If we focus on touch mobile interactions, Morante et al. presented a very interesting article in this line in [7] . In that work, the authors analysed the behaviors of children aged from 0 to 2 years. They concluded that children at 1 year of age can use the tap gesture intentionally to perform actions and at 2 years they are already able to understand some gestures such as tap and drag to navigate through apps. In [8] the authors assessed the mobile interaction of children aged 1 to 2 years through the analysis of videos from YouTube while they were recorded interacting with mobile devices. They concluded that children under 17 months tend to use both hands for interaction, an aspect that decreases sharply with age, leading to single-hand use.
Looking at the second stage of Piaget’s theory (Preoperational, 2-7 years), several studies have analysed the children’s interaction with mobile devices, in contrast with the first stage. For example, in the work presented by Vatavu et al. [9], a database of 89 children aged 3 to 6 years and 30 young adults was presented. This database was also considered in the experimental protocol of Vera-Rodriguez et al. [10]. In that work, classification rates above 96% were achieved for the adult-child detection task using an automatic system based on neuromotor skills. A similar research line was studied by Nacher et al. in [11] where the authors proposed a set of 8 different tests on a mobile device in order to measure the ability of children aged 2-3 years to perform touch gestures. The results showed that simple gestures such as tap, drag, and one-finger rotation can be performed by children in most cases. However, performing more complex gestures such as double tap, scale down, long press, and two-finger rotation is strongly influenced by the age of the child, with the older children’s group performing them easier and quicker than the younger ones. Chen et al. obtained similar conclusions in [12]. The authors found different children’s interaction behaviors with mobile devices by analysing the correlation between factors such as their age, grade level, motor and cognitive development, and how they performed touchscreen interaction tasks (target acquisition and gesture detection).
Interaction with mobile devices is not only done through the use of the finger, but also through an stylus [13, 14]. In general, writing and drawing require greater motor and cognitive development than simple touch gestures. Children start scribbling around the age of 2 years [15]. In [16], Rémi et al. studied the way children aged 3-6 years perform scribbling activities, concluding that there are significant differences in motor skills depending on the age. Another interesting work in this line is presented in [17] considering children 6-7 years old. The authors analysed the correlation between the performance of polygonal shape drawing and levels in handwriting performance. The results proved that there are different children’s drawing strategies that differ in their writing performance.
II-B Motor and Cognitive Development
The correct analysis and quantification of the motor and cognitive development of the children starts with a good definition of robust and discriminative features for the task. Previous studies in the field of Human-Computer Interaction (HCI) could provide interesting features that, after adapting them, could be very useful to analyse motor and cognitive aspects of the children.
For example, in [18] Ishii et al. developed a simple quantitative method to diagnose tremor using hand-drawn spirals and artificial intelligence. The Archimedes spiral is the reference test for the clinical diagnosis of diseases such as essential tremor or Parkinson. In that study, patients used a stylus to trace a spiral on a printed reference spiral and, by comparing the lengths of the reference spiral and the traced one, the total area of deviation between both was calculated, achieving results with success rates up to 79% in detecting people with essential tremor. In a similar work [19], Solé-Casals et al. proposed a new set of 34 features using only the x and y coordinate points of the strokes made by patients as they traced the Archimedes spiral using a pen stylus on a graphics tablet. In addition to tremor assessment, in [20] the authors proposed a test paradigm on a graphic tablet using different parameters to automatically quantify tremor characteristics and severity in real-time by extracting three parameters: i) the mean radial difference per radian, ii) the mean radial difference per second, and iii) the area under the curve of the frequency spectrum for the velocity. Tremor is directly related to fine motor actions such as pinching, writing, drawing and other small movements. Therefore, it is interesting to analyse the level of tremor in children as they grow up, because it will be higher or lower depending on their motor skills development.
An interesting article in this line was the work presented by Xu et al. in [21], where a variety of touch gestures were used to enhance the security and privacy of users based on the touch operations performed on their smartphone screens. Through the analysis of touch gestures such as swipe, drag and drop, tap or pinch, among others, the authors proposed a total of 132 features that identify the way each user interacts with the mobile device, achieving an Equal Error Rate (EER) of around 10% for all types of gestures and 1% for the swipe operation where the Largest Deviation Point (LDP) was considered. Another interesting study on this line was carried out by Vatavu et al. in [22], where through the features extracted using the touch coordinates x and y, it was possible to detect the age group of the users reaching up to 86.5% accuracy. A similar study was conducted in [23], where the authors proposed a novel approach to protect society from online threats through the interaction of 147 participants with six micro-games in an Android app. A dataset of more than 9,000 touch gestures was created, characterising how participants interact with the device and achieving results up to 88% accuracy detecting impostors.
III ChildCI Framework
As we preliminary presented in [5], ChildCI is an on-going project mainly intended to improve the understanding of children’s motor and cognitive development along time through the interaction with mobile devices. Stylus and finger are used as acquisition tools, capturing data and storing it in our novel ChildCI database (ChildCIdb_v1\dbfootnote). This is a database collected in collaboration with the school GSD Las Suertes in Madrid (Spain), which is planned to be extended yearly, allowing for interesting longitudinal studies. To the best of our knowledge, ChildCIdb_v1 is the largest and most diverse publicly available Child-Computer Interaction (CCI) dataset to date on the topic of the interaction of children with mobile devices. It is composed of 438 children in the ages from 18 months to 8 years, grouped in 8 different educational levels according to the Spanish education system. In addition, during the capture process other interesting information from the children is also collected: i) previous experience using mobile devices, ii) grades at the school, iii) attention-deficit/hyperactivity disorder (ADHD), iv) birthday date, v) prematurity (under 37 weeks gestation). All this additional metadata makes the project more powerful and interesting, allowing for multiple lines of future research. This dataset is considered in the experimental framework of this study.
![[Uncaptioned image]](/html/2204.04236/assets/x1.png)
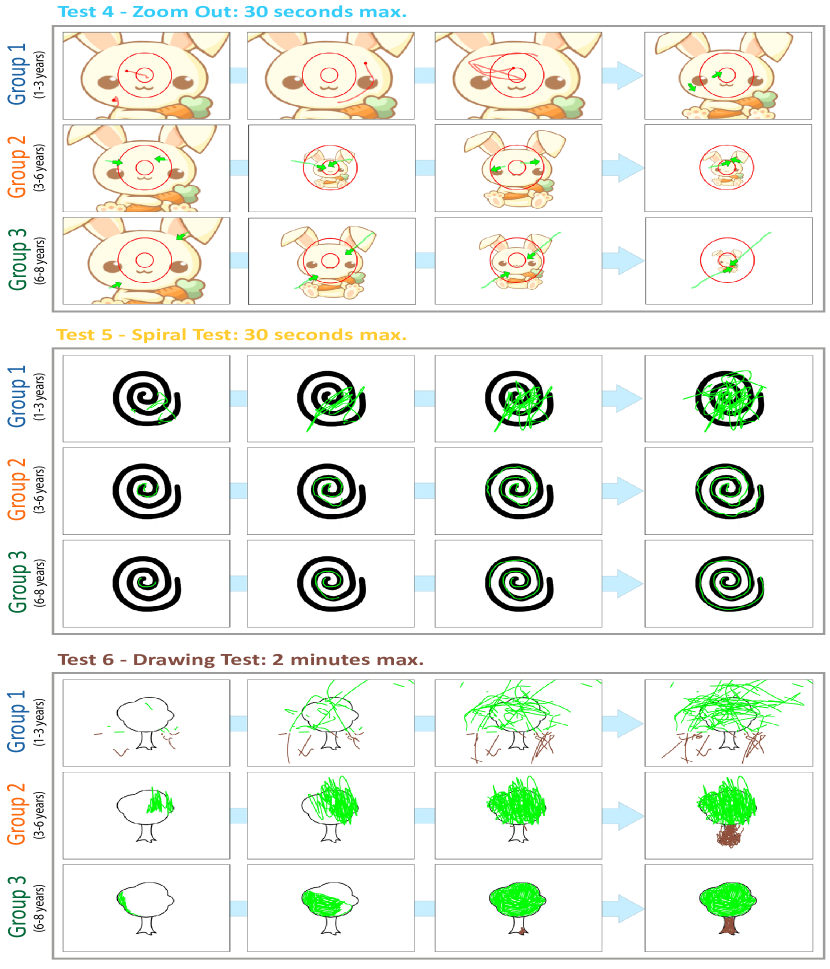
In particular, 6 different tests are considered in ChildCI, grouped in 2 main blocks: i) touch, and ii) stylus. Each one has a maximum amount of time to be performed and requires different levels of neuromotor and cognitive skills to be completed correctly. We briefly present next each of the tests:
-
•
Touch Block
-
–
Test 1 - Tap and Reaction Time: the screen shows 6 burrows and a single mole. When the children touch the mole using their finger it disappear from the current burrow and appear in another one at random. A total of 4 moles must be touched for the end of the test. Just a single finger is needed to complete the test. The maximum time for this test is 30 seconds.
-
–
Test 2 - Drag and Drop: a carrot appears on the left side of the screen and a rabbit on the right. The aim is to touch the carrot, drag it from left to right and drop it on the rabbit. Just a single finger is needed to complete the test. The maximum time for this test is 30 seconds.
-
–
Test 3 - Zoom In: two red circles and a little rabbit appear on the screen. The children have to enlarge the rabbit and put it inside these circles for a short period of time. The rabbit can be only enlarged/shortened using two fingers. The maximum time for this test is 30 seconds.
-
–
Test 4 - Zoom Out: the goal is similar to Test 3, except that in this case the rabbit is bigger and the children have to reduce its size to fit it inside the two red circles. Two fingers are needed to complete the test. The maximum time for this test is 30 seconds.
-
–
-
•
Stylus Block
-
–
Test 5 - Spiral Test: a black spiral appears on the screen. The children, using the pen stylus, must draw along the spiral from the inner to the outer part, always trying to keep inside the black line that forms the spiral. The maximum time for this test is 30 seconds.
-
–
Test 6 - Drawing Test: the outline of a tree appears on the screen and the children must colour it in as well as they can. The maximum time for this test is 2 minutes.
-
–
Examples of the different tests can be seen in Fig. III, grouped by age. We include red and green marks along the tests to provide a better comprehension of the children interaction along the different age groups.
IV Method
In order to shed some light on the questions considered in this study, i.e., i) validate the discriminative power of the different tests included in ChildCI, and ii) analyse whether there is any relationship between the chronological age of the children and their motor and cognitive development, the experimental framework of this study is carried out for the task of automatic children age group detection based on their motor and cognitive behaviors. Sec. IV-A describes the feature set proposed for each of the tests considered in ChildCIdb_v1. Sec. IV-B summarises the feature selection techniques considered. Finally, Sec. IV-C indicates the classification algorithms analysed.
IV-A Feature Extraction
During the data collection process, each child performs the set of tests shown in Fig. III. This section presents the proposed feature sets for each test. In total, 111 global features are extracted referring to different types of skills.
The features studied in this work cover aspects such as: i) the reaction time to touch the screen, ii) the amount of time touching the target, iii) the number of fingers used, and iv) whether the child finishes the test (4 moles are touched, the carrot ends up on the rabbit, the rabbit is properly scaled, etc.), among others.
In addition to the 111 global features presented above, 114 features based on preliminary studies in the field of HCI and related to Time, Kinematic, Direction, Geometry, and Pressure information are also considered [24, 25], forming a final set of 225 global features in total.
# Feature Description 1 Average Distance Between Tap and Centre of Mole 2 Standard Deviation Distance Between Tap and Centre of Mole 3 Maximum Distance Between Tap and Centre of Mole 4 Minimum Distance Between Tap and Centre of Mole 5 Number of Moles Touched
# Feature Description # Feature Description 1 Average LDP Size 2 Standard Deviation LDP Size 3 Average LDP Velocity 4 Standard Deviation LDP Velocity 5 Average Start-to-LDP Latency (ms) 6 Standard Deviation Start-to-LDP Latency (ms) 7 Average Straight Start-to-LDP Length 8 Standard Deviation Straight Start-to-LDP Length 9 Average Start-to-LDP Direction 10 Standard Deviation Start-to-Stop Direction 11 Average Start-to-Stop Latency (ms) 12 Standard Deviation Start-to-Stop Latency (ms) 13 Average Straight Start-to-Stop Length 14 Standard Deviation Straight Start-to-Stop Length 15 Average Start-to-Stop Direction 16 Standard Deviation Start-to-Stop Direction 17 Average LDP-to-Stop Latency (ms) 18 Standard Deviation LDP-to-Stop Latency (ms) 19 Average Straight LDP-to-Stop Length 20 Standard Deviation LDP-to-Stop Length 21 Average LDP-to-Stop Direction 22 Standard Deviation LDP-to-Stop Direction 23 Average Start Point Velocity 24 Standard Deviation Start Point Velocity 25 Average Stop Point Velocity 26 Standard Deviation Stop Point Velocity 27 The Carrot is Touched in the First Pen-Down 28 Carrot Ends Up in the Rabbit (Target)
# Feature Description # Feature Description 1 Total Time on Target (ms) 2 Reaction Time Until Using 2 Fingers (ms) 3 Maximum Scale 4 Minimum Scale 5 Average Scale 6 Standard Deviation Scale 7 # Samples Using 2 Fingers 8 # Samples Using 1 Finger 9 Average 10 Average 11 Average 12 Average 13 Trajectory Length 14 Trajectory Length 15 Trajectory Velocity 16 Trajectory Velocity 17 Start Distance Between Both Fingers 18 Stop Distance Between Both Fingers 19 Straight Length 20 Straight Length
# Feature Description # Feature Description 1 Spiral Length 2 Average (Distance Between Points) 3 STD (Distance Between Points) 4 Response Time (s) 5 Sample Entropy (SENT) [m=3, r=0.2] 6 Mean Absolute Value (MAV) 7 Variance (VAR) 8 Root Mean Square (RMS) 9 Log Detector (LOG) 10 Waveform Length (WL) 11 Standard Deviation (STD) 12 Difference Absolute Standard Deviation (ACC) 13 Fractal Dimension (FD) [Higuchi’s Algorithm with m=5] 14 Maximum Fractal Length (MFL) 15 Integrated EMG (IEMG) 16 Simple Square EMG (SSI) 17 Zero Crossing (ZC) [# Times the Signal Crosses Its Mean] 18 Slope Sign Change (SSC) [# Times the Slope of the Sign Changes] 19 Mean of Radial Difference Per Radian 20 Mean of Radial Difference Per Second 21 # Maximums in 22 # Minimums in 23 Global Maximum Quartile of 24 Global Minimum Quartile of
IV-B Feature Selection
The following feature selection techniques are used to choose the most discriminative features for each test from the total set originally extracted.
-
•
Sequential Forward Floating Search (SFFS): this is a widely used feature selection algorithm which searches for the best-correlated subset of features using a specific optimisation criteria. On the one hand, the solution offered by this algorithm is suboptimal because it does not take into account all possible combinations, but on the other hand it does consider correlations between features, achieving high-accuracy results [26]. The implementation considered in this study has been provided by the MLxtend library111http://rasbt.github.io/mlxtend/.
-
•
Genetic Algorithm (GA): this is a metaheuristic algorithm based on Charles Darwin’s theory of evolution. It is presented in our previous work [5] and is mainly inspired on the natural selection process of evolution, where over generations and through the use of operators such as mutation, crossover and selection, a positive evolution towards better solutions occurs. Our public version of this library developed in Python can be found on GitHub\gafootnote. In our experiments, we have considered an initial population = 200, a random generations = 100, a crossover rate = 0.6, and a mutation rate = 0.05.
IV-C Classification Algorithms
All classifiers are publicly available on Scikit-Learn222https://scikit-learn.org/stable/. The parameters used for each classifier are those with the best performance during the development stage.
-
•
Support Vector Machines (SVM): this algorithm builds a hyperplane or set of hyperplanes in a high- or infinite-dimensional space that differentiates the classes as well as possible. In our case, the regularization parameter is 0.1, the kernel type is “polynomial” with 3 degrees and the coefficient is “scaled”.
-
•
Random Forest (RF): this is an ensemble method consisting of a defined number of small decision trees, called estimators. A combination of the estimator’s decisions is produced to get a more accurate prediction. In our experiments, the number of estimators is 10, the function to measure the quality of a split is “gini” and the maximum depth of the tree is 75.
V Experiments and results
V-A Experimental Protocol
The experimental protocol considered in this work is designed with the aim of age group detection based on the children interaction behavior. The following 3 different age groups are considered: Group 1 (children aged 1 to 3 years), Group 2 (children aged 3 to 6 years), and finally Group 3 (children aged 6 to 8 years). ChildCIdb_v1 is divided into 2 data subsets: development (80%) and evaluation (20%). The development dataset is used for the training of the age group detection systems whereas the evaluation dataset is used to test the performance of the trained systems, excluding the children considered in the development dataset. In addition, and only during the development stage, a data augmentation technique is used as the data available in Groups 1 and 3 are smaller than in Group 2. This technique is called SMOTE and is publicly available in the Imbalanced-Learn toolbox333https://imbalanced-learn.org/stable/. To provide a better analysis of the results, -fold cross-validation with =5 is used, showing the final evaluation results of the 5 fold cross-validation. All experiments are run on a machine with an Intel i7-9700 processor and 32GB of RAM.
V-B Experimental Results
This section analyses the performance of the methods presented above to the children age group detection task based on motor and cognitive behaviors when interacting with mobile devices. The analysis is carried out in two different stages: i) a first test-by-test analysis is performed, and ii) then a combination of tests is conducted to analyse the potential of the ChildCI tests as a whole. The results obtained are measured in terms of Accuracy (%).
-
1.
Single-Test Scenario: Table V shows the results obtained in each test using the different classifiers and feature selectors considered.
We first analyse the results test by test using the best results achieved for each one. As can be seen, Test 6 obtains the best accuracy (90.45%), while the worst result is for Test 3 (81.33%). Children can draw the tree in many different ways. Therefore, in Test 6 they have more freedom to interact with the device and, as a result, the variation between groups can be better observed, leading to high accuracy in the age group detection task.
Analysing the results according to the classifier studied, SVM always achieves better results than RF, regardless of the feature selector used. In particular, SVM achieves an average accuracy of over 86%, while for RF the average is less than 83%.
It is also interesting to analyse the results by the type of feature selectors considered. In most cases, SFFS provides the best results, achieving in Test 1, Test 2, Test 5 and Test 6 rates above 87% accuracy. Nevertheless, GA performs better for Tests 3 and 4, reaching 81.33% and 82.45% accuracy. This proves the potential of our proposed feature selector algorithm that is publicly available\gafootnote.
In addition, we analyse the results according to the writing input used (stylus/finger). Always looking at the best tests for each input method, the results obtained in terms of accuracy are similar, indicating that the input method used is not really relevant for the age group detection task.
In order to show the results in a more visual way, we use a popular visualization technique, called Uniform Manifold Approximation and Projection (UMAP) [27]. Fig. 2 shows 2 examples of the children age groups formed based on the motor and cognitive features proposed in this study. Therefore, those children belonging to the same age group and whose motor and cognitive interactions on each test are similar should appear in the same group and placed contiguously to each other. As can be seen in both cases, there is a point cloud with 3 distinct groups, indicating a high correlation between the age of the children and the way they interact with mobile devices. However, some children are in a different point cloud to their own age group. For example, in the results of Test 6 in Fig. 2, we can see that there are children from Group 1 who are in the point cloud of Group 2. These particular cases could be an indicator that these children have more advanced motor and cognitive aspects than their age group.
TABLE V: Results achieved in terms of Accuracy (%) over the final evaluation dataset of ChildCIdb_v1 for each of the tests considered. We highlight in bold the feature selector and classifier that provide the best results. SFFS GA SVM RF SVM RF Finger Test 1: Tap and Reaction 89.79 87.71 88.51 85.00 Test 2: Drag and Drop 87.23 83.89 85.47 83.09 Test 3: Zoom In 80.22 78.14 81.33 78.15 Test 4: Zoom Out 79.74 79.26 82.45 80.22 Stylus Test 5: Spiral Test 88.67 82.93 85.16 81.33 Test 6: Drawing Test 90.45 88.69 81.51 80.37 In view of the results obtained, we can shed some light on the key questions analysed in this study. First, the validation of the discriminative power of the different tests included in the ChildCI framework. The results achieved in Table V prove that ChildCI tests are able to measure different children motor and cognitive features for the different ages. Second, the analysis of whether there is any relationship between the chronological age of the children and their motor and cognitive development. The point clouds shown in Fig. 2 indicate that there seems to be a good relationship between the motor and cognitive features proposed in this study and the chronological age of the children.
Finally, for completeness, we analyse in Fig. 3 the type of gestures and tests children are able to perform according to their chronological age. Test 6 (Drawing Test) is considered correctly completed when at least 70% of the tree surface is coloured. Looking at those gestures performed with the finger (Test 1 to 4), we can see how gestures such as tap or drag and drop are easily achievable from the age of 2-3 years. However, more complex gestures such as zoom-in (Test 3) and zoom-out (Test 4) are strongly influenced by the age of the child, as until the age of 3-5 years old they are not able to complete them in general. Similar conclusions can be observed for those cases where the child interacts with the stylus (Test 5 and Test 6), mainly due to the fine motor skills needed to perform this type of tests.
-
2.
Multiple-Test Scenario: In ChildCI framework there are 6 tests in total, so we have 6 pre-trained machine learning models, one per test (previous experiment). The present experiment analyses the potential of considering all the ChildCI tests together. We consider combinatorial operations with all possible test combinations. The number of combinations is indicated by the following equation:
(1) The number of total observations is represented by whereas refers to the number of selected elements. We combine the individual tests into groups of 2, 3, 4, 5, and 6 tests (all tests together). In total there are 57 possible combinations: i) 15 combinations in groups of 2 tests, ii) 20 combinations in groups of 3 tests, iii) 15 combinations in groups of 4 tests, iv) 6 combinations in groups of 5 tests, and v) 1 combination of all tests together.
TABLE VI: Best results in terms of Accuracy (%) for all the possible combinations, in groups of 2, 3, 4, 5 and 6 tests (, , , and ), of the different ChildCIdb_v1 tests. We highlight in bold the combination with the best result. Tap and Reaction Time Drag and Drop Zoom In Zoom Out Spiral Test Drawing Test Accuracy (%) ✓ ✓ 92.86 ✔ ✔ ✔ 93.65 ✓ ✓ ✓ ✓ 92.86 ✓ ✓ ✓ ✓ ✓ 92.06 ✓ ✓ ✓ ✓ ✓ ✓ 92.06
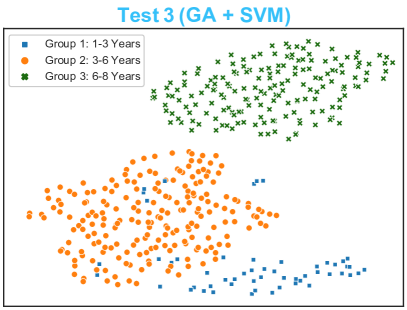
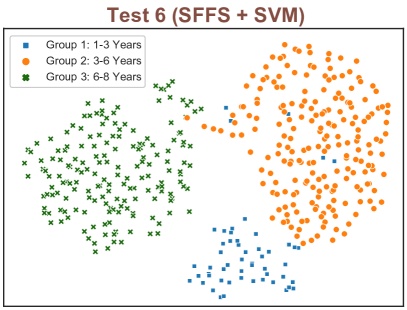
Figure 2: Examples of children age groups formed based on the motor and cognitive features proposed in this study. Three groups can be observed in each graph: ( Group 1) 1 to 3 years, ( Group 2) 3 to 6 years, and ( Group 3) 6 to 8 years. Each point refers to one child of ChildCIdb_v1. 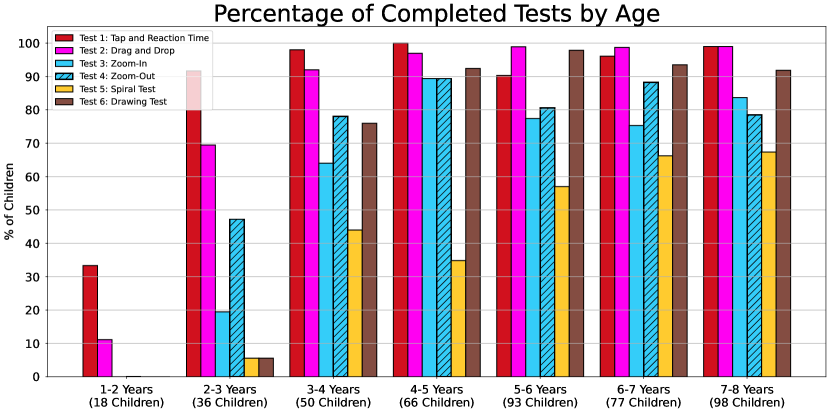
Figure 3: Percentage of ChildCI tests completed by the 438 children data captured in ChildCIdb_v1 according to their chronological ages. In particular, the machine learning models trained for each test during the development stage generates 3 probabilities (one for each children age group, values between 0 and 1) whose sum cannot exceed 1. To combine the different tests, a majority voting ensemble is considered. Then, the associated age group of a child is determined by the highest number of votes among the classifiers. For tie-breakers, an average of the probabilities generated for each set of grouped tests is calculated, with the highest value determining the age group associated with the child.
Table VI shows the best results in terms of accuracy for each group of test combinations (from 2-test to 6-test). In contrast to the results obtained in the single-test scenario, each combination has both tests performed with the stylus as the input method (Test 5 and Test 6). Therefore, in a multiple-test scenario, we can ensure that the tests performed with the stylus have higher discriminative power than those with the finger.
Each combination in Table VI obtains better results compared to the best result in the single-test scenario (90.45% in Test 6). In particular, the best combination is performed by Test 2, Test 5, and Test 6 (93.65%). Therefore, we can ensure that a combination of tests is a good practice to obtain better results for the children age group detection task.
VI Conclusion and Future Work
The proposal of automatic methods that quantify the motor and cognitive development of the children through the interaction with mobile devices is one of the main motivations of our ChildCI framework. As a first step to reach that future goal, this study proposes a comprehensive analysis evaluating the discriminative power of the tests presented in our ChildCI framework, and an analysis of whether there is any relationship between the chronological age of the children and their motor and cognitive development.
For each of the tests considered, a robust set of features representing cognitive and motor aspects of children during interaction with mobile devices is presented. The experimental framework of this study is carried out for the automatic children age group detection task based on similar motor and cognitive behaviors.
The results achieved shed some light on the questions and contributions analysed in this study. Indeed, there is a relationship between children’s chronological age, their motor and cognitive development and the type of test they are able to perform when interacting with mobile devices. Fig. 2 shows a high correlation between the age of the children and the way they interact with the devices, denoting the way in which the children perform the tests can give a rough indication of their chronological age group. Nevertheless, 100% accuracy is not achieved in the age group detection task because children’s evolution is a maturation process. This means that children of the same age group may have more/less advanced motor and cognitive aspects depending on their development.
In addition, the potential and discriminative power of the tests included in the ChildCI framework is proved. The results achieved in Table V demonstrate that ChildCI tests are able to measure different children motor and cognitive features for the different ages. This indicates both the correct design of the tests, discussed and approved by specialists such as neurologists, child psychologists and educators, and their inherent applicability to other research problems around e-Learning and e-Health.
Future works will be oriented towards: i) relating children’s interaction information with mobile devices to the other metadata stored in ChildCIdb (school grades, ADHD, previous experience using mobile devices, prematurity, etc.), ii) presentation of new versions of the database analysing longitudinally the evolution of children when performing the different ChildCIdb tests, and iii) take advantage of ChildCIdb’s potential in other e-Health and e-Learning research areas and problems.
Acknowledgements
This work has been supported by projects: PRIMA (H2020-MSCA-ITN-2019-860315), TRESPASS-ETN (H2020-MSCA-ITN-2019-860813), and INTER-ACTION (PID2021-126521OB-I00 MICINN/FEDER). This is an on-going project carried out with the collaboration of the school GSD Las Suertes in Madrid, Spain.
References
- [1] A. N. Antle and J. P. Hourcade, “Research in Child–Computer Interaction: Provocations and Envisioning Future Directions,” International Journal of Child-Computer Interaction, p. 100374, 2021.
- [2] H. K. Kabali, M. M. Irigoyen, R. Nunez-Davis, J. G. Budacki, S. H. Mohanty, K. P. Leister, and J. Bonner, Robert L., “Exposure and Use of Mobile Media Devices by Young Children,” Pediatrics, vol. 136, no. 6, pp. 1044–1050, 2015.
- [3] A. O. Kılıç, E. Sari, H. Yucel, M. M. Oğuz, E. Polat, E. A. Acoglu, and S. Senel, “Exposure to and Use of Mobile Devices in Children Aged 1-60 Months,” European Journal of Pediatrics, vol. 178, no. 2, pp. 221–227, 2019.
- [4] A. N. Antle and C. Frauenberger, “Child-Computer Interaction in Times of a Pandemic,” International Journal of Child-Computer Interaction, p. 100201, 2020.
- [5] R. Tolosana, J. C. Ruiz-Garcia, R. Vera-Rodriguez, J. Herreros-Rodriguez, S. Romero-Tapiador, A. Morales, and J. Fierrez, “Child-Computer Interaction with Mobile Devices: Recent Works, New Dataset, and Age Detection,” IEEE Transactions on Emerging Topics in Computing, pp. 1–1, 2022a.
- [6] J. Piaget and B. Inhelder, The Psychology of the Child. Basic books, 2008.
- [7] M. Morante, M. Costa, and N. Rodriguez, “Children’s Evolving Capabilities in Their Interaction with Touchable Devices from Birth to 2 Years Old,” in Proc. 15th International Conference on Interaction Design and Children, 2016.
- [8] J. P. Hourcade, S. L. Mascher, D. Wu, and L. Pantoja, “Look, My Baby Is Using an IPad! An Analysis of YouTube Videos of Infants and Toddlers Using Tablets,” in Proc. 33rd Annual ACM Conference on Human Factors in Computing Systems, 2015.
- [9] R.-D. Vatavu, G. Cramariuc, and D. M. Schipor, “Touch Interaction for Children Aged 3 to 6 Years: Experimental Findings and Relationship to Motor Skills,” International Journal of Human-Computer Studies, vol. 74, pp. 54–76, 2015.
- [10] R. Vera-Rodriguez, R. Tolosana, J. Hernandez-Ortega, A. Acien, A. Morales, J. Fierrez, and J. Ortega-Garcia, “Modeling the Complexity of Signature and Touch-Screen Biometrics using the Lognormality Principle,” in The Lognormality Principle and its Applications in e-Security, e-Learning and e-Health, R. Plamondon, A. Marcelli, and M. Ángel Ferrer, Eds., 2020, pp. 65–86.
- [11] V. Nacher, J. Jaen, E. Navarro, A. Catala, and P. González, “Multi-Touch Gestures for Pre-Kindergarten Children,” International Journal of Human-Computer Studies, vol. 73, pp. 37–51, 2015.
- [12] Z. Chen, Y.-P. Chen, A. Shaw, A. Aloba, P. Antonenko, J. Ruiz, and L. Anthony, “Examining the Link between Children’s Cognitive Development and Touchscreen Interaction Patterns,” in Proc. International Conference on Multimodal Interaction, 2020.
- [13] R. Tolosana, P. Delgado-Santos, A. Perez-Uribe, R. Vera-Rodriguez, J. Fierrez, and A. Morales, “DeepWriteSYN: On-Line Handwriting Synthesis via Deep Short-Term Representations,” in Proc. 35th AAAI Conference on Artificial Intelligence, 2021.
- [14] R. Tolosana and et al., “SVC-onGoing: Signature Verification Competition,” Pattern Recognition, 2022b.
- [15] S. Price, C. Jewitt, and L. Crescenzi, “The Role of iPads in Pre-School Children’s Mark Making Development,” Computers & Education, vol. 87, pp. 131–141, 2015.
- [16] C. Rémi, J. Vaillant, R. Plamondon, L. Prevost, and T. Duval, “Exploring the Kinematic Dimensions of Kindergarten Children’s Scribbles,” in Proc. Conference of the International Graphonomics Society, 2015.
- [17] N. Tabatabaey-Mashadi, R. Sudirman, R. M. Guest, and P. I. Khalid, “Analyses of Pupils’ Polygonal Shape Drawing Strategy with Respect to Handwriting Performance,” Pattern Analysis and Applications, vol. 18, no. 3, pp. 571–586, 2015.
- [18] N. Ishii, Y. Mochizuki, K. Shiomi, M. Nakazato, and H. Mochizuki, “Spiral drawing: Quantitative analysis and artificial-intelligence-based diagnosis using a smartphone,” Journal of the Neurological Sciences, vol. 411, p. 116723, 2020.
- [19] J. Solé-Casals, I. Anchustegui-Echearte, P. Marti-Puig, P. M. Calvo, A. Bergareche, J. I. Sánchez-Méndez, and K. Lopez-de Ipina, “Discrete Cosine Transform for the Analysis of Essential Tremor,” Frontiers in Physiology, vol. 9, 2019.
- [20] P.-C. Lin, K.-H. Chen, B.-S. Yang, and Y.-J. Chen, “A Digital Assessment System for Evaluating Kinetic Tremor in Essential Tremor and Parkinson’s Disease,” BMC Neurology, vol. 18, no. 1, p. 25, 2018.
- [21] H. Xu, Y. Zhou, and M. R. Lyu, “Towards Continuous and Passive Authentication via Touch Biometrics: An Experimental Study on Smartphones,” in Proc. 10th Symposium On Usable Privacy and Security, 2014.
- [22] R.-D. Vatavu, L. Anthony, and Q. Brown, “Child or Adult? Inferring Smartphone Users’ Age Group from Touch Measurements Alone,” in Proc. Conference on Human-Computer Interaction, 2015.
- [23] R. Zaccagnino, C. Capo, A. Guarino, N. Lettieri, and D. Malandrino, “Techno-Regulation and Intelligent Safeguards,” Multimedia Tools and Applications, vol. 80, no. 10, pp. 15 803–15 824, 2021.
- [24] R. Tolosana, R. Vera-Rodriguez, J. Fierrez, and J. Ortega-Garcia, “Feature-Based Dynamic Signature Verification Under Forensic Scenarios,” in Proc. 3rd International Workshop on Biometrics and Forensics, 2015.
- [25] M. Martinez-Diaz, J. Fierrez, J. Galbally, and J. Ortega-Garcia, “Towards Mobile Authentication Using Dynamic Signature Verification: Useful Features and Performance Evaluation,” in Proc. 19th International Conference on Pattern Recognition, 2008.
- [26] R. Tolosana, R. Vera-Rodriguez, J. Ortega-Garcia, and J. Fierrez, “Preprocessing and feature selection for improved sensor interoperability in online biometric signature verification,” IEEE Access, vol. 3, pp. 478–489, 2015.
- [27] L. McInnes, J. Healy, and J. Melville, “UMAP: Uniform Manifold Approximation and Projection for Dimension Reduction,” arXiv preprint arXiv:1802.03426, 2018.
![[Uncaptioned image]](/html/2204.04236/assets/x6.jpg) |
Juan Carlos Ruiz-Garcia received his B.Sc. degree in Computer Science Engineering in 2019 from the Universidad de Granada and got the M.Sc. degree in Research and Innovation in 2021 with the award of excellence from the Universidad Autonoma de Madrid, where he is currently pursuing a PhD degree in Computer and Telecommunication Engineering. In addition, in April 2020, he joined the Biometrics and Data Pattern Analytics - BiDA Lab as PhD researcher at the same university. His research interests are mainly focused on the use of machine learning for e-Learning, e-Health and Human-Computer Interaction. |
![[Uncaptioned image]](/html/2204.04236/assets/x7.png) |
Ruben Tolosana received the M.Sc. degree in Telecommunication Engineering, and his Ph.D. degree in Computer and Telecommunication Engineering, from Universidad Autonoma de Madrid, in 2014 and 2019, respectively. In 2014, he joined the Biometrics and Data Pattern Analytics - BiDA Lab at UAM, where he is currently an Assistant Professor. His research interests are mainly focused on signal and image processing, pattern recognition, and machine learning, particularly in the areas of HCI, DeepFakes, and Biometrics. He is author of several publications and collaborates as a reviewer in high-impact conferences (WACV, ICPR, ICDAR, etc.) and journals (TPAMI, TCYB, TIFS, TIP, etc.). |
![[Uncaptioned image]](/html/2204.04236/assets/images/authors/RubenVera2.jpeg) |
Ruben Vera-Rodriguez received the M.Sc. degree in telecommunications engineering from Universidad de Sevilla, Spain, in 2006, and the Ph.D. degree in electrical and electronic engineering from Swansea University, U.K., in 2010. Since 2010, he has been affiliated with the Biometric Recognition Group, Universidad Autonoma de Madrid, Spain, where he is currently an Associate Professor since 2018. His research interests include signal and image processing, pattern recognition, HCI, and biometrics. Ruben has over 140 scientific articles published in top international journals and conferences. He is actively involved in several National and European projects focused on biometrics. |
![[Uncaptioned image]](/html/2204.04236/assets/images/authors/2020_Fierrez.jpg) |
Julian Fierrez (MSc’01 PhD’06 from Universidad Politecnica de Madrid) is a Full Professor at Universidad Autonoma de Madrid, Spain. His research is on signal and image processing, AI fundamentals and applications, HCI, forensics, and biometrics for security and human behavior analysis. He is Associate Editor for Information Fusion, IEEE Trans. on Information Forensics and Security, and IEEE Trans. on Image Processing. He has received best papers awards at AVBPA, ICB, IJCB, ICPR, ICPRS, and Pattern Recognition Letters; and several research distinctions, including the IAPR Young Biometrics Investigator Award 2017. He is a member of the ELLIS Madrid Unit. |
![[Uncaptioned image]](/html/2204.04236/assets/images/authors/Foto_Jaime_HR.png) |
Jaime Herreros-Rodriguez (JHR) received his degree in Medicine in 2006 from Universidad Autónoma de Madrid, the title of neurologist in 2010 and he was awarded the title of Doctor in Medicine from the Universidad Complutense de Madrid (2019) with a distinction Cum Laude given unanimously for his doctoral thesis on migraine. He is also the author of several publications on migraine and parkinsonism. He has collaborated with different research projects related to many neurological disorders, mainly Alzheimer and Parkinson’s disease. JHR is a neurology and neurosurgery professor in CTO group, since 2008. |