Submitted to the Proceedings of the US Community Study
on the Future of Particle Physics (Snowmass 2021)
Probing Fundamental Physics With Multi-Modal Cosmic Ray Events
D. Beznosko1, K. Baigarin2, R. Beisembaev 3, E. Beisembaeva3, E. Gladysz-Dziadu4111Retired, V. Ryabov3, T. Sadykov5, S. Shaulov3, V. Shiltsev6, A. Stepanov3, M. Vildanova3, A. Zhitnitsky7, V. Zhukov3
1 Clayton State University, Morrow, GA 30260, USA
2 Nazarbayev University, Nur-Sultan, 010000, Kazakhstan
3 P.N.Lebedev Physical Institute of the Russian Academy of Sciences, Moscow, 119991, Russia
4 Institute of Nuclear Physics, Polish Academy of Sciences, Cracow, 31-342, Poland
5 Satbayev University, Institute of Physics and Technology, Almaty, 050000, Kazakhstan
6 Fermi National Accelerator Laboratory, Batavia, IL 60510, USA
7 University of British Columbia, Vancouver, V6T 1Z1, BC, Canada
Executive Summary
Since the middle of last century, researchers have observed EAS events with more than one pulse from the passage of particles in each detector. These events were called events with a delayed particle at the time, now they are also called multi-modal events. The first registration of such events was described by J. Jelley and W. Whitehouse [1] in 1953. Later, EAS exhibiting the unusual time structures were studied by several independent experiments, see e.g. [2]. EAS events with delayed particles were studied by British and US research groups in the 1960s-1980s, since the 1970s, delayed particles in EAS have been studied in Japan and also carried out at Moscow State University (MSU) and at LPI (TSHASS) and other groups. The conclusions that these articles give do not match and point to the lack of understanding of the nature of events with delayed particles.
The Horizon-T experiment in Tien Shan is based on the idea of measuring the time at which EAS disc passes the observation level with nanosecond accuracy. The detector system [3] consists of ten charged particles registration points located at distances of up to several hundred meters from each other. The points are equipped with detectors based on registration of Cherenkov radiation in glass and registration of scintillation light in polystyrene. The detectors register the arrival times of charged particles at the observation level with a resolution of 2 ns, as required to study the spatial and temporal characteristics of the EAS and the structure of the multi-modal events specifically. Over the period of the Horizon-T data taking since 2017 to present, a large number of multi-modal events were detected. The data has presented numerous challenges that show the direction towards the further development of the detector system and of the analysis methods and techniques that could be applied to these multi-modal events [4].
These recently observed Multi-Modal Cosmic Rays Events (MME) containing multiple peaks separated by tens to hundreds of ns are one of the most puzzling phenomena in high energy cosmic rays. These unusual cosmic ray events offer a potential new insight into the ultra-high energy astrophysics, the physics of fundamental particle interactions and cosmology. Surely, further experimental studies and independent verification of these events both at lower and high altitudes are needed to better understand the MME phenomenology. Theoretical insights are very much needed as well to guide future studies. It was recently proposed in [5] that these MMEs might be result of the dark matter annihilation events within the so-called axion quark nugget (AQN) dark matter model, which was originally invented for completely different purpose to explain the observed similarity between the dark and the visible components in the Universe, i.e. , without any fitting parameters.
Earlier, in the HADRON experiment on Tien Shan, the possible presence of a non-nuclear component in primary cosmic rays was established and it was assumed that this component could consist of stable particles of strange quark matter, strangelets [6] [7] [8]. So with a high probability, this version of the interpretation of the MME is preferable. Such a hypothesis was proposed in [9], where it was hypothesised that experimental observations of the MME could be the manifestation of penetration of a strangelets through the matter. We strongly encourage further discussions and elaborations on these and other physics explanations of the unusual multi-modal cosmic rays events.
We would like to attract attention to quite interdisciplinary nature of our proposal as it touches and overlaps with many fields of present-day active studies, including DM, baryogenesis, CR, nuclear physics, AMO, particle physics, astrophysics, cosmology, etc. Given limited success of conventional approaches to DM candidates such as WIMPs over the past few decades (as the LHC and dozen of DM detectors were no successful so far), we believe the proposed experimental studies of the MMEs together with further theoretical developments towards understanding their nature might help to formulate the so-much-required paradigm shift.
1 Introduction: Multi-Modal Events Observations To Date
An Extensive Air Shower (EAS) is a cascade of secondary particles in the atmosphere formed as a result of the interaction of very high energy 1014-20 eV primary cosmic particles with atomic nuclei in the Earth’s atmosphere [10]. The secondaries registered at the observation level come of several main components: electron-photon, hadron, muon, as well as Vavilov-Cherenkov radiation. Ultra-relativistic particles that are generated in the EAS cascade processes arrive at the observation level in a shape of a disc with up to several kilometers in diameter depending on the energy of the primary cosmic ray (PCR). Thickness of the disc can vary from about a meter (few nanoseconds in time) near the axis of the EAS to hundreds of meters at its periphery [11]. The most common type of EAS detectors system is a network of individual detectors that occupies a certain area large enough to encompass the EAS disk at the observation level as well as to register a sufficient number of events. Most often, the analysis uses the following data coming from individual detectors: the arrival time of the disc to determine the directions of PCR, and the particle density to estimate PCR energy and determine the position of the EAS axis relative to the detector system.
.
The first observations of EAS events with more than one pulse from the passage of particles in each detector – then called events with delayed particles - were reported by J. Jelley and W. Whitehouse in 1953 [1]. Then the EAS events with delayed particles were studied by British and US research groups in the 1960s-1980s [12, 13], later joined by other countries [14, 15, 16], including several experiments in Russia [17, 18, 19, 20]. These experiments employed different detectors, were of various spatial scales and located at different altitudes. The Horizon-T detector system at Tien Shan [21] is designed and built with the fastest ( 2 ns digitization resolution) particle detectors and with the scale of km as briefly described below. In all Horizon-T physics runs the unusual events with delayed pulses with several maxima have been recorded. These events cannot be fully explained by the physical processes of the standard model of EAS.
In Ref.[5] we summarize the most puzzling features of recent Horizon-1T observations [22, 23, 4, 24, 25]:
1. “clustering puzzle”: Two or more peaks separated by ns are present in several detection points, while entire event may last ns. It can be viewed as many fronts separated by ns, instead of a single front;
2. “particle density puzzle”: The number density of particles recorded at different detection points apparently weakly dependent on distance from Extensive Air Showers (EAS) axis;
3. “pulse width puzzle”: The width of each individual pulse is around ns and apparently does not depend on distance from EAS axis;
4. “intensity puzzle”: The observed intensity of the events (measured in units of a number of particles per unit area) is of order when measured at distances m from EAS axis. Such intensity would correspond to the CR energy of the primary particle on the level eV which would have dramatically different event rate in comparison with observed rate recorded by Horizon-T.
1.1 Horizon-T experiment
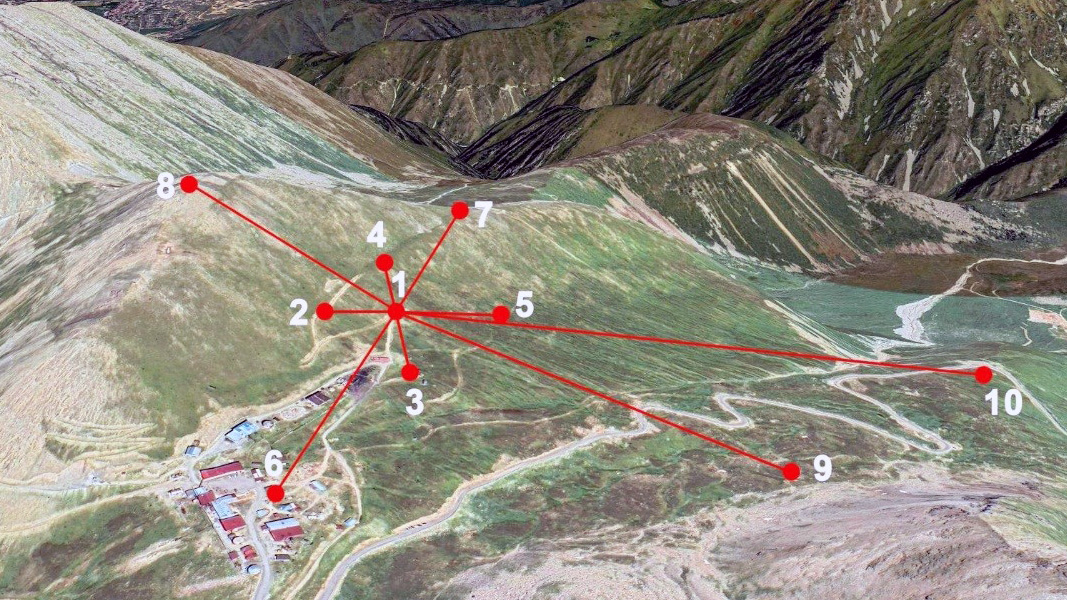
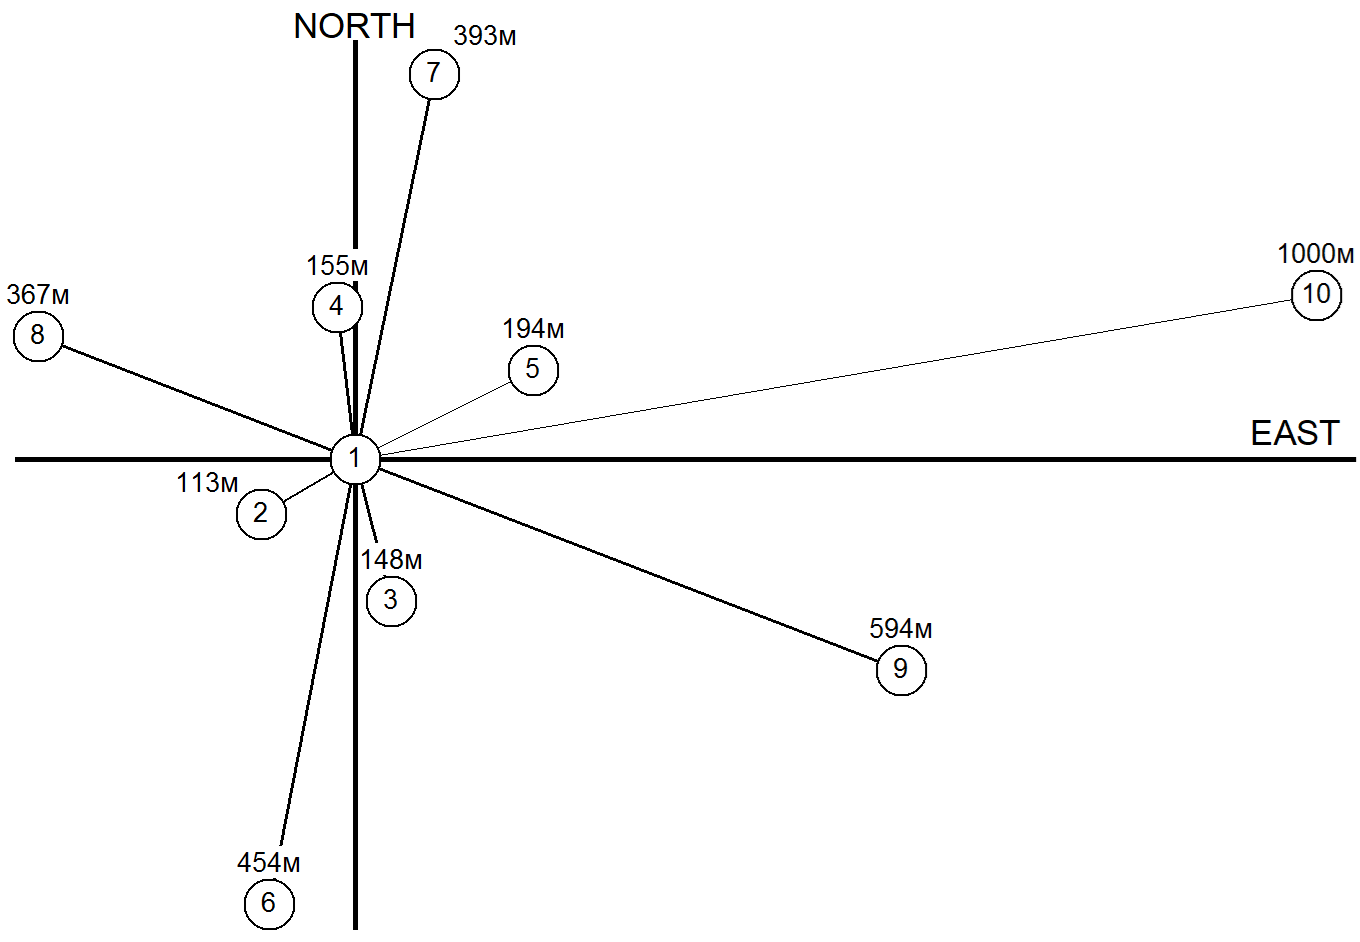
The Horizon-T experiment is deployed at the LPI RAS Tien Shan High-Altitude Scientific Station located at an altitude of 3340 meters above sea level near the city of Almaty (Republic of Kazakhstan). The experiment is aimed at studying the temporal structure of extensive air showers from primary cosmic rays with energies above 1016 eV, as well as studying delayed particles from the main shower front. Horizon-T comprises 10 detection points spaced up to 1400 meters from each other and tied to a common center - see Fig.1. The points are equipped with detectors based on registration of Cherenkov radiation in glass and registration of scintillation light in polystyrene. The detectors record the arrival times of charged particles at the observation level with a resolution of (2 ns), as required to study the spatial and temporal characteristics of the EAS. The EAS-induced signals from all the detectors are transmitted via high-frequency cables to the central point and digitized with a resolution of 2 ns.
.
The experiment employs scintillation radiation detectors (SC-detectors) with a particle detection medium of area of 100100 cm2 and a thickness of 10 cm (5 cm in points 6, 7, 9, 10) oriented in the XY plane (horizontal). The detection medium used is P-terphenyl in polystyrene. The signal is read by Hamamatsu R7723 photomultipliers (PMT) with a diameter of 51 mm (in the assembly R7723 Y003) in points 1-8, and Hamamatsu R1250 with a diameter of 127 mm (in the assembly H6527) in points 9 and 10. Points 1-5 are additionally equipped with fast detectors of Cherenkov radiation in glass (GL-detectors) with the detection medium area of 5050 cm2 and a thickness of 3 cm, oriented in the XY plane (horizontal) with Hamamatsu R7723 PMT readout. The pulse rise time for glass detectors is 2.1 ns and total pulse width is 5 ns. Each detector is connected by a high-frequency cable to a data acquisition system located in the detection point 1.
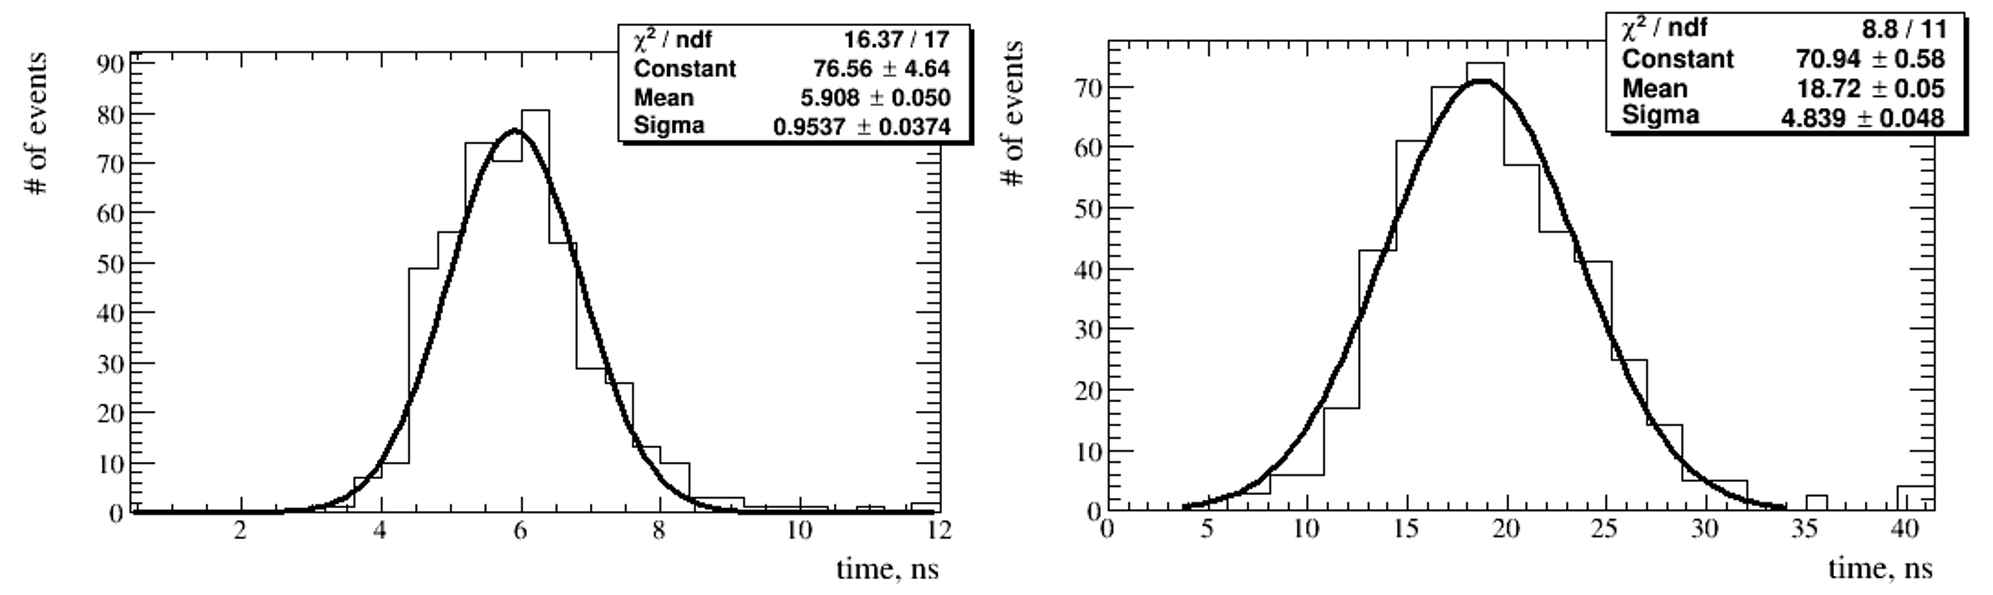
The Horizon-T system has the EAS detection thresholds energy varying from 1016 eV at zero zenith angle to 2eV at 80 degrees. The EAS pulse width uncertainty is several ns and depends on the scintillator light yield time (5 ns in scintillator or 0.5 ns in glass), PMT electron transit time spread (1.2 ns), ADC bin width (2 ns), and some pulse broadening in the high-frequency signal cable depending on the cable length - see Fig.2.
That considerable recent improvement in time resolution (to the level of a few ns) and the DAQ system able to recognize signals with complicated (multi-pulse) time structure have allowed the Horizon-T collaboration dramatically improve the detection, collection efficiency and analysis of the MMEs. In particular, with hours of operation in 2016-2019 several years, about 30 thousands high-energy CR events were recorded out of which more than a hundred of multi-modal events with pulse modes separated by hundreds of ns. In several events, the time separation reached up to a s. Recently, 26940 events with energy in excess of 2 eV were recorded over 1896 hours of operation in the period from December 12, 2019 to March 19, 2020. Out of those, 962 events with energies above eV had an unusual time structure including 217 impulses with two maxima. The number of EASs with a delay of the second pulse relative to the first pulse of less than 100 ns was 37, while 33 had the delay of more than 1000 ns.
.
1.2 Multi-modal events observations
.
Here we briefly describe the MME observations and argue why the observed events are inconsistent with conventional CR interpretation. In the conventional picture of the EAS, it is normally assumed that a) the EAS can be thought as a pancake-like disk with well defined EAS axis; b) the EAS represents an uniform structure without any breaks; c) the particle density drops smoothly with distance when moving away from the core, while d) the thickness of the EAS pancake increases with the distance from the core. This conventional picture describes well an overwhelming majority of the cosmic ray events but is in dramatic contradiction with observations of rare but well-detectable MME events.
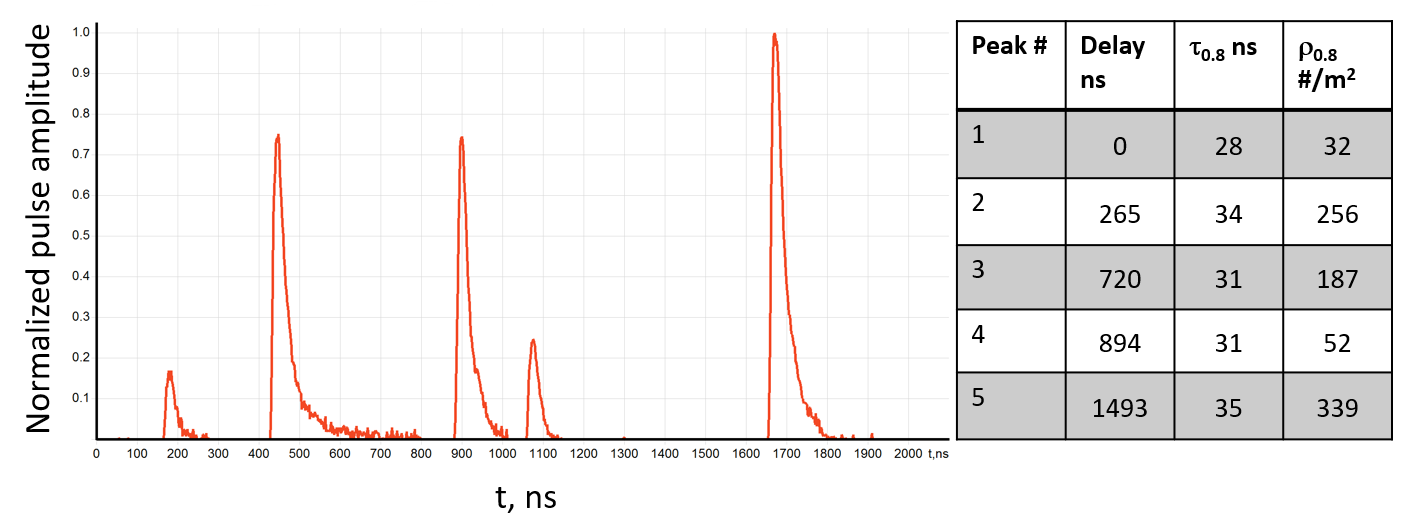
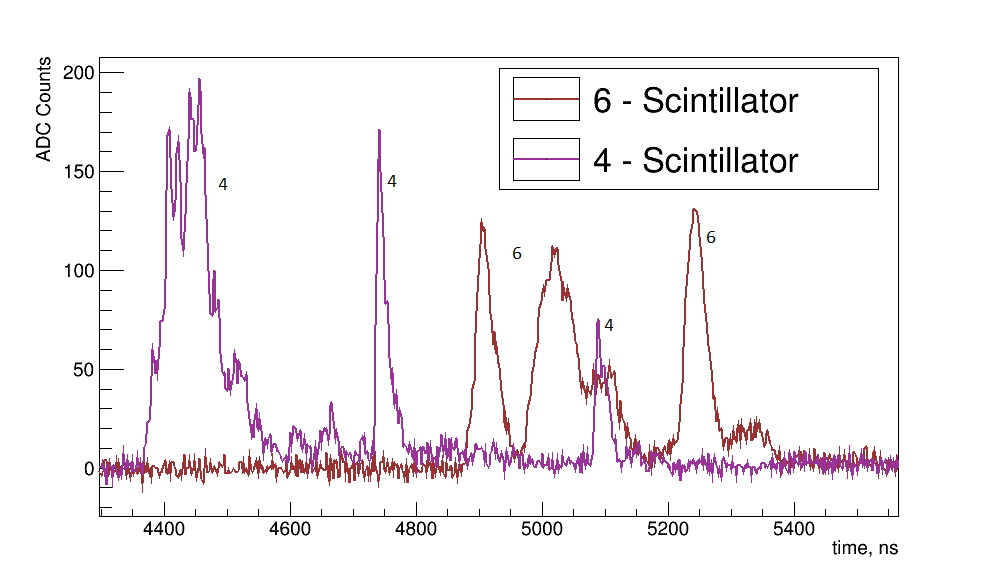
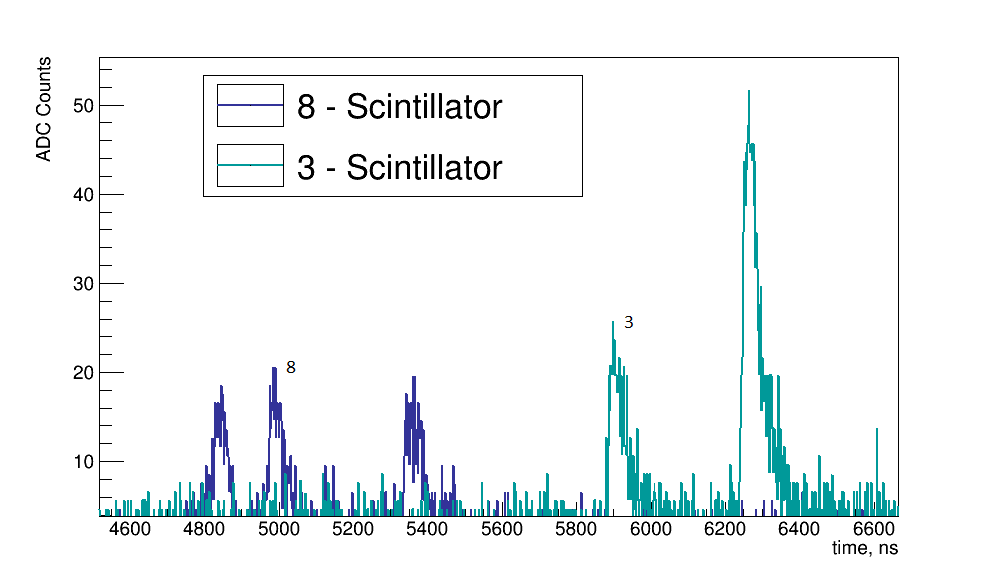
1. Indeed, a typical MME is shown in Fig. 3 where a complicated temporal features are explicitly seen. Several peaks separated by ns in a single detector represent the “clustering puzzle”, listed above. In the conventional EAS picture one should see a single pulse in each given detector with the amplitude which depends on the distance from the EAS axis. It is not what actually observed by the Horizon-T.
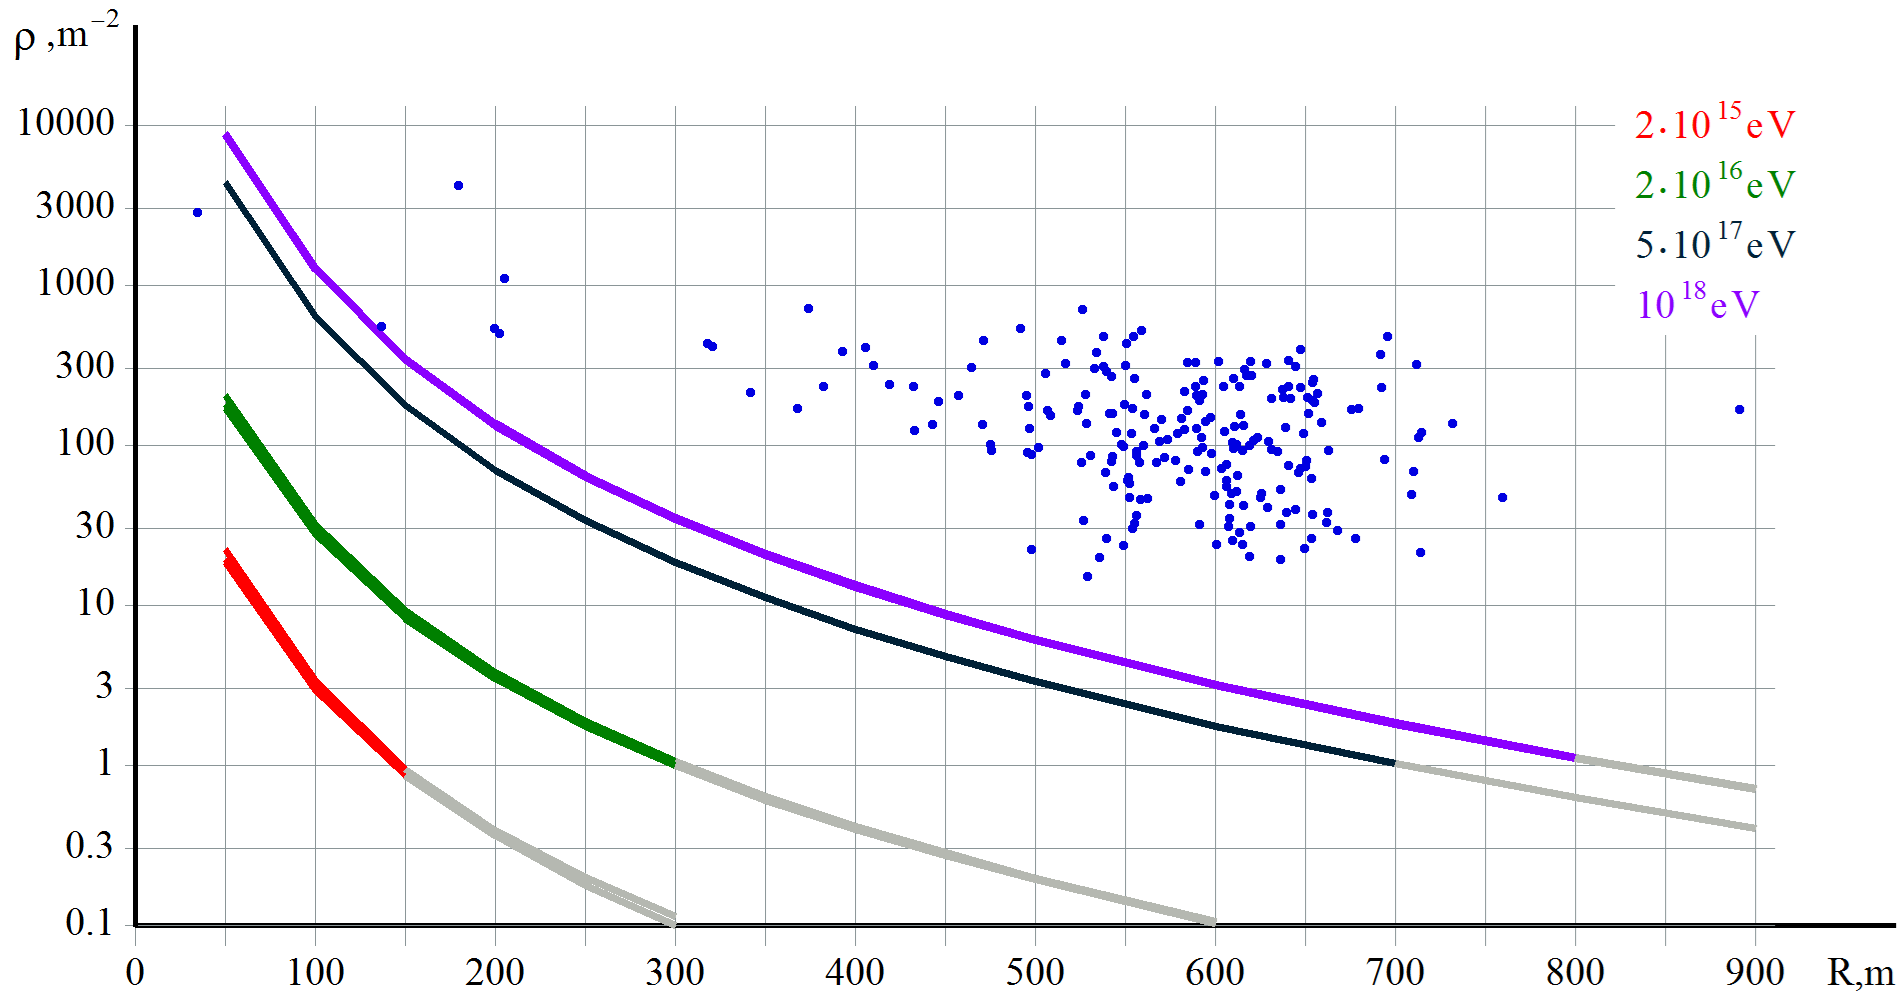
2. Fig. 4 manifests the “particle density puzzle”: particle density distribution for different CR energies in the EAS disk versus distance from axis are simulated with CORSIKA code [26] in shown by solid lines in different colors. In particular, for energy of the primary particle on the level of eV one should expect a strong suppression when distance to the EAS axis changes from m to m. It is not what actually observed by the Horizon-T: the density of the particles is not very sensitive to the distance to the EAS axis, and remains essentially flat for the entire region of observations. Furthermore, the magnitude of the density is much higher than it is normally expected for CR energies eV.
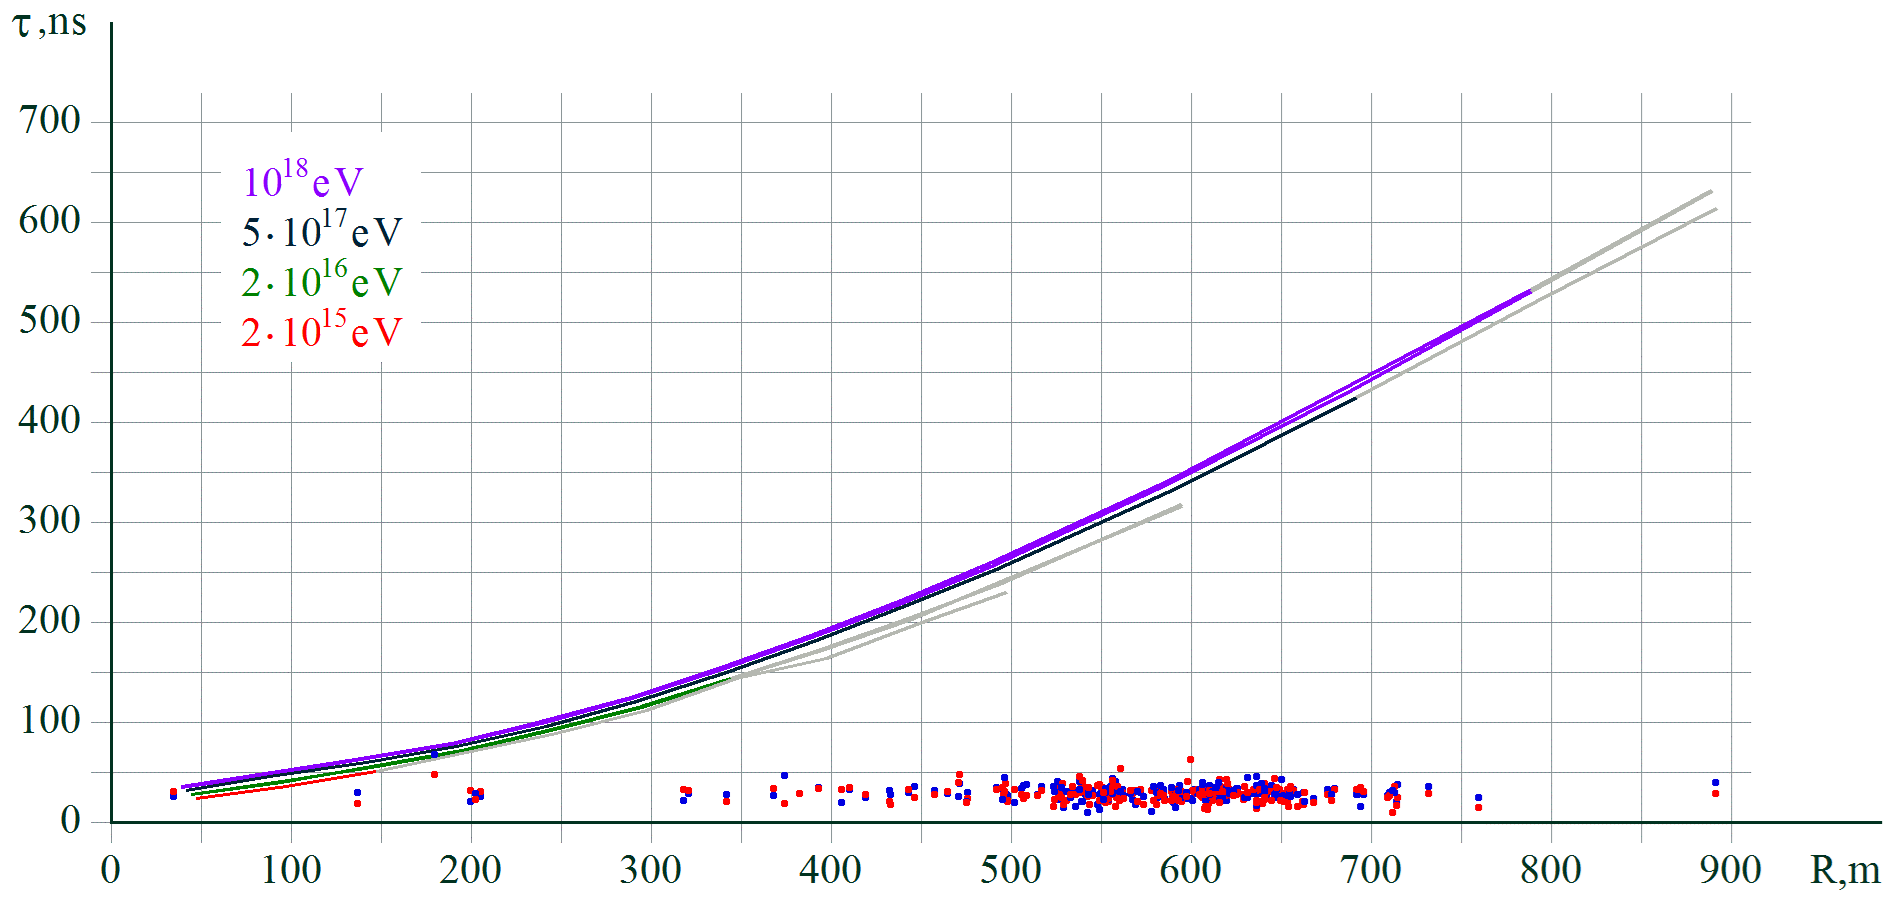
3. The manifestation of the “pulse width puzzle” is as follows. Fig. 5 presents the CORSIKA-simulated EAS disk width versus distance from axis for different energies – see solid lines in different colours. As explained above, the thickness of the EAS pancake is supposed to increase with the distance from the core. Therefore, the pulse width must also increase correspondingly as shown by sold lines on Fig. 5 for different energies. It is not what actually observed by the Horizon-T: all MME events show similar duration of the pulse width on the level of ns irrespective to the distance to the AES axis. This observation is in dramatic conflict with conventional picture as outlined above.
4. As for the “intensity puzzle”, Fig. 4 suggests that the charged particle density varies between particles per at the distances m from the EAS axis. This is at least factor above the expected for the primary particle with energy in the interval eV. Only the particles with energies well above eV could generate such enormous particle density as shown on Fig. 4. However the frequency of appearance for such highly energetic particles is only once every few years. Therefore, the intensity of the events estimated from for MME is several orders of magnitude higher than the energy estimated by the event rate (on base of standard model of the EASs). This shows a dramatic inconsistency between the measured intensity and observed event rate carried out by one and the same detector.
All the puzzles presented above imply that the MMEs detected by the Horizon-T are not the conventional CR air showers as they demonstrate enormous inconsistency with standard CR interpretation. What it could be? In the following sections we present arguments that the observed puzzling features could possible be the manifestation of either the dark matter (DM) particles in form of axion quark nuggets (AQNs) hitting the Earth’s atmosphere or signs of propagation of strangelets through the matter.
.
2 Possible Physics Explanations of the MMEs: AQN
2.1 Axion Quark Nuggets (AQN). The basics.
The AQN dark matter model [27] was invented long ago with a single motivation to explain in natural way the observed similarity between the dark matter and the visible densities in the Universe, i.e. without any fitting parameters. We refer to recent brief review [28] on the AQN model. Below we outline few key elements of the AQNs of relevance to this proposion.
The AQN construction in many respects is similar to the Witten’s quark nuggets, see [29, 30, 31]. This type of DM is “cosmologically dark” not because of the weakness of the AQN interactions, but due to their small cross-section-to-mass ratio, which scales down many observable consequences of an otherwise strongly-interacting DM candidate. It explains the similarity between the dark and visible densities in the Universe, i.e. as as both component, the visible and the dark, are proportional to one and the same dimensional parameter , see brief review [28] for the details.
The key feature of the AQN model which plays absolutely crucial role for explanations of the MMEs is that nuggets can be made of matter as well as antimatter during the QCD transition. One should emphasize that AQNs are absolutely stable configurations on cosmological scales. Furthermore, the antimatter which is hidden in form of the very dense nuggets is unavailable for annihilation unless the AQNs hit the stars or the planets when it may lead to observable phenomena.
2.2 AQN-model to explain the MME observations
We overview the basic ideas on how the puzzling features listed in Introduction can be understood within AQN framework
1. “clustering puzzle”: The multiple number of events is a very generic feature of the system as explained in [5]. Furthermore, the AQN itself remains almost at the same location as the displacement during entire cluster of events is very tiny
| (1) |
which implies that all individual bunches making the cluster are likely to be emitted by the AQN along the same direction, and can be recorded and classified as MME by the Horizon-T. Each event can be viewed as an approximately uniform front as mere notion of the “EAS axis” does not exist in this framework, see also next item. However, each individual event may appear to arrive from slightly different direction due to the inherent spread of the emitted electrons at the moment of eruption.
2. “particle density puzzle”: Particle density distribution in the AQN framework shows strong fluctuation from one event to another event. These variations are mostly related to the intensity of the individual bursts being expressed by the number of electrons in the bunch . However, the distinct feature of the distribution in the AQN framework is that it does not depend on , as the notion of the “EAS axis” does not exist in this framework as we already mentioned. All these generic features of the AQN framework are perfectly consistent with the Horizon-T observations as presented on Fig. 4. However, these observed features are in dramatic contradiction with conventional EAS prediction shown by solid lines on Fig. 4 with different colours, depending on energy of the CR.
Furthermore, the magnitude of the density in the AQN framework (which is mostly determined by parameter ) is much higher than one normally expects for CR energies eV. The corresponding parameter representing the number of electrons in the bunch was not fitted for the present studies to match the observations. Instead, it was extracted from different experiment in dramatically different circumstances (in proposal [32] to explain the ANITA anomalous events as the AQN events).
3. “pulse width puzzle”: In the AQN framework the width of the pulse cannot vary much from one event to another. It is a fundamental feature of the framework because the duration of the pulse is entirely determined by internal dynamics of the AQN during the blast. This feature is in perfect agreement with observations [24]
| (2) |
for all recorded MMEs. At the same time, this feature is in dramatic conflict with conventional picture when the duration of the pulse must depend on the distance to the EAS axis as shown by sold lines on Fig. 5. This basic prediction of the conventional CR analysis is due to increase of the thickness of the EAS pancake with the distance from the EAS axis. As we already mentioned the mere notions such as the “EAS axis” and the “thickness of the EAS pancake” do not exist in the AQN framework.
4. “intensity puzzle”: Particle density distribution in the AQN framework is estimated in [5]. The corresponding event to event fluctuations do not depend on the distance to the EAS axis as we already mentioned. Such intensity of the events as estimated in [5] in the AQN framework is consistent with observations shown on Fig. 4. However, the observations are in dramatic conflict with conventional CR analysis when such huge intensity could be generated by a primary particle with energy well above eV with dramatically lower event rate on the level of once every few years. The frequency of appearance in the AQN framework as estimated in [5] is consistent with observed event rate.
We conclude this section with the following comment: the emergent picture suggests that all the puzzles formulated above in Section 1.2 can be naturally understood within the AQN framework. One should emphasize that all phenomenological parameters used in the estimates in [5] had been fixed long ago for dramatically different observations in different circumstances for different environments.
In this context, it is important to mention that other CR laboratories had recorded a number of unexplained events. In particular, the Telescope Array (TA) collaboration had recorded mysterious bursts (see [33, 34] for explanations), the Pierre Auger Observatory had recorded the so-called Exotic Events (see [35] for explanations), the ANITA collaboration observed two anomalous events with non-inverted polarity (see [32] for explanations). All these events also present dramatic inconsistencies with conventional CR picture, similar to our items 1-4 discussed above. At the same time all these anomalies can be understood within the same AQN framework with the same set of parameters. What is more important is that the estimations of the event rates for all aforementioned anomalies (recorded by different instruments: H10T, TA, AUGER, ANITA) are based on one and the same flux of the AQNs hitting the Earth. In all those cases the observed frequency of appearance of the anomalous events is consistent with the AQN-based estimates, see [32, 33, 34, 35] for more details.
3 Stranglets as Possible Physics Explanations of the MMEs
Ref.[9] offers an alternative explanation of the MME phenomena as a clear manifestation of a strangelet passage through the matter. Such explanation is in line with earlier investigations [36] concerning the possible connection between the strongly penetrating cascades and the strangelets suggested to explain long-range many-maxima cascades observed in the lead chambers of the Pamir and Chacaltaya experiments [37, 38]. Similarly, it is hypothesised that the extraterrestial strangelets penetrating deeply into the atmosphere and degradated in the successive interactions with the air nuclei could be responsible for the observed multimodal events.
Besides the unusual properties of MMEs discussed above, another interesting feature is the increase of the time intervals between the successive peaks with both the distance of the detection station from the center of the event (event axis) and the time delay of the pulse relative to the first in time pulse registered by this station - see Fig.6. Therefore, it can be assumed that the earliest in time peak comes from the highest altitude and possibly produced by the EAS particles born in the first strangelet interaction with the air nuclei. In such scenario, the delay of the successive peaks and the length of time intervals between them decreases with the increase of the altitude of a possible strangelet interaction. On the other hand the length of the time distances between the successive modes is increasing with the distance of the detection point from the EAS axis – as experimentally observed for the MME events.
3.1 Multi-maxima MME events as signs of a strangelet passage through the air
Strangelets are hypothetical droplets of the stable strange quark matter, see, e.g. [29], while ”stable” strangelets [39] are the long-lived objects capable to reach and pass through the apparatus without decay. Hyperstrange multiquark droplets, having the strange to baryon ratio = 2.2 - 2.6 can be the subject of only the weak leptonic decays and their lifetime is estimated to be longer than 10-4 sec. Such long-lived objects should pass without decay not only through, e.g., thick Pb chambers but also, before evaporation into the bundle of neutrons, could travel the long distances in the atmosphere. While traveling, the ”stable” strangelet collides and interacts with the matter. The strangelet can be considered as the object of the radius
| (3) |
where the rescaled radius
| (4) |
and and are the chemical potential and the mass of the strange quark respectively and is the QCD coupling constant.
The idea of a possible strangelet detection by the EAS stations is based on the expectation that strangelets should have geometrical radii much smaller than the ordinary nuclei of the same mass number, and correspondingly, much smaller interaction cross sections. The signals detected by, e.g., the Horizon-T experiment are produced by the nuclear and electromagnetic cascades developing in the air – light absorber with its density changing with altitude. Fig.7a illustrates proposed explanation of the multimodal events due to ”stable” strangelet interactions in the air.
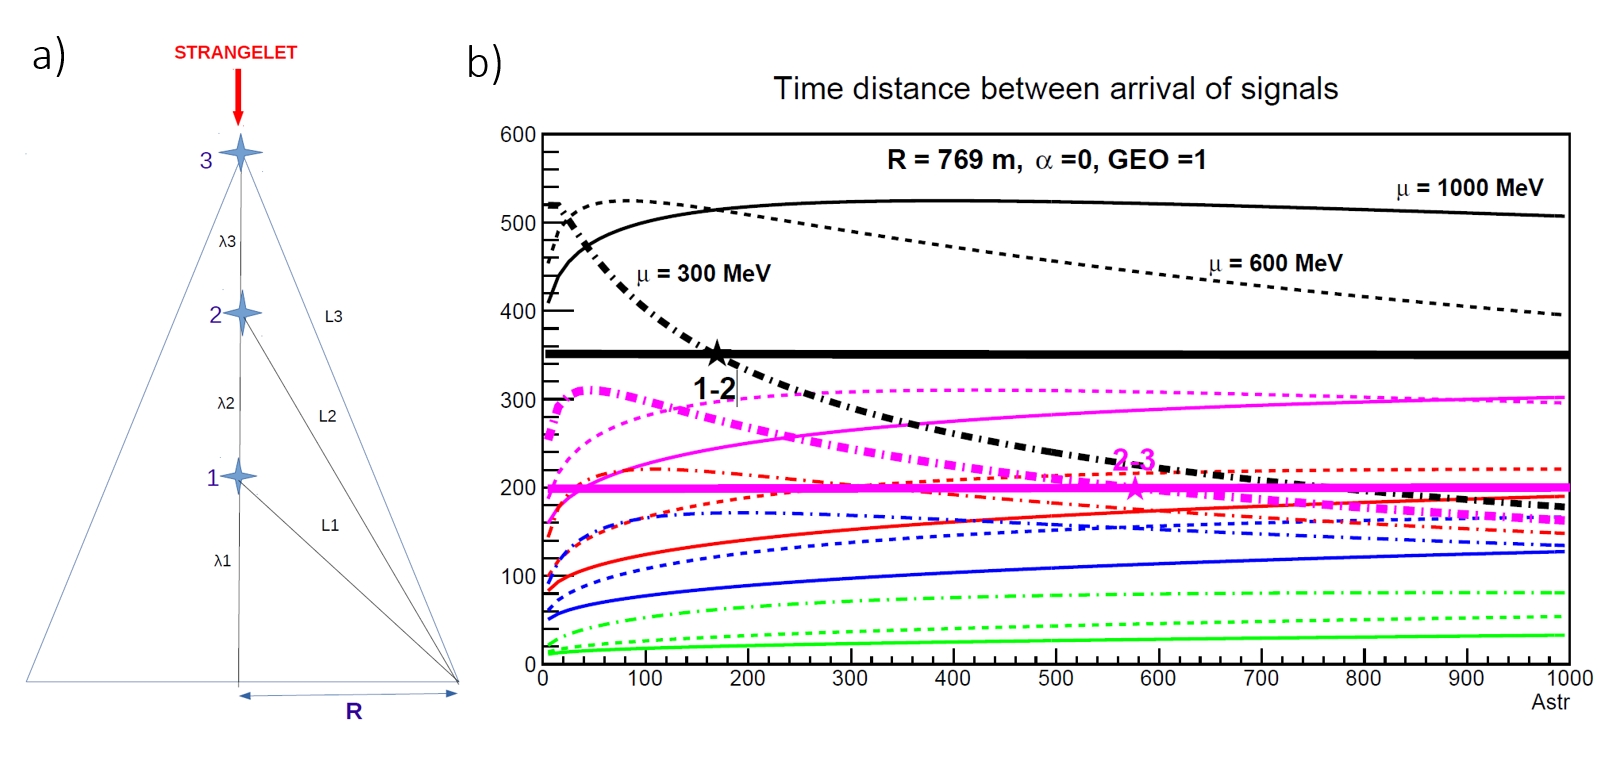
In such simplified model one assumes that:
-
•
Each of signals seen by the Horizon-T detector located at the same distance from the EAS axis comes from the successive strangelet interaction with the air nuclei. The most delayed peak, marked here by no 1 comes from a strangelet interaction at the altitude above the detection level, peak no 2 from a strangelet interaction at the altitude , peak no 3 from a strangelet interaction at the altitude , etc.
-
•
The distances between the successive strangelet interactions are equal to the values of the corresponding strangelet interaction paths. , where is the mean value of the strangelet interaction paths for the detected collisions.
-
•
The strangelet and the resulting nuclear-electromagnetic cascades propagate with the speed of light .
In such scenario, the first detected signal comes from the first strangelet interaction, i.e. the interaction at the highest altitude. The last signal comes from the strangelet interaction at the height from the detection level. In accordance with the experimental observations, time distances between the successive signals decrease with the increase of the strangelet interaction altitude (i.e. are the longest for the most delay signals, coming from interactions close to the detector level). This effect is additionally enhanced by the increase of the value with the decrease of in each of the successive interaction.
Calculations [9] of the proposed scenario are in good agreement with experimental characteristics of the Horizon-T MME events and predict the observed decrease of with the increase of as well as the increase of the altitude of a possible strangelet interaction - see Fig.7b.
To summarize: Several important features of all MME events are generally in accordance with the strangelet scenario:
-
1.
The signals detected by the stations located further from the event axis are more delayed
-
2.
The time intervals between the consecutive signals are correlated with their arrival times. Most delayed signals have longest , coming from interactions close to the detector level. This effect is aditionally enhanced by the increase of the strangelet interaction path with the decrease of a strangelet mass number in each act of the successive interaction.
Explanations of the ”particle density” and ”particle width” puzzles can be connected with the expected high transverse momentum of the strangelet decay/interaction products and the long distances between the successive strangelet interactions.
Authors of [40] simulated two EAS disks detected in the same distance from the EAS axis but the second disk has been delayed by 100 ns the first one. In that case two separate pulses have been detected close to the center of disks. At longer distances the multipeak structure was hardly distinguishable. However, the strangelet interaction paths are expected to be much longer than the assumed in [40] 100 ns distance between two EAS disks. Besides that two disks considered in [40] have been assumed to be separated only in time. The many maxima structure predicted by the strangelet scenario is the result of as well as a separation in time and the various heights of the successive strangelet interactions. So, we can expect that in accordance with the observations, signals from the consecutive strangelet interactions should be separated one to the other also at the longer distances from the event axis.
4 Future Outlook
4.1 Anticipated upgrades of Horizon-T
Besides the CR-based MME detector complex, there are several other EAS instruments available and operational at the Tien Shan facility and further development of the Horizon-T experiment will make it possible to integrate them as well. For that, it is proposed to place three additional SC-detectors at key points of the complex installation: in the center of a dedicated large area scintillation EAS shower facility (the ”carpet”), in the center of the underground EAS shower detector facility, and above the gamma block of the ionization calorimeter of the ”Hadron-55” experiment. Such integration will also require laying new cables, such as for transmitting the master pulse from the center of the Horizon-T installation. Creation of a unified data bank of the upgraded/integrated experimental facility will allow a comprehensive analysis of density and time data on EASs, understanding their relationship, establishing the energy threshold for the appearance of anomalous EAS and their differences from traditional EAS in the energy range above eV. That will also make possible detail studies of the longitudinal, spatial, and temporal structure of the detected EAS jets and stems. Installation of acoustic detectors (see Ch.4.3 below) is also under consideration.
4.2 Possible sea level measurements
The high importance of this discovery of unusual events calls for the independent verification of the unusual event detection and the accumulation of the data with such events for the subsequent analysis. The plans exist for the development, design, construction, and deployment of DUCK (Detector system of Unusual Cosmic-ray casKades), a cosmic-rays detector system aimed to verify and further study the latest results that were recently presented by the Horizon-T collaboration including the independent verification of the multi-modal event detection and the further study of these events. The detector will be constructed at the Clayton State University (CSU) campus. The location of the CSU campus is much different from the location of the Horizon-T detector system, the observation level for DUCK is only about 200 m above sea level.
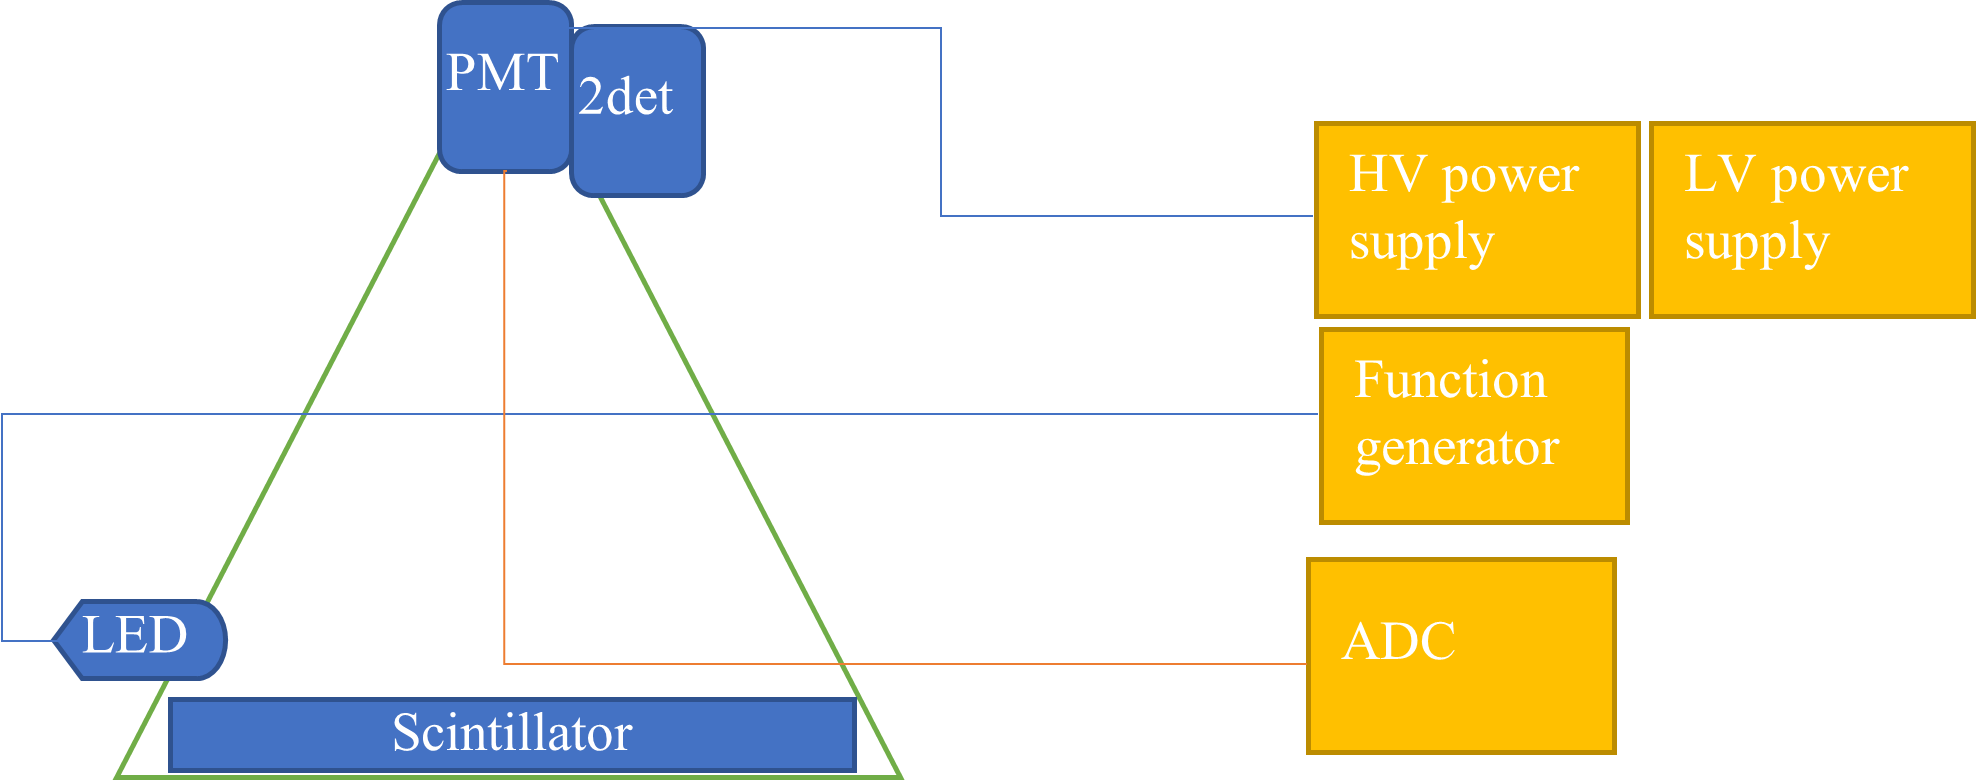
The basic detector design for DUCK system is improving upon the original Horizon-T system, and its schematic is shown in Fig. 8. It includes the PMT, the particle detection medium (i.e. scintillator, planned dimensions 110.1 m) and the LED and secondary detector (2det) for calibration purposes. A green line is the light and weather-tight housing of the module. The detectors are read by the analog-to-digital converter (flash ADC). The detectors are powered by individual mini-module high voltage power supplies (HV in the figure), that connect to common low-voltage power supply (LV). A total for 3 to 4 modules are planned for the initial DUCK system operations and the design is extendable with the funding availability.
4.3 Radio pulses and the distributed acoustic sensing (DAS)
The key element of the AQN based mechanism explaining the MMEs is the emission of the large number of relativistic electrons in form of the bunches. It is known that a large number of charged particles in the background of the geomagnetic field gauss will produce the radio pulse in both cases: the CR-induced radio pulse as well as AQN-induced radio pulse [32]. However, these pulses can be easily discriminated from each other. Indeed, the typical spectral features of the CR-induced radio pulses are:
1. The generic spectral feature of the CR-induced radio emission is the presence of oscillations which normally start around 100 MHz (depending on the distance from the shower axis). These oscillations are due to the coherence diminishing as the wavelength becomes shorter (in comparison to the “pancake” size in CR shower). While it is obviously affected by the detector’s filter, this feature is a physical effect due to changing number of coherent particles with different wavelengths.
2. Another typical feature of the CR-induced radio emission is that the most of the power is emitted at frequencies around MHz for eV shower. It is a result of very strong cutoff frequency MHz which strongly depends on features of the shower.
3.The cutoff frequency in CR air showers strongly depends on many parameters of the shower such as distance from the central axis when number of particles per unit area strongly depends on this parameter.
It should be contrasted with the AQN induced radio pulse with the cutoff frequency GHz which is determined by dramatically different physics [32]. The main reason for the drastic differences between these two radio pulses is that the AQN event could be viewed as an (approximately) uniform front of size several km with a constant width, while EAS is characterized by central axis. In different words, the number of particles per unit area in the AQN case does not depend on the distance from the central axis, in huge contrast with conventional CR air showers when strongly depends the distance from the central axis. The width of the “pancake” in CR air shower also strongly depends on . As a result, the effective number of coherent particles contributing to the radio pulse is highly sensitive to the width of the “pancake” when it becomes close to the wavelength of the radio pulse. These distinct features lead to very different spectral properties of the radio pulses in these two cases, which can be viewed as an independent characteristic of MMEs. We propose here that this unique feature can be used in future studies for purpose of discrimination and proper selection of the multi-modal clustering events.
The mysterious CR-like events can also manifest themselves in form of the acoustic and seismic signals, and could be in principle recorded if dedicated instruments are present in the same area where CR detectors are located. In this case the synchronization between different types of instruments could play a vital role in the discovery of the DM. In fact, in [41] it has been suggested to use distributed acoustic sensing (DAS) to search for a signal generated by an AQN propagating in the Earth’s atmosphere. It is interesting to note that a mysterious seismic event indeed has been recorded in infrasound frequency band by Elginfield Infrasound Array (ELFO). It has been interpreted in [41] as the AQN-induced phenomenon.
A complimentary path to search for the DM in form of the AQN annihilation events is to study the excess of the radiation in the central regions of the galaxy where DM and visible matter densities are relatively high. In particular, there is very strong excess of the diffuse UV emission which cannot be explained by conventional astrophysical sources as it dramatically deviates from locations of the UV emitting stars. As argued in [42] this puzzling diffuse UV emission can be naturally understood within the same AQN framework. One should emphasize that the corresponding estimates in dramatically different environment were based on the same basic parameters of the AQN model, being used in the present proposal interpreting the MME as the AQN annihilation events in the Earth’s atmosphere.
If our interpretation of the MME is confirmed by future studies (by studying the synchronized radio pulses or acoustic signals recorded by DAS) it would represent a strong argument suggesting that the resolution of two long standing puzzles in cosmology – the nature of the DM and the matter-antimatter asymmetry of our Universe– are intimately linked. The corresponding deep connection is automatically implemented in the AQN framework by its construction.
References
- [1] J. V. Jelley and W. J. Whitehouse, The Time Distribution of Delayed Particles in Extensive Air Showers using a Liquid Scintillation Counter of Large Area, Proceedings of the Physical Society. Section A 66 (may, 1953) 454–466. https://doi.org/10.1088/0370-1298/66/5/305.
- [2] J. Linsley and L. Scarsi, Arrival Times of Air Shower Particles at Large Distances from the Axis, Phys. Rev. 128 (Dec, 1962) 2384–2392. https://link.aps.org/doi/10.1103/PhysRev.128.2384.
- [3] R. Beisembaev, D. Beznosko, K. Baigarin, A. Batyrkhanov, E. Beisembaeva, O. Dalkarov, A. Iakovlev, V. Ryabov, T. Sadykov, S. Shaulov, et al., Performance of the Horizon-10T detector system in Physics Run 1, in EPJ Web of Conferences, vol. 208, p. 08008, EDP Sciences. 2019.
- [4] R. Beisembaev, D. Beznosko, K. Baigarin, A. Batyrkhanov, E. Beisembaeva, O. Dalkarov, A. Iakovlev, V. Ryabov, T. Sadykov, S. Shaulov, M. Vildanova, T. Uakhitov, and V. Zhukov, Extensive Air Showers with Unusual Spatial and Temporal Structure, in European Physical Journal Web of Conferences, vol. 208 of European Physical Journal Web of Conferences, p. 06002. May, 2019.
- [5] A. Zhitnitsky, Multi-Modal Clustering Events Observed by Horizon-10T and Axion Quark Nuggets, Universe 7 (2021) no. 10, 384, arXiv:2108.04826 [hep-ph].
- [6] S. B. Shaulov, Evidences for strangelet presence in primary cosmic rays, Acta Phys. Hung. A 4 (1996) 403–422.
- [7] S. B. Shaulov, A. L. Shepetov, E. A. Kupriyanova, V. A. Ryabov, and L. I. Vil’danova, Scaling violation in interaction of cosmic ray hadrons and the nature of the 3 PeV knee in the spectrum of primary cosmic rays, J. Phys. G 48 (2021) no. 12, 125202, arXiv:2111.09929 [astro-ph.HE].
- [8] A. L. Shepetov, S. B. Shaulov, O. I. Likiy, V. A. Ryabov, T. K. Sadykov, N. O. Saduev, and V. V. Zhukov, The rise of muon content in extensive air showers after the 3PeV knee of the primary cosmic ray spectrum according to data of the Tien Shan mountain installation, Astropart. Phys. 133 (2021) 102642, arXiv:2108.09921 [astro-ph.HE].
- [9] E. Gładysz-Dziaduś, Are multimodal events a sign of the strangelet passage through the matter?, arXiv preprint arXiv:2112.07294 (2021) .
- [10] M. V. Rao and B. V. Sreekantan, Extensive air showers. World scientific, 1998.
- [11] R. Engel, D. Heck, and T. Pierog, Extensive air showers and hadronic interactions at high energy, Annual review of nuclear and particle science 61 (2011) 467–489.
- [12] J. Linsley and L. Scarsi, Arrival times of air shower particles at large distances from the axis, Physical Review 128 (1962) no. 5, 2384.
- [13] A. Mincer, H. Freudenreich, J. Goodman, S. Tonwar, G. Yodh, R. Ellsworth, and D. Berley, Search for heavy long-lived particles in high-energy cosmic rays, Physical Review D 32 (1985) no. 3, 541.
- [14] M. Kawamoto, N. Inoue, Y. Misaki, O. Manabe, T. Takeuchi, and Y. Toyoda, Search for long-lived massive particles in extensive air showers, in 19th Intern. Cosmic Ray Conf-Vol. 8, no. HE-6.2-10. 1985.
- [15] P. Bhat, S. Gupta, P. R. Murthy, B. Sreekantan, S. Tonwar, and P. Viswanath, Delayed energetic events in extensive air showers, Physical Review D 25 (1982) no. 11, 2820.
- [16] G. Agnetta, M. Ambrosio, C. Aramo, G. Barbarino, J. Beaman, B. Biondo, D. Campana, O. Catalano, L. Colesanti, G. D’Ali, et al., Time structure of the extensive air shower front, Astroparticle Physics 6 (1997) no. 3-4, 301–312.
- [17] A. Glushkov, V. Kosarev, I. Makarov, I. Sleptsov, and S. Filippov, Temporal structure of the muon disk at large distances from the axis of extensive air showers with E0 above 6, Journal of Experimental and Theoretical Physics Letters 67 (1998) no. 6, 383–388.
- [18] N. Budnev, R. Wishnevski, O. Gress, A. Zabolotsky, A. Zagorodnikov, N. Kalmykov, V. Kozhin, E. Korosteleva, L. Kuzmichev, B. Lubsandorzhiev, et al., Tunka-133: Status 2008 and development of methods for data analysis, Bulletin of the Russian Academy of Sciences: Physics 73 (2009) no. 5, 588–592.
- [19] V. Atrashkevich, Y. A. Fomin, G. Garipov, B. Khrenov, G. Khristiansen, G. Kulikov, A. Silaev, V. Solovjeva, V. Sulakov, and O. Vedeneev, Temporal structure of scintillation detector pulse in EAS, Journal of Physics G: Nuclear and Particle Physics 23 (1997) no. 2, 237.
- [20] G. Garipov and A. Silaev, Search for Delayed and Advanced Particles in the Interaction of Ultrahigh-Energy Cosmic Rays with the Earth’s Atmosphere in the Flow of EAS Muons at the MSU EAS Setup, Physics of Atomic Nuclei 83 (2020) no. 3, 442–452.
- [21] R. Beisembaev, Y. N. Vavilov, N. Vildanov, A. Kruglov, A. Stepanov, and J. Takibaev, Delayed muons in extensive air showers and double-front showers, Physics of Atomic Nuclei 72 (2009) no. 11, 1852–1859.
- [22] D. Beznosko et al., Horizon-T experiment and detection of Extensive air showers with unusual structure, J. Phys. Conf. Ser. 1342 (2020) no. 1, 012007, arXiv:1605.05179 [physics.ins-det].
- [23] D. Beznosko, R. Beisembaev, K. Baigarin, E. Beisembaeva, O. Dalkarov, V. Ryabov, T. Sadykov, S. Shaulov, A. Stepanov, M. Vildanova, N. Vildanov, and V. Zhukov, Extensive Air Showers with unusual structure, in European Physical Journal Web of Conferences, vol. 145 of European Physical Journal Web of Conferences, p. 14001. June, 2017.
- [24] D. Beznosko, R. Beisembaev, E. Beisembaeva, O. D. Dalkarov, V. Mossunov, V. Ryabov, S. Shaulov, M. Vildanova, V. Zhukov, K. Baigarin, and T. Sadykov, Spatial and Temporal Characteristics of EAS with Delayed Particles., PoS ICRC2019 (2019) 195.
- [25] R. U. Beisembaev et al., Unusual Time Structure of Extensive Air Showers at Energies Exceeding 1017 eV, Phys. Atom. Nucl. 82 (2019) no. 4, 330–333.
- [26] D. Heck, J. Knapp, J. Capdevielle, G. Schatz, T. Thouw, et al., CORSIKA: A Monte Carlo code to simulate extensive air showers, Report fzka 6019 (1998) no. 11, .
- [27] A. R. Zhitnitsky, ‘Nonbaryonic’ dark matter as baryonic colour superconductor, JCAP10 (Oct., 2003) 010, hep-ph/0202161.
- [28] A. Zhitnitsky, Axion quark nuggets. Dark matter and matter–antimatter asymmetry: Theory, observations and future experiments, Mod. Phys. Lett. A 36 (2021) no. 18, 2130017, arXiv:2105.08719 [hep-ph].
- [29] E. Witten, Cosmic separation of phases, Phys. Rev. D30 (July, 1984) 272–285.
- [30] E. Farhi and R. L. Jaffe, Strange matter, Phys. Rev. D30 (Dec., 1984) 2379–2390.
- [31] A. De Rujula and S. L. Glashow, Nuclearites - A novel form of cosmic radiation, Nature312 (Dec., 1984) 734–737.
- [32] X. Liang and A. Zhitnitsky, The ANITA Anomalous Events and Axion Quark Nuggets, arXiv:2105.01668 [hep-ph].
- [33] A. Zhitnitsky, The Mysterious Bursts observed by Telescope Array and Axion Quark Nuggets, J. Phys. G 48 (2021) no. 6, 065201, arXiv:2008.04325 [hep-ph].
- [34] X. Liang and A. Zhitnitsky, Telescope array bursts, radio pulses and axion quark nuggets, Eur. Phys. J. C 82 (2022) no. 3, 249, arXiv:2101.01722 [hep-ph].
- [35] A. Zhitnitsky, The Pierre Auger Exotic Events and Axion Quark Nuggets, arXiv:2203.08160 [hep-ph].
- [36] M. N. Asprouli, A. D. Panagiotou, and E. Gladysz-Dziadus, Interaction length and spontaneous decay of a cosmic ray “Centauro” fireball, Astroparticle Physics 2 (1994) no. 2, 167–174.
- [37] Z. Buja, E. Gladysz, S. Mikocki, M. Szarska, L. Zawiejski, Proc. 17th ICRC, Paris 11 (1981) 104.
- [38] M. F. Collaboration, S. Bayburina, A. Borisov, K. Cherdyntseva, Z. Guseva, V. Denisova, A. Dunaevskii, E. Kanevskaya, V. Maximenko, S. Pashkov, et al., Nuclear interactions of super high energy cosmic-rays observed in mountain emulsion chambers, Nuclear Physics B 191 (1981) no. 1, 1–25.
- [39] E. Gladysz-Dziadus and Z. Wlodarczyk, Is the strongly penetrating component a sign of the strangelet passage through matter?, Journal of Physics G: Nuclear and Particle Physics 23 (1997) no. 12, 2057.
- [40] R. Beisembaev, E. Beisembaeva, O. Dalkarov, V. Ryabov, S. Shaulov, M. Vildanova, V. Zhukov, D. Beznosko, A. Iakovlev, A. Batyrkhanov, et al., The unusual structure detection in Extensive Air Shower events at Horizon-8T cosmic rays detector system, Proceedings of Science (ICHEP2018) (2018) 208.
- [41] D. Budker, V. V. Flambaum, and A. Zhitnitsky, Infrasonic, acoustic and seismic waves produced by the Axion Quark Nuggets, Symmetry 14 (2022) 459, arXiv:2003.07363 [hep-ph].
- [42] A. Zhitnitsky, The mysterious diffuse UV radiation and axion quark nugget dark matter model, Phys. Lett. B 828 (2022) 137015, arXiv:2110.05489 [hep-ph].