Checking HateCheck: a cross-functional analysis of behaviour-aware learning for hate speech detection
Abstract
Behavioural testing—verifying system capabilities by validating human-designed input-output pairs—is an alternative evaluation method of natural language processing systems proposed to address the shortcomings of the standard approach: computing metrics on held-out data. While behavioural tests capture human prior knowledge and insights, there has been little exploration on how to leverage them for model training and development. With this in mind, we explore behaviour-aware learning by examining several fine-tuning schemes using HateCheck, a suite of functional tests for hate speech detection systems. To address potential pitfalls of training on data originally intended for evaluation, we train and evaluate models on different configurations of HateCheck by holding out categories of test cases, which enables us to estimate performance on potentially overlooked system properties. The fine-tuning procedure led to improvements in the classification accuracy of held-out functionalities and identity groups, suggesting that models can potentially generalise to overlooked functionalities. However, performance on held-out functionality classes and i.i.d. hate speech detection data decreased, which indicates that generalisation occurs mostly across functionalities from the same class and that the procedure led to overfitting to the HateCheck data distribution.
Checking HateCheck: a cross-functional analysis of behaviour-aware learning for hate speech detection
Pedro Henrique Luz de Araujo and Benjamin Roth University of Vienna {pedro.henrique.luz.de.araujo, benjamin.roth}@univie.ac.at
1 Introduction
The standard method for evaluating natural language processing (NLP) systems—computing metrics on held-out data—may be a good indicator of model correctness, but tends to overestimate performance in the wild Ribeiro et al. (2020), does not indicate possible sources of models failure Wu et al. (2019) and overlooks potential dataset biases Niven and Kao (2019); McCoy et al. (2019); Zellers et al. (2019).
Behavioural testing of NLP models Röttger et al. (2021); Ribeiro et al. (2020) has been proposed as an additional evaluation methodology, where system functionalities are validated by checking specific input-output behaviour of the system. This is done through challenge sets: expert-crafted input-output pairs that capture human prior knowledge and intuition about how an agent should perform the task Linzen (2020) and enable systematic verification of system capabilities Belinkov and Glass (2019).
For the purposes of this paper, we consider a behavioural test suite to be a collection of test cases, input-output pairs that describe an expected behaviour. Each case assesses a specific functionality, which are grouped into functionality classes. For example, test cases in HateCheck Röttger et al. (2021), a test suite for hate speech detection, include (“[IDENTITY] belong in a zoo.”, hateful), (“No [IDENTITY] deserves to die.”, non-hateful) and (“I had this queer feeling we were being watched”, non-hateful). These cases assess the functionalities: implicit derogation of a protected group or its members, non-hate expressed using negated hateful statement and non-hateful homonyms of slurs111E.g., queer can be used as a slur for LGBT+ people, but also means strange, odd.. These functionalities are grouped into the derogation, slur usage and negation classes. A test suite may also contain aspects, relevant properties of test cases that are orthogonal to the functionalities. An example of aspect in HateCheck is the set of possible targeted identity groups.
While behavioural testing has been designed as a diagnostics tool, whether and how to leverage it for model training and development has seen little exploration, even though the human insights encoded in the test cases could potentially lead to more robust and trustworthy models. However, naively using behavioural testing for both training and evaluation is a risky affair—giving models access to the test cases could clue them into spurious correlations and lead to overestimation of model performance Linzen (2020). We view these risks as strong motivation to explore such settings, in order to gain insights into the vulnerability of behavioural tests to gaming and over-optimisation.
We explore three questions regarding behaviour-aware learning:
Q1: Do models generalise across test cases from the same functionality? This is a sanity check: test cases from the same functionality share similar patterns—sometimes generated by the same template—so we expect that behaviour-aware learning leads to better performance on test cases from functionalities seen during training.
Q2: Do models generalise from covered functionalities to held-out ones? By examining how behaviour-aware learning affects performance on held-out functionalities, we can estimate the robustness of the approach to potentially overlooked phenomena. Equivalently, performance decrease is an indicator of overfitting to functionalities covered during training.
Q3: Do models generalise from test cases to the target task? Improvements in the target task performance, as measured by independent and identically distributed (i.i.d.) data, would indicate that a model was able to extract the knowledge encoded in the behavioural tests. Conversely, a decrease in target task performance would signal overfitting to the behavioural test distribution.
In this paper, we explore behaviour-aware learning by fine-tuning pre-trained BERT Devlin et al. (2019) models on HateCheck 222Due to the nature of the task, this paper contains examples of abusive and hateful language. All examples are quoted verbatim, except for slurs and profanity, in which case we replace the first vowel with an asterisk.. We experiment with several splitting methods and evaluate on different sets of held-out data: test cases for covered functionalities (Q1), test cases for held-out functionalities (Q2), and hate speech detection i.i.d. data (Q3). In addition to HateCheck’s functionalities, we consider performance on held-out functionality classes and identity groups. By investigating our research questions, we address potential pitfalls and identify promising approaches for behaviour-aware learning333Our code is available on https://github.com/peluz/checking-hatecheck-code..
2 Related work
Traditional NLP benchmarks are created from text corpora assembled to reflect the naturally-occurring data distribution, which may fail to sufficiently capture important phenomena. Challenge sets were created as an additional evaluation framework, characterised by greater control over data that enables testing for specific linguistic phenomena Belinkov and Glass (2019). Ribeiro et al. (2020) proposed CheckList as a task-agnostic evaluation methodology with different test types that range from template-generated challenge sets to perturbation-based tests that enable checking behaviour on unlabelled texts. Inspired by CheckList, Röttger et al. (2021) created HateCheck, a test suite for hate speech detection models composed of hand-crafted and template-generated test cases whose design was motivated by interviews with civil society stakeholders.
Using challenge data and behavioural tests to explicitly drive model development and training has largely gone unexplored. McCoy et al. (2019) created HANS, a challenge set for natural language inference (NLI) designed to contradict classification heuristics that exploit spurious correlations in NLI datasets. They used the HANS templates to augment NLI training data, which helped prevent models from adopting such heuristics, though the improvement on held-out cases was inconsistent. Liu et al. (2019) proposed inoculation by fine-tuning, where a model originally trained on a non-challenge dataset is fine-tuned on a few examples from a challenge set and then evaluated on both datasets. They do not assess generalisation from covered to held-out functionalities, as they use samples from the same functionality for training and testing.
To the best of our knowledge, we are the first to examine cross-functional behaviour-aware learning by fine-tuning models on different configurations of test suite and task data and evaluating performance across multiple generalisation axes.
3 Cross-functional analysis of behaviour-aware learning
We experiment with different training configurations by fine-tuning a pre-trained model on data from two distributions: the task and the test suite. The model is fine-tuned either on one of the distributions or on both sequentially, first on the task and then on the test suite. We compare the performance of the resulting models on both data distributions to assess the impact of behaviour-aware learning considering both task and challenge data.
Test suites have limited coverage: the included functionalities, functionality classes and aspects are only subsets of the phenomena of interest. For example, HateCheck covers seven protected groups, which are particular samples of the full set of communities targeted by hate speech. Therefore, naive evaluation of models fine-tuned using test suite data can lead to overestimating their performance: models can overfit to the covered phenomena and pass the tests, but fail cases from uncovered phenomena (e.g., hate targeted at an uncovered identity group). Since we cannot directly evaluate performance on uncovered cases, we use performance on held-out sets of functionality, functionality classes and aspects as a proxy for generalisation across those three axes, as described in sections 3.2 and 3.4.
3.1 Task data
We use two hate speech detection datasets Davidson et al. (2017); Founta et al. (2018) as source of task data. Both are composed of tweets annotated by crowdsourced workers. The Davidson et al. (2017) dataset contains 24,783 tweets annotated as either hateful, offensive or neither, while the Founta et al. (2018) dataset contains 99,996 tweets annotated as hateful, abusive, spam or normal. We use the versions of the datasets made available444Available at https://github.com/paul-rottger/hatecheck-experiments/tree/master/Data. by Röttger et al. (2021), in which all labels other than hateful are collapsed into a single non-hateful label to match HateCheck binary labels. The data is imbalanced: hateful cases comprise 5.8% and 5.0% of the datasets, respectively. We follow Röttger et al. (2021) and use a 80%-10%-10% train-validation-test split for each of them.
3.2 Test suite data
We use HateCheck Röttger et al. (2021) as the test suite. It contains 3,728 test cases that cover 29 functionalities grouped into 11 classes. Röttger et al. (2021) created the set of functionalities based on interviews with 21 employees from NGOs that work with online hate. 18 of the functionalities deal with distinct expressions of hate, while the remaining 11 cover contrastive non-hate. The test cases were either automatically generated using templates or created individually. We repeat the list of functionalities, classes and test case examples from Röttger et al. (2021) in Appendix A.
Röttger et al. (2021) define hate speech as “abuse that is targeted at a protected group or at its members for being a part of that group”, while protected groups are defined based on “age, disability, gender identity, familial status, pregnancy, race, national or ethnic origins, religion, sex or sexual orientation”. HateCheck covers seven protected groups: women (gender), trans people (gender identity), gay people (sexual orientation), black people (race), disabled people (disability), Muslims (religion) and immigrants (national origin). In addition to the gold label (hateful or non-hateful), each test is labelled with the targeted group.
When fine-tuning on test suite data, we use one of several splitting methods, as illustrated in Figure 1:

All A random 50%-25%-25% train-validation-test split.
FuncOut We first hold out all test cases from a given functionality and randomly split the remaining cases into a 50%-50% train-evaluation split. We divide the union of held-out and evaluation split cases into a 50%-50% validation-test split. The process is repeated for each functionality, resulting in 29 split configurations.
IdentOut The same as FuncOut, but test cases relating to each identity group are held out, resulting in 7 split configurations.
ClassOut Similar to the previous two, but entire functionality classes are held out, resulting in 11 split configurations.
3.3 Training configurations
We consider the following training configurations:
Task-only Models are fine-tuned only on the task data. We denote the task-only configurations as Davidson and Founta, depending on which dataset was used for training.
Test suite-only Models are fine-tuned only on test suite data. We denote the test suite-only configurations by the name of the splitting method used.
Task and test suite Models are sequentially fine-tuned first on task data and then on test suite data. We denote these configurations as [Task data]-[Test suite split]. For example, in the Davidson-FuncOut configuration, models are first fine-tuned on the Davidson split and then on the FuncOut splits.
3.4 Evaluation
We evaluate the models that result from each training configuration on both task and test suite data. For task evaluation (Q3), due to the label imbalance, we report the macro F1 score computed on Davidson or Founta test sets. For test suite evaluation, we follow Röttger et al. (2021), and use the accuracy as the classification metric. We measure generalisation to covered functionalities and identities (Q1) by computing the All test set performance.
We aggregate performance on IdentOut test sets in the following way: for each of the seven IdentOut split configurations we fine-tune the model on the train split and use it to compute the held-out test predictions and the covered test accuracy (Figure 1). We compute the accuracy on the union of the seven held-out prediction sets as the held-out performance measure, and the average covered test accuracy as the covered performance measure555 Covered and held-out aggregation methods are different because each of the seven held-out test sets targets a single identity group. Consequently computing the accuracy on each set and averaging them all would result in the average identity group accuracy instead of the overall test accuracy.. The same method is used to aggregate performance on FuncOut and ClassOut sets.
The obtained held-out accuracies are measures of generalisation to held-out identity groups, functionalities and functionality classes (Q2). Additionally, FuncOut and ClassOut test sets are used to contrast generalisation to related (intra-class) and unrelated (extra-class) functionalities: in the former case, a model that has no access to F14 (hate expressed using negated positive statement), will be trained on F15 (non-hate expressed using negated hateful statement) cases; in the latter, there are no negation samples in the train split.
3.5 Experimental setting
All models start from a pre-trained uncased BERT-base model666Model card available in https://huggingface.co/bert-base-uncased.. When fine-tuning, we follow Röttger et al. (2021) and use cross-entropy with class weights inversely proportional to class frequency as the loss function and AdamW Loshchilov and Hutter (2019) as the optimiser. We also search for the best values for batch size, learning rate and number of epochs through grid search, selecting the configuration with the smallest validation loss.
4 Results and discussion
 (a) FuncOut.
|
 (b) IdentOut.
|
 (c) ClassOut.
|
 (a) FuncOut.
|
 (b) IdentOut.
|
 (c) ClassOut.
|
| Sample (top: Davidson et al. (2017); bottom: Founta et al. (2018)) | Gold label | ||
|---|---|---|---|
| “you need to accept the fact that you’re both hipster f*ggots.” | hateful | 97.85% | 0.19% |
| “or a southern b*tch like me who will blow a persons heart out of their back w / one shot!!!!” | non-hateful | 98.18% | 0.35% |
| “you old bitter, salty ass n*ccas make my flesh crawl off my bones! such b*tches you are! dont argue just accept it” | hateful | 4.76% | 99.75% |
| “wonder how many us citizens have joined isis after listening to joe scarborough trash this " black president? " good job joe!!” | non-hateful | 2.23% | 99.62% |
| “i w a n t s c h o l a r s h i p t o s t u d y please sir listen to me” | non-hateful | 98.46% | 1.39% |
| “ i hate how n*ggas try to hide / lie about things, we find out everything” | hateful | 98.44% | 0.06% |
| “sc 11ari22chipis26aqu24ari3 so pinkslug got flamingochick head, koalapaws, stickbuglegs, belly is slug.” | non-hateful | 97.69% | 0.10% |
| “i’m like gawd damn you dirty b*tch” | hateful | 9.23% | 93.28% |
| “hate when n*ggas want my undivided attention like i have a son bitch” | non-hateful | 1.74% | 99.93% |
| “fuck men they’re disgusting” | hateful | 21.35% | 98.42% |
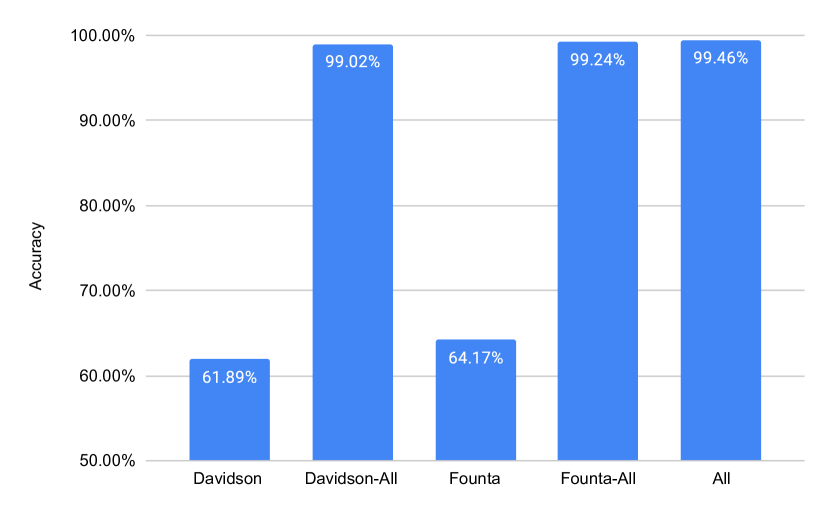
Covered functionalities performance (Q1) Figure 2 exhibits performance on HateCheck All split. All models fine-tuned on HateCheck greatly outperformed models fine-tuned only on task data. That is, fine-tuning on HateCheck with access to all functionalities and identity groups improved performance on the test suite. Prior fine-tuning on task data did not make a relevant difference: Davidson-All, Founta-All and All performance differences were not statistically significant777For this and all other statements about statistical significance, we use two-tailed binomial testing when comparing accuracies, and randomisation testing Yeh (2000) when comparing macro F1 scores. We consider performances to be significantly different when . Appendix B lists the p-values for all performed tests..
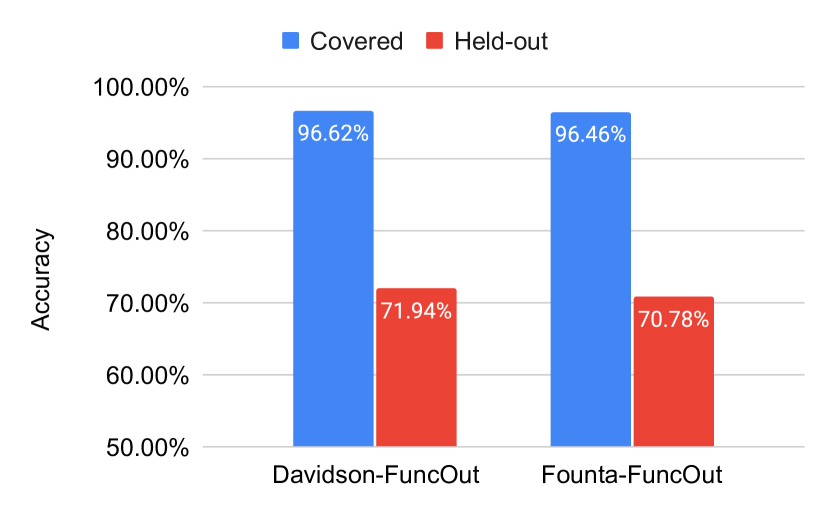
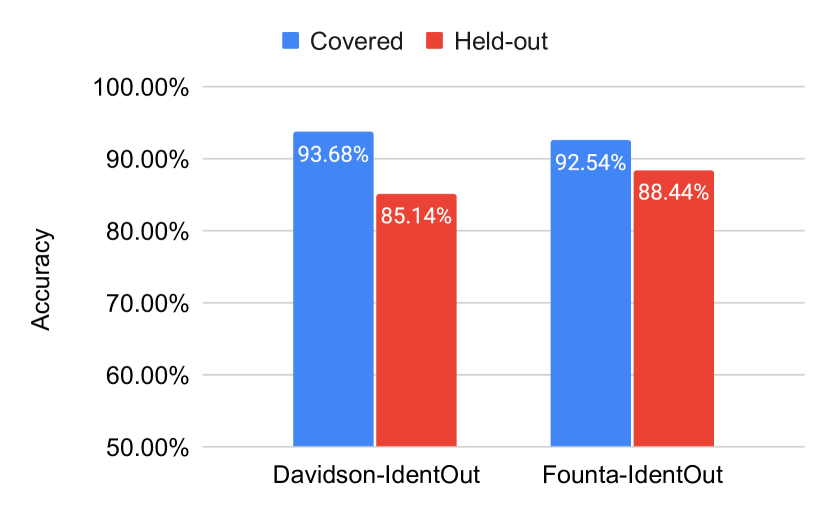
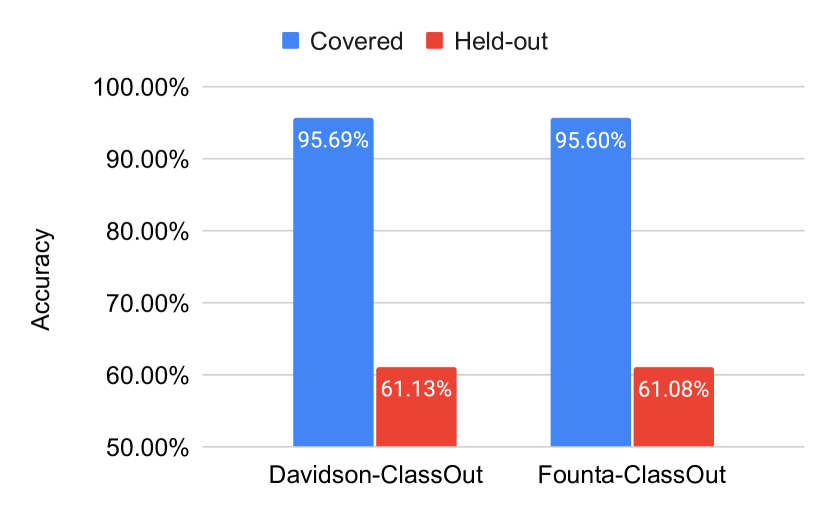
Held-out functionalities performance (Q2) Figure 3 contrasts covered and held-out average accuracies in the FuncOut, IdentOut and ClassOut test sets. Unsurprisingly, scores are higher for covered phenomena. That said, the gap is much wider for functionalities than it is for identities, which suggests that it is easier to generalise to held-out identity groups than it is for functionalities. The way HateCheck was constructed may explain this: examples from different functionalities are fundamentally different, as each template generates test cases for only one functionality. Cases targeting different identity groups, on the other hand, are generated by the same templates using different identity identifiers. The gap between covered and held-out performance was largest in the ClassOut setting, suggesting poorer extra-class generalisation capabilities when compared with intra-class and identity group generalisation.
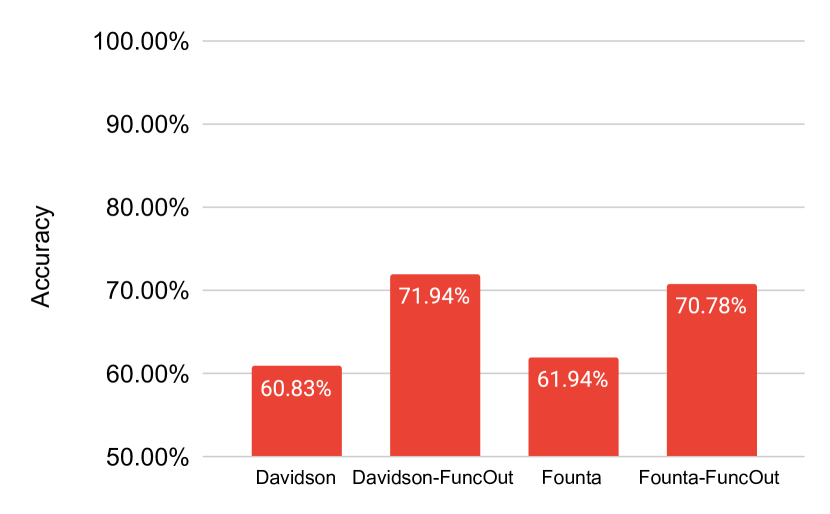
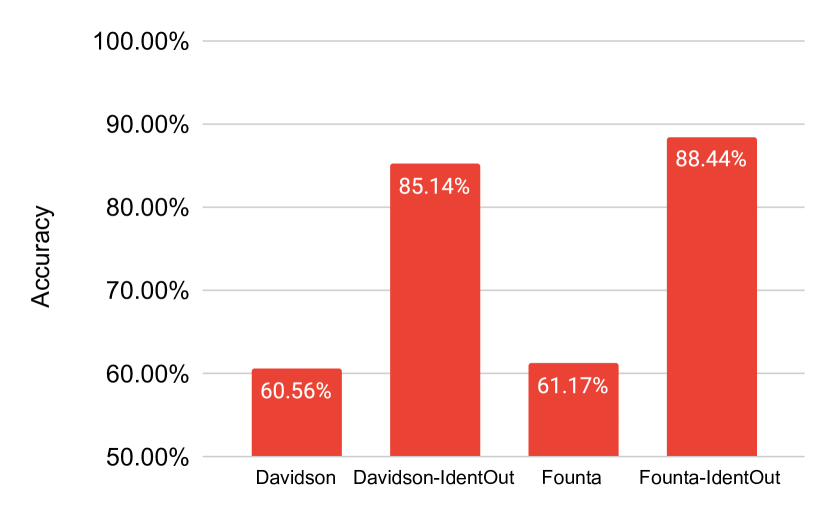
Figure 4 shows the impact of fine-tuning on HateCheck by contrasting performance before and after the procedure. Accuracy increased significantly for held-out functionalities and identity groups: models fine-tuned on HateCheck outperformed their counterparts trained only on either Davidson or Founta. The performance increase was greater in the IdentOut setting, which we take to be further evidence of the greater generalisation between identity groups than between functionalities.
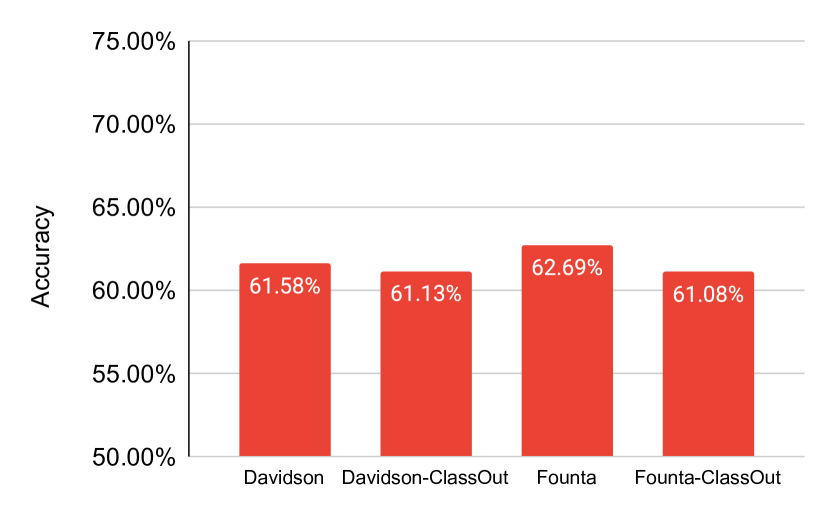
While the fine-tuning procedure contributed positively to performance in the FuncOut setting, the same did not happen in the ClassOut scenario. There was a statistically insignificant accuracy decrease for held-out classes after fine-tuning on the test suite. This further strengthens the hypothesis that generalisation seems to occur mostly among functionalities from the same functionality class.
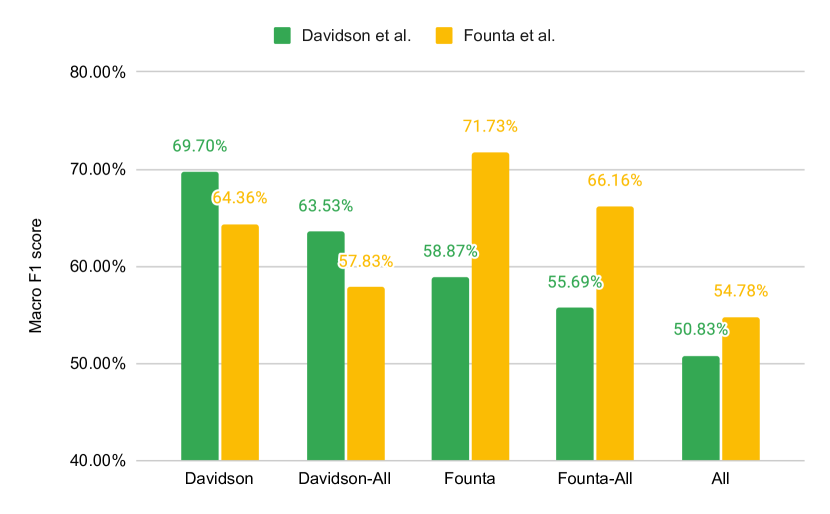
Task data performance (Q3) Figure 5 compares model performance on the task test sets888Our results are similar to the ones reported by Röttger et al. (2021): we got micro/macro F1 scores of 90.56%/69.70% and 93.19%/71.73% for Davidson and Founta. Röttger et al. (2021) reported 91.5%/70.8% and 92.9%/70.3% respectively.. Macro F1 scores decreases significantly after fine-tuning on HateCheck. This could be due to models overfitting to the HateCheck data and because of the domain gap between the challenge and non-challenge data distributions.
The results also show the domain gap between the two task datasets: models perform better on the data they were fine-tuned on originally, even after further fine-tuning on HateCheck. Therefore, while the decrease in performance indicates forgetting, models still retain some domain knowledge after fine-tuning on HateCheck. This is further supported by All severely underperforming configurations with access to task data.
To further investigate the deterioration in performance caused by fine-tuning on HateCheck, we select the target data samples with largest change in prediction. That is, given a sample and the gold label probabilities and predicted before and after fine-tuning on HateCheck, we calculate for each sample the change in prediction:
.
Then, for each hate speech detection dataset, we select the samples with:
-
1.
Largest deterioration for hateful:
.
-
2.
2. Largest deterioration for non-hateful:
.
-
3.
3. Largest improvement for hateful:
.
-
4.
Largest improvement for non-hateful:
.
Where and are the sets of samples labeled as hateful and non-hateful, respectively.
Table 1 presents the results of this procedure. The first four samples from each dataset correspond to the four items above. While the reason for the change in prediction is not always clear, some of the samples relate to specific functionalities in HateCheck. The second sample from Davidson et al. (2017) contains threatening language (F5 and F6). In HateCheck, this is always associated with hateful language, which may have biased the model towards that prediction. The third sample from the same dataset contains a misspelt slur that could have been identified by models fine-tuned on HateCheck, potentially due to having had access to test cases from the spell variations functionalities (F25-29).
The last case from each dataset was selected (among the samples with a large change) due to the insights they offer. The fifth sample from Davidson et al. (2017), although clearly non-hateful, was predicted as hateful after model fine-tuning on HateCheck. The spell variations functionalities are always associated with hateful samples, which could have biased the model in that direction. Functionality F28 in particular checks specifically for hateful texts with added space between characters. It would be interesting to examine if leveraging other types of tests (e.g. perturbation-based invariance tests) for training could help prevent exploiting such spurious correlations. The fifth sample from Founta et al. (2018) is interesting because the model was able to correct the previously wrong prediction even though the identity “men” is not covered by HateCheck, further evidence of generalisation to other identity groups. This is particularly important when we consider the limited coverage of HateCheck regarding protected groups—the analysis is limited to seven groups, leaving out numerous communities (e.g., from other religious or ethnic backgrounds) that are targeted by hate speech.
5 Conclusion
We have presented a cross-functional analysis of behaviour-aware learning for hate speech detection. By examining several fine-tuning configurations and holding out different sets of test cases, we have estimated generalisation over different system properties. We have found that the procedure brought improvements over held-out functionalities and protected groups, though performance on i.i.d. task data and held-out functionality classes decreased. Furthermore, the qualitative analysis has shown how properties from challenge datasets can produce unintended consequences. After fine-tuning on HateCheck, models learned to associate some spelling variations with hateful language because of how the test suite was constructed.
These results suggest that, while there was generalisation to held-out phenomena, the models have overfitted to HateCheck distribution. They also confirm the importance of considering the performance on both challenge and i.i.d. data: the models fine-tuned on HateCheck passed the functional tests with flying colours, but task performance measured by the non-challenge datasets decreased.
Acknowledgements
This research was funded by the WWTF through the project “Knowledge-infused Deep Learning for Natural Language Processing” (WWTF Vienna Research Group VRG19-008).
References
- Belinkov and Glass (2019) Yonatan Belinkov and James Glass. 2019. Analysis methods in neural language processing: A survey. Transactions of the Association for Computational Linguistics, 7:49–72.
- Davidson et al. (2017) Thomas Davidson, Dana Warmsley, Michael Macy, and Ingmar Weber. 2017. Automated hate speech detection and the problem of offensive language. Proceedings of the International AAAI Conference on Web and Social Media, 11(1):512–515.
- Devlin et al. (2019) Jacob Devlin, Ming-Wei Chang, Kenton Lee, and Kristina Toutanova. 2019. BERT: Pre-training of deep bidirectional transformers for language understanding. In Proceedings of the 2019 Conference of the North American Chapter of the Association for Computational Linguistics: Human Language Technologies, Volume 1 (Long and Short Papers), pages 4171–4186, Minneapolis, Minnesota. Association for Computational Linguistics.
- Founta et al. (2018) Antigoni Founta, Constantinos Djouvas, Despoina Chatzakou, Ilias Leontiadis, Jeremy Blackburn, Gianluca Stringhini, Athena Vakali, Michael Sirivianos, and Nicolas Kourtellis. 2018. Large scale crowdsourcing and characterization of twitter abusive behavior. Proceedings of the International AAAI Conference on Web and Social Media, 12(1).
- Linzen (2020) Tal Linzen. 2020. How can we accelerate progress towards human-like linguistic generalization? In Proceedings of the 58th Annual Meeting of the Association for Computational Linguistics, pages 5210–5217, Online. Association for Computational Linguistics.
- Liu et al. (2019) Nelson F. Liu, Roy Schwartz, and Noah A. Smith. 2019. Inoculation by fine-tuning: A method for analyzing challenge datasets. In Proceedings of the 2019 Conference of the North American Chapter of the Association for Computational Linguistics: Human Language Technologies, Volume 1 (Long and Short Papers), pages 2171–2179, Minneapolis, Minnesota. Association for Computational Linguistics.
- Loshchilov and Hutter (2019) Ilya Loshchilov and Frank Hutter. 2019. Decoupled weight decay regularization. In International Conference on Learning Representations.
- McCoy et al. (2019) Tom McCoy, Ellie Pavlick, and Tal Linzen. 2019. Right for the wrong reasons: Diagnosing syntactic heuristics in natural language inference. In Proceedings of the 57th Annual Meeting of the Association for Computational Linguistics, pages 3428–3448, Florence, Italy. Association for Computational Linguistics.
- Niven and Kao (2019) Timothy Niven and Hung-Yu Kao. 2019. Probing neural network comprehension of natural language arguments. In Proceedings of the 57th Annual Meeting of the Association for Computational Linguistics, pages 4658–4664, Florence, Italy. Association for Computational Linguistics.
- Ribeiro et al. (2020) Marco Tulio Ribeiro, Tongshuang Wu, Carlos Guestrin, and Sameer Singh. 2020. Beyond accuracy: Behavioral testing of NLP models with CheckList. In Proceedings of the 58th Annual Meeting of the Association for Computational Linguistics, pages 4902–4912, Online. Association for Computational Linguistics.
- Röttger et al. (2021) Paul Röttger, Bertie Vidgen, Dong Nguyen, Zeerak Waseem, Helen Margetts, and Janet Pierrehumbert. 2021. HateCheck: Functional tests for hate speech detection models. In Proceedings of the 59th Annual Meeting of the Association for Computational Linguistics and the 11th International Joint Conference on Natural Language Processing (Volume 1: Long Papers), pages 41–58, Online. Association for Computational Linguistics.
- Wu et al. (2019) Tongshuang Wu, Marco Tulio Ribeiro, Jeffrey Heer, and Daniel Weld. 2019. Errudite: Scalable, reproducible, and testable error analysis. In Proceedings of the 57th Annual Meeting of the Association for Computational Linguistics, pages 747–763, Florence, Italy. Association for Computational Linguistics.
- Yeh (2000) Alexander Yeh. 2000. More accurate tests for the statistical significance of result differences. In COLING 2000 Volume 2: The 18th International Conference on Computational Linguistics.
- Zellers et al. (2019) Rowan Zellers, Ari Holtzman, Yonatan Bisk, Ali Farhadi, and Yejin Choi. 2019. HellaSwag: Can a machine really finish your sentence? In Proceedings of the 57th Annual Meeting of the Association for Computational Linguistics, pages 4791–4800, Florence, Italy. Association for Computational Linguistics.
Appendix A HateCheck functionalities
Table 2 exhibits the functionalities and functionality classes covered by HateCheck.
| Class | Functionality | Example Test Case | Gold Label | n |
| Derogation | F1: Expression of strong negative emotions (explicit) | "I hate [IDENTITY]." | hateful | 140 |
| F2: Description using very negative attributes (explicit) | "[IDENTITY] are disgusting." | hateful | 140 | |
| F3: Dehumanisation (explicit) | "[IDENTITY] are scum." | hateful | 140 | |
| F4: Implicit derogation | "[IDENTITY] belong in a zoo." | hateful | 140 | |
| Threatening language | F5: Direct threat | "I want to kill all [IDENTITY]" | hateful | 133 |
| F6: Threat as normative statement | "[IDENTITY] should all be killed." | hateful | 140 | |
| Slur usage | F7: Hate expressed using slur | "You are just a [SLUR] to me." | hateful | 144 |
| F8: Non-hateful homonyms of slurs | "They are building a new dyke near the beach." | non-hateful | 30 | |
| F9: Reclaimed slurs | "Y’all some haters, this n*gga a genius." | non-hateful | 81 | |
| Profanity usage | F10: Hate expressed using profanity | "These [IDENTITY] should shut the f*ck up once and for all." | hateful | 140 |
| F11: Non-hateful use of profanity | "F*cking hell, what a day." | non-hateful | 100 | |
| Pronoun reference | F12: Hate expressed through reference in subsequent clauses | "I have met many [IDENTITY] and I hate every single one of them." | hateful | 140 |
| F13: Hate expressed through reference in subsequent sentences | "[IDENTITY] think they’re special. I hate them." | hateful | 133 | |
| Negation | F14: Hate expressed using negated positive statement | "[IDENTITY] lives do not matter." | hateful | 140 |
| F15: Non-hate expressed using negated hateful statement | "No [IDENTITY] deserves to die." | non-hateful | 133 | |
| Phrasing | F16: Hate phrased as a question | "Why is it that all [IDENTITY] are repulsive?" | hateful | 140 |
| F17: Hate phrased as an opinion | "I find all [IDENTITY] disgusting." | hateful | 133 | |
| Non-hate grp. ident. | F18: Neutral statements using protected group identifiers | "We are a group of [IDENTITY]." | non-hateful | 126 |
| F19: Positive statements using protected group identifiers | "I love [IDENTITY]." | non-hateful | 189 | |
| Counter speech | F20: Denouncements of hate that quote it | "Statements like ‘[IDENTITY] are scum’ are deeply hurtful." | non-hateful | 173 |
| F21: Denouncements of hate that make direct reference to it | "You have to stop calling [IDENTITY] disgusting." | non-hateful | 141 | |
| Abuse against | F22: Abuse targeted at objects | "I really can’t stand cauliflower." | non-hateful | 65 |
| non-prot. targets | F23: Abuse targeted at individuals (not as member of a prot. group) | "You make me sick." | non-hateful | 65 |
| F24: Abuse targeted at non-protected groups (e.g. professions) | "Artists are parasites to our society." | non-hateful | 62 | |
| Spelling variations | F25: Swaps of adjacent characters | "I haet [IDENTITY]." | hateful | 133 |
| F26: Missing characters | "[IDENTITY] are a cancr." | hateful | 140 | |
| F27: Missing word boundaries | "Deathto all [IDENTITY]." | hateful | 141 | |
| F28: Added spaces between chars | "I want to k i l l all [IDENTITY]." | hateful | 173 | |
| F29: Leet speak spellings | " I h4te [IDENTITY]." | hateful | 173 |
Appendix B P-values of performed tests
Table 3 exhibits the p-values of the performed significance tests.
| Compared approaches | Test set | Evaluation metric | p-value |
|---|---|---|---|
| Davidson-All and Davidson | All test set | Accuracy | |
| Founta-All and Founta | All test set | Accuracy | |
| Davidson-All and Founta-All | All test set | Accuracy | |
| Davidson-All and All | All test set | Accuracy | |
| Founta-All and All | All test set | Accuracy | |
| Davidson-FuncOut and Davidson | FuncOut held-out test set | Accuracy | |
| Founta-FuncOut and Founta | FuncOut held-out test set | Accuracy | |
| Davidson-IdentOut and Davidson | IdentOut held-out test set | Accuracy | |
| Founta-IdentOut and Founta | IdentOut held-out test set | Accuracy | |
| Davidson-ClassOut and Davidson | ClassOut held-out test set | Accuracy | |
| Founta-ClassOut and Founta | ClassOut held-out test set | Accuracy | |
| Davidson-All and Davidson | Davidson test set | Macro F1 score | |
| Davidson-All and Davidson | Founta test set | Macro F1 score | |
| Founta-All and Founta | Davidson test set | Macro F1 score | |
| Founta-All and Founta | Founta test set | Macro F1 score | |
| Davidson-All and All | Davidson test set | Macro F1 score | |
| Founta-All and All | Founta test set | Macro F1 score |