11email: leemker@strw.leidenuniv.nl 22institutetext: Max-Planck-Institut für Extraterrestrische Physik, Giessenbachstrasse 1, 85748 Garching, Germany 33institutetext: Institute for Particle Physics and Astrophysics, ETH Zürich, 8093 Zürich, Switzerland 44institutetext: Department of Astronomy, University of Michigan, 323 West Hall, 1085 S. University Ave., Ann Arbor, MI 48109, USA 55institutetext: European Southern Observatory, Karl-Schwarzschild-Str. 2, 85748 Garching, Germany 66institutetext: Università degli Studi di Milano, via Giovanni Celoria 16, 20133 Milano, Italy 77institutetext: Anton Pannekoek Institute for Astronomy, University of Amsterdam, Science Park 904, 1090 GE Amsterdam, The Netherlands
Gas temperature structure across transition disk cavities
Abstract
Context. Most disks observed at high angular resolution show signs of substructures like rings, gaps, arcs, and cavities in both the gas and the dust. To understand the physical mechanisms responsible for these structures, knowledge about the gas surface density is essential. This, in turn, requires information on the gas temperature.
Aims. The aim of this work is to constrain the gas temperature as well as the gas surface densities inside and outside the mm-dust cavities of two transition disks: LkCa15 and HD 169142, with dust cavities of 68 AU and 25 AU, respectively.
Methods. We use some of the few existing ALMA observations of the transition of 13CO together with archival data of 12CO, 13CO and C18O. The ratio of the 13CO to the transition is used to constrain the temperature and is compared with that found from peak brightness temperature of optically thick lines. The spectra are used to resolve the innermost disk regions to a spatial resolution better than the beam of the observations. Furthermore, we use the thermochemical code DALI to model the temperature and density structure of a typical transition disk as well as the emitting regions of the CO isotopologues.
Results. The 13CO and transitions peak inside the dust cavity in both disks, indicating that gas is present in the dust cavities. The kinematically derived radial profiles show that the gas is detected down to 10 and AU, much further in than the dust cavities in the LkCa15 and HD 169142 disks, respectively. For LkCa15, the steep increase towards the star in the 13CO transition, in contrast to the line, shows that the gas is too warm to be traced by the line and that molecular excitation is important for analysing the line emission. Quantitatively, the line ratio constrains the gas temperature in the emitting layers inside the dust cavity to be up to 65 K, warmer than in the outer disk at 2030 K. For the HD 169142, the lines are optically thick, complicating a line ratio analysis. In this case, the peak brightness temperature constrains the gas in the dust cavity of HD 169142 to be 170 K, whereas that in the outer disk is only 100 K. The data indicate a vertical structure in which the 13CO line emits from a higher layer than the line in both disks, consistent with exploratory thermo-chemical DALI models. Such models also show that a more luminous central star, a lower abundance of PAHs and the absence of a dusty inner disk increase the temperature of the emitting layers and hence the line ratio in the gas cavity. The gas column density in the LkCa15 dust cavity drops by a factor compared to the outer disk, with an additional drop of an order of magnitude inside the gas cavity at 10 AU. In the case of HD 169142, the gas column density drops by a factor of 200500 inside the gas cavity.
Conclusions. The gas temperatures inside the dust cavities steeply increase towards the star and reach temperatures up to 65 K (LkCa15) and 170 K (HD 169142) on scales of 15-30 AU, whereas the temperature gradients of the emitting layers in the outer disks are shallow with typical temperatures of 20 30 and 100 K, respectively. The deep drop in gas column density inside the HD 169142 gas cavity at ¡10 AU could be due to a massive companion of several MJ, whereas the broad dust-depleted gas region from 10-68 AU for LkCa15 may imply several lower mass planets. This work demonstrates that knowledge of the gas temperature is important to determine the gas surface density and thus whether planets, and if so what kind of planets, are the most likely carving the dust cavities.
Key Words.:
Planetary systems: protoplanetary disks - observations: ALMA, submillimeter - stars: individual: LkCa15, HD 1691421 Introduction
High angular resolution observations of protoplanetary disks show structures in both gas and dust (e.g., Andrews et al. 2010; van der Marel et al. 2015; Fedele et al. 2017; Andrews et al. 2018; Huang et al. 2018; Long et al. 2018; Öberg et al. 2021; see Andrews 2020 for review). One favoured mechanism that can explain most of these substructures is planet-disk interactions ( 20 MEarth) (e.g. Bryden et al. 1999; Zhu et al. 2014; Dipierro et al. 2015; Rosotti et al. 2016; Dong et al. 2018; Zhang et al. 2018; Szulágyi et al. 2018; Binkert et al. 2021). If these structures are caused by embedded planets, these gaps should be deep in both gas and dust (at least a factor of 10 depletion in the gas). However, the structures could also caused by a change in the temperature that is unrelated to a potential embedded planet. Therefore, knowledge of the temperature profile across these structures is needed to distinguish truly empty gaps from emission drops related to temperature decreases.
There are only a few cases where young exoplanets have been caught in the act of formation. Two young planets and their disks have recently been directly imaged in the central dust cavity of the PDS 70 disk (Keppler et al., 2018; Haffert et al., 2019; Isella et al., 2019; Benisty et al., 2021) and three more have been located in gaps in the HD 163296 and HD 97048 disks based on localized azimuthal perturbations in the disk velocity structure traced by CO kinematics (Teague et al. 2018; Pinte et al. 2019; Teague et al. 2019; Izquierdo et al. 2021). Two of these disks are typical transition disks with large mm-dust cavities, supporting the expectation that planets are present in most (transition) disks. The presence of massive planets ( several MJup) in a number of other disks including those around HD 100546 and HD 169142 has been suggested, but confirmation by direct imaging is still lacking (e.g., Quanz et al. 2013a, b; Osorio et al. 2014; Reggiani et al. 2014; Walsh et al. 2014; Currie et al. 2017; Follette et al. 2017; Rameau et al. 2017; Casassus & Pérez 2019; Toci et al. 2020). Similarly, planets have been proposed and refuted in the LkCa15 disk (Kraus & Ireland, 2012; Sallum et al., 2015; Currie et al., 2019). Other explanations for the structures seen in disks include disk winds, internal photoevaporation, opacity variations, chemical effects, and magneto-hydrodynamics (e.g., Clarke et al. 2001; Birnstiel et al. 2015; Zhang et al. 2015; Flock et al. 2015; Simon et al. 2016). Spatially resolved observations of gas in and near a gap or cavity can distinguish between these scenarios. In particular, the presence of massive planets should result in deep gas cavities (gas depleted by at least a factor of 10) that are somewhat smaller than the deep dust cavities.
In this work, we focus on transition disks with large cavities as they are more easily resolved by current ALMA observations. Fully resolving the cavity with multiple beams is crucial to derive the properties of the gas and dust in the cavities (Bruderer, 2013; Szulágyi et al., 2018). The gas shows a different morphology than the dust, with the gas cavity indeed typically smaller than that in the dust (e.g., Bruderer et al. 2014; Perez et al. 2015; van der Marel et al. 2015, 2016; Wölfer et al. 2021). However, observations do not trace the column density of the gas and dust directly. A gas cavity seen in molecular line emission can be due to an actual decrease in the surface density, but it can also be caused by a drop in the gas temperature in that region of the disk or a combination of both (Facchini et al., 2017, 2018). Therefore, the temperature needs to be known to accurately derive the surface density in the gas cavity.
The gas temperature inside and outside the cavity is controlled by a number of heating and cooling processes including the photoelectric effect on PAHs and small grains exposed to UV radiation, gas-grain coupling and atomic and molecular line emission (e.g. Bakes & Tielens 1994; Kamp & van Zadelhoff 2001; Weingartner & Draine 2001; Gorti & Hollenbach 2004; Woitke et al. 2009; Bruderer et al. 2012; Bruderer 2013). A crucial ingredient is the local UV field. The radiation field at each point in the disk depends on a number of parameters: the stellar type of the host star, the UV luminosity from accretion of material onto the star, the abundance of dust and PAHs and their properties, and the presence of an inner disk that shields radiation from the host star. PAHs that heat the gas through the photoelectric effect and dusty inner disks are commonly observed in transition disks (Habart et al., 2006; Brown et al., 2007; Geers et al., 2007a, b; Merín et al., 2010; Isella et al., 2019; Pérez et al., 2019; Facchini et al., 2020; Francis & van der Marel, 2020). Detailed modelling by Jonkheid et al. (2006); Woitke et al. (2009); Bruderer et al. (2012); Bruderer (2013); Facchini et al. (2017, 2018); Alarcón et al. (2020); Rab et al. (2020) shows that the temperature of the gas changes when a gap or cavity is introduced in the model. Whether the gas becomes warmer or colder than the gas in the full disk model depends on parameters like the grain sizes and on the gas-to-dust ratio. A planet in the gap can locally increase the temperature by several tens of K (Cleeves et al., 2015; Szulágyi et al., 2018).
Pre-ALMA the gas temperature in the emitting layers has been derived by comparing observations of various CO lines, up to high -lines observed with ground based telescopes and Herschel (e.g. van Zadelhoff et al. 2001; Sturm et al. 2010; Bruderer et al. 2012; Dent et al. 2013; Fedele et al. 2013; Meeus et al. 2012; Green et al. 2013; Meeus et al. 2013). These observations mainly probe the temperature in intermediate disk layers () at 10-200 AU from the central star (Fedele et al., 2016).
With the advent of ALMA, spatially resolved observations have been used together with detailed modelling of individual disks with large dust cavities (e.g., Bruderer et al. 2012; van der Marel et al. 2015, 2016; Kama et al. 2016; Schwarz et al. 2021) and without large dust cavities (e.g., Schwarz et al. 2016; Pinte et al. 2018; Calahan et al. 2021). The temperature of the (outer) disk midplane is derived from the location of the snowlines of major species such as H2O and CO (Mathews et al., 2013; Qi et al., 2013; van ’t Hoff et al., 2017, 2018; Qi et al., 2019; Leemker et al., 2021). Additionally rotational diagrams are used to derive the temperature of intermediate layers in disks (e.g., Schwarz et al. 2016; Loomis et al. 2018; Pegues et al. 2020; Terwisscha van Scheltinga et al. 2021). In this work, we study the rarely observed transition of 13CO ( K) in two transition disks: LkCa15 and HD 169142 with spatially resolved ALMA data. The combination of this high transition with the more commonly observed 13CO ( K) transition, allows us to study the temperature and column density in the cavities of two transition disks and link it to the rest of the disk. The very high resolution of the 13CO data provides a unique opportunity to study the gas temperature in these disks in detail.
The sources and observations are discussed in Section 2. Next, the continuum and molecular line emission across the cavities of LkCa15 and HD 169142 are presented in Section 3. The relevant equations for the temperature analysis are summarized and applied to the data in Section 4, where we derive the temperature, column density and optical depth using CO isotopologues. We put the derived temperature structure in context using a representative thermochemical model in Section 5. Finally, we discuss and summarize our findings in Section 6 and 7, respectively.
2 Observations
| Disk | RA | Decl. | (M⊙) | (M⊙ yr-1) | (L⊙) | spectral type | age (Myr) | distance (pc) | (km s-1) | incl. () | PA () | Refs. |
|---|---|---|---|---|---|---|---|---|---|---|---|---|
| LkCa15 | 04:39:17.79 | 22:21:03.39 | 1.3 | 1.1 | K3 | 5 | 157.2 | 6.25 | 50 | 62 | 1-5 | |
| HD 169142 | 18:24:29.78 | -29:46:49.33 | 1.7 | 10 | F1 | 6 | 114.9 | 6.9 | 13 | 5 | 1,6-13 |
-
•
References. Gaia Collaboration et al. 2018, Donati et al. 2019, Wolk & Walter 1996, this work, Facchini et al. 2020, Blondel & Djie 2006, Following Fedele et al. 2017, based on the optical and UV-extinction (Malfait et al., 1998) and the new Gaia distance, Gray et al. 2017, Grady et al. 2007, Fedele et al. 2017, Raman et al. 2006, Panić et al. 2008, and Guzmán-Díaz et al. 2021.
| Disk | Transition | Int. flux(1) (Jy km s-1) | Channel width (km s-1) | Channel rms (mJy beam-1) | Beam | MRS(2) | Robust | Project code | PI |
|---|---|---|---|---|---|---|---|---|---|
| LkCa15 | 12CO | 0.04 | 8.9 | 2018.1.01255.S | M. Benisty | ||||
| 13CO | 0.17 | 4.4 | nat.(5) | 2018.1.00945.S | C. Qi | ||||
| 13CO | 0.33 | 3.1 | 2018.1.00945.S | C. Qi | |||||
| 13CO | 0.5 | 2.8 | 2017.1.00727.S | J. Szulágyi | |||||
| 13CO | 0.44 | 25 | 2017.1.00727.S | J. Szulágyi | |||||
| C18O | 0.33 | 3.9 | 2018.1.00945.S | C. Qi | |||||
| 0.45 mm cont. | 0.16 | 0.5 | 2017.1.00727.S | J. Szulágyi | |||||
| HD 169142 | 12CO | 0.17 | 1.7 | 0.5 | 2016.1.00344.S | S. Pérez(3) | |||
| 13CO | 0.17 | 2.3 | 0.5 | 2016.1.00344.S | S. Pérez(3) | ||||
| 13CO | 0.44 | 12 | 0.0 | 2017.1.00727.S | J. Szulágyi | ||||
| C18O | 0.17 | 1.4 | 0.5 | 2016.1.00344.S | S. Pérez(3) | ||||
| 0.45 mm cont. | 0.52 | 0.5(7) | 2017.1.00727.S | J. Szulágyi | |||||
| 1.3 mm cont. | 0.022 | 2016.1.00344.S | S. Pérez(3) |
-
•
Notes. (1) Disk integrated flux calculated from the region within the Keplerian mask. The error includes the 10% absolute flux calibration error, but not any uncertainty due to resolved out large scale emission. (2) The maximum recoverable scale (MRS) is estimated as , with the wavelength and the 5th percentile baseline of the configuration. (3) Data first presented by Pérez et al. (2019). (4) Data first presented in Facchini et al. (2020). (5) Natural weighting with a -taper. (6) ALMA image for which high and intermediate spatial resolution ALMA data are combined. (7) Product data.
In this paper we analyse ALMA observations of CO isotopologues in the LkCa15 and HD 169142 disks. An overview of the stellar parameters is given in Table 1 and an overview of the observations is presented in Table 2. The sources and data reduction are discussed in this section.
2.1 The sources
LkCa15 is a transition disk with a large dust cavity up to 68 AU radius. The system is located at pc (Gaia Collaboration et al., 2018). The disk surrounding the K3 type T Tauri star LkCa15 is inclined by (Wolk & Walter 1996; van der Marel et al. 2015; Facchini et al. 2020). High resolution ALMA Band 6 observations reveal that, in addition to the cavity, the dust is highly structured with multiple narrow rings observed at high resolution (Facchini et al., 2020). Small grains, traced by scattered light observations, have been seen out to AU radius inside the mm-dust cavity, suggesting that gas is present in this disk region (Thalmann et al., 2016; Oh et al., 2016). Furthermore, ALMA observations have revealed that the dust cavity is not completely devoid of mm grains as the continuum intensity in the dust cavity peaks at Jy beam-1 (Facchini et al., 2020). Here we present the first ALMA observations of a gas cavity in the LkCa15 disk. Previous observations by van der Marel et al. (2015) do not have the spatial resolution to resolve this gap in the gas. Furthermore, CO ro-vibrational lines at m also indicate a low CO gas column in the inner 0.3 AU of the LkCa15 disk (Salyk et al., 2009).
The dust in HD 169142 is highly structured similar to the LkCa15 disk (Fedele et al., 2017; Pérez et al., 2019). Yet, HD 169142 is a Herbig F1 star (Gray et al., 2017) with a mass of M⊙ (Blondel & Djie, 2006) at pc (Gaia Collaboration et al., 2018) with its surrounding disk seen almost face-on (, Raman et al. 2006; Panić et al. 2008). A small ( AU) and variable NIR inner dust disk has been observed in HD 169142 (Wagner et al., 2015; Chen et al., 2019). This inner dust disk has also been detected in high resolution ALMA observations (Pérez et al., 2019). The HD 169142 disk not only has structures in the dust, but also in the gas with rings and gaps. A gas cavity is seen in CO isotopologues, and DCO+ is found to have an inner component and a ring at AU (Fedele et al., 2017; Carney et al., 2018).
2.2 Data
In this work we use new ALMA observations of the 13CO transition in the LkCa15 and HD 169142 disks (2017.1.00727.S; PI: J. Szulágyi) as well as archival ALMA observations of the CO, 13CO, and C18O lines, see Table 2. The continuum images are used to identify the dust cavity in both disks. All CO transitions for LkCa15 are consistent with a source velocity of 6.3 km s-1. For HD 169142, a source velocity of 6.9 km s-1 is found. The line ratio of the 13CO to the transition is used to constrain the temperature across the cavities of both disks, and the optical depth of the transition is determined from the ratio with the C18O transition. Finally, we also use the brightness temperature of optically thick lines as a temperature probe. Subtracting the continuum may remove line flux from the CO isotopologues as the continuum and the molecular lines may be optically thick in these disks. In this case, the continuum flux at the frequencies of the CO isotopologue emission is overestimated as it is absorbed by the CO isotopologues (Isella et al., 2016; Weaver et al., 2018). Hence, we do not subtract the continuum for the calculation of the peak brightness temperatures, but we do subtract it for the ratios of not very optically thick lines.
The spatial resolutions of the data for LkCa15 range from to . The former resolves the dust cavity with beams along the major axis of the bright ring in the Band 9 continuum, but the latter spatial resolution is comparable to the minor axis of the dust cavity causing flux of the outer disk to be smoothed into the dust cavity. All data in the HD 169142 disk have a high spatial resolution of used in this work, resolving the dust cavity fully with beams within the first ring in the Band 9 continuum. The Band 9 data for LkCa15 are taken in two different ALMA configurations. The first one has a very high spatial resolution of and a small maximum recoverable scale (MRS) of , and the second one has an intermediate spatial resolution of and a larger MRS of . The latter data were self-calibrated using two rounds of phase calibration and one round of phase and amplitude calibration. We refer to these data as the intermediate resolution data. These self-calibrated data were also combined with the high resolution data to create a combined high resolution image with a large MRS. We refer to this as the combined high resolution image. Following the works of Czekala et al. (2021) and Öberg et al. (2021), we applied the JvM correction ( for the 13CO transition, and for the continuum) to the residuals to correct for the difference between the dirty and clean beams. Other datasets where both high and intermediate spatial resolution data are available were not combined, instead they were imaged separately. None of the other images are self-calibrated, but all images are corrected for the primary beam response.
For HD 169142, only the high spatial resolution scheduling block was observed. Similar to the intermediate spatial resolution data for LkCa15, we self-calibrated the data covering the 13CO transition using two rounds of phase calibration and one round of phase and amplitude calibration. For the continuum, we used the product data from the ALMA archive as these data were taken during excellent weather conditions and the maximum possible bandwidth was used for the product data, leading to a very good signal-to-noise ratio.
To constrain the temperature in the cavities of both disks, we not only need the 13CO transition, but also a lower transition, as this provides a good lever arm in upper energy levels. Both disks have suitable archival ALMA observations of the transition of CO isotopologues. Therefore, we compare the 13CO transition ( K) to the transition ( K). For HD 169142, we reimaged the data presented in Pérez et al. (2019) and for LkCa15, we use two different datasets. One covers 12CO at a moderate spatial resolution of , and the other one covers 13CO and C18O at moderate () and high spatial resolution (). The high spatial resolution of the latter dataset lowers the signal-to-noise ratio greatly compared to the intermediate spatial resolution images. Therefore, the high resolution 13CO transition is imaged using natural weighting and an -taper. This enhances the signal-to-noise ratio while still resolving the gas cavity.
All observations were imaged using multiscale in the tclean function within CASA version 5.4.0. (combined image of 13CO for LkCa15), 5.6.0 (self-calibration) or 5.7.0 (all lines except the combined image of 13CO for LkCa15) (McMullin et al., 2007; Cornwell, 2008). For each image, we chose the robust parameter that provides the best balance between the signal-to-noise ratio and the angular resolution. In order to compare the gas cavity with the outer disk, it is crucial to resolve the inner gas cavity. Therefore, we favoured high angular resolution over a high signal-to-noise ratio. Each cube is imaged both before and after continuum subtraction, where the former is used to find the brightness temperature and the latter was used for the other data products.
A Keplerian mask111https://github.com/richteague/keplerian_mask was used to create a mask for the data while cleaning. The robust parameters, resulting disk integrated fluxes, beam sizes, sensitivities, and maximum recoverable scales can be found in Table 2 for the observations in the LkCa15 and HD 169142 disks. The integrated flux of the high resolution 13CO transition in LkCa15 is a factor of 5 smaller than the intermediate resolution counterpart because most of the flux at scales larger than (79 AU diameter) is resolved out in the high resolution dataset. The integrated fluxes of the 12CO, 13CO, and C18O transitions for HD 169142 are 34-49% lower than those reported in Fedele et al. (2017), due to the smaller MRS of the data used in our work. The shortest baseline of the data used in this work is 41.1 m, which is identical to the shortest baseline of the dataset covering the 13CO transition in the HD 169142 disk. Furthermore, the MRS of our two datasets are both (35 AU radius), therefore the and datasets are expected to have a similar sensitivity to larger scales. The MRSs of the data used in this work are typically smaller than the size of the LkCa15 and HD 169142 disks. Therefore, the brightness temperatures may be underestimated at radii similar to the MRSs. The line ratios may also be affected by the MRSs causing small differences e.g. between the 13CO to line ratio at (combined) high spatial resolution and that at intermediate spatial resolution in the LkCa15 disk. This is because the MRS of the combined high resolution 13CO image is larger than that of the high resolution , whereas the opposite is the case for the intermediate resolution data. Therefore, the 13CO to line ratio of the (combined) high resolution will be slightly higher than that of the intermediate resolution data.
Finally, the data were imaged to specific beam sizes to compare the 13CO data to the corresponding 13CO transition. For LkCa15, a common restoring beam parameter of is used to compare the azimuthally averaged radial profiles of different transitions and isotopologues. This procedure increases the beam size by at most . Similarly, a restoring beam was used for the Band 6 and Band 9 data for HD 169142. As the combined high resolution 13CO data for LkCa15 is a combined data product, these were not convolved using the restoring beam parameter but an -taper was applied. This resulted in a cube with a beam, which was then smoothed using the imsmooth function in casa to match the beam of the high resolution 13CO data.
To improve the signal to noise in the moment 0 and peak intensity maps and on the azimuthally averaged radial profiles we used the same Keplerian mask that was also used during the cleaning process to mask any pixels that are not expected to contribute based on the Keplerian rotation of the disk. The noise on the azimuthally averaged radial profile is calculated from the channel rms using error propagation. First the noise on the moment 0 map, (in mJy km s-1 beam-1), is calculated using the noise in one channel, (in mJy beam-1), the number of channels included for each pixel in the moment 0 map, , and the velocity resolution (in km s-1):
| (1) |
Then we average this over an annulus and correct for the number of independent measurements using the beam size:
| (2) |
where is the number of independent beams per annulus, restricted to be . The 10 % absolute calibration error is not included in these estimates, but it is included in the error on the total flux.
In summary, both the Band 9 and Band 6 LkCa15 data have spatial resolutions of , where the latter is similar to the size of the dust cavity. The potential effects of this are discussed in Section 4.2. The data for HD 169142 have a much higher angular resolution of . Therefore, the dust cavity in the HD 169142 disk is fully resolved with beams inside the first ring in the Band 9 continuum data and 5 beams inside the ring in the 13CO data.
3 Results
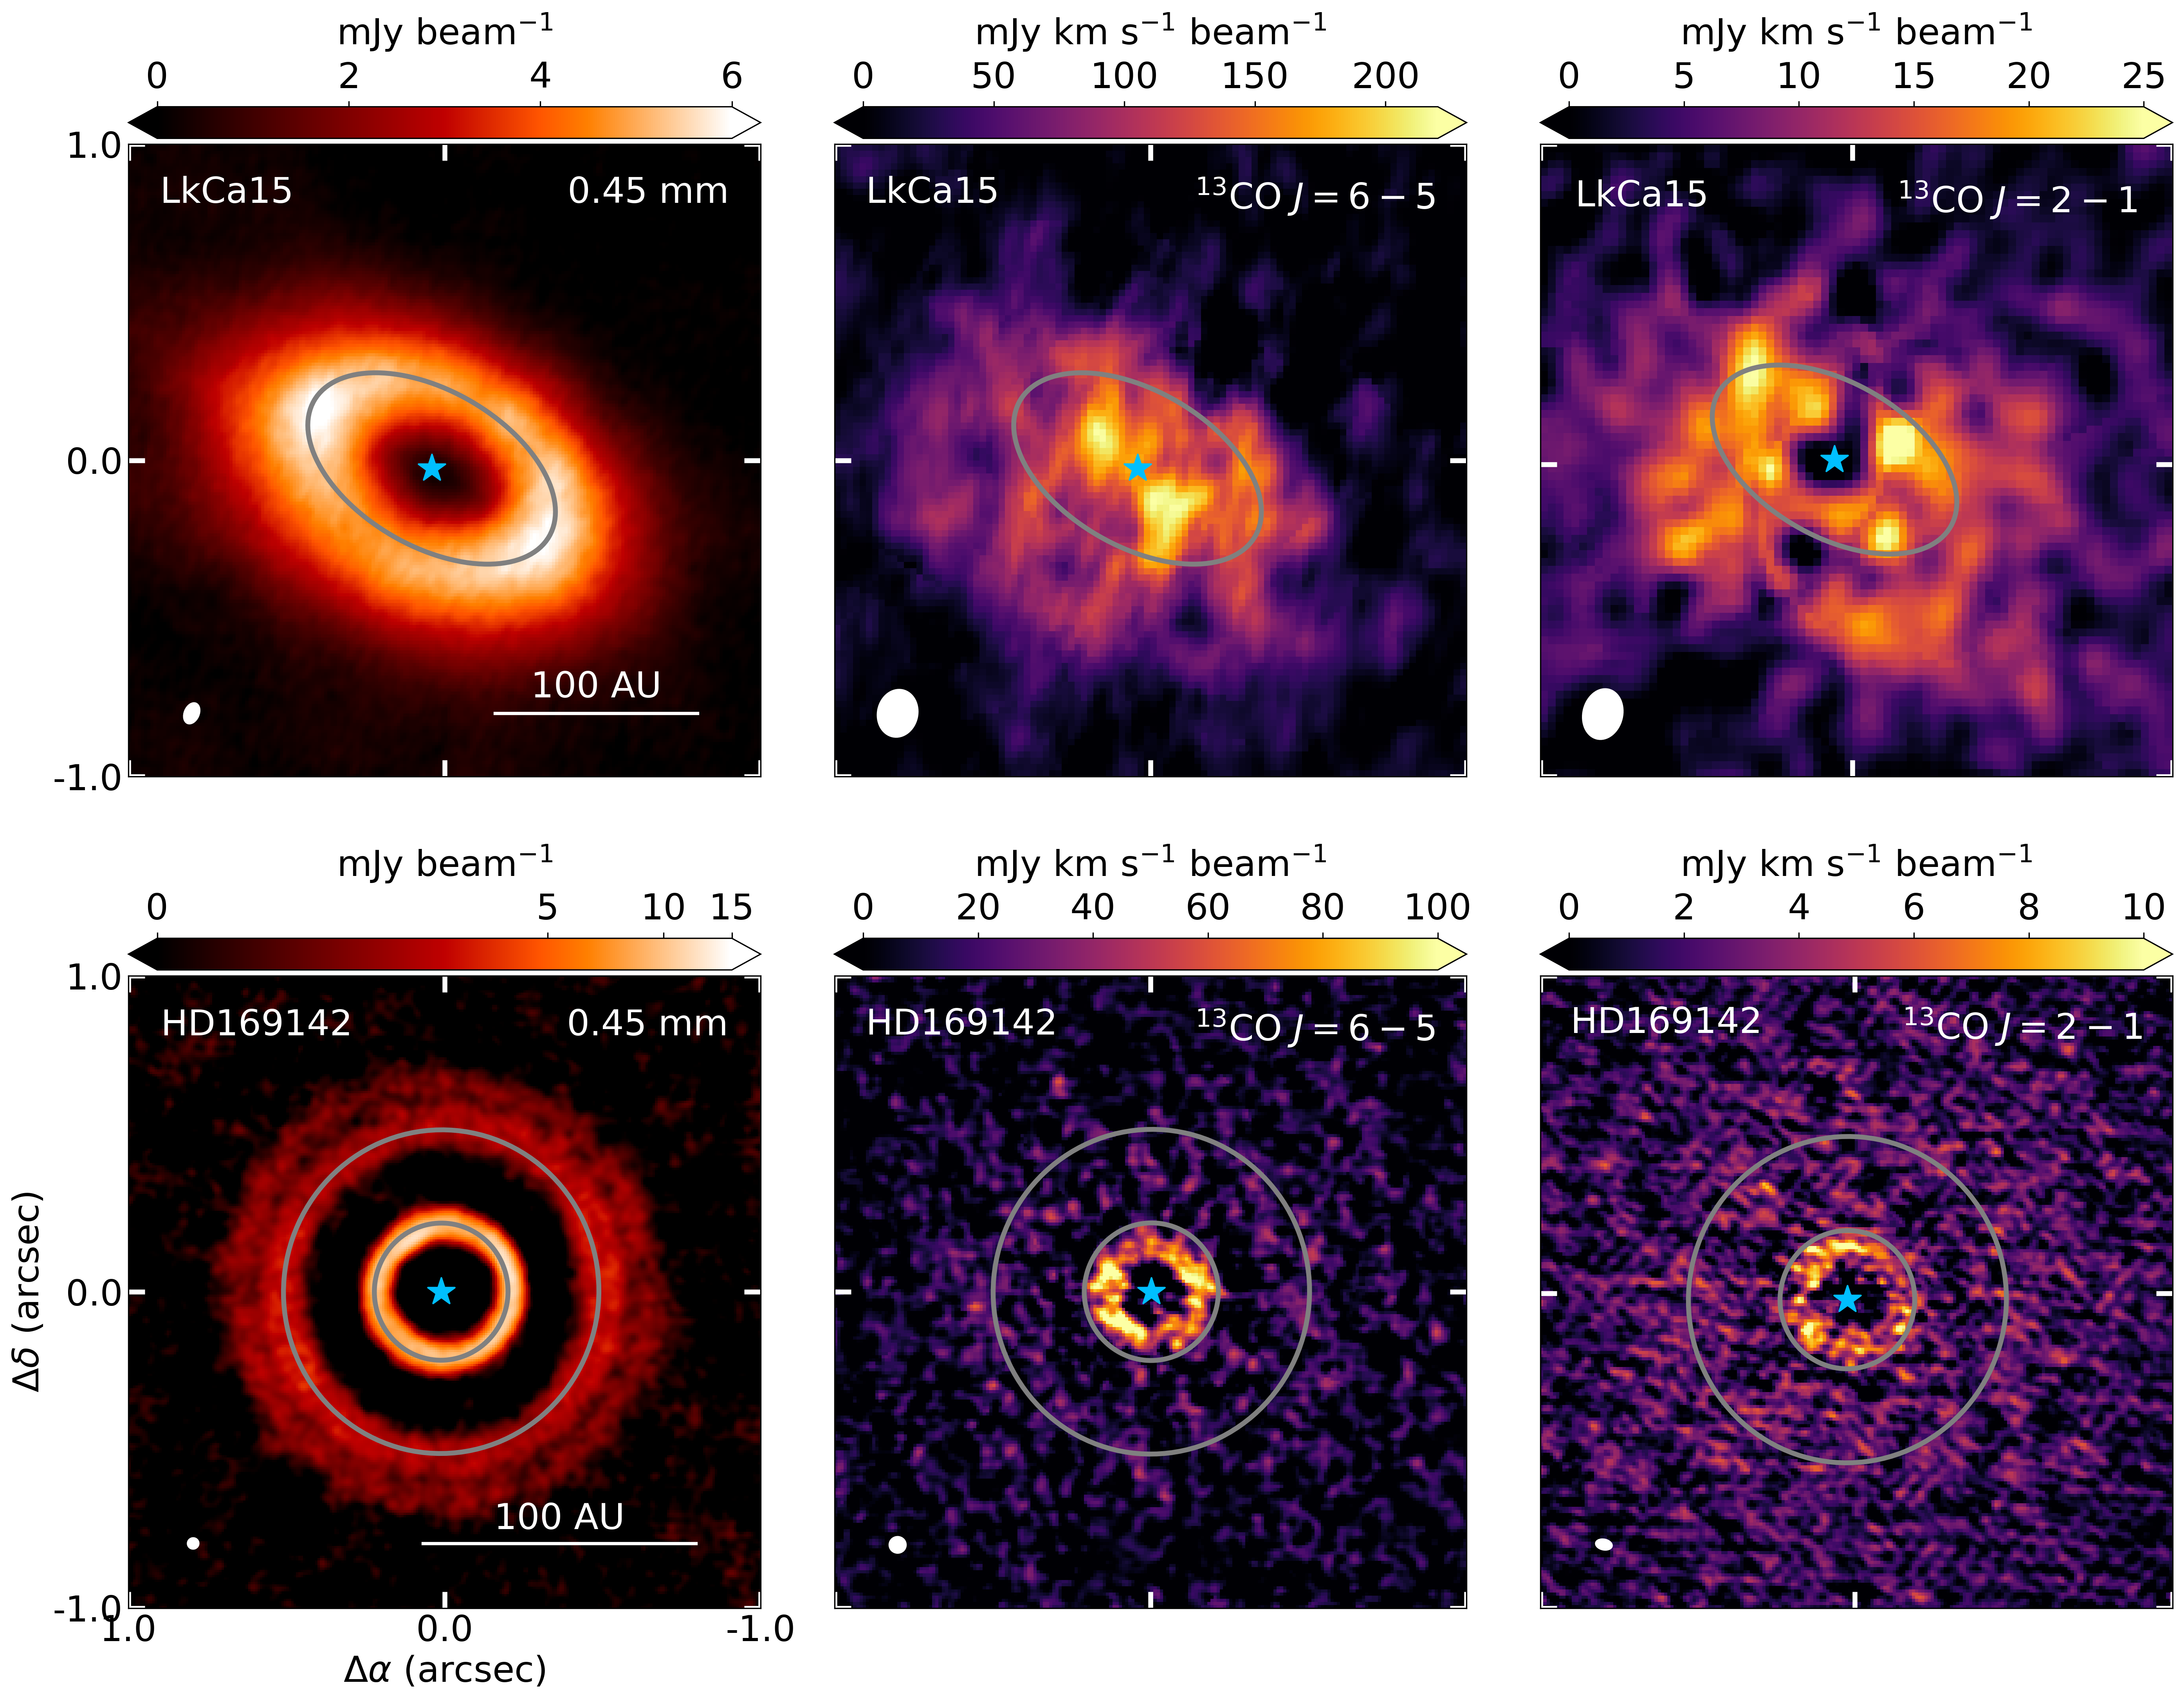
The (combined) high resolution Band 9 continuum and the 13CO and Keplerian masked integrated intensity maps are presented in Fig. 1. The Band 9 continuum data show a very clear dust cavity in both disks. This is in contrast to the 13CO and transitions that clearly peak inside the cavity seen in the dust, as shown in Fig. 2. Channel maps of the 13CO data are presented in Figs. 15, 16 in Appendix A and the deprojected azimuthally averaged radial profiles of the 12CO and C18O transitions in Fig. 17.
3.1 Dust
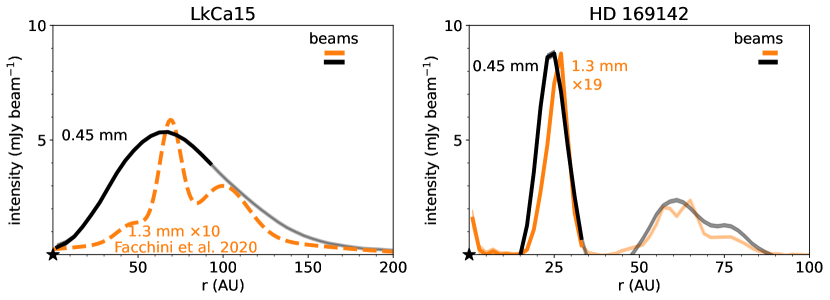
The Band 9 continuum is compared to the Band 6 continuum in both disks in Fig. 3. The Band 6 continuum in the LkCa15 disk (left hand panel) is the fit from Facchini et al. (2020) and clearly shows two narrow bright rings at 69 and 100 AU and a weaker ring at 47 AU. The Band 9 data on the other hand only show a broad single ring at 68 AU, regardless of the similar beam compared to the Band 6 data, suggesting that the Band 9 continuum is highly optically thick, hiding variations in the column density. Alternatively, the larger grains could be trapped in pressure traps whereas the somewhat smaller grains are not (e.g. Pinilla et al. 2016).
In contrast, the morphologies of the very high resolution 0.45 mm and 1.3 mm continuum for HD 169142 are very similar and only differ by a constant factor of 19 in intensity across the disk (right hand panel Fig. 3). This factor of 19 in intensity is 2.3 times larger than what is expected for optically thick emission. The great similarity in morphology indicates that the trapping mechanism is more efficient in the HD 169142 disk than in the LkCa15 disk. Both the Band 6 and Band 9 continuum observations in the HD 169142 disk peak at very similar radii of 27 AU and 25 AU, respectively. The three rings seen at 57, 64, and 76 AU in the high resolution Band 6 data (Pérez et al., 2019) are observed as two marginally separated rings at 59 AU and 75 AU in the Band 9 data. The fact that we do not see three individual rings is likely due to the slightly larger beam size of our dataset. Finally we note that the high resolution data have some emission with negative intensity between the bright rings. This is likely due to the very high angular resolution, which results in a maximum recoverable scale smaller than the disk. The continuum data will be analysed in more detail in a future paper.
3.2 Gas
3.2.1 Radial profiles
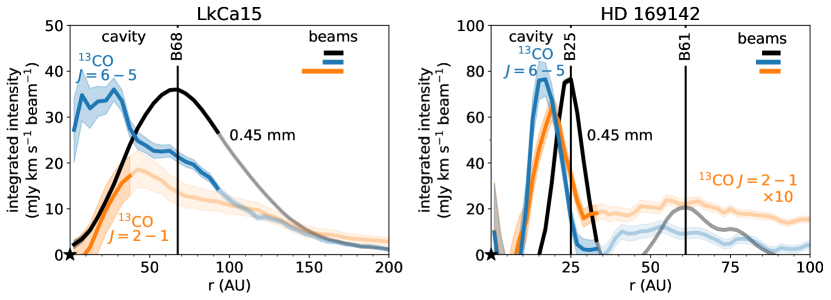
The 13CO and transitions in the LkCa15 disk (top row in Fig. 1 and left panel in Fig. 2) show very different morphologies compared to the 0.45 mm continuum and to each other. The 13CO data have a roughly constant integrated intensity in the inner AU, whereas the continuum and the data both show a clear cavity. The 13CO gas cavity is marginally resolved at our spatial resolution. These data suggest that there is still some gas in the dust cavity. Furthermore, they show that the line ratio of the 13CO to the line increases steeply inside the dust cavity, highlighting that molecular excitation, controlled by the gas temperature, and the gas surface density play a role in the molecular line emission.
The C18O emission for LkCa15 decreases with decreasing radius between 50 and 100 AU but there appears to be some emission inwards of 50 AU (see Fig. 17). This is likely due to the low signal-to-noise ratio and due to beam dilution of the gas cavity as the major axis of the C18O beam is comparable to the minor axis of the dust cavity. Accordingly, C18O emission from the region just outside the dust cavity is smoothed into the cavity, which affects our further analysis in Section 4.2. Therefore, we proceed to treat this as a upper limit on the C18O emission inside the dust cavity.
In the case of the HD 169142 disk, the 13CO and lines peak AU inside the dust ring and just inside the ring seen in scattered light (Tschudi & Schmid, 2021). Both 13CO lines show a clear gas cavity inwards of 10 AU, similar to the structure seen in other transition disks like DoAr44, IRS 48, HD 135344B, HD 142527, and PDS 70 (Bruderer et al., 2014; Perez et al., 2015; van der Marel et al., 2015, 2016, 2018; Facchini et al., 2021). Finally, the 13CO transition is detected out to much larger radii than the transition and the continuum data in both disks.
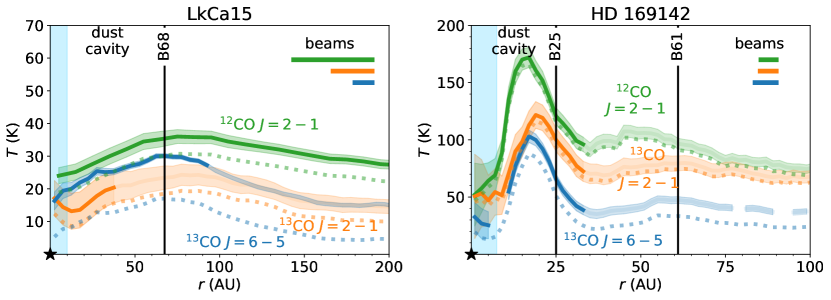
3.2.2 Brightness temperatures
The brightness temperatures of the two 13CO and the 12CO transition are presented in Fig. 4. First, we highlight the difference between the Rayleigh-Jeans approximation (dotted lines) and the full Planck curve (solid lines). The results are different because the Rayleigh-Jeans approximation is only valid if , which results in K for the 13CO and K for the 12CO and 13CO transitions. This criterion is not met for these observations except for the data in the HD 169142 disk. Therefore, care should be taken when using the Rayleigh-Jeans approximation for high frequency observations and observations with low peak intensities.
Comparing their brightness temperatures directly shows that the disk around the Herbig star HD 169142 is warmer than that around the T Tauri star LkCa15. The brightness temperature of 12CO is highest in both disks as this line becomes optically thick highest up in the disk, hence it traces a warmer layer closer to the surface of the disk. The 13CO transition traces a lower and hence colder layer due to its lower optical depth (see Fig. 20). The brightness temperature of both 13CO lines is lower than that of the 12CO lines. This is due to the lower optical depth of the transition and due to its lower spectral resolution. The latter lowers the peak flux by 6-13 K (40-60%) in LkCa15 and 10-15 K (10-30%) in HD 169142, see Appendix A.3. All CO lines may become more optically thin in the outer disk and in the gas cavities, which lowers their brightness temperature. In the case of LkCa15, the gas inside the dust cavity may be similarly warm as in the HD 169142 disk, but this cannot be determined from the brightness temperatures presented here due to beam dilution and, optical depth effects in the inner disk.
For HD 169142, the 12CO line indicates gas as warm as 170 K. The brightness temperature of the 13CO transition for HD 169142 is somewhat lower than the corresponding 13CO transition, which is not what is expected. The emission is optically thick (see also Fig. 20), hence its brightness temperature is tracing the kinetic temperature in the disk layer where its optical depth equals 1. For these temperatures, the molecular excitation is such that the optical depth of the line is comparable to or larger than that of the line. Therefore, the transition should trace a higher layer and warmer temperatures. The reason that we do not observe this is likely due to the small maximum recoverable scale of (35 AU radius) of the high resolution data, which resolves out some of the flux inside this radius. Furthermore, the shortest baseline of the 13CO data is longer than that of the , causing the data to be less sensitive to larger spatial scales. This is not reflected in the MRS of , because the MRS is calculated using the 5th percentile of the baseline distribution and is calculated assuming that the morphology of the emission resembles a uniform disk. Our observations show that the morphology of the 13CO and lines is different. Therefore, the low 13CO brightness temperature may be partially due to the small MRS. Finally, we note that the 13CO transition is not spectrally resolved for radii larger than AU, lowering the peak flux and hence the brightness temperature by 10-15 K (10-30%, see Appendix A.3).
3.2.3 Spectra
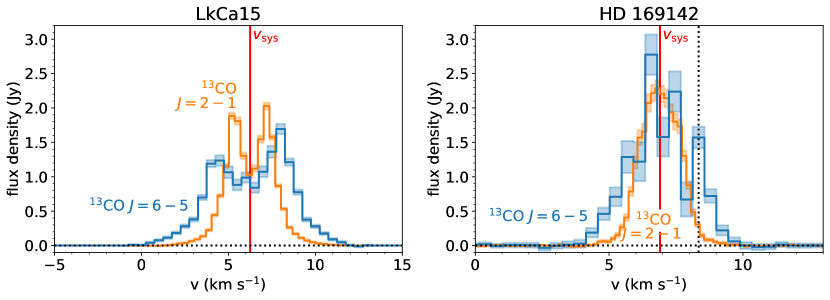
The azimuthally averaged radial profiles discussed in the previous section show a very clear difference between the morphology of the 13CO transition and the transition for LkCa15. The spectra extracted from the Keplerian masked images of these two transitions are presented in Fig. 5.
Both disks clearly show that the 13CO the line profile is broader than that of the line. This is another indication that the transition is brighter than the transition in the inner disk, as the innermost regions of the disk are rotating at the highest Keplerian velocity:
| (3) |
with the gravitational constant, the mass of the star, the disk inclination and is the Keplerian velocity of the gas.
Bosman et al. (2021) used this principle to derive the surface brightness of molecular line emission in the innermost disk regions with a spatial resolution smaller than the beam. Using this kinematics fitting program, we are able to reconstruct the surface brightness of the molecular line emission in the innermost regions of the LkCa15 and HD 169142 disks. A region was used to extract the spectrum for LkCa15 and a region for HD 169142. No Keplerian mask was applied. Furthermore, the spectral resolution of the model was set to the native spectral resolution of the data and the spectra were modelled out to 60 km s-1 from the velocity corresponding to the peak flux density. The surface brightness is fitted up to 80 AU (LkCa15) and 25 AU (HD 169142). Finally, (LkCa15) and (HD 169142) velocity resolution elements per model fitting point were used for the surface brightness. The model fitting points are separated by AU (LkCa15) and AU (HD 169142), effectively increasing the signal-to-noise ratio in the LkCa15 disk.
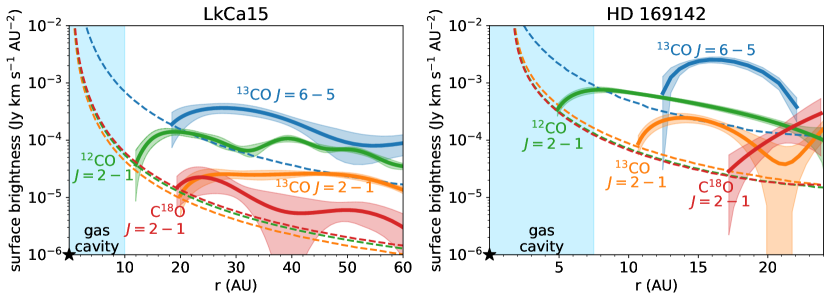
The resulting radial profiles for the 12CO, 13CO, and C18O and the 13CO lines are presented in Fig. 6. The dashed lines indicate the detection limit for each radial profile in corresponding colors. In the LkCa15 disk, all transitions except for 12CO drop below their detection limit around 20 AU. This is consistent with the azimuthal averages presented in Fig. 2 but now resolving the emission to a smaller spatial scale than what is obtained with the traditional azimuthally averaged radial profiles presented in Fig. 17. The 12CO line is detected down to 12 AU, as 12CO has the highest column density and hence the highest signal-to-noise ratio in the line wings, making it easier to detect than the less abundant isotopologues. As no steep increase in the surface brightness in the inner disk is detected in any of the lines presented here and the turnover of each line at AU is significant compared to the corresponding detection limit, the results from the kinematically derived radial profiles can be interpreted as a AU cavity in the gas in the LkCa15 disk. Notably, this is significantly smaller than the cavity seen in the dust that peaks at 68 AU.
In the HD 169142 disk, the 13CO and transitions both drop below the detection limit at AU, similar to what is seen in the traditional azimuthally averaged radial profiles. The C18O emission is only detected from 17 AU outward due to its low signal-to-noise ratio. On the other hand, 12CO is detected down to the smallest radius of 5 AU, similar to LkCa15. This is supported by the signal-to-noise ratio in the line wings (right hand panel Fig. 19), where the 12CO transition is detected out to the largest velocities. As all lines quickly drop below their detection limits and their turn overs are significant, the results from the kinematically derived radial profiles in the HD 169142 disk can be understood as a deep gas cavity at AU.
In summary, the derived gas cavity radii in the LkCa15 and HD 169142 disks are smaller by AU than their dust cavity radii, consistent with models of planet-disk interaction and formation of dust traps (e.g., Pinilla et al. 2012; de Juan Ovelar et al. 2013). Furthermore, the brightness temperature indicates that the gas in the dust cavity in the HD 169142 disk is warmer than that in the outer disk. This is not seen in the brightness temperature in the LkCa15 disk due to beam dilution that lowers the peak intensity inside the dust cavity. The gas temperature inside these regions will be further constrained in the next section.
4 Analysis
To analyse the data in terms of physical quantities, we first briefly reiterate the relevant equations to derive the temperature, column density and estimates of the optical depth using CO line ratios and assuming that all levels are characterised by a single excitation temperature, i.e., the common assumption that the lines are emitting from the same layer in the disk. Next, we apply this to the observations to investigate the differences between the cavities and the outer disks of LkCa15 and HD 169142.
4.1 Temperature and column density determination
The temperature structure inside and outside the dust cavity can be found by analysing the 13CO and 13CO transitions, as these transitions are far apart in upper energy level ( K vs K). The column density structure can then be derived using the less optically thick C18O emission together with the temperature structure from the 13CO analysis.
If the emission is optically thin, the column density is proportional to the integrated intensity (e.g., Goldsmith & Langer 1999):
| (4) |
with the column density of the upper level , is the integrated intensity, is the Einstein coefficient, is the emitting region, is the Planck constant, and is the speed of light. If the emission is optically thick, a correction factor needs to be applied:
| (5) |
where the correction factor is defined as:
| (6) |
Note that this expression approaches 1 for , such that approaches . On the other hand, if the emission becomes optically thick, this correction factor scales with , whose precise value is uncertain in this regime.
The estimate of the column density of the upper state can also be related to the total column density assuming LTE:
| (7) |
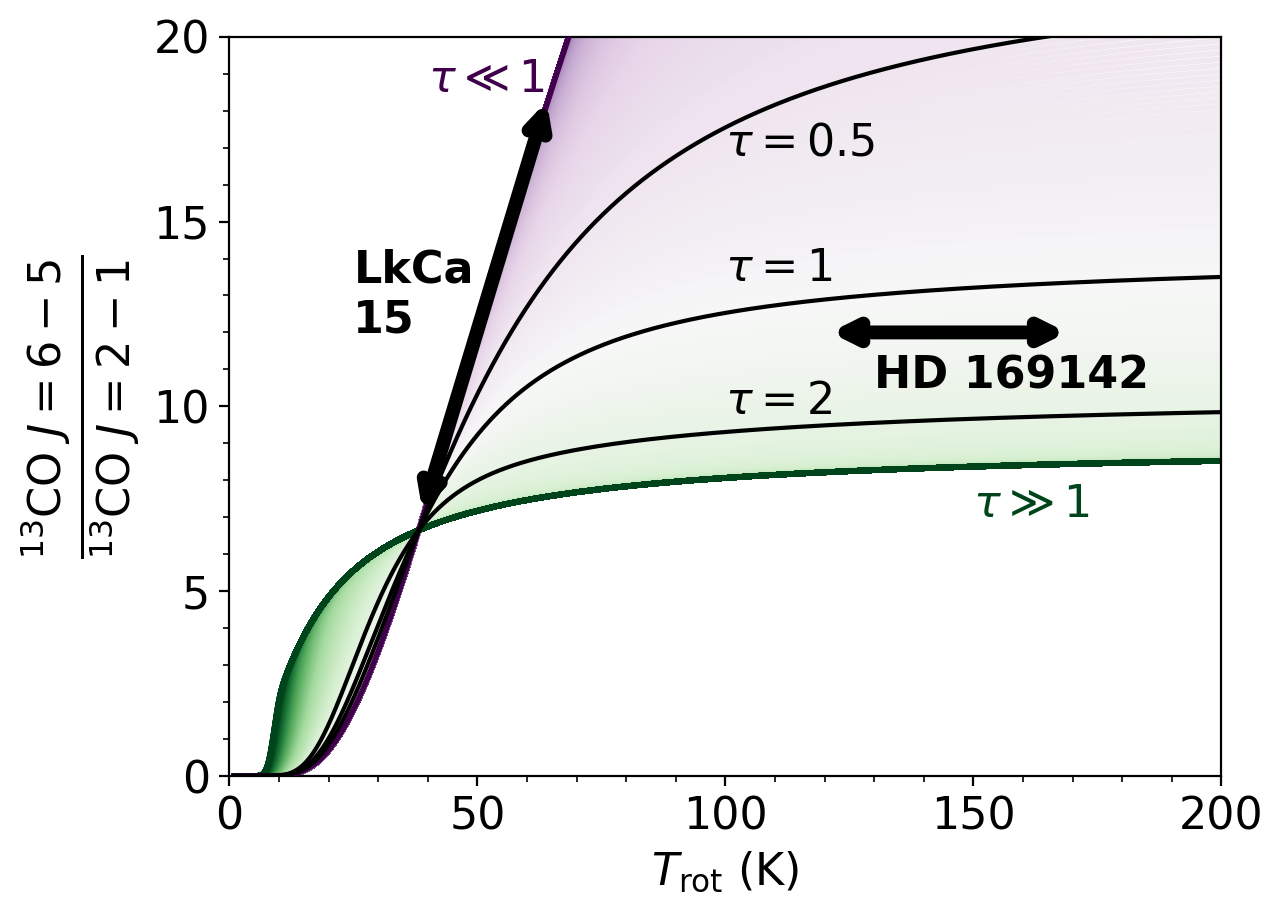
with the partition function of CO at a rotational temperature with rotational constant , and is the Boltzmann constant. LTE excitation is a valid assumption for 13CO and line emission in protoplanetary disks as the critical density is cm cm-3 for the two lines, respectively, which is easily reached even in higher layers. This equation can be solved for the temperature (and column density) as we have observations of both 13CO and . A detailed description of the methods used to solve this equation and to estimate the optical depth can be found in Appendix B.
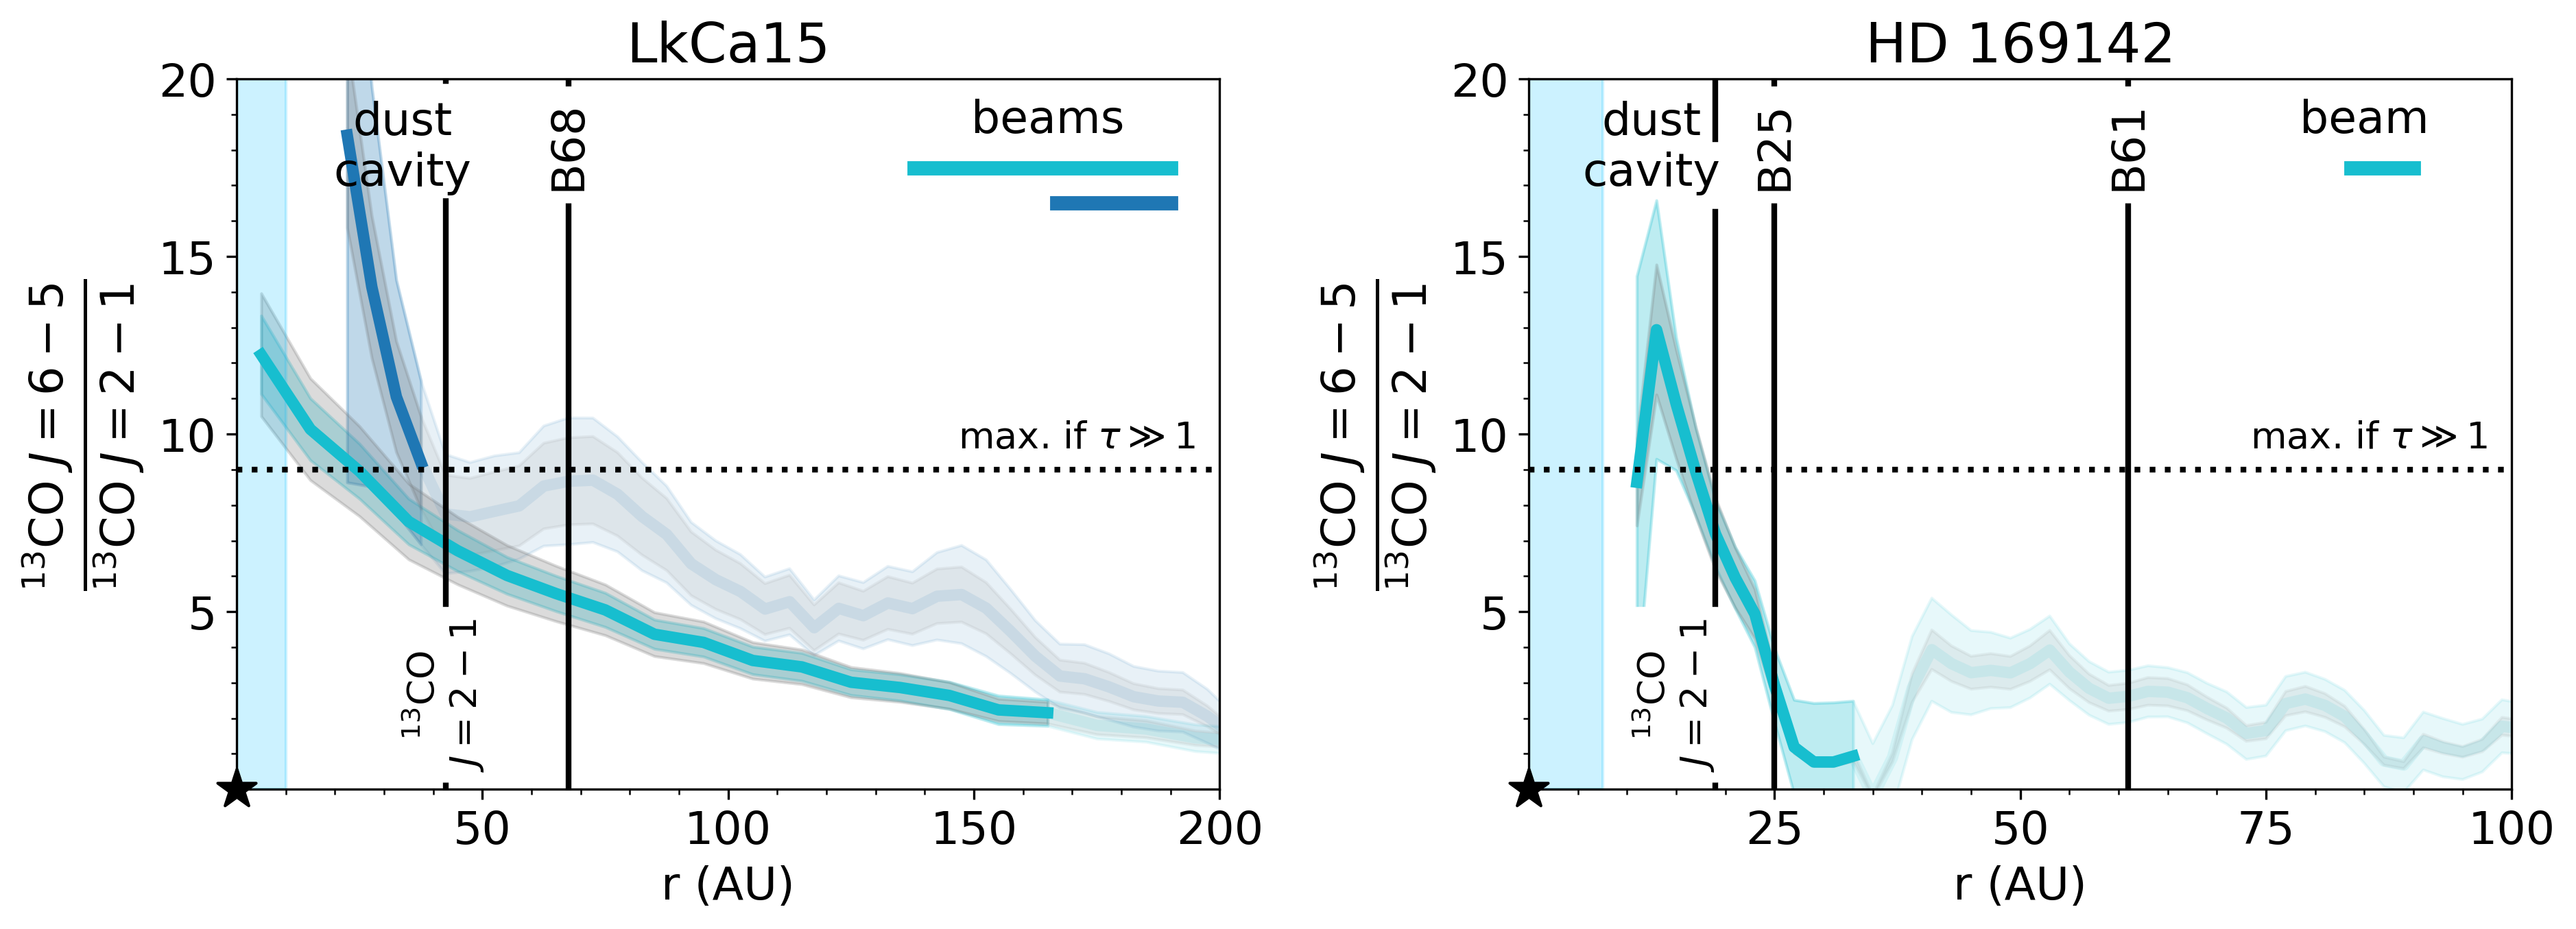
The result of this analytical analysis is shown in Fig. 7. If the emission is optically thin, the line ratio is linearly proportional to the rotational temperature for K. If, on the other hand, the emission is optically thick, the line ratio is only very weakly dependent on the temperature. The predicted line ratio only increases from 8 to 8.5 between temperatures of 90 to 200 K. For higher temperatures, the line ratio approaches , complicating the determination of the temperature.
The line ratio analysis requires that both 13CO lines emit from the same disk layer. The emitting surfaces of molecular line emission in inclined protoplanetary disks can actually be inferred directly from the channel maps, as emission from an elevated layer appears offset compared to the disk center (Pinte et al., 2018; Law et al., 2021; Paneque-Carreño et al., 2021). The upper surface in the disk was traced within hand-drawn masks in each channel containing line emission. For each position along the disk major axis, the location where the emission peaks in the near and far side of the disk are converted to an emitting height using their offset compared to the disk center, the Keplerian velocity and the parameters listed in Table 1. Subsequently, the resulting emitting surface was binned in radius to increase the signal-to-noise ratio.
4.2 Results for LkCa15
The observed line ratio for LkCa15 is presented in Fig. 8, where the lines used for the ratio are convolved to the same beam of or in case of the intermediate and (combined) high resolution observations respectively. The line ratio of the 13CO to transition decreases with radius in the outer disk. This is expected as the temperature of the gas decreases with radius. Furthermore, the data show an increase in the slope inside the dust cavity compared to outside the dust cavity, driven by the drop in 13CO inside 40 AU. Whether this indicates an actual increase in the temperature in the dust cavity or if it is just an optical depth effect is investigated below. The line ratio found from the (combined) high resolution data is consistent with the intermediate resolution data outside 45 AU, within the limitations of the data. The line ratio of the 12CO transition presented in van der Marel et al. (2015) and the 12CO transition in a common beam of is similar in value and trend with radius to the intermediate resolution line ratio of the 13CO isotopologue.
The optical depths of the 13CO , and the C18O transitions at moderate spatial resolution are derived using Eq. 13 and using a upper limit on the integrated C18O intensity inside the dust cavity ( AU; see Fig. 20) as the radial profile derived from the kinematics clearly suggests a much smaller gas cavity of only AU. The optical depth 13CO and C18O transition differ by their isotopologue ratio as this is one of the assumptions used to find the optical depth. The C18O emission is marginally optically thick in the outer disk with an optical depth between and between 70 AU and 200 AU. Consequently, the 13CO emission is optically thick throughout the same disk region. Inside the dust cavity, the optical depths of for the 13CO and for the C18O are upper limits. The optical depth of the 13CO transition follows from the line ratio analysis and lies typically between the optical depth from the aforementioned transitions in the outer disk. Inside the dust cavity, an upper limit on the 13CO optical depth is given. The 13CO and C18O lines could be close to optically thin inside the dust cavity, thus their brightness temperatures are only lower limits to the kinetic temperature.
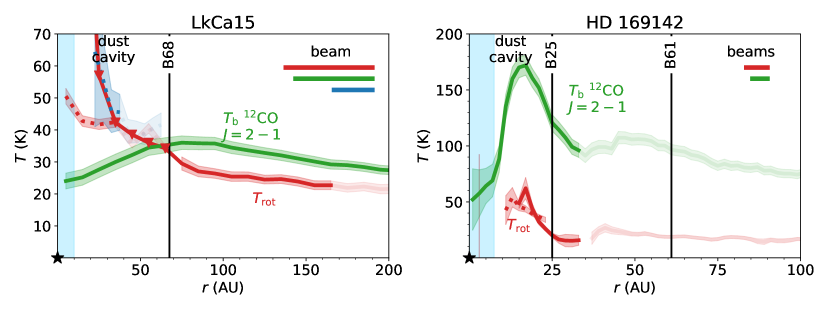
The rotational temperature is presented in the left hand panel of Fig. 9 and increases towards the dust cavity. For comparison, the 12CO brightness temperature is also shown. This transition is surely optically thick outside the dust cavity so the brightness temperature traces the kinetic temperature in the emitting layer of the outer disk. This brightness temperature is K higher than the rotational temperature of 13CO in the outer disk. In the inner disk, the line ratio steeply increases towards the star, indicating a steep increase in the gas temperature.
The (combined) high resolution data for LkCa15 do not have an C18O counterpart. Therefore, the optical depth cannot be determined following the same method as for the intermediate resolution data. Still, the steep increase in the line ratio in the dust cavity and the upper limit on the 13CO optical depth of in the dust cavity at moderate spatial resolution suggest that the gas in the dust cavity is likely optically thin in the two 13CO and the C18O lines. In this case, the temperature derived from the line ratio (blue dotted line in Fig. 9) is very similar to the rotational diagram analysis on the moderate spatial resolution data.222The 40 AU radius MRS of the high resolution 13CO line is not expected to affect this result as it covers most of the dust cavity. Therefore, most flux is recovered in this region.
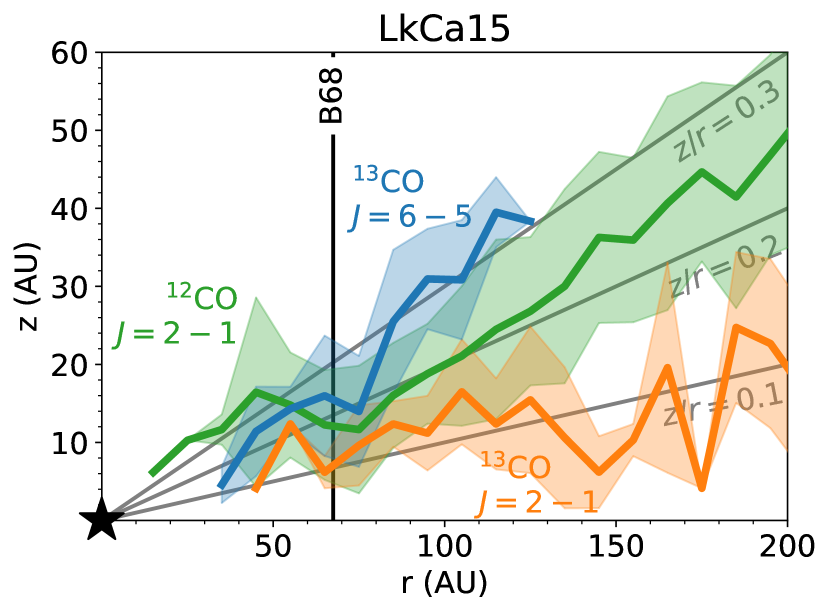
The hypothesis that the 13CO and transitions emit from the same disk region inside the dust cavity is supported by the emitting surfaces presented in Fig. 10. First, we note that the LkCa15 disk is very flat with for the 13CO transition similar to e.g. AS 209, HD 163296 and MWC 480 (Law et al., 2021). At radii smaller than 85 AU, the emitting surfaces of these two transitions measured from the (combined) high resolution data are consistent within the errorbars. Moreover, their brightness temperatures are very similar (Fig. 4), which is as expected if the same layer is traced. Outside this radius of 85 AU, the 13CO and 12CO lines emit from a similar layer at , whereas the 13CO line emits from a lower layer at . This is the first time that we derive directly from the data that the 13CO line indeed emits from a higher layer than the 13CO line.
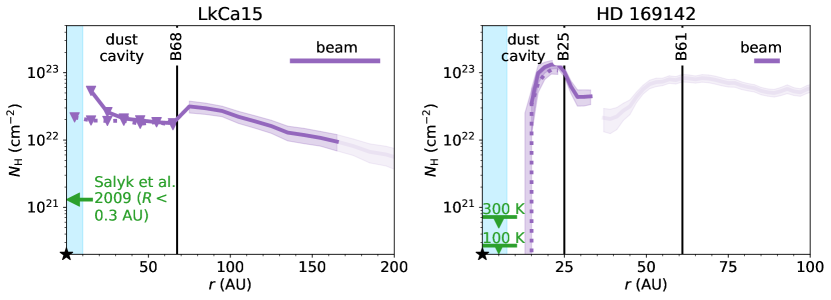
Finally, the total hydrogen column density in the LkCa15 disk is derived using the rotational temperature and the absolute integrated C18O intensity at intermediate resolution, assuming a CO abundance of w.r.t. the total number of hydrogen atoms. As the C18O emission is marginally optically thick throughout the outer disk, the optical depth of the line is explicitly taken into account. The total column density, presented in Fig. 11, increases towards the central star up to AU. However, the exact radius where the gas column density peaks is smaller as argued in Sect. 3.2.3. Inside the dust cavity, the C18O upper limit gives an upper limit of cm-2 at 15 AU, consistent with the value of cm-2 in the inner 0.3 AU using the CO column density derived by Salyk et al. (2009), and with the modelling result found by van der Marel et al. (2015). Furthermore, the derived drop in gas column density inside the dust cavity is a factor of , consistent with the modelling by van der Marel et al. (2015). Finally, we note that the total hydrogen column density in the LkCa15 disk may be higher than the values derived here depending on whether CO is transformed to other species resulting in a CO abundance lower than the assumed value of (Sturm et al. in prep.).
4.3 Results for HD 169142
The fact that 13CO is detected just inside the dust cavity, but drops steeply inwards of 15 AU indicates that the gas cavity is likely very depleted in gas (Figs. 2, 6). Therefore, we focus on the region outside AU. The line ratio of 13CO to 13CO for HD 169142 increases to a value of 13 at the inner edge of the gas cavity and rapidly decreases further out in the disk (Fig. 8) .
The results of the line ratio analysis are shown in the right hand panels of Figs. 9, 20. The optical depths of the lines are comparable to the values found for LkCa15, i.e. the 13CO transition has an optical depth of a few. Furthermore, the temperature in the outer disks of HD 169142 and LkCa15 are similar at K as derived from the line ratio. This derived temperature in the outer disk of HD 169142 is likely very low due to the small MRS of the Band 6 and Band 9 data, which lowers the 13CO and integrated intensities in the outer disk outside AU. Furthermore, at the location of the bright continuum rings, the temperature from the line ratio may be affected by the continuum subtraction of the 13CO and lines used for the line ratio. The bright rim just inside the dust cavity of the HD 169142 disk is warm and (marginally) optically thick in 13CO . The line ratio analysis predicts an increase to K compared to the outer disk, but the uncertainty on the line ratio and optical depth are large. In contrast with the LkCa15 case, the 12CO brightness temperature suggests that the dust cavity is much warmer, up to 170 K, compared to the outer disk ( K).
The total hydrogen column density, derived using the rotational temperature and the integrated C18O intensity (purple line in Fig. 11, right panel), shows similar values at the location of the two rings detected in this disk and a few times higher than in the LkCa15 disk. The HD 169142 column density at 23 AU a factor of 2.5 lower than that modelled by Fedele et al. (2017). This difference is due to the lower spatial resolution and larger MRS of the data used in that work. The drop in the gas column density by a factor 40 in the gap at 56 AU found by Fedele et al. (2017) is not constrained in our work due to the small MRS. The signal-to-noise ratio and MRS of the data are not high enough to determine the expected steady decrease in gas column density in the outer disk outside of AU.
5 Thermochemical models
The analysis in Sect. 4 has shown that the temperature increases inside the dust cavity compared to outside for both the LkCa15 and HD 169142 disks. Furthermore, it was found that the gas is located at smaller radii, AU, than the dust cavity and that the gas cavity is very deep ( drop in gas column density) in the HD 169142 disk. The gas in the dust cavity for LkCa15 could be optically thin, but only an upper limit on the column density could be obtained due to the beam size being comparable to the dust cavity and because the line ratio exceeded the maximum possible value of 9 if both lines are optically thick. Finally, a difference between the temperature derived from the line ratio and the brightness temperature was found. Although this could be due to the MRS being smaller than the angular size of the gas and dust disk in the case of HD 169142, another explanation would be a difference in the emitting layers of the 13CO and transitions. This is in line with the expectation that different lines do not emit from the same disk region due to optical depth and excitation effects (e.g., van Zadelhoff et al. 2001) as also derived directly in the LkCa15 disk (see Fig. 10). In order to investigate this situation, we present some exploratory DALI models following Bruderer (2013). Then we compare our results to other sources and finally discuss the implications.
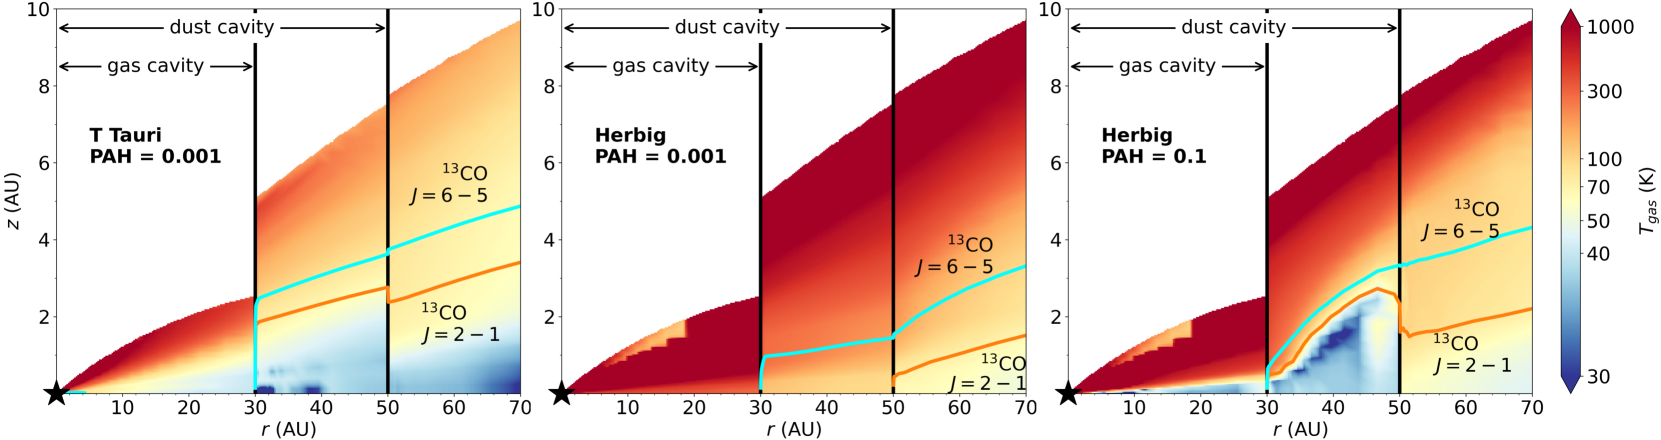
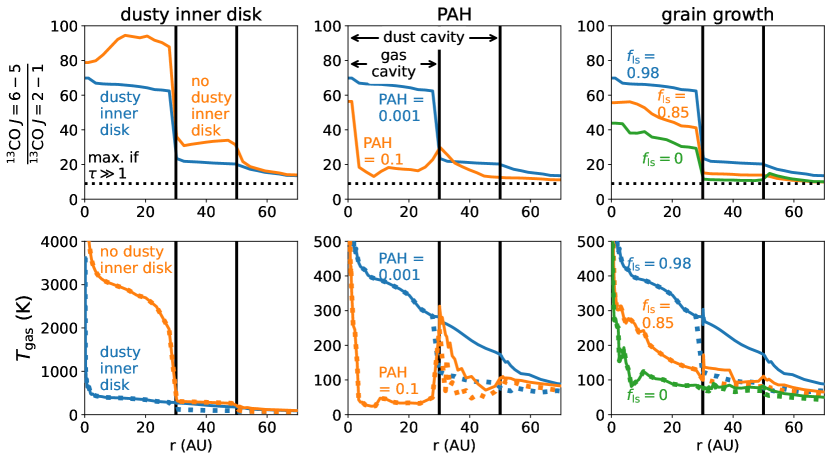
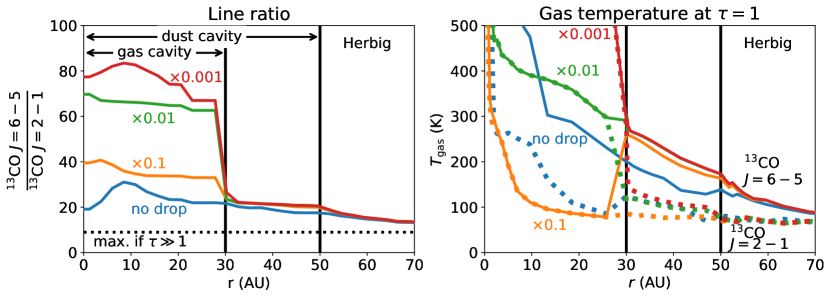
The thermochemical code DALI is used to model the line ratio of the 13CO to transition in the cavities of typical transition disks. A detailed description of the DALI modelling setup is given in Appendix C and in Table 3. We do not attempt to model the individual sources, but look for trends in a set of representative disk models and study the sensitivity to parameters. The fiducial Herbig disk model is a transition disk with a gas cavity with variable gas drop inside 30 AU. The dust cavity extends to 50 AU and a small inner disk of 1 AU is present. The ALMA observations presented in this work mainly probe the region inside the dust cavity but outside the gas cavity corresponding to AU in this model. The density and temperature structure of this model are presented in Fig. 22. The cyan and orange lines show the surfaces of the 13CO and transitions respectively. For gas density drops by factors of , both 13CO lines are (marginally) optically thin in the gas cavity. Outside the gas cavity and in the model with no gas drop in the dust cavity, both lines are optically thick and trace a slightly different layer in the disk.
The predicted 13CO to line ratios for this model with four different gas drops inside 30 AU are presented in the top left hand panel of Fig. 12. This figure shows that the line ratio can reach up to the maximum possible value of 80 for optically thin gas in the gas cavity, due to the high gas temperatures in the gas cavity midplane and both 13CO lines being optically thin. The temperature in the gas cavity midplane increases due to the increased UV radiation field if less gas is present. Note that PAHs are present in the gas even if at small amounts and absorb the UV radiation from the star. This increased radiation field for lower gas densities also changes the chemistry in the cavity by photodissociating CO, the major coolant at a height of AU inside the gas cavity. Therefore, the gas inside 30 AU in the models with a deep gas cavity, cools less efficiently than in the full gas disk model. This results in an increased midplane temperature inside 30 AU with deeper gas cavity depth (compare drops in Fig. 12 right hand panel). In these models with a gas density drop (), the line ratio is a direct probe of the temperature.
Outside the gas cavity but inside the dust cavity and in the outer disk ( AU), the line ratio is larger than 9 which is the maximum theoretical value that is expected when the emission is optically thick. This is because the line emits from a layer with a higher temperature than the line (bottom panel Fig. 22 and 12, top right panel), increasing the line ratio w.r.t. the transition up to 20 in the outer disk. In summary, the line ratio analysis can be used if both lines are emitting from the same disk region. If the lines become optically thick, their emitting regions will deviate, and the brightness temperature becomes a good probe of the temperature of that layer.
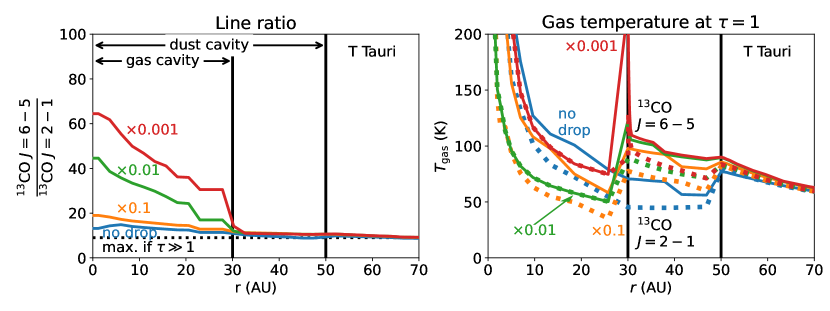
The effect of the host star is investigated as LkCa15 is a 1.1 L⊙ T Tauri star and HD 169142 is a 10 L⊙ Herbig star. The higher luminosity of the Herbig star heats the surrounding disk to higher temperatures as shown in the left two panels of Fig. 13. One of the main heating agents in the disk is molecular hydrogen that is vibrationally excited by the absorption of an FUV photon. The collisional de-excitation then releases this energy to the gas causing it to heat up. This process is most effective in the gas cavity midplane, and at for radii 30 AU. The disk midplane in the T Tauri model is colder than the corresponding region in the Herbig model because the main heating agents, FUV pumped H2 and the photoelectric effect on small grains and PAH, are less effective due to the weaker FUV field and lower luminosity in the T Tauri model.
The line ratio and temperature at the surface for the T Tauri models are presented in the bottom row of Fig. 12. The line ratios in the T Tauri disk models are smaller than the values in the Herbig disk models. This is due to the lower gas temperature in the T Tauri models (Fig. 12, right hand panel). Another difference between the Herbig and the T Tauri models is the temperature of the emitting layers. In the outer disk of the Herbig models, the temperature of the 13CO layer is higher than in the layer, but in the T Tauri models the layers have nearly the same temperature of K. Inside the dust cavity, the temperatures of the and layers differ from each other except within the 30 AU gas cavity for the models with a deep gas cavity (drop ), as the lines become optically thin in this region. The effects of the PAH abundance, the presence of a dusty inner disk and the effects of grain growth are investigated in Appendix C.2.
The exploratory DALI models show that the UV field and the amount of gas in the gas cavity are important for the temperature of the gas in the cavity. The disk models by Bruderer et al. (2009, 2012); Bruderer (2013); Alarcón et al. (2020) do not distinguish between a gas and dust cavity or gap and show that the gas in this region is warmer than the gas outside the cavity or gap. In contrast, the models by Facchini et al. (2017, 2018) show lower temperatures. The main difference between these models are the heating and cooling rates that are taken to be independent of grain sizes and gas-to-dust ratios in the cavities/ gaps in the models by Bruderer (2013), whereas they are dependent on grain sizes in the models by Facchini et al. (2017) and in this work. In our models, we show that the gas temperature not only depends on these choices, but also on the stellar luminosity (Fig. 13). In our T Tauri models with a gas cavity the emitting layer of 13CO and inside the dust cavities ( AU) have a temperature similar to or colder than the outer disk, whereas in the Herbig disk models, we find that the temperature of the emitting layers is generally warmer than the outer disk.
6 Discussion
6.1 Comparing models and observations
The DALI models show that the 13CO to line ratio is a sensitive tracer of the gas temperature in the gas cavity of transition disks if the emission is optically thin. Outside the gas cavity and in the outer disk regions of the models, the two 13CO lines are optically thick, complicating the line ratio analysis, but in this case the brightness temperature can be used to constrain the temperature. The line ratio inside the gas cavity is especially sensitive to the amount of gas in the gas cavity, the presence of a dusty inner disk, the abundance of small grains and PAHs in the gas cavity, as these are all important parameters to set the temperature. A higher line ratio points towards a low PAH abundance, no dusty inner disk, and grain growth.
Our ALMA observations in the HD 169142 disk trace the disk region outside the gas cavity but inside the dust cavity (from 30 to 50 AU in the models and from to 25 AU in the data). In this region, the line ratio is not very sensitive to the amount of gas in the gas cavity due to optical depth effects and because its temperature structure is not affected much when a gas cavity is introduced. In contrast, the line ratio in this disk region is affected by the presence of a dusty inner disk, the abundance of PAHs and grain growth similar to the disk region inside the gas cavity. Therefore, the ALMA line ratio in the HD 169142 disk mainly trace the effects of these parameters rather than the amount of gas in the gas cavity.
The 12CO brightness temperature indicates that the gas is 170 K in this region in the HD 169142 disk, which is consistent with the K temperature range predicted by the DALI models inside the dust cavity but outside the gas cavity. Similarly, the observed brightness temperature of 100 K in the outer disk of HD 169142 is consistent with the typical temperature of the 13CO emitting layers in the fiducial Herbig disk model.
In the case of LkCa15, the gas cavity of AU is unresolved by ALMA observations. Therefore, the observed line ratio likely traces a combination of all effects (gas cavity depth, abundance of PAHs, presence of a dusty inner disk and grain growth) discussed above, complicating the interpretation of the observations. The T Tauri models have a typical temperature of K in the outer disk at their heights, which is higher than the typical temperature of K in the outer disk of LkCa15. Still, the models predict a steep increase in the gas temperature inside the gas cavity. This is likely also traced by our observations, but the large beam smears this out to larger radii up to the dust cavity radius.
6.2 Comparison to other sources
The temperature structure of few other sources has been studied in detail. Recent work on the temperature structure in the transition disk GM Aur has shown that an additional increase of a factor of up to 10 in the gas temperature in the surface layers in the inner disk, inside its dust cavity at 40 AU, compared to the thermochemical model prediction is needed to fit the observed intensities (Schwarz et al., 2021). In contrast, that same model overpredicts the gas temperature in the outer disk by a factor of 2. The increase in temperature inside the GM Aur dust cavity is similar to the steep increase in gas temperature inside the dust cavity found in the LkCa15 and HD 169142 disks. One of their proposed explanations is that the PAH abundance in the surface layer is too low in the GM Aur models. Our models confirm that the abundance of PAHs is important together with the UV field to effectively heat the gas through the photoelectric effect. On the other hand, a high PAH abundance also shields the gas from stellar UV radiation causing a lower gas temperature in the emitting layer. The disk region inside the inner most beam for LkCa15 may even be warmer than what we derived using the 13CO to line ratio, because of beam dilution. This effect is less relevant for HD 169142 as its gas cavity is very depleted in gas.
High resolution 13CO observations probing the inner few AU in the TW Hya disk are not available. The temperature in the outer disk of TW Hya, derived using a similar method to this work, it is also consistent with excitation temperature derived from formaldehyde and methyl cyanide emission (Schwarz et al., 2016; Loomis et al., 2018; Pegues et al., 2020; Terwisscha van Scheltinga et al., 2021). As all of these temperatures are similar to each other, the molecules used likely emit from similar disk regions as the disk is very flat. This situation is similar to our case for LkCa15 which has similar outer disk temperatures as the TW Hya disk and also a shallow vertical temperature gradient.
Modelling by Fedele et al. (2016) has shown that the temperature in four Herbig disks depends on their vertical structure (flaring and scale height) as well as the dust distribution (gas-to-dust ratio and dust settling). Comparing the temperature of the HD 169142 disk to the temperatures found in Herbigs using Herschel observations of the CO ladder shows that HD 169142 is K warmer than the HD 163296 disk at the emitting heights. Furthermore, HD 169142 falls within the range of all four Herbig disks analysed in Fedele et al. (2016).
6.3 Implications for the cause of the gas cavity
Our results have shown that temperature plays a role in lowering the low- lines. One of the most popular alternative explanations for cavities and rings in protoplanetary disks are planets. The deep gas cavity in the HD 169142 disk could be carved by a massive companion. The high signal-to-noise ratio of the 12CO transition constrains the total hydrogen column density in the inner 10 AU to be cm-2 using a upper limit on the integrated 12CO intensity and assuming an average gas temperature of 100300 K, respectively. This upper limit shows that the deep gas cavity that is depleted by at least a factor of , w.r.t. the bright ring seen in the gas. If this cavity is carved by a massive companion, its mass can be estimated using the following equation (Zhang et al., 2018):
| (8) |
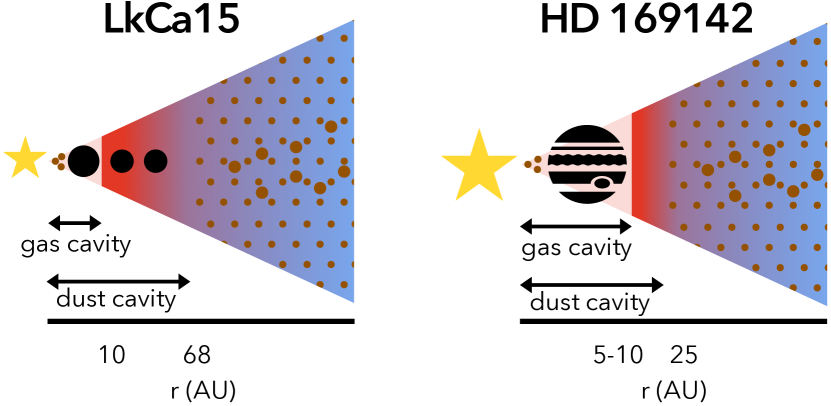
with the mass ratio of the companion to the star, the viscosity and the scale height of the disk. is a dimensionless parameter describing the depth of the gas cavity, , as . The values of and are the best fitting parameters to the hydro simulations of both the gas and the dust performed by Zhang et al. (2018). Fedele et al. (2017) found from models that the disk scale height is 0.07 independent of radius. Assuming a typical disk viscosity of constrains the mass of the potential companion to be MJ for a gas temperature of 100 K in the gas cavity and MJ for 300 K. The mass of the potential planet and the disk viscosity are degenerate. Therefore, a lower disk viscosity of , results in the mass of the potential planet to be MJ (100 K) or MJ (300 K). A cartoon of the proposed scenario is presented in Fig. 14. It is also possible that multiple smaller planets carve the cavity seen in the gas (Dodson-Robinson & Salyk, 2011).
LkCa15 may be hosting multiple low mass planets, as the gas cavity ( AU) is much smaller than the dust cavity (68 AU). In LkCa15, the gas column density drops by at least a factor of 2 inside the dust cavity, though the exact drop cannot be inferred from the observations due to large beam of the C18O data. Still, the CO column density inside 0.3 AU derived by Salyk et al. (2009) constrains the total drop in gas column density inside the gas cavity w.r.t. the outer disk to be a factor 24. The gas detection up to AU points to the presence of multiple low mass planets that are massive enough to carve a cavity in the dust up to 68 AU but not (yet) in the gas (Dong et al., 2015), see Fig. 14.
Another possible mechanism to create cavities in transition disks is internal photoevaporation. In this case low accretion rates of M⊙ yr-1 are expected, as the gas is evaporated from the cavity, preventing it to be accreted onto the central star (Owen et al., 2011; Picogna et al., 2019; Ercolano et al., 2021). The mass-accretion rate of M⊙ yr-1 for LkCa15 can be consistent with internal photoevaporation, but we find that the gas cavity of AU is much smaller than the dust cavity of 68 AU, which is inconsistent with what is expected for a cavity carved by photoevaporation (Donati et al., 2019). These models predict that small grains are removed from the cavity together with the gas, while the larger grains remain present (Franz et al., 2020), such that the cavity seen in gas and small dust is larger than the cavity seen in large dust grains. This is the opposite of what is observed in the LkCa15 disk as the mm-sized grains peak at larger radii (68 AU) than the m-sized grains (56 AU; Thalmann et al. 2014) and our gas data (10 AU). In the case of the HD 169142 disk, the mass accretion rate of (Guzmán-Díaz et al., 2021) is at least one order of magnitude larger than what can be explained by photoevaporation models.
Dead zones can also cause a drop in the gas column density in the inner disk, but the drops due to dead zones are expected to be on the order of a factor of a few (Lyra et al., 2015). The deep drops in the gas column density inside the dust cavities of LkCa15 and HD 169142, together with the presence of gas well inside the dust cavity points to the presence of one or more lower mass planets that are hard to detect. Moreover, multiple planets can produce a gap that has a similar width to a gap with a massive planet, making their detection even more challenging.
7 Conclusions
In this work we used the observed 13CO to line ratio to determine the temperature in the cavities for LkCa15 and HD 169142 with ALMA. The line ratio in the LkCa15 and HD 169142 disks steeply increases inside the dust cavity towards the position of the star in the (combined) high resolution data. Outside the dust cavity, both disks have a relatively low ratio of . The temperature is derived from the line ratio and brightness temperature analysis. Also DALI models are used to investigate the effect of a drop in the dust and gas column density in the dust and gas cavity on the line ratio. Furthermore, we also investigated the effect of the stellar spectrum, PAH abundance, grain growth and a dusty inner disk on the line ratio as these parameters affect the local UV field. Our conclusions are summarized below:
-
1.
The gas cavity is smaller than dust cavity for both disks. Based on the kinematically derived radial profiles we find that the gas in the LkCa15 disk extends down to at least 10 AU, much further than the dust ring at 68 AU. The results for HD 169142 are consistent with a AU gas cavity and a dust ring at 25 AU.
-
2.
The integrated intensity of the 13CO transition is relatively flat in the dust cavity of the LkCa15 disk whereas the transition shows a steep decrease. Therefore, gas is present inside the dust cavity and the excitation is important to determine its column density. The molecular excitation can be constrained directly by the 13CO to line ratio if both lines are optically thin.
-
3.
The line ratio of 13CO to reaches a high value of at the inner rim of the HD 169142 gas (15 AU) disk and it steeply increases towards the position of the star inside the dust cavity of the LkCa15 disk. This indicates that these disk regions are warm compared to the dusty outer disk. The dust cavity of the LkCa15 disk (up to K) is warmer than the outer disk ( K), based on the line ratio analysis. For HD 169142 this analysis is not possible as the lines are optically thick.
-
4.
The brightness temperature of optically thick lines is a good alternative probe of the temperature across the cavity for HD 169142 and indicates that the gas in the dust cavity, up to 170 K, is warmer than in the outer disk, up to K. For LkCa15, the brightness temperature is only a good probe of the temperature in the outer disk due to beam dilution.
-
5.
The factor of drop in gas column density in the HD 169142 cavity indicates that a massive ( MJ) planet may be present in this region. For LkCa15, the extended gas-rich region inside the dust cavity may be indicative of several lower mass planets.
-
6.
The DALI models show that the 13CO and transition emit from different layers in the disk if the lines are optically thick. Their line ratio in the cavities of transition disks can reach high values up to the theoretical maximum value of 80 depending on the model. In general, models with a high luminosity, a low PAH abundance, no dusty inner disk and a large fraction of large grains predict the highest temperatures and line ratios.
-
7.
The vertical structure inferred from the channel maps in the LkCa15 disk is very flat with a typical scale height of for the 13CO transition. Furthermore, the 13CO transition emits from a higher disk layer () than the 13CO transition, consistent with thermochemical models.
In summary, the brightness temperature is a good probe of the disk temperature if the (low-) CO lines are optically thick (e.g. for HD 169142). If the lines are optically thin, the 13CO to line ratio is a sensitive probe of the gas temperature. The intermediate case, where these lines are marginally optically thin or not very optically thick, the analysis is more difficult (e.g. for LkCa15). The line ratio analysis in LkCa15 clearly shows that an intensity drop in a low- CO line does not necessarily require a drop in the CO column density. This work also highlights that resolving the cavities with more than one beam and with good sampling of the relevant scales is crucial for the analysis. High spatial resolution ALMA observations of high- CO isotopologs (both optically thick and thin) of a much larger sample of transition disks is needed to nail down the combined temperature and column density structure of the gas inside dust cavities, and thus, ultimately, the mechanism responsible for carving them.
Acknowledgements.
We thank the referee for the constructive comments. Astrochemistry in Leiden is supported by the Netherlands Research School for Astronomy (NOVA), by funding from the European Research Council (ERC) under the European Union’s Horizon 2020 research and innovation programme (grant agreement No. 101019751 MOLDISK), and by the Dutch Research Council (NWO) grants 618.000.001 and TOP-1 614.001.751. Support by the Danish National Research Foundation through the Center of Excellence “InterCat” (Grant agreement no.: DNRF150) is also acknowledged. A.D.B. acknowledges support from NSF AAG grant No. 1907653. This paper makes use of the following ALMA data: ADS/JAO.ALMA #2016.1.00344.S, #2017.1.00727.S, #2018.1.00945.S, and #2018.1.01255.S. ALMA is a partnership of ESO (representing its member states), NSF (USA) and NINS (Japan), together with NRC (Canada), MOST and ASIAA (Taiwan), and KASI (Republic of Korea), in cooperation with the Republic of Chile. The Joint ALMA Observatory is operated by ESO, AUI/NRAO and NAOJ.References
- Alarcón et al. (2020) Alarcón, F., Teague, R., Zhang, K., Bergin, E. A., & Barraza-Alfaro, M. 2020, ApJ, 905, 68
- Andrews (2020) Andrews, S. M. 2020, ARA&A, 58, 483
- Andrews et al. (2018) Andrews, S. M., Huang, J., Pérez, L. M., et al. 2018, ApJ, 869, L41
- Andrews et al. (2011) Andrews, S. M., Wilner, D. J., Espaillat, C., et al. 2011, ApJ, 732, 42
- Andrews et al. (2010) Andrews, S. M., Wilner, D. J., Hughes, A. M., Qi, C., & Dullemond, C. P. 2010, ApJ, 723, 1241
- Bakes & Tielens (1994) Bakes, E. L. O. & Tielens, A. G. G. M. 1994, ApJ, 427, 822
- Benisty et al. (2021) Benisty, M., Bae, J., Facchini, S., et al. 2021, ApJ, 916, L2
- Binkert et al. (2021) Binkert, F., Szulágyi, J., & Birnstiel, T. 2021, MNRAS, 506, 5969
- Birnstiel et al. (2015) Birnstiel, T., Andrews, S. M., Pinilla, P., & Kama, M. 2015, ApJ, 813, L14
- Blondel & Djie (2006) Blondel, P. F. C. & Djie, H. R. E. T. A. 2006, A&A, 456, 1045
- Bosman et al. (2021) Bosman, A. D., Bergin, E. A., Loomis, R. A., et al. 2021, ApJS, 257, 15
- Botschwina et al. (1993) Botschwina, P., Horn, M., Flügge, J., & Seeger, S. 1993, J. Chem. Soc., Faraday Trans., 89, 2219
- Brown et al. (2007) Brown, J. M., Blake, G. A., Dullemond, C. P., et al. 2007, ApJ, 664, L107
- Bruderer (2013) Bruderer, S. 2013, A&A, 559, A46
- Bruderer et al. (2009) Bruderer, S., Doty, S. D., & Benz, A. O. 2009, ApJS, 183, 179
- Bruderer et al. (2014) Bruderer, S., van der Marel, N., van Dishoeck, E. F., & van Kempen, T. A. 2014, A&A, 562, A26
- Bruderer et al. (2012) Bruderer, S., van Dishoeck, E. F., Doty, S. D., & Herczeg, G. J. 2012, A&A, 541, A91
- Bryden et al. (1999) Bryden, G., Chen, X., Lin, D. N. C., Nelson, R. P., & Papaloizou, J. C. B. 1999, ApJ, 514, 344
- Calahan et al. (2021) Calahan, J. K., Bergin, E., Zhang, K., et al. 2021, ApJ, 908, 8
- Carney et al. (2018) Carney, M. T., Fedele, D., Hogerheijde, M. R., et al. 2018, A&A, 614, A106
- Casassus & Pérez (2019) Casassus, S. & Pérez, S. 2019, ApJ, 883, L41
- Chen et al. (2019) Chen, L., Moór, A., Kreplin, A., et al. 2019, ApJ, 887, L32
- Clarke et al. (2001) Clarke, C. J., Gendrin, A., & Sotomayor, M. 2001, MNRAS, 328, 485
- Cleeves et al. (2015) Cleeves, L. I., Bergin, E. A., & Harries, T. J. 2015, ApJ, 807, 2
- Cornwell (2008) Cornwell, T. J. 2008, IEEE Journal of Selected Topics in Signal Processing, 2, 793
- Currie et al. (2017) Currie, T., Brittain, S., Grady, C. A., Kenyon, S. J., & Muto, T. 2017, Research Notes of the American Astronomical Society, 1, 40
- Currie et al. (2019) Currie, T., Marois, C., Cieza, L., et al. 2019, ApJ, 877, L3
- Czekala et al. (2021) Czekala, I., Loomis, R. A., Teague, R., et al. 2021, ApJS, 257, 2
- de Juan Ovelar et al. (2013) de Juan Ovelar, M., Min, M., Dominik, C., et al. 2013, A&A, 560, A111
- Dent et al. (2013) Dent, W. R. F., Thi, W. F., Kamp, I., et al. 2013, PASP, 125, 477
- Dipierro et al. (2015) Dipierro, G., Price, D., Laibe, G., et al. 2015, MNRAS, 453, L73
- Dodson-Robinson & Salyk (2011) Dodson-Robinson, S. E. & Salyk, C. 2011, ApJ, 738, 131
- Donati et al. (2019) Donati, J. F., Bouvier, J., Alencar, S. H., et al. 2019, MNRAS, 483, L1
- Dong et al. (2018) Dong, R., Liu, S.-y., Eisner, J., et al. 2018, ApJ, 860, 124
- Dong et al. (2015) Dong, R., Zhu, Z., & Whitney, B. 2015, ApJ, 809, 93
- Dullemond et al. (2001) Dullemond, C. P., Dominik, C., & Natta, A. 2001, ApJ, 560, 957
- Ercolano et al. (2021) Ercolano, B., Picogna, G., Monsch, K., Drake, J. J., & Preibisch, T. 2021, MNRAS, 508, 1675
- Facchini et al. (2020) Facchini, S., Benisty, M., Bae, J., et al. 2020, A&A, 639, A121
- Facchini et al. (2017) Facchini, S., Birnstiel, T., Bruderer, S., & van Dishoeck, E. F. 2017, A&A, 605, A16
- Facchini et al. (2018) Facchini, S., Pinilla, P., van Dishoeck, E. F., & de Juan Ovelar, M. 2018, A&A, 612, A104
- Facchini et al. (2021) Facchini, S., Teague, R., Bae, J., et al. 2021, AJ, 162, 99
- Fedele et al. (2013) Fedele, D., Bruderer, S., van Dishoeck, E. F., et al. 2013, ApJ, 776, L3
- Fedele et al. (2017) Fedele, D., Carney, M., Hogerheijde, M. R., et al. 2017, A&A, 600, A72
- Fedele et al. (2016) Fedele, D., van Dishoeck, E. F., Kama, M., Bruderer, S., & Hogerheijde, M. R. 2016, A&A, 591, A95
- Flock et al. (2015) Flock, M., Ruge, J. P., Dzyurkevich, N., et al. 2015, A&A, 574, A68
- Flower (1999) Flower, D. R. 1999, MNRAS, 305, 651
- Follette et al. (2017) Follette, K. B., Rameau, J., Dong, R., et al. 2017, AJ, 153, 264
- Francis & van der Marel (2020) Francis, L. & van der Marel, N. 2020, ApJ, 892, 111
- Franz et al. (2020) Franz, R., Picogna, G., Ercolano, B., & Birnstiel, T. 2020, A&A, 635, A53
- Gaia Collaboration et al. (2018) Gaia Collaboration, Brown, A. G. A., Vallenari, A., et al. 2018, A&A, 616, A1
- Geers et al. (2007a) Geers, V. C., Pontoppidan, K. M., van Dishoeck, E. F., et al. 2007a, A&A, 469, L35
- Geers et al. (2007b) Geers, V. C., van Dishoeck, E. F., Visser, R., et al. 2007b, A&A, 476, 279
- Goldsmith & Langer (1999) Goldsmith, P. F. & Langer, W. D. 1999, ApJ, 517, 209
- Gorti & Hollenbach (2004) Gorti, U. & Hollenbach, D. 2004, ApJ, 613, 424
- Grady et al. (2007) Grady, C. A., Schneider, G., Hamaguchi, K., et al. 2007, ApJ, 665, 1391
- Gray et al. (2017) Gray, R. O., Riggs, Q. S., Koen, C., et al. 2017, AJ, 154, 31
- Green et al. (2013) Green, J. D., Evans, Neal J., I., Jørgensen, J. K., et al. 2013, ApJ, 770, 123
- Guzmán-Díaz et al. (2021) Guzmán-Díaz, J., Mendigutía, I., Montesinos, B., et al. 2021, A&A, 650, A182
- Habart et al. (2006) Habart, E., Natta, A., Testi, L., & Carbillet, M. 2006, A&A, 449, 1067
- Haffert et al. (2019) Haffert, S. Y., Bohn, A. J., de Boer, J., et al. 2019, Nat. Astron., 3, 749
- Hartmann et al. (1998) Hartmann, L., Calvet, N., Gullbring, E., & D’Alessio, P. 1998, ApJ, 495, 385
- Huang et al. (2018) Huang, J., Andrews, S. M., Dullemond, C. P., et al. 2018, ApJ, 869, L42
- Isella et al. (2019) Isella, A., Benisty, M., Teague, R., et al. 2019, ApJ, 879, L25
- Isella et al. (2016) Isella, A., Guidi, G., Testi, L., et al. 2016, Phys. Rev. Lett., 117, 251101
- Izquierdo et al. (2021) Izquierdo, A. F., Facchini, S., Rosotti, G. P., van Dishoeck, E. F., & Testi, L. 2021, arXiv e-prints, arXiv:2111.06367
- Jonkheid et al. (2006) Jonkheid, B., Kamp, I., Augereau, J. C., & van Dishoeck, E. F. 2006, A&A, 453, 163
- Kama et al. (2016) Kama, M., Bruderer, S., van Dishoeck, E. F., et al. 2016, A&A, 592, A83
- Kamp & van Zadelhoff (2001) Kamp, I. & van Zadelhoff, G. J. 2001, A&A, 373, 641
- Keppler et al. (2018) Keppler, M., Benisty, M., Müller, A., et al. 2018, A&A, 617, A44
- Kraus & Ireland (2012) Kraus, A. L. & Ireland, M. J. 2012, ApJ, 745, 5
- Law et al. (2021) Law, C. J., Teague, R., Loomis, R. A., et al. 2021, ApJS, 257, 4
- Leemker et al. (2021) Leemker, M., van’t Hoff, M. L. R., Trapman, L., et al. 2021, A&A, 646, A3
- Long et al. (2018) Long, F., Pinilla, P., Herczeg, G. J., et al. 2018, ApJ, 869, 17
- Loomis et al. (2018) Loomis, R. A., Cleeves, L. I., Öberg, K. I., et al. 2018, ApJ, 859, 131
- Lynden-Bell & Pringle (1974) Lynden-Bell, D. & Pringle, J. E. 1974, MNRAS, 168, 603
- Lyra et al. (2015) Lyra, W., Turner, N. J., & McNally, C. P. 2015, A&A, 574, A10
- Malfait et al. (1998) Malfait, K., Bogaert, E., & Waelkens, C. 1998, A&A, 331, 211
- Mathews et al. (2013) Mathews, G. S., Klaassen, P. D., Juhász, A., et al. 2013, A&A, 557, A132
- Mathis et al. (1977) Mathis, J. S., Rumpl, W., & Nordsieck, K. H. 1977, ApJ, 217, 425
- McMullin et al. (2007) McMullin, J. P., Waters, B., Schiebel, D., Young, W., & Golap, K. 2007, in Astronomical Society of the Pacific Conference Series, Vol. 376, Astronomical Data Analysis Software and Systems XVI, ed. R. A. Shaw, F. Hill, & D. J. Bell, 127
- Meeus et al. (2012) Meeus, G., Montesinos, B., Mendigutía, I., et al. 2012, A&A, 544, A78
- Meeus et al. (2013) Meeus, G., Salyk, C., Bruderer, S., et al. 2013, A&A, 559, A84
- Merín et al. (2010) Merín, B., Brown, J. M., Oliveira, I., et al. 2010, ApJ, 718, 1200
- Milam et al. (2005) Milam, S. N., Savage, C., Brewster, M. A., Ziurys, L. M., & Wyckoff, S. 2005, ApJ, 634, 1126
- Öberg et al. (2021) Öberg, K. I., Guzmán, V. V., Walsh, C., et al. 2021, ApJS, 257, 1
- Oh et al. (2016) Oh, D., Hashimoto, J., Tamura, M., et al. 2016, PASJ, 68, L3
- Osorio et al. (2014) Osorio, M., Anglada, G., Carrasco-González, C., et al. 2014, ApJ, 791, L36
- Owen et al. (2011) Owen, J. E., Ercolano, B., & Clarke, C. J. 2011, MNRAS, 412, 13
- Paneque-Carreño et al. (2021) Paneque-Carreño, T., Miotello, A., van Dishoeck, E. F., & et al. 2021, A&A, submitted
- Panić et al. (2008) Panić, O., Hogerheijde, M. R., Wilner, D., & Qi, C. 2008, A&A, 491, 219
- Pegues et al. (2020) Pegues, J., Öberg, K. I., Bergner, J. B., et al. 2020, ApJ, 890, 142
- Pérez et al. (2019) Pérez, S., Casassus, S., Baruteau, C., et al. 2019, AJ, 158, 15
- Perez et al. (2015) Perez, S., Casassus, S., Ménard, F., et al. 2015, ApJ, 798, 85
- Picogna et al. (2019) Picogna, G., Ercolano, B., Owen, J. E., & Weber, M. L. 2019, MNRAS, 487, 691
- Pinilla et al. (2012) Pinilla, P., Benisty, M., & Birnstiel, T. 2012, A&A, 545, A81
- Pinilla et al. (2016) Pinilla, P., Klarmann, L., Birnstiel, T., et al. 2016, A&A, 585, A35
- Pinte et al. (2018) Pinte, C., Ménard, F., Duchêne, G., et al. 2018, A&A, 609, A47
- Pinte et al. (2019) Pinte, C., van der Plas, G., Ménard, F., et al. 2019, Nat. Astron., 3, 1109
- Qi et al. (2019) Qi, C., Öberg, K. I., Espaillat, C. C., et al. 2019, ApJ, 882, 160
- Qi et al. (2013) Qi, C., Öberg, K. I., Wilner, D. J., et al. 2013, Science, 341, 630
- Quanz et al. (2013a) Quanz, S. P., Amara, A., Meyer, M. R., et al. 2013a, ApJ, 766, L1
- Quanz et al. (2013b) Quanz, S. P., Avenhaus, H., Buenzli, E., et al. 2013b, ApJ, 766, L2
- Rab et al. (2020) Rab, C., Kamp, I., Dominik, C., et al. 2020, A&A, 642, A165
- Raman et al. (2006) Raman, A., Lisanti, M., Wilner, D. J., Qi, C., & Hogerheijde, M. 2006, AJ, 131, 2290
- Rameau et al. (2017) Rameau, J., Follette, K. B., Pueyo, L., et al. 2017, AJ, 153, 244
- Reggiani et al. (2014) Reggiani, M., Quanz, S. P., Meyer, M. R., et al. 2014, ApJ, 792, L23
- Rosotti et al. (2016) Rosotti, G. P., Juhasz, A., Booth, R. A., & Clarke, C. J. 2016, MNRAS, 459, 2790
- Sallum et al. (2015) Sallum, S., Follette, K. B., Eisner, J. A., et al. 2015, Nature, 527, 342
- Salyk et al. (2009) Salyk, C., Blake, G. A., Boogert, A. C. A., & Brown, J. M. 2009, ApJ, 699, 330
- Schöier et al. (2005) Schöier, F. L., van der Tak, F. F. S., van Dishoeck, E. F., & Black, J. H. 2005, A&A, 432, 369
- Schwarz et al. (2016) Schwarz, K. R., Bergin, E. A., Cleeves, L. I., et al. 2016, ApJ, 823, 91
- Schwarz et al. (2021) Schwarz, K. R., Calahan, J. K., Zhang, K., et al. 2021, ApJS, 257, 20
- Simon et al. (2016) Simon, M. N., Pascucci, I., Edwards, S., et al. 2016, ApJ, 831, 169
- Sturm et al. (2010) Sturm, B., Bouwman, J., Henning, T., et al. 2010, A&A, 518, L129
- Szulágyi et al. (2018) Szulágyi, J., Plas, G. v. d., Meyer, M. R., et al. 2018, MNRAS, 473, 3573
- Teague et al. (2019) Teague, R., Bae, J., & Bergin, E. A. 2019, Nature, 574, 378
- Teague et al. (2018) Teague, R., Bae, J., Bergin, E. A., Birnstiel, T., & Foreman-Mackey, D. 2018, ApJ, 860, L12
- Terwisscha van Scheltinga et al. (2021) Terwisscha van Scheltinga, J., Hogerheijde, M. R., Cleeves, L. I., et al. 2021, ApJ, 906, 111
- Thalmann et al. (2016) Thalmann, C., Janson, M., Garufi, A., et al. 2016, ApJ, 828, L17
- Thalmann et al. (2014) Thalmann, C., Mulders, G. D., Hodapp, K., et al. 2014, A&A, 566, A51
- Toci et al. (2020) Toci, C., Lodato, G., Fedele, D., Testi, L., & Pinte, C. 2020, ApJ, 888, L4
- Tschudi & Schmid (2021) Tschudi, C. & Schmid, H. M. 2021, A&A, 655, A37
- van der Marel et al. (2016) van der Marel, N., van Dishoeck, E. F., Bruderer, S., et al. 2016, A&A, 585, A58
- van der Marel et al. (2015) van der Marel, N., van Dishoeck, E. F., Bruderer, S., Pérez, L., & Isella, A. 2015, A&A, 579, A106
- van der Marel et al. (2018) van der Marel, N., Williams, J. P., Ansdell, M., et al. 2018, ApJ, 854, 177
- van ’t Hoff et al. (2018) van ’t Hoff, M. L. R., Tobin, J. J., Trapman, L., et al. 2018, ApJ, 864, L23
- van ’t Hoff et al. (2017) van ’t Hoff, M. L. R., Walsh, C., Kama, M., Facchini, S., & van Dishoeck, E. F. 2017, A&A, 599, A101
- van Zadelhoff et al. (2001) van Zadelhoff, G. J., van Dishoeck, E. F., Thi, W. F., & Blake, G. A. 2001, A&A, 377, 566
- Villenave et al. (2020) Villenave, M., Ménard, F., Dent, W. R. F., et al. 2020, A&A, 642, A164
- Visser et al. (2007) Visser, R., Geers, V. C., Dullemond, C. P., et al. 2007, A&A, 466, 229
- Wagner et al. (2015) Wagner, K. R., Sitko, M. L., Grady, C. A., et al. 2015, ApJ, 798, 94
- Walsh et al. (2014) Walsh, C., Juhász, A., Pinilla, P., et al. 2014, ApJ, 791, L6
- Weaver et al. (2018) Weaver, E., Isella, A., & Boehler, Y. 2018, ApJ, 853, 113
- Weingartner & Draine (2001) Weingartner, J. C. & Draine, B. T. 2001, ApJS, 134, 263
- Wilson (1999) Wilson, T. L. 1999, Reports on Progress in Physics, 62, 143
- Woitke et al. (2009) Woitke, P., Kamp, I., & Thi, W. F. 2009, A&A, 501, 383
- Wölfer et al. (2021) Wölfer, L., Facchini, S., Kurtovic, N. T., et al. 2021, A&A, 648, A19
- Wolk & Walter (1996) Wolk, S. J. & Walter, F. M. 1996, AJ, 111, 2066
- Woodall et al. (2007) Woodall, J., Agúndez, M., Markwick-Kemper, A. J., & Millar, T. J. 2007, A&A, 466, 1197
- Zhang et al. (2015) Zhang, K., Blake, G. A., & Bergin, E. A. 2015, ApJ, 806, L7
- Zhang et al. (2018) Zhang, S., Zhu, Z., Huang, J., et al. 2018, ApJ, 869, L47
- Zhu et al. (2014) Zhu, Z., Stone, J. M., Rafikov, R. R., & Bai, X.-n. 2014, ApJ, 785, 122
Appendix A Observations
A.1 Channel maps 13CO
The channel maps of the 13CO transition in the LkCa15 and HD 169142 disks are presented in Fig. 15 and 16, respectively.
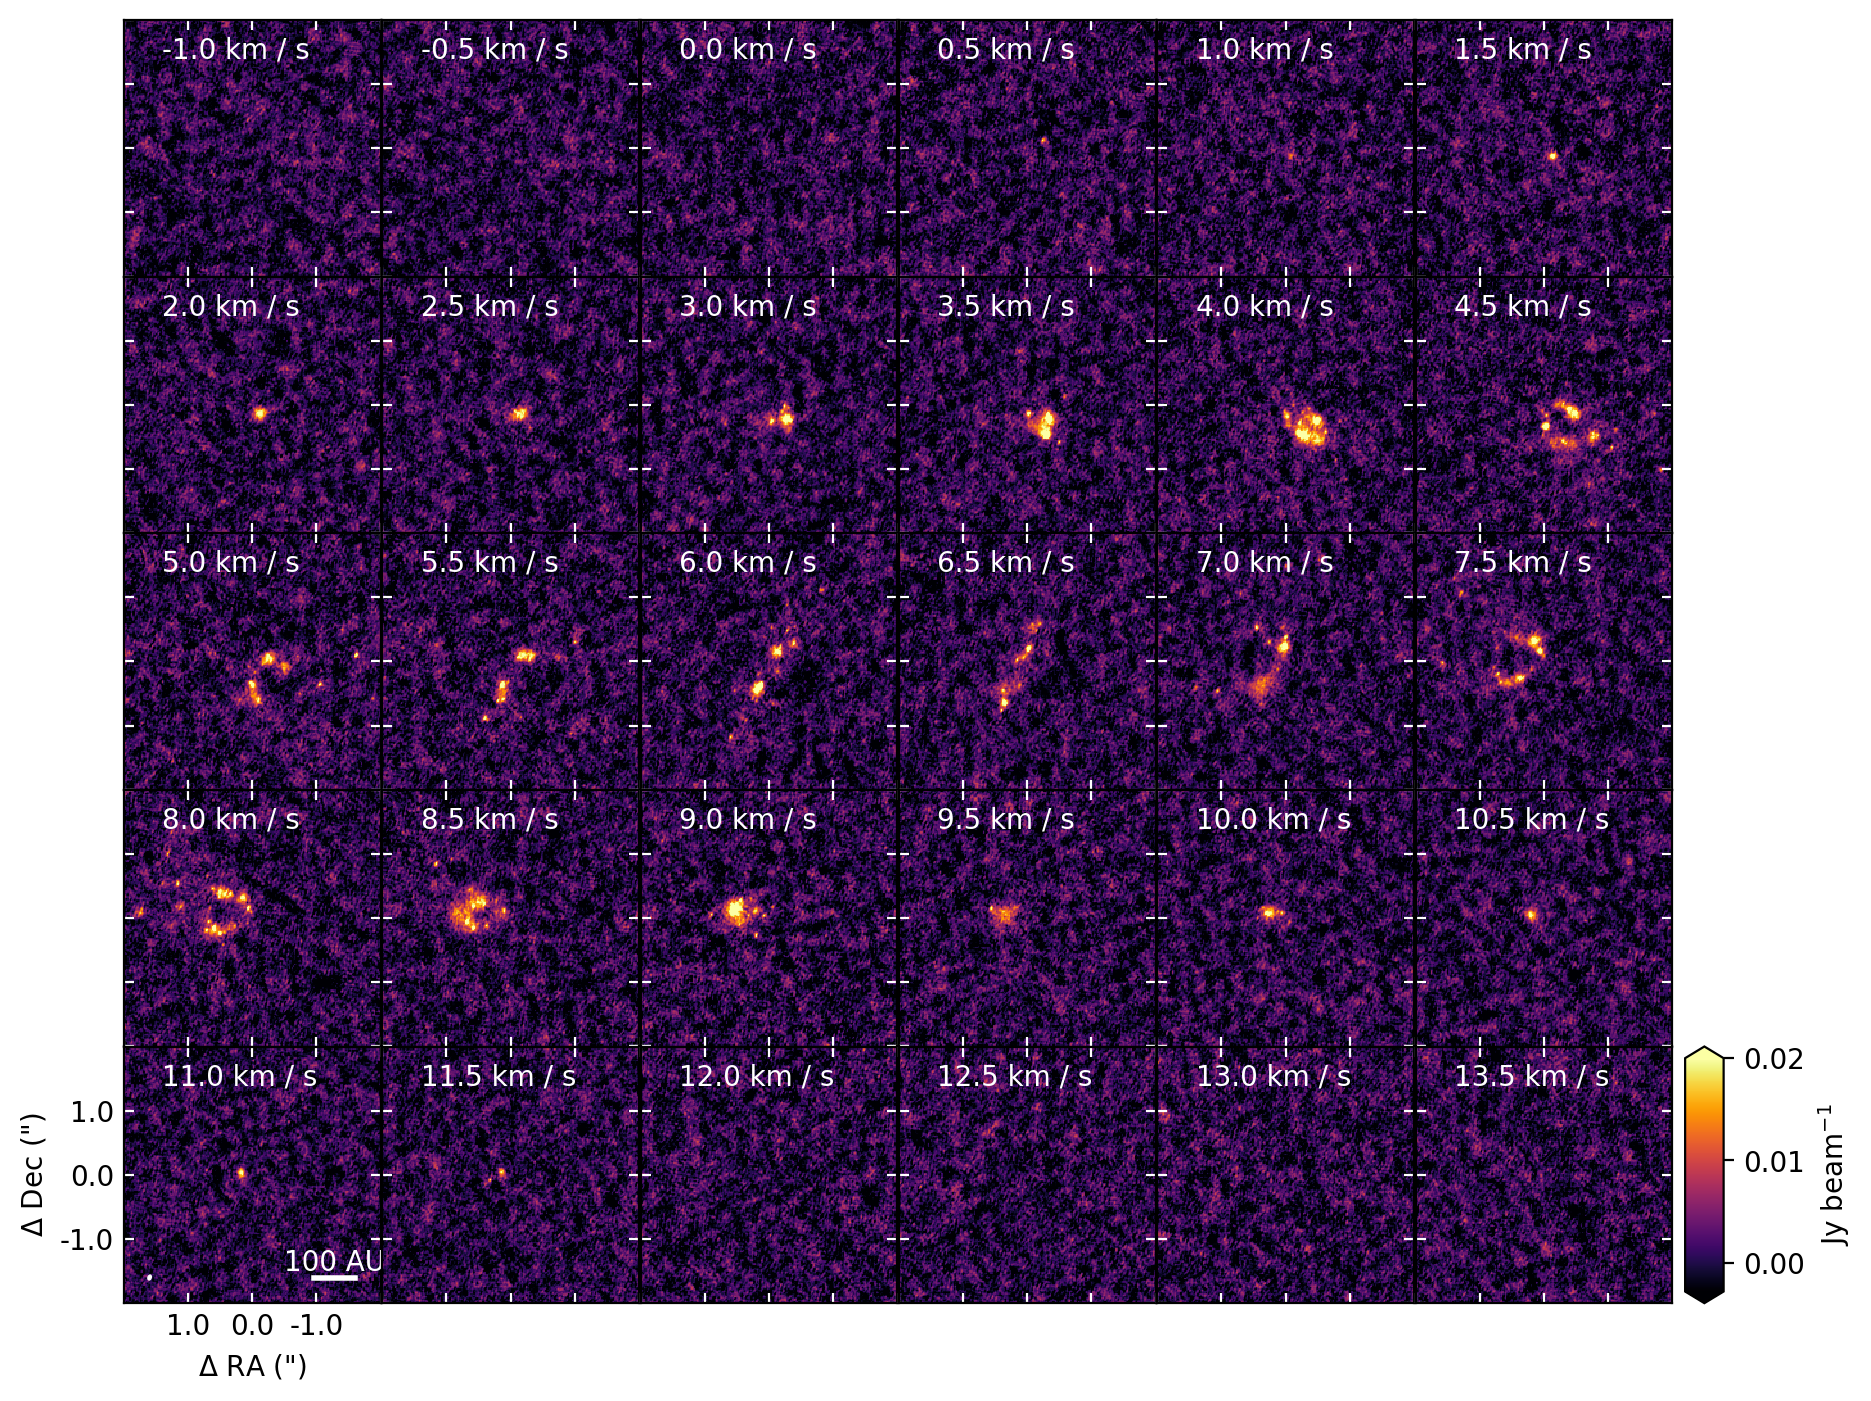

A.2 Azimuthally averaged radial profiles
The deprojected azimuthal averages of the CO isotopologue emission are presented in Fig. 17.
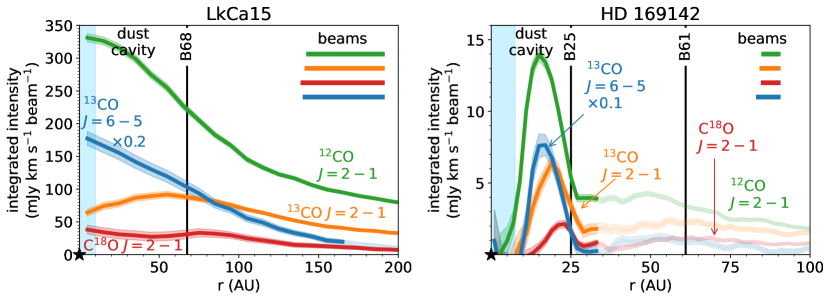
A.3 Brightness temperature
The brightness temperature of an optically thick line is calculated using the peak flux. However, a low spectral resolution can lower this peak flux compared to the true value. In this Section, we quantify this effect for the 13CO emission. The spectral resolution of the dataset covering the 13CO line is 0.17 km s-1, whereas that of the dataset is 0.44 km s-1 in HD 169142. Therefore, the former dataset better samples the line profile and hence the peak flux of the 13CO emission than the latter. The effect of underestimating the peak flux due to a lower spectral resolution is shown in Fig. 18, where the brightness temperature of the 13CO transition is shown at two spectral resolutions: 0.17 km s-1 (native resolution solid orange line) and 0.44 km s-1 (binned, dashed orange line). This figure shows that binning lowers the brightness temperature by 10-15 K, corresponding to 10-30%, compared to the brightness temperature at the native spectral resolution. For comparison the brightness temperature of the 13CO , at 0.44 km s-1 is shown as the blue dashed line. This figure shows that the low spectral resolution of the 13CO data is partially responsible for the difference between the and brightness temperatures discussed in Section 3.2.2. Similarly, in the LkCa15 disk, the lowering the spectral resolution of the high spatial resolution 13CO line from 0.17 km s-1 to 0.5 km s-1, lowers the peak brightness temperature by 6-13 K or 40-60%. Therefore, the 13CO brightness temperature in LkCa15 is likely underestimated due to the spectral resolution.
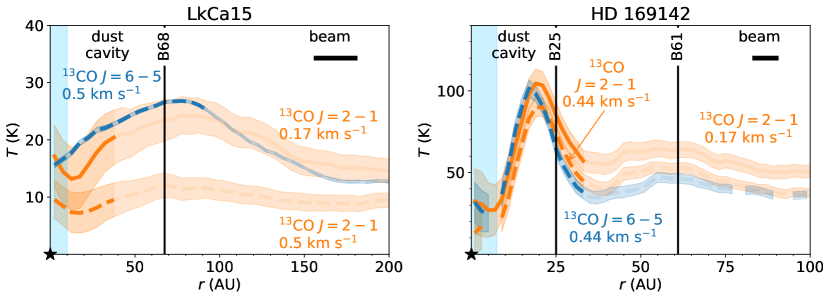
A.4 Spectra
The signal-to-noise ratio of the spectra used for the kinematically derived radial profiles is presented in Fig. 6. The signal-to-noise ratio is the highest for the 12CO and 13CO transitions in the line wings, therefore these lines are also detected out to the smallest radii.
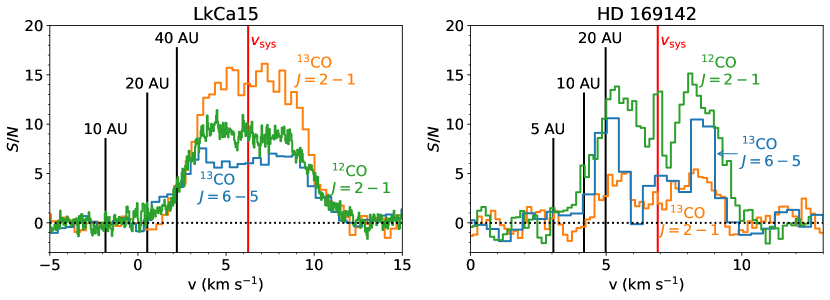
Appendix B Line ratio analysis
B.1 Temperature and column density
Rotational diagrams can be used to derive the temperature and column density of the gas observationally (e.g. Goldsmith & Langer 1999; Schwarz et al. 2016; Loomis et al. 2018; Pegues et al. 2020; Terwisscha van Scheltinga et al. 2021). The relation between the column density and rotational temperature, as discussed in Section 4, can best be solved in -space:
| (9) | ||||
| (10) |
where we used the correction factor for the optical depth in the last line. The optical depth is discussed in the next Section.
B.2 Optical depth
The observations cover both 13CO and C18O . Therefore, the ratio of these two lines can be used to derive the optical depth of 13CO . The equation of radiative transfer can be written as:
| (11) |
with the brightness temperature obtained from the non-continuum subtracted map and the excitation temperature of the line. The excitation temperatures of 13CO and C18O are similar if both emit from the same region of the disk. Therefore, we can write:
| (12) |
As the line widths of the 13CO and C18O transitions are similar, this line ratio is similar to the ratio of their integrated intensities, :
| (13) |
Furthermore, the ratio of the optical depths of 13CO and C18O is identical to the isotopologue ratio, which we assume to be 8 (Wilson 1999). The isotopologue ratio for 12CO to 13CO is assumed to be 70 (Milam et al. 2005). The uncertainty on the optical depths is dominated by the uncertainty on the line ratio of the 13CO to the C18O transition. Assuming a 10 % higher 12C/13C ratio of 77, lowers the optical depths of the 13CO and C18O transitions slightly but the values remain consistent within the error bars in the disk region where C18O is detected inside the MRS. Therefore, the uncertainty on the isotopologue ratio is neglected.
The optical depth of the 13CO line can not be estimated in this way as no C18O observations are available. Therefore, we use an analytical expression for the optical depth (Goldsmith & Langer 1999):
| (14) |
This can be related to the optical depth of 13CO , by taking the ratio of the two optical depths:
| (15) |
This expression can be simplified by using the Planck function, assuming that the linewidths are similar, and using that the ratio of the column densities is determined by a Boltzmann distribution:
| (16) |
with the degeneracy of level for CO. The derived optical depths are presented in Fig. 20. The 13CO emission outside the dust cavity is optically thick in both disks as expected, the C18O transition is moderately optically thick. The optical depths of all transitions in the dust cavity of LkCa15 are upper limits as an upper limit on the integrated C18O intensity was used. In the case of HD 169142, the optical depth estimates outside 35 AU may be affected by the maximum resolvable scale of these observations.
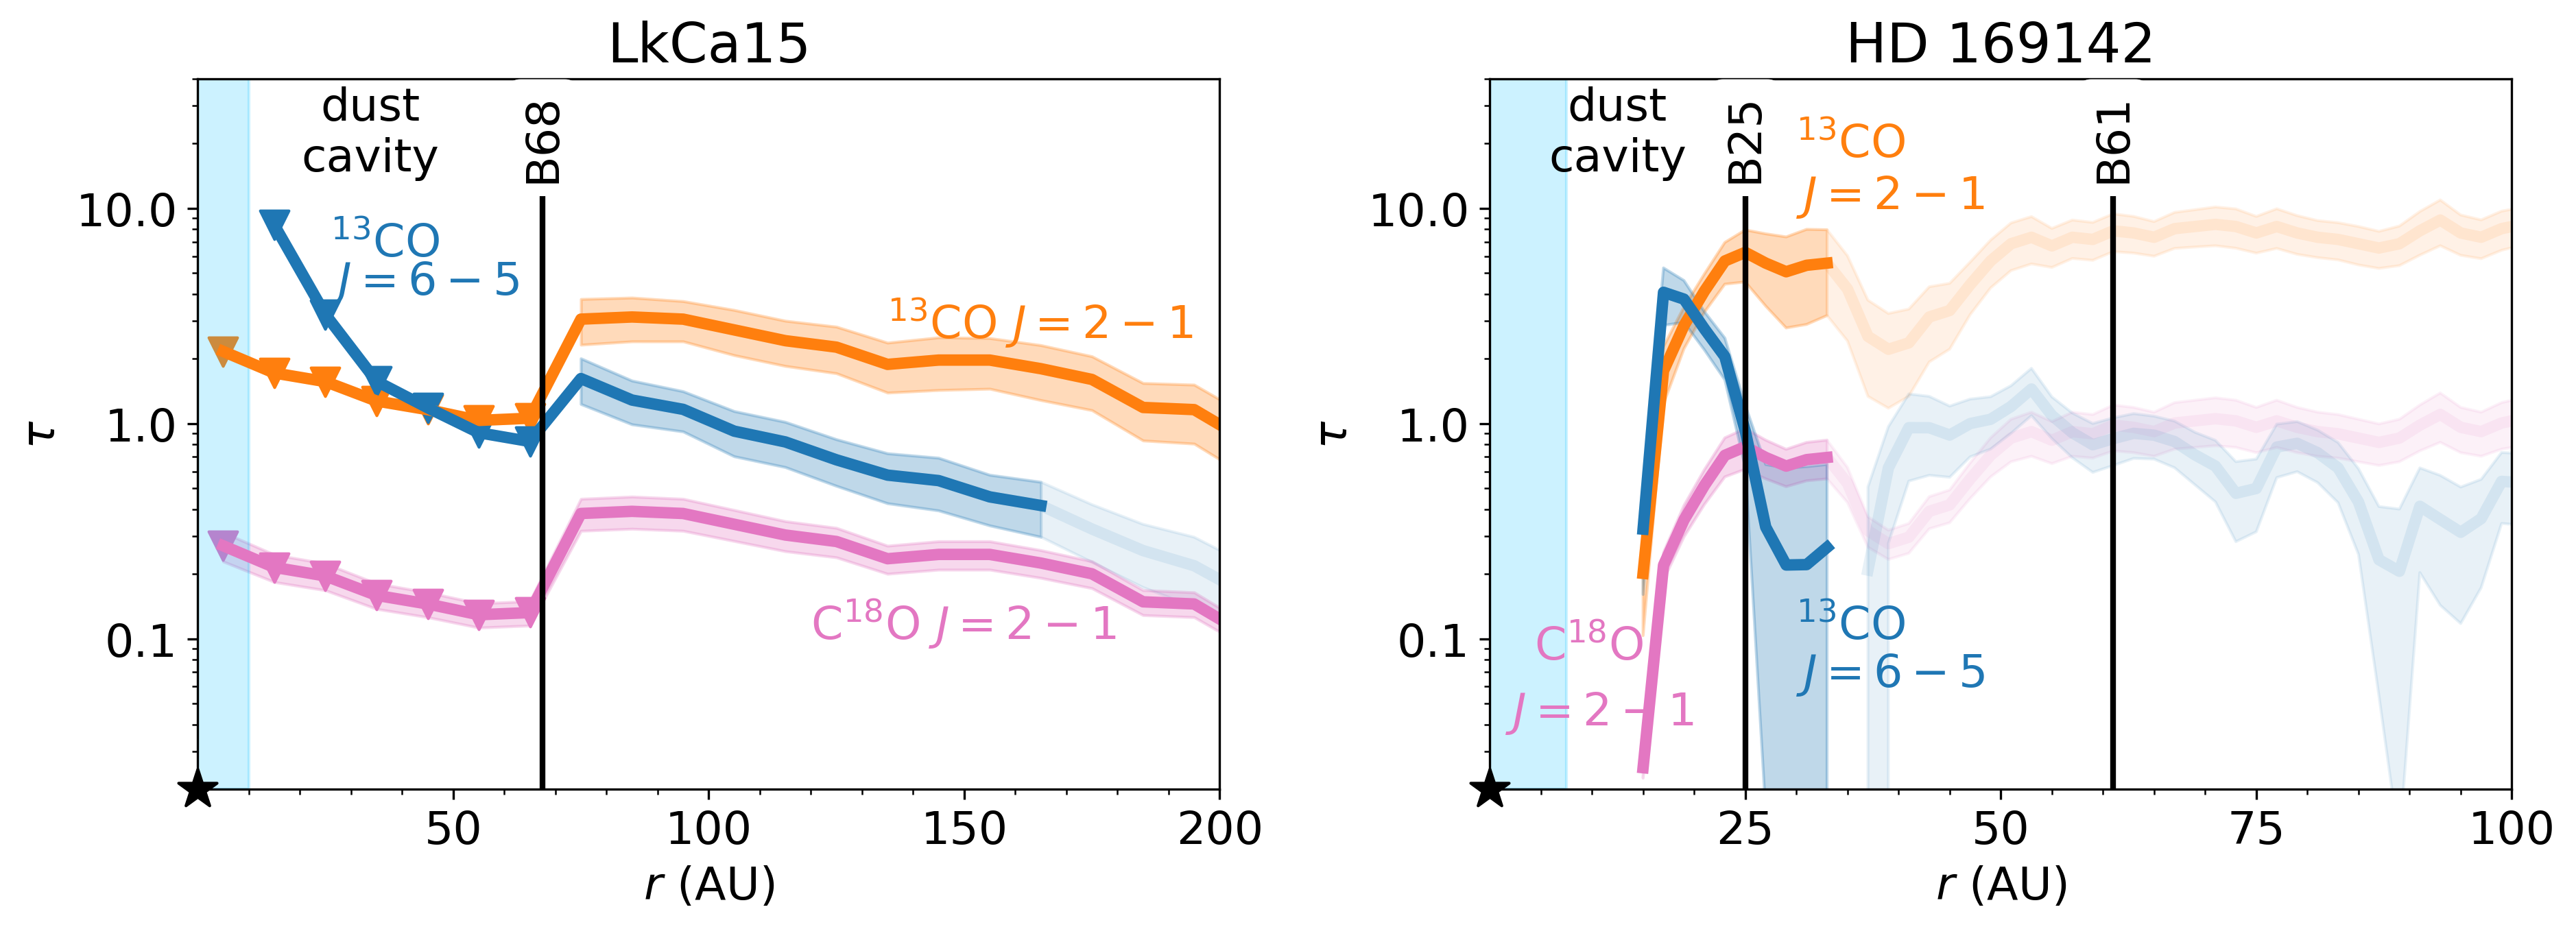
Appendix C DALI
C.1 Model setup
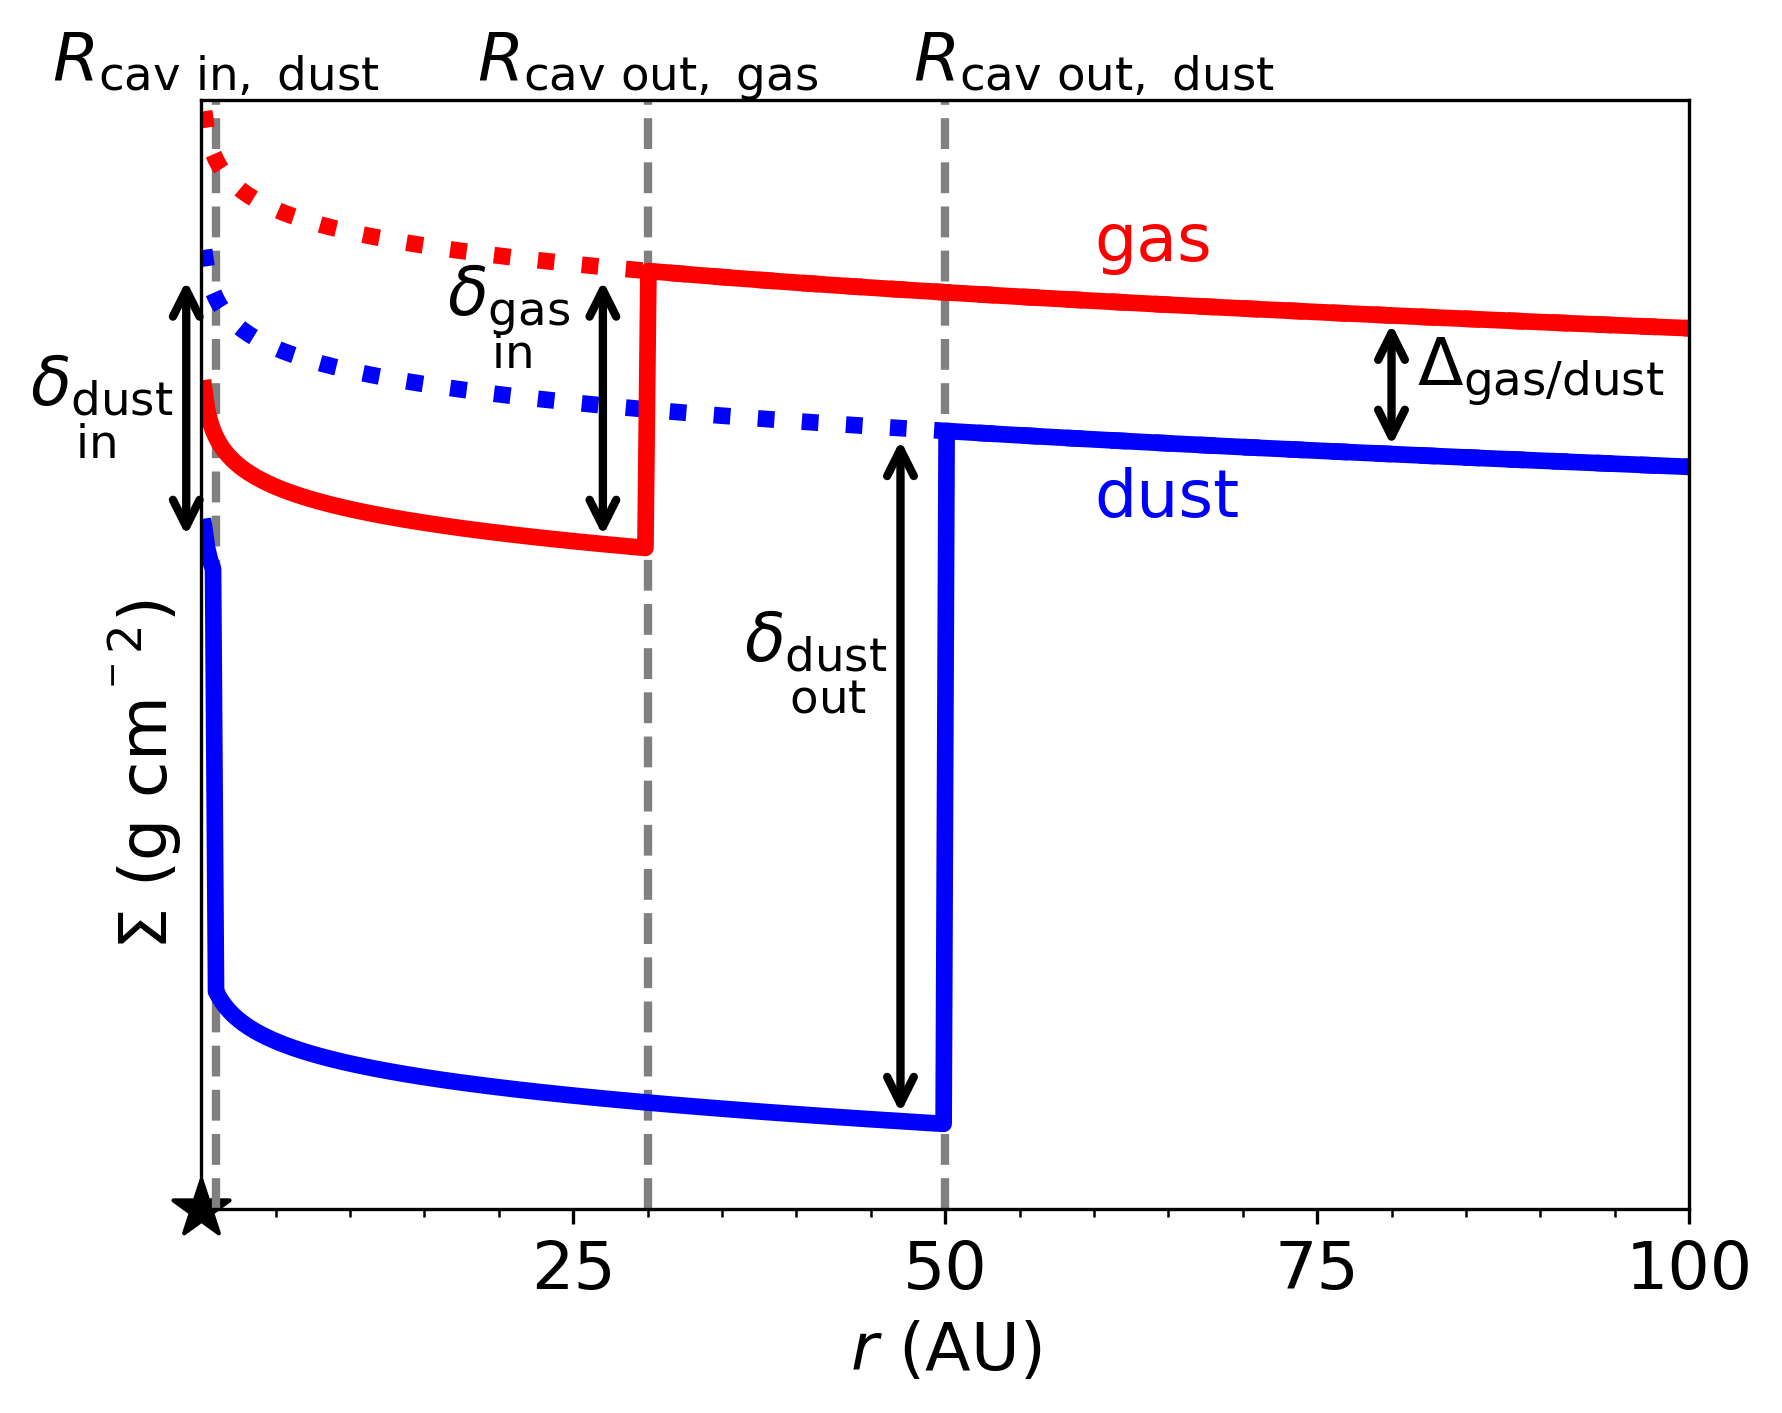
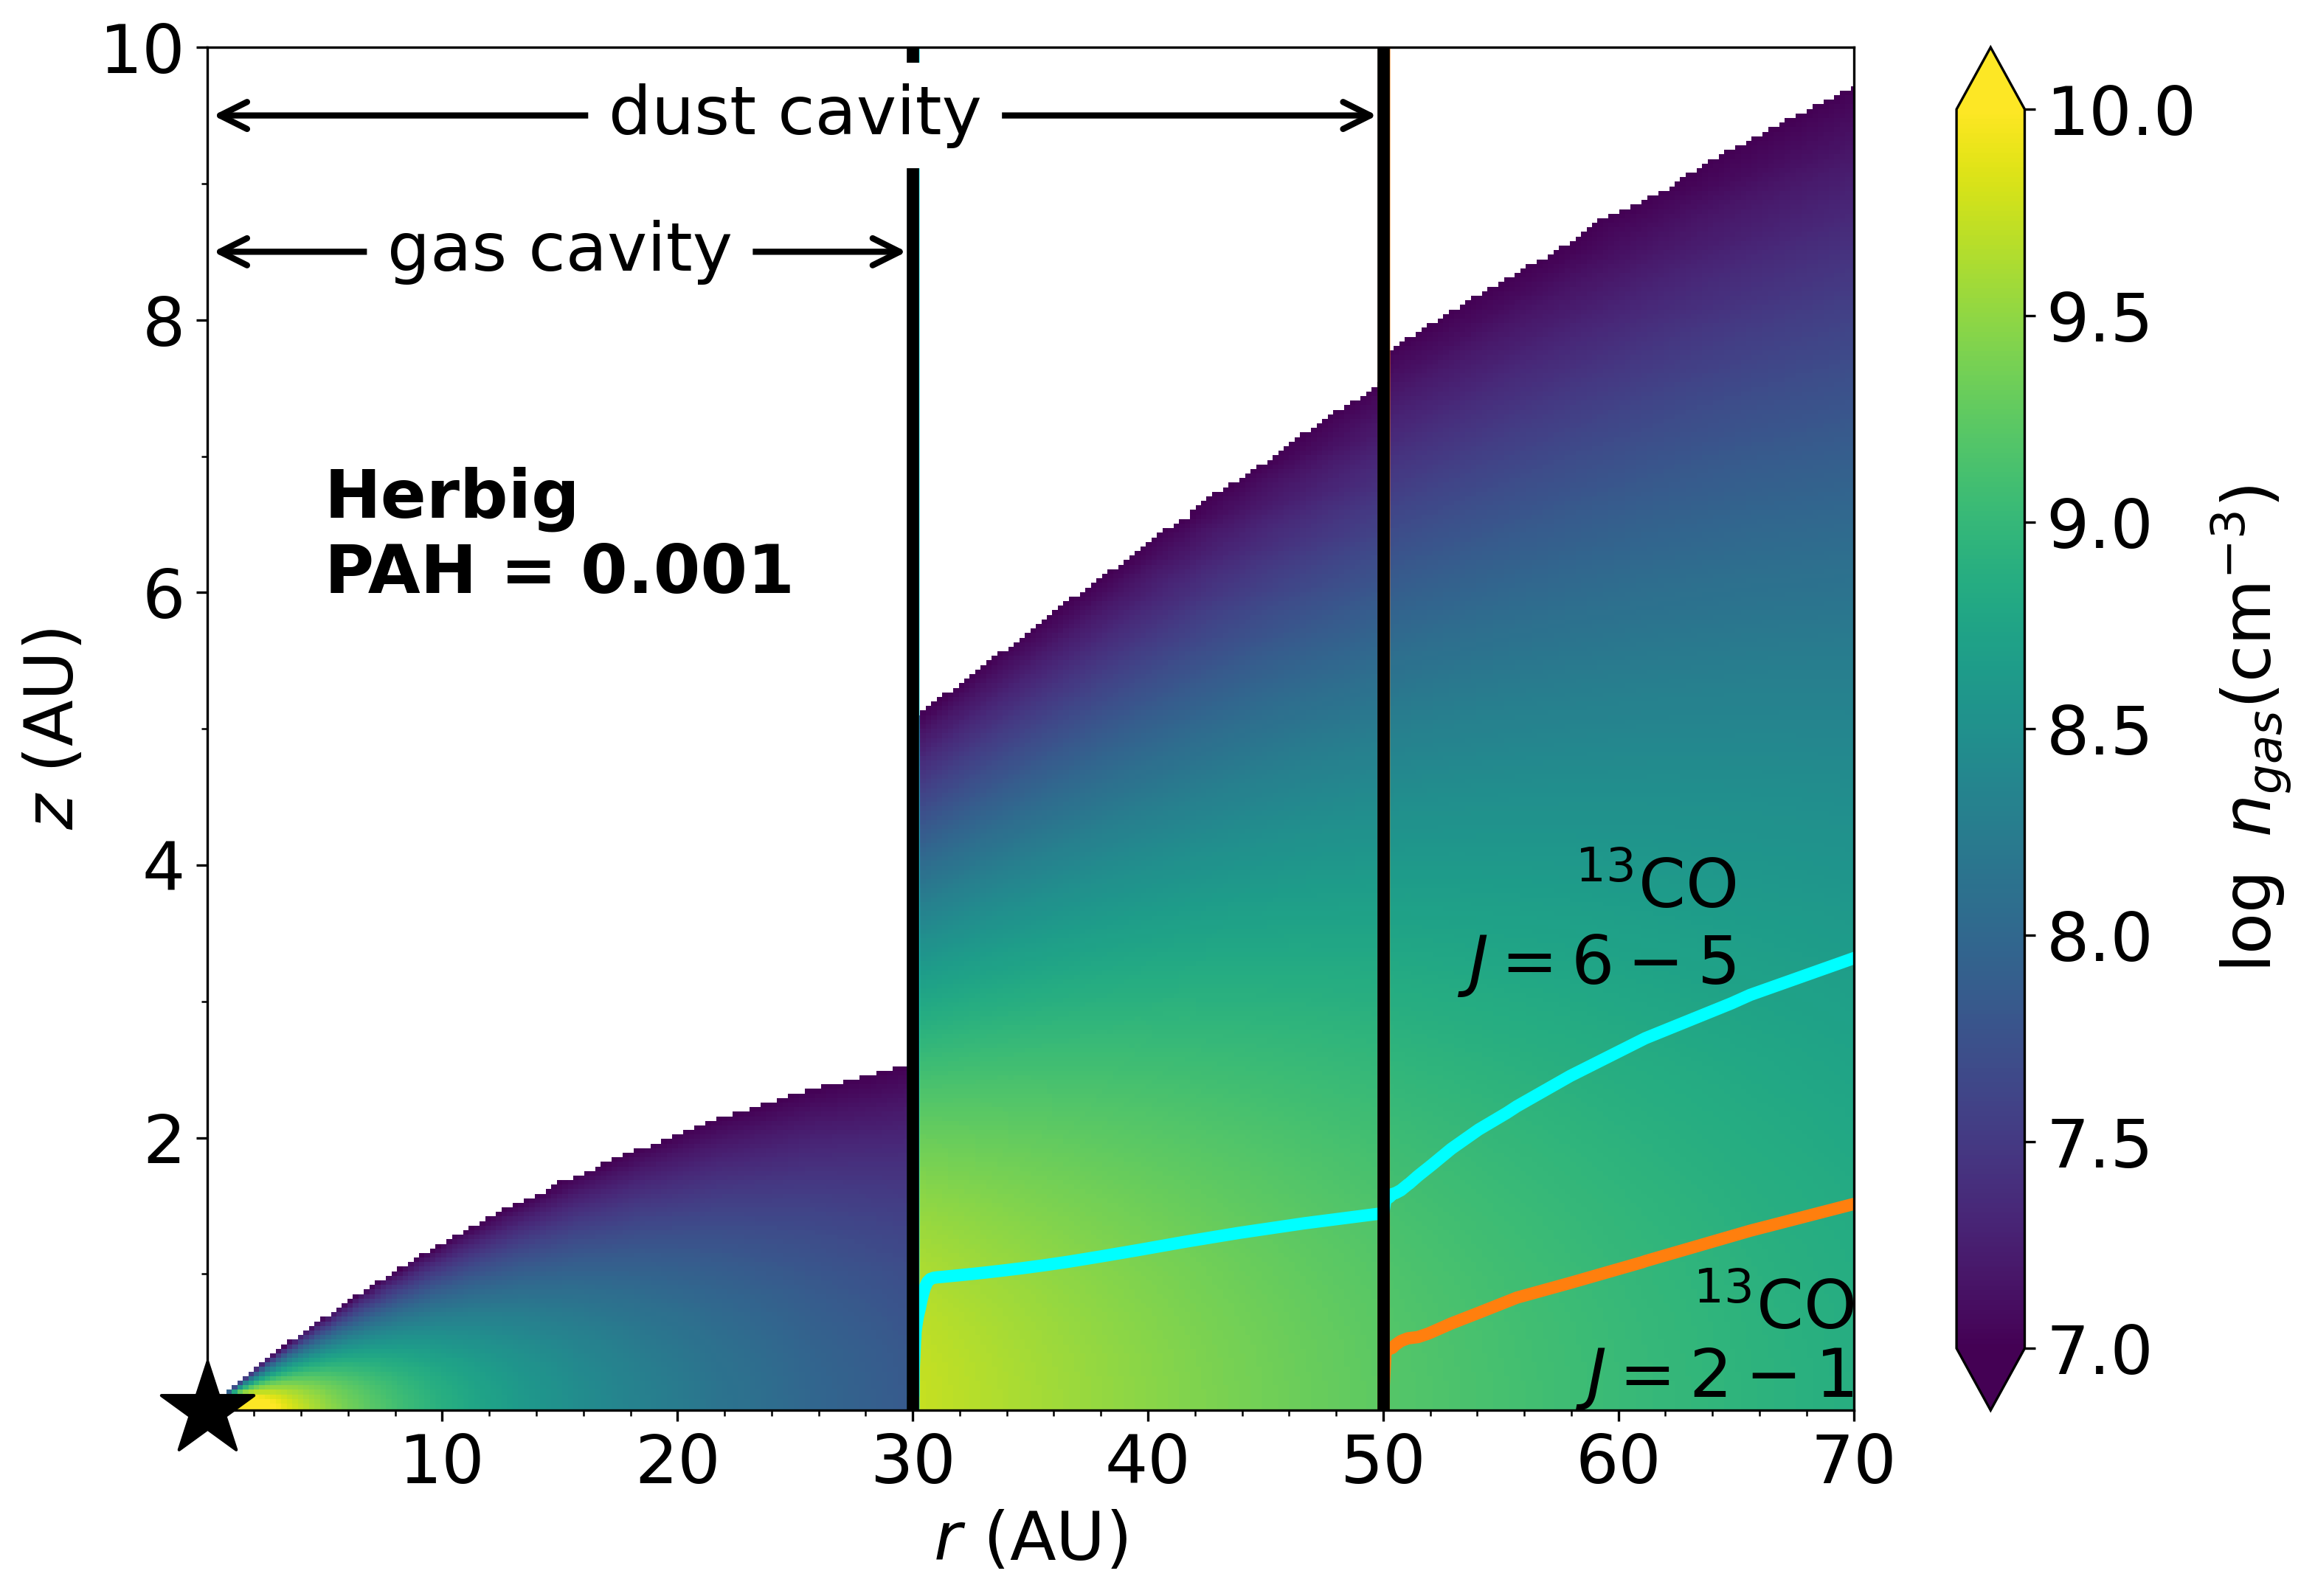
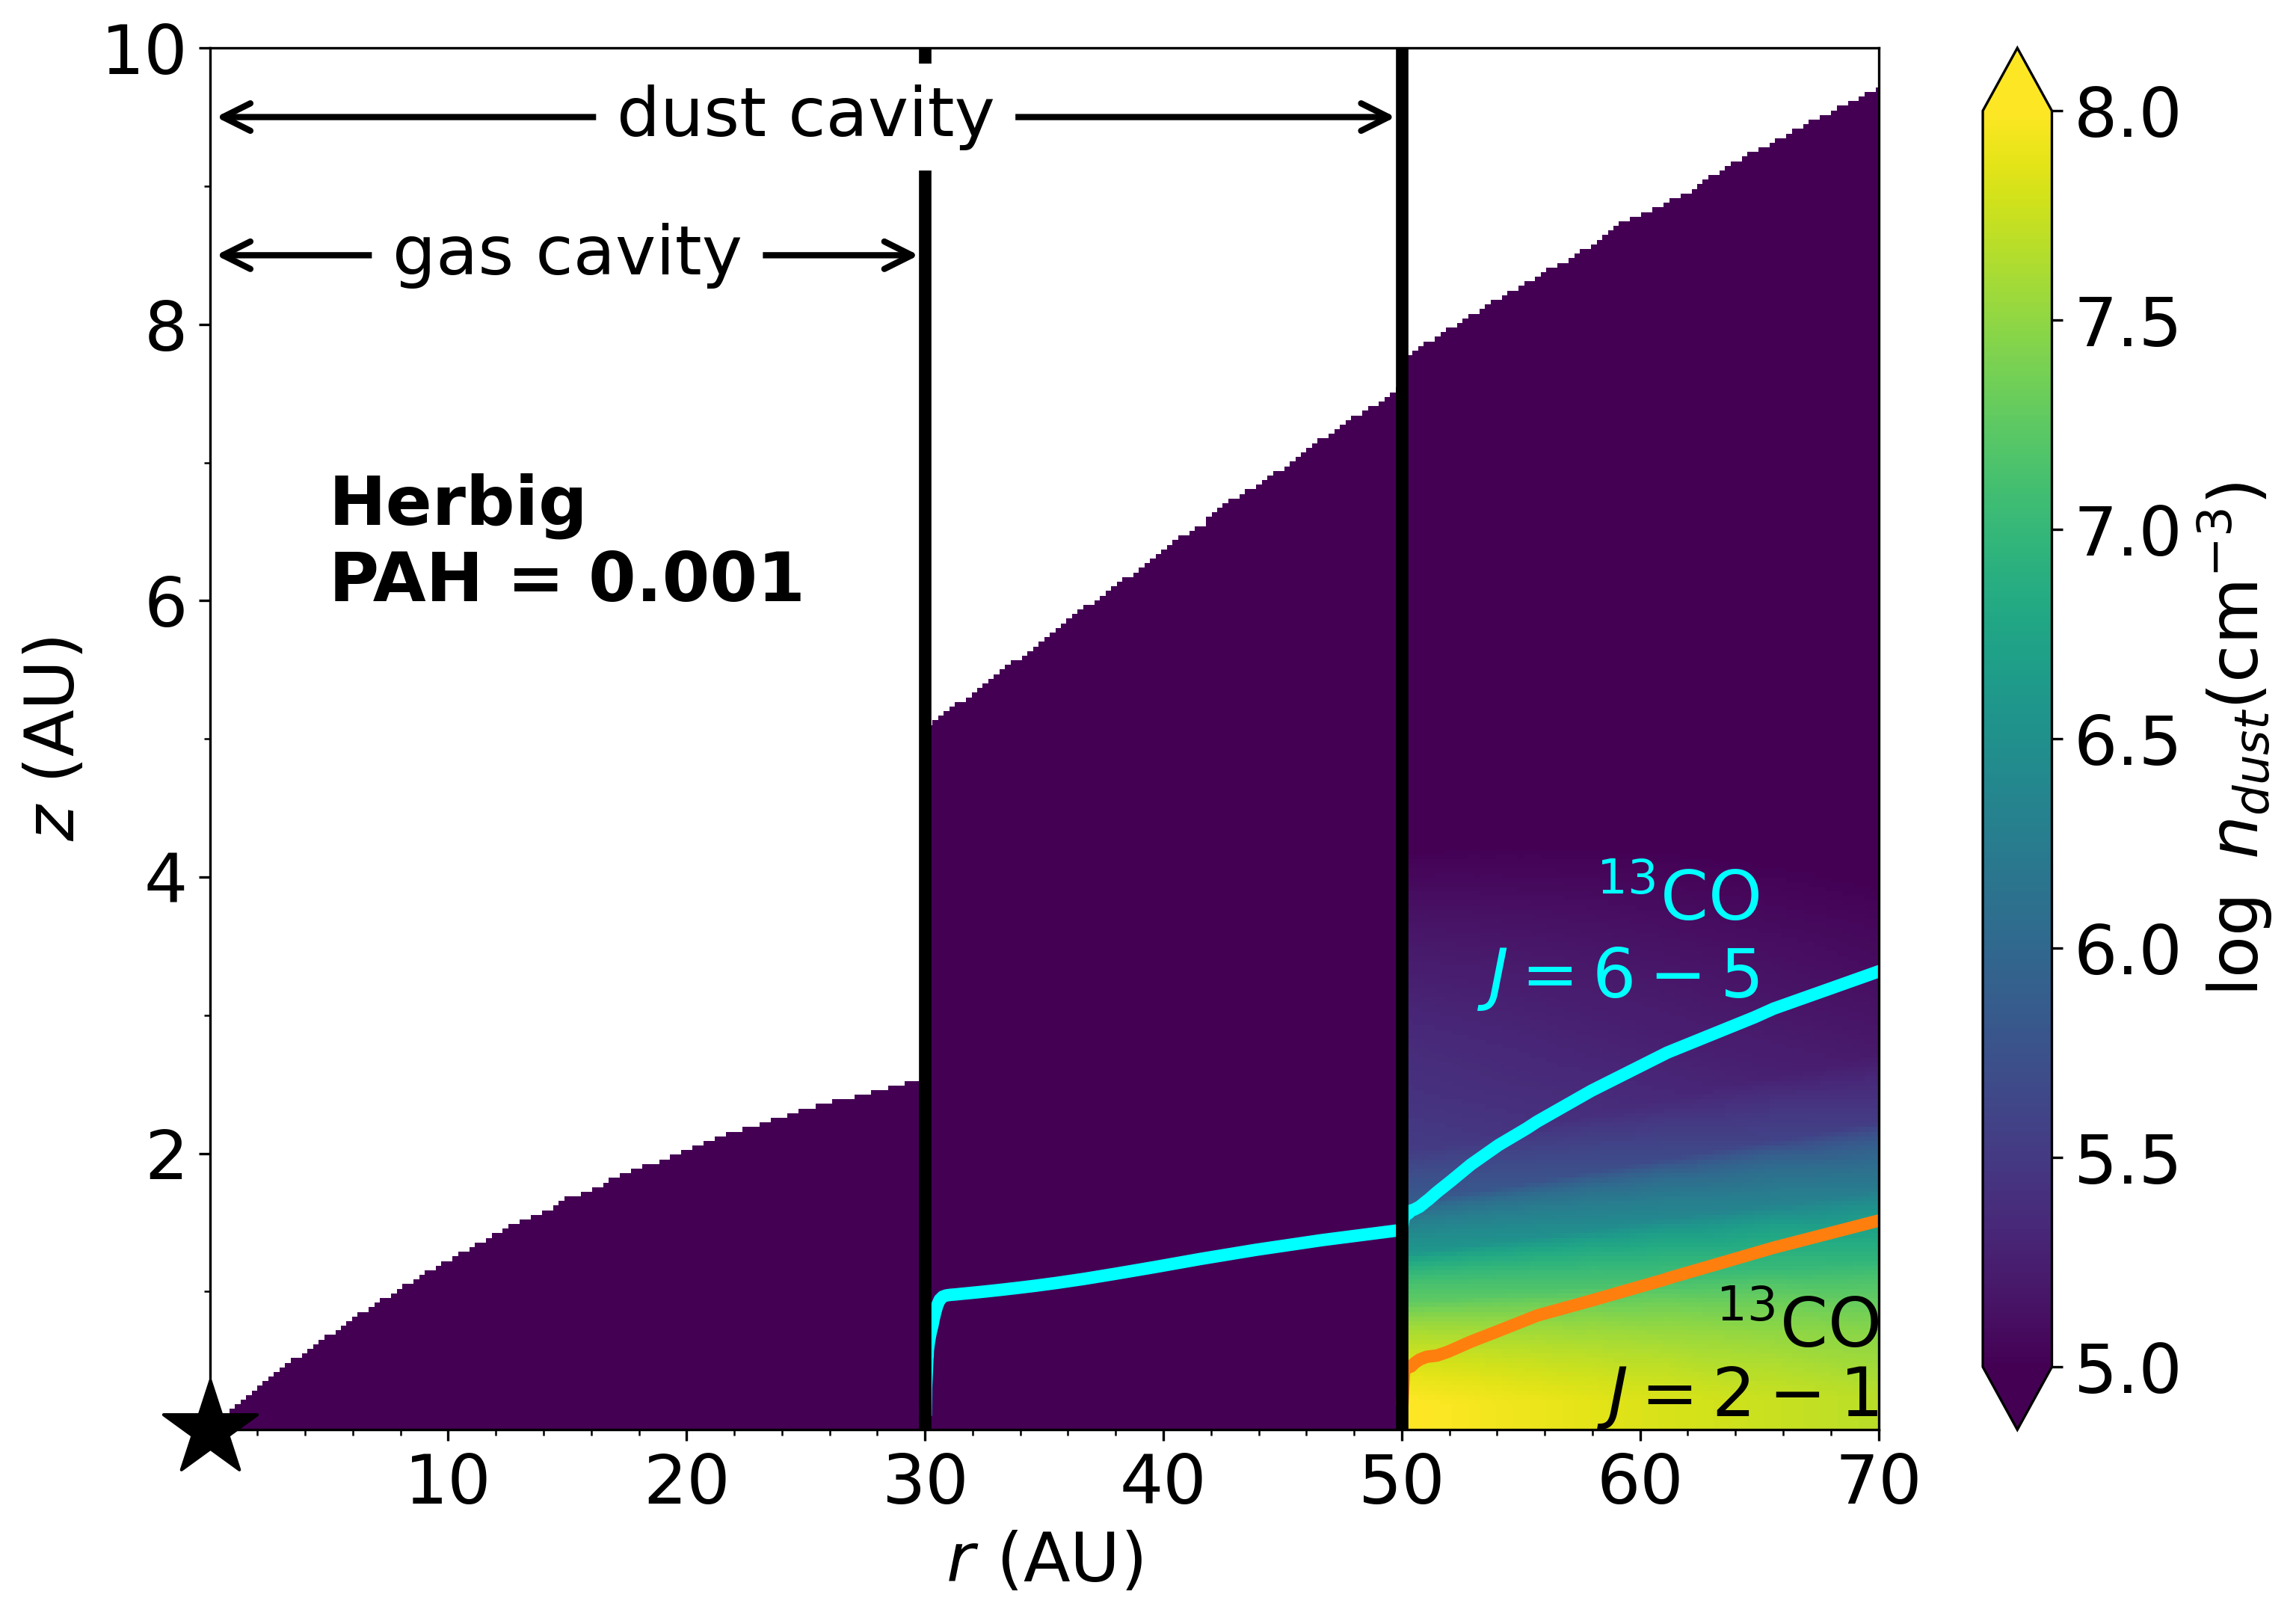
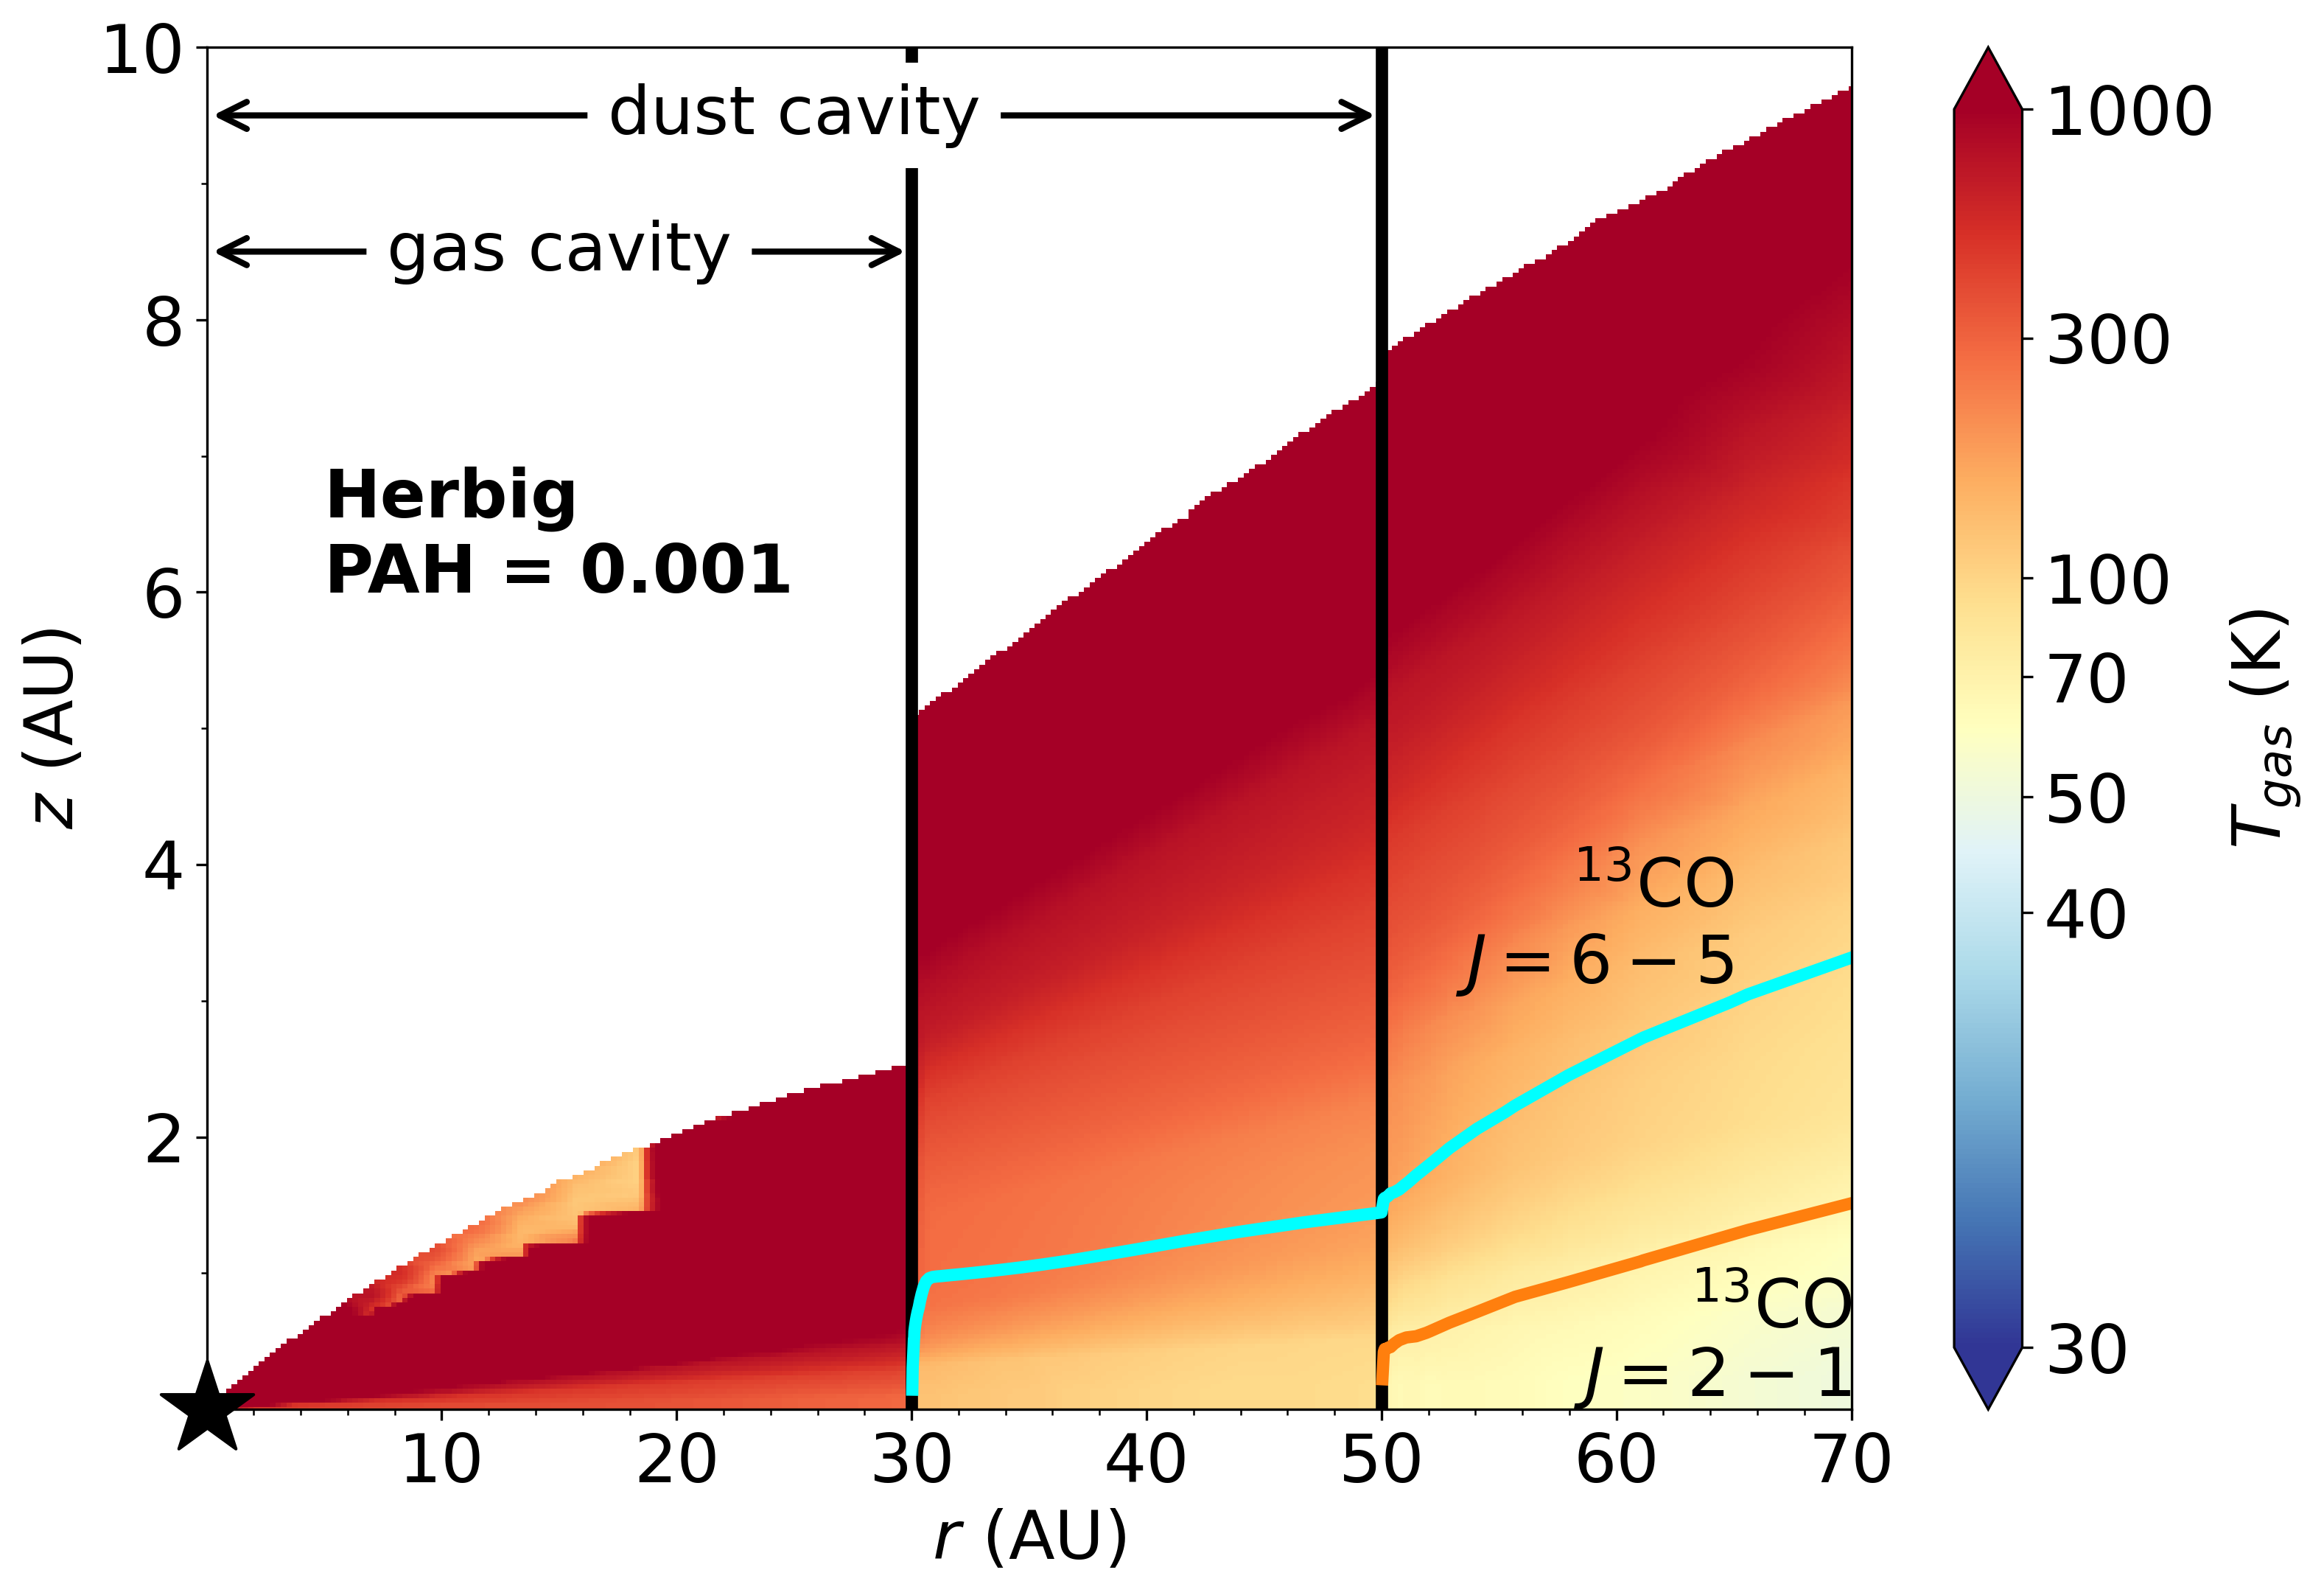
.
The exploratory models for the 13CO to line ratio discussed in Section 5 and Appendix C.2, are computed using the thermo-chemical code DALI (Bruderer et al. 2009, 2012; Bruderer 2013). The disk gas and dust structure together with the stellar spectrum are used to calculate the thermal and chemical structure across the disk and predict the flux that can be observed by e.g. ALMA.
The radial structure of the gas and dust in DALI is based on the self-similar solution to a viscously evolving disk (Lynden-Bell & Pringle 1974; Hartmann et al. 1998):
| (17) |
with the gas surface density at radius , , the gas surface density at the characteristic radius , and is the power-law index, similar to the approach of Andrews et al. (2011). An overview of the gas and dust surface density structure is presented in Fig. 21 and an overview of all model parameters is presented in Table 3. The inner radius of the protoplanetary disk is set to the sublimation radius that can be approximated as:
| (18) |
with the luminosity of the star (Dullemond et al. 2001).
The vertical structure of the gas in the disk is assumed to follow a Gaussian distribution, where the scale height of the gas at each radius is given determined by the flaring, , of the disk:
| (19) |
with the scale height angle and the scale height angle at . This scale height angle can be converted to a physical height above the disk midplane, , by .
The dust is modelled using two populations of dust grains following Andrews et al. (2011): small grains (5 nm1 m) and large grains (5 nm1 mm). Both dust populations follow the MRN distribution ( with the grain-size; Mathis et al. 1977) and the mass fraction of large grains is controlled by . The small dust grains are assumed to be well-coupled to the gas and hence follow the same radial and vertical distribution. The larger grains are assumed to be settled to the midplane as recent observations have shown (e.g. Villenave et al. 2020), therefore the scale height of the large grains is reduced by a factor of . Finally, the total dust mass is scaled such that the global gas-to-dust mass ratio in the outer disk, , matches the ISM value of 100.
The transition disk structure is parametrized as presented in Fig. 21. The gas cavity is modelled by reducing the gas column density inside by a factor of . The cavity in the dust is modelled in a similar way by a drop in column density controlled by between to . The dusty inner disk between and is modelled with a factor of w.r.t. the outer disk. The gas cavity is typically smaller than the dust cavity (Bruderer et al. 2014; Perez et al. 2015; van der Marel et al. 2015, 2016), therefore we use .
PAHs are assumed to be well mixed with the gas. The abundance of PAHs is modelled as a step-function where PAHs can only exist in the disk regions where the integrated far-UV flux is at most , with the interstellar radiation field. In this region where PAHs are abundant, they provide an additional source of opacity. Thus PAHs act both as a heating agent as well as a source for attenuation of UV radiation. A more detailed discussion on the treatment of PAHs w.r.t. the gas can be found in Bruderer et al. (2012); Visser et al. (2007).
The stellar spectrum is modelled as a 4000 K (10000 K) black body for a T Tauri (Herbig) star. In the case of the T Tauri star, the UV-luminosity from accretion onto the star is modelled as an additional 10000 K black body and a mass accretion rate of , corresponding to an UV-luminosity of 0.15 L⊙. This is a typical mass accretion rate for a T Tauri type star (Francis & van der Marel 2020 and references therein).
The temperature structure in DALI is calculated in an iterative manner, starting with the dust temperature. The dust temperature is calculated using Monte Carlo continuum radiative transfer. Initially, the abundances of the species in the chemical network are calculated assuming that the gas temperature is equal to the dust temperature. The chemical network used to calculate these abundances is based on the UMIST 06 network (Woodall et al. 2007) and has previously been presented in Bruderer (2013). No isotope-selective chemistry is included and the network is evaluated assuming steady state. Instead, the isotopologue abundances are scaled to their main isotopologue using their elemental ratios given in Table 3. Finally, the heating and cooling rates, depending on the grain sizes following Facchini et al. (2017, 2018), are used to calculate the gas temperature independent of the dust temperature. The calculations of the abundances and gas temperatures are repeated until they are consistent.
Finally, the 13CO and transitions are ray-traced using non-LTE excitation adopting the collisional rate coefficients from the LAMDA database (Botschwina et al. 1993; Flower 1999; Schöier et al. 2005). Our fiducial disk is located at 150 pc and has a face-on orientation.
| Model parameter | T Tauri | Herbig | Description |
| Physical structure | |||
| 0.07 AU | 0.2 AU | Sublimation radius, calculated as AU.(1) | |
| 1 AU | Inner radius of the dust cavity. | ||
| 30 AU | Outer radius of the gas cavity. | ||
| 50 AU | Outer radius of the dust cavity. | ||
| 100 AU | Characteristic radius of the surface density profile. | ||
| 600 AU | Outer radius of the disk. | ||
| 0.28 g | Sets the gas surface density at the characteristic radius . | ||
| 1.5(-3) | Mass of the disk. | ||
| 1 | Power law index of the surface density profile. | ||
| 0.05 | Scale height angle at the characteristic radius . | ||
| 0.05 | Flaring index of the disk surface density. | ||
| PAH abundance | 1(-3), 1(-1) | Abundance of PAHs w.r.t. to ISM value, in gas. | |
| 1(-3), 1(-2), 1(-1), 1 | Relative drop in gas density inside the gas cavity (). | ||
| 1 | Relative drop in gas density inside the dust cavity, but outside the gas cavity (). | ||
| 1(-10), 1(-4) | Relative drop in dust density in the dusty inner disk w.r.t. the outer disk (). | ||
| 1(-10) | Relative drop in dust density inside the dust cavity (). | ||
| Dust properties | |||
| 0.2 | Settling of large grains. | ||
| 1(-10), 0.85, 0.98 | Mass-fraction of grains that is large. | ||
| 100 | Global gas-to-dust mass ratio. | ||
| Stellar properties | |||
| 0.9 | 2.5 | Mass of the central star. | |
| 1(-8) | 0 | Mass accretion rate of the central star. | |
| Stellar spectrum | |||
| 1 | 10 | Luminosity of the central star. | |
| 1(30) erg s-1 | X-ray luminosity of the central star. | ||
| 4000 K | 10000 K | Effective temperature of the central star. | |
| 7(7) K | Effective temperature of the X-ray radiation. | ||
| 5(-17) | Cosmic ray ionization rate. | ||
| Observational geometry | |||
| 0 | Disk inclination ( is face-on). | ||
| 150 pc | Distance to the star. | ||
| Chemistry | |||
| H | 1 | Abundance w.r.t. the total number of hydrogen atoms. | |
| He | 7.6(-2) | Abundance w.r.t. the total number of hydrogen atoms. | |
| C | 1.4(-4) | Abundance w.r.t. the total number of hydrogen atoms. | |
| N | 2.1(-5) | Abundance w.r.t. the total number of hydrogen atoms. | |
| O | 2.9(-4) | Abundance w.r.t. the total number of hydrogen atoms. | |
| Mg | 4.2(-7) | Abundance w.r.t. the total number of hydrogen atoms. | |
| Si | 7.9(-6) | Abundance w.r.t. the total number of hydrogen atoms. | |
| S | 1.9(-6) | Abundance w.r.t. the total number of hydrogen atoms. | |
| Fe | 4.3(-7) | Abundance w.r.t. the total number of hydrogen atoms. | |
| 12C/13C | 70 | Carbon isotope ratio. | |
| 16O/18O | 560 | Oxygen isotope ratio. | |
- •
C.2 DALI models for other parameters
The effect of the gas cavity depth is discussed in Section 5. In this section the effect of other parameters such as the abundance of PAHs, the presence of a dusty inner disk and the mass fraction of large grains is investigated.
The results for the Herbig disk model with a deep () gas cavity and a dusty inner disk444Other parameters as listed in Table 3. are presented in Fig. 23. The dusty inner disk shields the cavity from UV-radiation, therefore the gas between 30 and 50 AU is warmer in the model without dusty inner disk, which is also reflected in the line ratio. This effect is even more pronounced in the region inside 30 AU, where the gas density is low.
The importance of PAHs is highlighted in the right two panels of Fig. 13 and in the middle panel of Fig. 23. Increasing the PAH abundance increases the gas temperature in a thin layer at , but it decreases the gas temperature in the midplane and in intermediate layers due to attenuation of UV radiation. Furthermore, the two 13CO transitions emit from higher disk layers due to this temperature change colorred and because CO is abundant to higher disk layers. Together these two effects result in a lower line ratio of in the gas cavity, whereas the model with a lower PAH abundance of w.r.t. the ISM predicts a high line ratio inside 30 AU. This is again due to the underlying temperature structure. The high abundance of PAHs in the former model, effectively shields the midplane where the optically thin 13CO lines are emitting from. The lack of UV radiation is responsible for the low temperatures.
Finally, the effect of grain growth is investigated by varying the fraction of large grains, , from 98% in the fiducial model to 85% and 0% in the models mimicking disks with smaller grains. The disk models with many small grains are colder because of the efficient shielding of UV radiation by these grains and PAHs that are abundant to larger scale heights. Therefore, heating through the photoelectric effect on PAH and FUV pumped H2 is less efficient in these regions, causing the line ratio to decrease when more grains are small.