UV Absorption by Silicate Cloud Precursors in Ultra-hot Jupiter WASP-178b
Aerosols have been found to be nearly ubiquitous in substellar atmospheres1, 2, 3. The precise temperature at which these aerosols begin to form in exoplanets has yet to be observationally constrained. Theoretical models and observations of muted spectral features suggest that silicate clouds play an important role in exoplanets between at least 950 and 2,100 K 4. However, some giant planets are thought to be hot enough to avoid condensation altogether5, 6. Here, we present the near-UV transmission spectrum of an ultra-hot Jupiter, WASP-178b (2,450 K), that exhibits significant NUV absorption. This short-wavelength absorption is among the largest spectral features ever observed in an exoplanet in terms of atmospheric scale heights. Bayesian retrievals indicate the presence of gaseous refractory species containing silicon and magnesium, which are the precursors to condensate clouds at lower temperatures. SiO in particular has not been detected in exoplanets before, but the presence of SiO in WASP-178b is consistent with theoretical expectation as the dominant Si-bearing species at high temperatures. These observations allow us to re-interpret previous observations of HAT-P-41b and WASP-121b that did not consider SiO to suggest that silicate cloud formation begins on exoplanets with equilibrium temperatures between 1,950 and 2,450 K.
We observed one transit of the ultra-hot Jupiter WASP-178b/KELT-26b7, 8 (WASP-178b hereafter) with HST/WFC3/UVIS using the G280 grism (0.2-0.8 m, R70) on September 5th, 2020 as part of Program 16086 (PI: Lothringer). WASP-178b is unique among known exoplanets for its especially hot host star: at A1 IV-V and T=9360 K, WASP-178 is second-only to KELT-9 as the hottest planet-hosting star. Time-series spectra were obtained over 7.5 hours centered around the transit event, and were used to extract the transmission spectra which probes the middle and upper atmosphere around the day-night terminator. Further details regarding the data reduction and observational setup are given in the Methods.
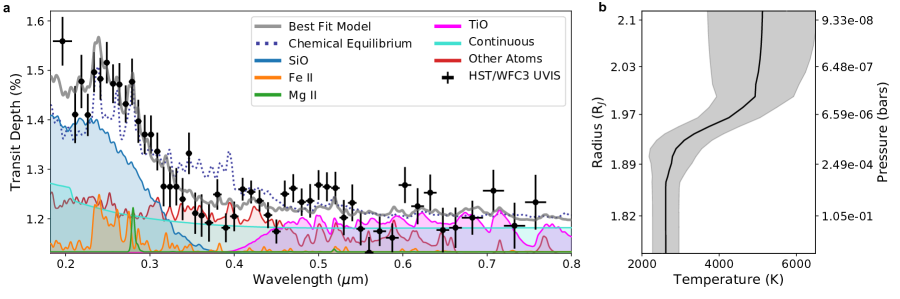
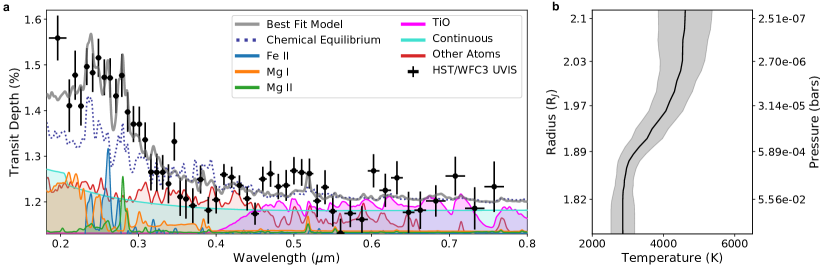
The resulting spectrum is shown in Fig. 1. A steep rise in transit depth is seen toward short wavelengths, beginning at about 0.35 m. The difference in NUV transit depth (0.2-0.28 m) compared the optical transit depth (0.35-0.8 m) is 2,500138 ppm, an 18.0 significance. In terms of the equilibrium atmospheric scale height (calculated at the equilibrium temperature and assuming an H2-dominated atmosphere), the NUV transit depths rise nearly 20 scale heights above the optical continuum, making this one of the largest known spectral features yet seen in an exoplanet atmosphere. A lack of transit asymmetry indicates that this absorption is present on each limb (see Extended Data Fig. 1 and Methods). We are able to rule out a scattering slope from, e.g., photochemical hazes, as well as stellar inhomogeneities as causes for this feature (see Methods). We are thus confident that the rise in the transit depths at NUV wavelengths is due to absorption by gaseous species in the atmosphere of WASP-178b.
We ran a series of retrievals to obtain constraints on the atmospheric properties from the observations (see Table 1). The retrievals included free parameters for the abundance of major NUV and optical absorbers, including SiO, TiO, VO, Fe I, Fe II, Mg I, and Mg II, plus a general [Fe/H] parameter for the abundance of all other atmospheric species. We also used a five-parameter temperature structure parameterization (described in Methods). Fig. 1 shows the retrieved best fit spectrum from our fiducial retrieval with all opacity sources present and the contribution from these various opacity sources. Also plotted are the constraints on the temperature structure. The maximum transit depths of about 1.5% correspond to a radius of about 2 . This corresponds to a pressure of about a microbar, similar to the strong lines of Na and K at high spectral resolution.
In all the retrievals we tested, two scenarios were able to fit the data: 1) an atmosphere with an approximately solar abundance of SiO or 2) an atmosphere with a super-solar abundance of Mg I and Fe II but with no SiO. SiO absorbs throughout the 0.2-0.35 m range, enabling a good fit to the data. On the other hand, bound-free opacity from Mg I absorbs shortward of 0.255 m 9, 10, while Fe II absorbs between 0.24 and 0.3 m. Thus the combined absorption from Mg I and Fe II is also able to provide an adequate fit to the observations, albeit at super-solar abundances (see Extended Data Fig. 2). Taken in tandem, our analysis indicates that there is strong evidence () that SiO or Mg must be present in the atmosphere of WASP-178b to explain our observations. Since both Mg and SiO are the major constituents of silicate condensates like enstatite (MgSiO3) and forsterite (Mg2SiO4), we can say with equally high confidence that silicates have not rained out at the terminator of WASP-178b. Owing to the lack of transit asymmetry mentioned above, this result holds for both the evening and morning terminator.
This result is in line with theoretical expectations. Previous studies have pointed out that above 2,000 K, SiO is expected to be a major absorber shortward of 0.4 m at its chemical equilibrium abundance 11, 12 and so we would expect to see it in the transit spectrum a priori (also see Extended Data Fig. 3). Similarly, we expect many neutral and ionized atomic species to be present, as indicated by chemical equilibrium calculations and high-resolution observations e.g., 13. While SiO and Mg I + Fe II independently provide good fits to the data, our prior expectation based on chemical equilibrium is that each of these opacity sources are likely present.
The non-detection of neutral and ionized Fe is somewhat surprising since the species has been detected in planets of similar temperature, like KELT-20b/MASCARA-2b14, WASP-76b15, 16, WASP-121b 17, 18, 13, 19. The apparent absence of significant Fe I absorption in WASP-178b’s spectrum could be explained by the high temperatures and high UV flux from the A-type host star ionizing most of the Fe I. Ground-based high-resolution studies of WASP-178b could provide a comprehensive census of neutral and ionized refractory species, as has been done for other ultra-hot Jupiters 20, 13, 21.
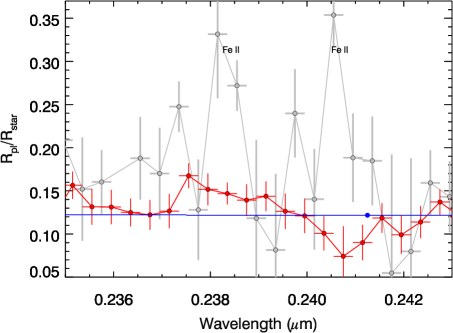
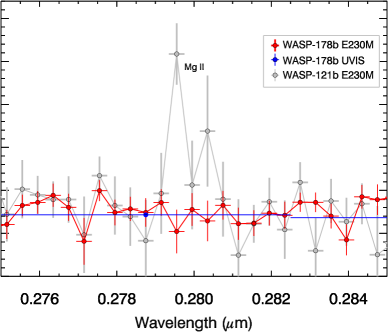
To spectrally resolve potentially escaping neutral and ionized Fe and Mg features, we additionally analyzed high resolution NUV transit data of WASP-178b HST data taken with STIS/E230M (see Methods). The STIS data shows no evidence for either Fe II or Mg II (see Extended Data Fig. 7), even though both elements were easily detected in similar data of WASP-121b17. The STIS E230M transmission spectrum is in good agreement with the broadband UVIS spectrum, indicating unresolved escaping Fe II and Mg II lines are not the cause of the NUV absorption feature in the UVIS spectrum, with continuum level absorption by SiO, Mg I, and Fe II the most likely scenario.
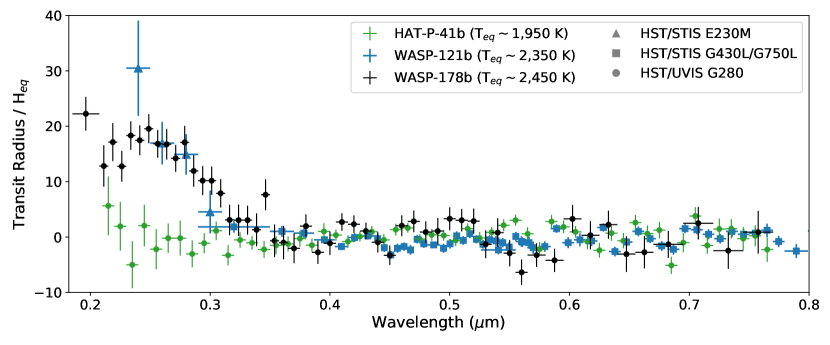
Only a handful of observations exist that are precise enough to measure the continuum of exoplanets shortward of 0.35 m: HAT-P-41b (Teq = 1950 K) has been observed with a similar setup to our observations of WASP-178b (i.e., HST/WFC3/UVIS/G280)22, while WASP-121b (Teq = 2350 K) has been observed at high-resolution with HST/STIS/E230M with 4 binned points between 0.23 and 0.31 m17. A clear difference between the spectrum of HAT-P-41b and those of the hotter WASP-121b and WASP-178b is apparent (see Fig. 2). While WASP-121b’s transit spectrum indicates a similar level of absorption at NUV wavelengths to WASP-178b, HAT-P-41b’s spectrum shows a definite absence of absorption on both limbs at these same wavelengths. This dichotomy suggests that while gaseous refractory species like SiO, Mg, and Fe are abundant in the atmospheres of WASP-121b and WASP-178b, such species have rained out of the gaseous phase in HAT-P-41b. Because some of the NUV absorption in WASP-121b is from escaping exospheric metals 17 and the difference between the morning and evening terminator has not been well-constrained like WASP-178b, we choose to define the equilibrium temperature of WASP-178b as the empirical upper limit for the onset of silicate condensation in hot Jupiters. Therefore, silicate condensation at the terminators must begin between equilibrium temperatures of 1,950 K and 2,450 K.
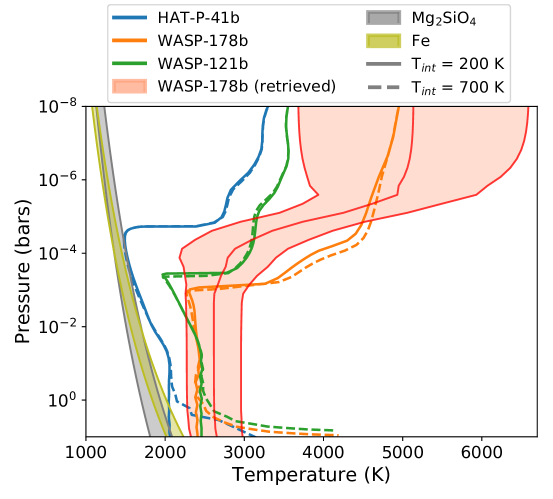
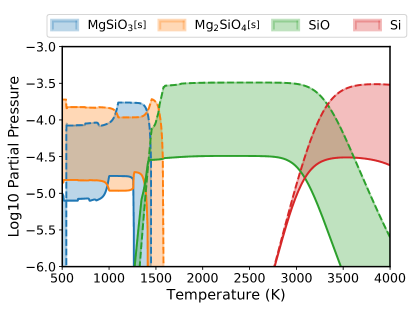
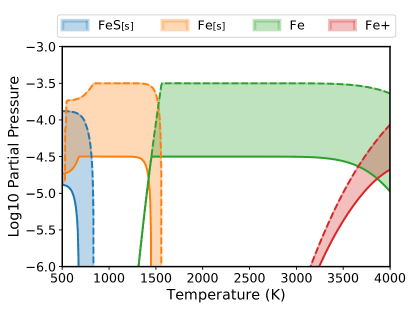
This empirical constraint on the onset of condensation is consistent with theoretical predictions 23, 4. Fig. 3 compares pressure-temperature profiles from theoretical 1D atmosphere models of HAT-P-41b, WASP-121b, and WASP-178b to condensation curves of silicate and iron species. In equilibrium, silicates and iron will condense between about 1500 and 2000 K between 1 mbar and 10 bar for atmospheric metallicities between 1x and 10x solar. Throughout the atmosphere, HAT-P-41b is much closer to the silicate condensation curve than WASP-121b and WASP-178b and will almost certainly cross it on the nightside. If WASP-121b and WASP-178b do reach temperatures cool enough to condense silicates on the nightside, it also appears they are both able to avoid rainout on either limb through rapid evaporation, vertical lofting, insufficiently rapid nucleation and condensation, or some combination of these and other hydrodynamic and microphysical processes 24, 25, 26. At depth, where the temperatures in WASP-121b and WASP-178b are the closest to the condensation curves, the higher internal temperature in hot and ultra-hot Jupiters may also help such planets to avoid condensation 27.
As noted above, few NUV transit spectra exist for hot Jupiters. Future low- and high-resolution observations, combined with multi-dimensional theoretical modeling 24, 25, 26 and lab studies of aerosols 28, 29 in hot and ultra-hot Jupiter, could provide more detailed constraints on the beginning of cloud formation in these atmospheres, while taking into account the myriad processes that promote or inhibit cloud formation, such as night-side cold-trapping, rainout, and vertical mixing and other potentially confounding variables like surface gravity and host star type. We estimate about two dozen planets Jovian exoplanets can be characterized with HST/WFC3-UVIS/G280 with four or less transits 30, 31. If combined with STIS/E230M observations to disentangle the effects of atmospheric escape like we have done here, these planets can reveal the conditions for and sequence of condensation in exoplanet atmospheres. Observing, modeling, and retrieval of brown dwarfs at similar effective temperatures will also shed light on these questions 32, 3.
| Scenario | Max. ln() | (K) | BIC | |
|---|---|---|---|---|
| Full | 14 | 353.41 | 1.44 | – |
| No Mg II | 13 | 352.13 | 1.47 | -1.447 |
| No Fe II | 13 | 351.13 | 1.51 | 0.56 |
| No SiO | 13 | 351.10 | 1.52 | 0.61 |
| No SiO or Mg I | 12 | 345.21 | 1.75 | 8.39 |
| No SiO or Fe II | 12 | 343.92 | 1.81 | 10.965 |
| Full w/ Haze | 16 | 352.15 | 1.58 | -10.53 |
Methods
HST/WFC3 observations
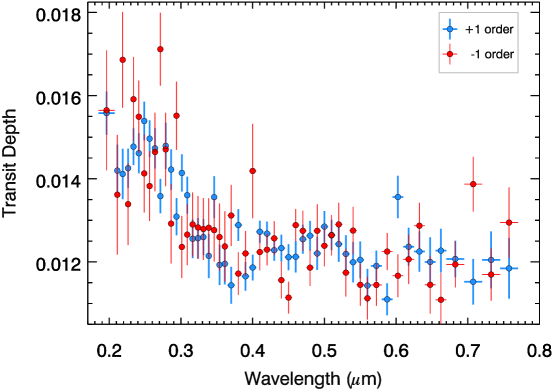
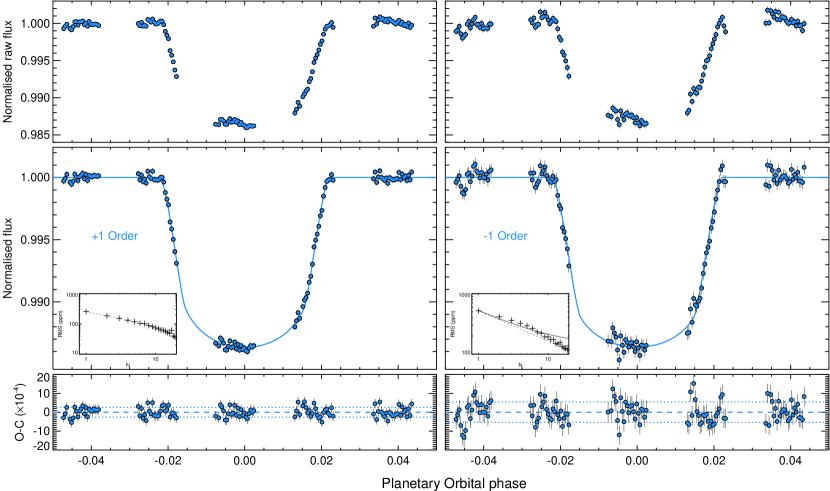
One transit was observed of WASP-178b with the HST/WFC3/UVIS instrument using the G280 grism (0.2-0.8 m). The transit is covered over five HST spacecraft orbits, with the transit approximately centered in the third orbit. Exposure times of 40 seconds were used, along with a 5902250 pixel detector sub-array which reduced the readout overheads providing 123 total exposures, with 23 to 25 exposures per HST orbit. The spectrograph is slitless, and we centered the subarray such that both the +1 order and -1 order spectra were recorded and could both be fully analysed. Utilizing both orders provides two independent transmission spectra of the same transit event, though the +1 order provides higher signal-to-noise (SNR) given a higher throughput (see Extended Data Fig. 4). Also see ref. 22 for more information on the instrument mode and analysis.
Data Reduction
The raw data was processed with the STScI CALWF3 pipeline (v 3.5.1) which applies reduction steps including bias subtraction, dark correction, and flat fielding. The target flux was subsequently extracted starting from the pipeline FLT files. From each image we used the mode to measure and subtract the background flux. We then removed cosmic rays following a two step process. First, we identified and removed cosmic rays utilizing the time series counts of each pixel. Outlier cosmic rays were flagged and replaced with a 5- clipping algorithm. We then removed cosmic rays spatially, using a Laplacian edge detection algorithm on each image separately 35. We then extracted the 1D spectral flux for each image on both the -1 and +1 orders separately using IRAF APALL with an 8th order Legendre polynomial fit to the spectral trace. A large range of aperture sizes were extracted, between 10 and 28 pixels, with a 14 pixel aperture found to be optimal in the subsequent light curve fitting stage. The wavelength solution was determined from the spectral trace detector position following ref. 36.
UVIS Light Curve Analysis The general light curve fitting followed the procedures detailed in Sing et al. (2019) 17 and previously used on WFC3/G280 observations in Wakeford et al. (2020)22, which we refer the reader to for subsequent details. The flux measurements over time, , were modeled as a combination of a theoretical transit model37, (which depends upon the transit parameters ), the total baseline flux of the star, , and a instrument systematics model giving,
| (1) |
As in ref. 17, we explored a wide range of models for , exploring detrending variables including a fourth order polynomial in HST orbital phase and linear terms in spectral position as measured from the spectral extraction, wavelength shift measured from cross-correlation of each spectra, and the spacecraft Jitter Detrending vectors which are products of HST’s Engineering Data Processing System. For each both the +1 and -1 orders, we used the Akaike information criterion (AICc) with a correction for small sample sizes to determine the optimal detrending variable parameters to include from the full set without overfitting the data and while minimizing the rednoise. The light curve error bars were derived from the residual scatter of the best fit. In addition, residual systematic noise, , was measured along with the white noise, , using the binning technique38, with the final fit parameter errors inflated by a factor if rednoise was present39 (see Extended Data Table 1). Overall, the effect of rednoise was minimal as the noise was comparable to the binned photon noise at typically several hundred ppm, and the errors in only 5 of 124 light curves required an increased scaling by more than 10%.
To model the effects of limb-darkening and center-to-limb differences in the star during transit, we calculated a custom PHOENIX stellar model using the parameters of WASP-178A. For each wavelength bin of interest, we then used the stellar intensity profile to fit for limb-darkening coefficients using the non-linear 4-parameter limb-darkening as described in ref. 40 which were subsequently used in the light curve transit fit. As a test of the stellar models, we additionally fit for the limb-darkening assuming a linear law between the wavelengths of 0.255 and 0.285m. At these NUV wavelengths, the stellar limb-darkening is strong, but also predicted by models to be nearly linear in intensity across the limb, allowing for a direct comparison largely free of complex degeneracies between transit-fit coefficients. We found the transit data fit with a linear coefficient of , which matches very well to the PHOENIX model prediction of . The limb-darkening was subsequently fixed to the PHOENIX model values for all the transit light-curve fits.
We first fit the white light curve, which integrates the entire spectra (see Extended Data Fig. 5). The planet’s orbital system parameters including inclination, , semi-major axis in units of stellar radii, , and time of transit were fit along with the planet-to-star radius ratio, , , and systematics model using the +1 order. Given the good phase coverage, these system parameters were generally more accurate over previous literature values finding degrees, , and days. We kept the period fixed to the literature value of 3.34482850.0000012 days7.
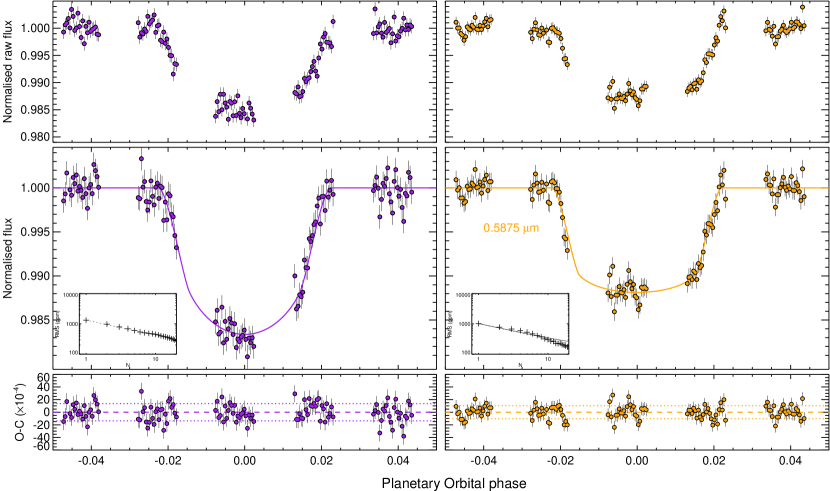
To derive the planetary transmission spectrum, we fixed the system parameters to the white-light curve best-fit values and used the optimal systematics model as determined by the white-light curve fit. While the white-light curve did not require a term to model wavelength shifts in the time-series spectra, this term was found to be needed in the spectral light curve fits with 10 fit parameters overall for each light curve. The residual fit scatter in the time-series spectral bins achieved a level that was on average 1.2 theoretical photon-noise limit scatter and typically ranged between 1.1 and 1.4 (see Extended Data Fig. 6). A variety of spectral bin locations and resolutions were measured, with the adopted spectra chosen to balance the resolution and SNR. In each case, the overall shape of the transmission spectrum was consistent between different resolutions. We measured the transmission spectrum of both the +1 and -1 orders, finding good agreement between both orders (see Extended Data Fig. 4). We calculated the weighted-mean value of the spectra to report our final derived spectrum (see Extended Data Table 1) as seen in Fig. 1.
We also independently verified the transmission spectrum using the marginalization method described in 22. This method resulted in a spectrum that was consistent with the spectrum analyzed with Jitter Detrending, both showing large NUV absorption. This method used limb darkening coefficients from the Kurucz stellar model grid 41, again suggesting our results are robust against the details of limb darkening.
STIS E320M Light Curve Analysis To help resolve possible Fe II and Mg II features in the NUV spectrum of WASP-178b, we also analysed a transit observed on Jul 30, 2020 by HST with the STIS E230M instrument. As with the UVIS data, these observations were also taken as part of program 16086. The STIS observations were observed with the NUV-MAMA detector using the Echelle E230M STIS grating and a square 0.2 aperture. The E230M spectra has a resolving power of R=/(2)=30,000 and we set the grating to 2707Å to cover the wavelength ranges from 2280 to 3070 Å across 23 orders.
Our analysis closely follows Sing et al. (2019)17, which we refer for further method details.
We used the Jitter Detrending method to correct for time variable slit losses seen in the white light curve photometry, and fit the light curves using the system parameters given in Extended Data Table 2. We find a band integrated white light curve of 0.12440.0050 which matches well (0.6- significant difference) when compared to the same wavelength region as measured by UVIS (=0.12133 0.00054). The main difference in our methods with ref 17 was the use of a common-mode analysis when analysing the spectroscopic channels, where the best-fit transit model was removed from the white light curve raw photometry, and used to remove common instrument trends. In this case, large slit losses repeating every spacecraft orbit are seen in the photometry. The common-mode analysis removes the majority of the instrument trends seen, with the remaining modeled with a second order polynomial in HST orbital phase. The spectroscopic channels each reach a residual scatter that is consistent with the photon noise level. As done for WASP-121b, we divided the E230M spectra into 196 spectroscopic channels each with a 4Å bandpass. The resulting spectrum can be seen in Extended Data Fig. 7. Compared to WASP-121b, WASP-178b does not show strong Fe II or Mg II absorption features, with the high resolution E230M spectrum consistent with the broadband NUV spectrum of UVIS.
Atmosphere Models Self-consistent 1-D PHOENIX atmosphere models of HAT-P-41b, WASP-121b, and WASP-178b were computed to compare the expected atmospheric temperatures in each planet to refractory species condensation curves. The model setup was similar to past ultra-hot Jupiter studies with PHOENIX 42, 43, 12 that are computed on a 64-layer optical-depth grid from 1e-10 to 1e2, which corresponds to similar magnitudes in pressure. We ran models for two internal temperatures, 200 K and 700 K, which correspond to the lowest and highest internal temperatures expected for a hot Jupiter 27. We further assume full planet-wide heat redistribution to approximate temperatures at the terminator, consistent with similar investigations 4. The temperature structure from the self-consistent model of WASP-178b is quite similar to the retrieved temperature profile from PETRA (see Fig. 3), indicating the full heat redistribution assumption appears to be a good approximation of the average conditions at the terminator.
The model includes opacity from 130 molecular species and neutral and ionized atomic species up to uranium. TiO and VO are important visible-wavelength opacity sources44, 45, but observations suggest they do not always appear to be present in the atmosphere46. Consistent with retrievals of observations from these planets 47, 33, the HAT-P-41b model did not include TiO or VO, the WASP-121b model only included VO, and the WASP-178b model only included TiO but at a reduced abundance (see Extended Data Table 2 and Extended Data Fig. 8). All other abundances, including SiO and Fe, were treated in local chemical equilibrium. We further used the modelled HAT-P-41b transmission spectrum to rule out the presence of gaseous refractories on one or both limbs, further supporting the fact that these elements have rained out.
Atmosphere Retrievals We used PETRA 48 to retrieve atmospheric properties from the observations. PETRA uses a Differential-Evolution Markov Chain statistical framework 49 to sample the posterior distribution of the parameter space. Our retrieval setup was similar to previous transmission retrievals with PETRA 50, 51. We parameterized the temperature structure using the 5-parameter approach of Parmentier & Guillot (2014)52. We also included a necessary reference radius parameter. The abundances of major UV and optical opacity sources were treated as free parameters with uniform vertical abundance. These included Fe, Fe II, Mg, Mg II, TiO, VO, and SiO. We also included a free parameter for the metallicity ([Fe/H]) of the rest of the atmosphere, which was treated in chemical equilibrium. This allowed the effect of other potential absorbers expected to be of lesser importance (e.g., H-, Ca, Ni, FeH) to be taken into account while reducing the number of free parameters to explore. Continuous opacity from H- and scattering from hydrogen and helium were also included.
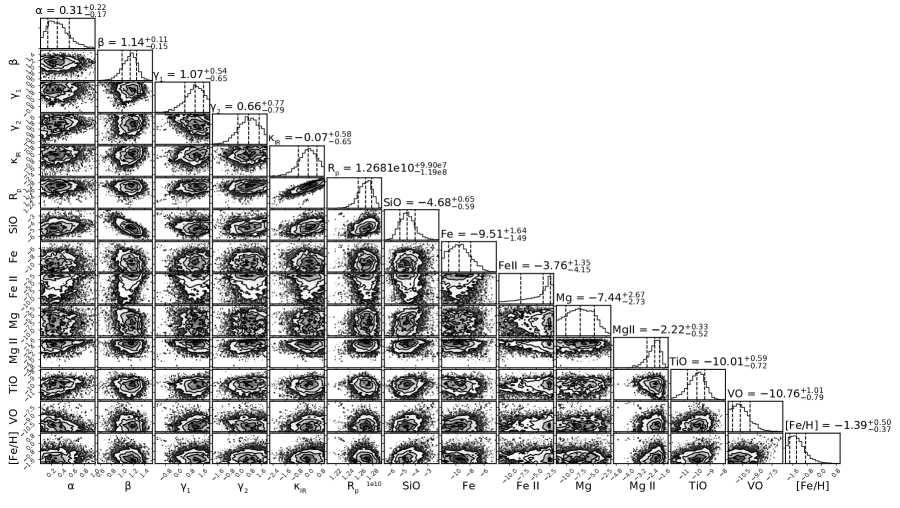
Uniform priors between volume mixing ratios of 10-12 and 10-1 were placed on each of the opacity sources. Priors were also placed on the temperature structure to avoid extremely low ( K) and extremely high ( K) temperatures. We ran a total of 120,000 iterations among 30 chains reaching a Gelman-Rubin 1.025. Extended Data Fig. 8 shows 2-D cross-sections of the retrieved posterior distribution along with the 1-D marginalized distribution for each of the retrieved parameters. A summary of the retrieved atmospheric properties is included in Extended Data Table 2.
We also ran a series of retrievals without certain opacity sources in order to compare different atmospheric species’ ability to fit the observed data. The scenarios we tested are listed in Table 1. We computed the Bayesian Information Criteria for each scenario, taking the retrieval with all opacity sources included as our fiducial scenario (“Full”) to calculate a BIC that quantifies whether there is statistical evidence to include a given parameter, in this case an opacity source, in the retrieval. Generally, a BIC between 2 and 6 indicates positive evidence for the inclusion of a given parameter, while BIC above 6 indicates strong evidence. Our retrieval analysis indicates there is strong evidence for the inclusion of SiO or Mg I, and thus the gaseous precursor species to silicate condensates. We also ran a retrieval that included a haze parameterization 53 to account for photochemical or other high-temperature aerosols, but found that they did not improve the fit.
In our fiducial scenario, the retrieval did find a highly super-solar abundance of Mg II. This result is being driven by the single data point at 0.28 microns (see Fig. 1). A retrieval without Mg II provides an similarly good fit to the data (see Table 1), demonstrating that the inclusion of Mg II is not necessary to fit the data. We therefore do not choose to interpret the retrieved Mg II abundance as unambiguously physical. This is supported by the lack of any Mg II signal in the HST/STIS/E230M observations (see Extended Data Fig. 7).
Stellar Activity Starspots or faculae cause stellar inhomogeneities which can potentially contaminate transmission spectra 54, 55. While magnetic activity (and thus starspots and facuale) are most relevant for low-mass stars, higher-mass stars may also show some degree of activity 56 and some transmission spectra of hot Jupiters around early-type host stars may be consistent with unocculted stellar inhomogeneities 57. The problem is most acute at the shortest wavelengths where the flux contrast between the nominal stellar photosphere and the active region is the greatest.
We examined whether the transit spectrum of WASP-178b could be caused by unocculted stellar activity. We found that because of the magnitude of the spectral feature, extreme spot covering fractions and temperatures would be required. To fit the magnitude of the NUV feature, a starspot 1,500 K cooler than the nominal photosphere would require a spot covering fraction of 60%. For a starspot 2,500 K cooler than the photosphere, a spot covering fraction of 50% is required. Towards longer wavelengths, where the observed spectrum is flatter, the contaminated model spectrum continue sloping to small transit depths which is not seen in the data. In the end, these factors, combined with the satisfactory fit to the stellar SED without activity and low activity levels found in the star (see below and 7), suggest that stellar activity cannot be responsible for the large feature in WASP-178b’s transit spectrum.
The 2019 TESS light curve of WASP-178 shows a consistent 0.115% variable photometric signal with a 0.185 day period8, which is also easily visible in 2021 high cadence TESS photometry. This variability was speculated to be from Scuti pulations in WASP-178 and possible gravity-darkening light curve asymmetries were reported from the TESS data as well 8. However, our HST transit light curves show no evidence of any variability at the 0.115% level, with the raw UVIS photometry showing variations less than 0.02% over a 0.3 day window. Upon further inspection of the TESS field of view and near-by faint contaminant stars, from the ASAS-SN photometry database 58, 59, we determine the origin of the photometric variations to be ASASSN-V J150908.07-424253.6 which is a nearby 14.5 magnitude W Ursae Majoris-type binary star with a reported period of 0.369526 days, which is an alias of the reported 0.185 day period. Both the period and magnitude of variations match that of the signal seen as diluted in the TESS data by the brighter WASP-178b. As such, we conclude there is no evidence for WASP-178 to have any photometric variations larger than 0.02%. In addition, we find no evidence for reported transit asymmetries due to possible gravity-darkening effects8 in the HST data either. As a transit asymmetry signal in the TESS data could have also been influenced by the binary star, we analysed the 2021 TESS photometry taken at a higher cadence. When removing the binary star contaminating variables, the TESS light curve shows no transit asymmetries in agreement with the HST data. Thus, there is no evidence that either gravity darkening nor significant photometric stellar activity are an issue with WASP-178.
Scattering An alternative mechanism for producing large short-wavelength transit depths is through scattering. Small particles tend to scattering short-wavelength light more effectively than longer-wavelength light, leading to slopes towards greater transit depths at shorter wavelengths in transmission spectra 60. If we describe the scattering cross-section as:
| (2) |
the slope in the transmission spectrum can be expressed as:
| (3) |
Rayleigh scattering, the limit that the particle is smaller than the wavelength of light, has a characteristic . Given our observed feature magnitude of approximately 20 scale heights over 0.2 m, we calculate is required to match the data. While super-Rayleigh slopes in transmission spectrum are possible due to a vertical gradient in opacity 61, a slope with would still be difficult to create, especially with non-purely scattering particles like a photochemical haze. Additionally, we do not expect aerosols to survive to the pressures or temperatures that we probe with our observations ( microbar, 4000 K).
Limb Asymmetries Limb asymmetries can potentially complicate the interpretation of a transmission spectrum. In particular, because of atmospheric advection from the hotter day side to cooler night side, the morning terminator can potentially be cooler with increased condensate ‘clouds’ while the hotter evening terminator can be cloud-free. This effect may be evident in WASP-76b15, and theoretical models have investigated the effect by coupling cloud formation to atmospheric dynamics62, 26, 24, 25. For WASP-178b, if the limb asymmetries were prevalent, we would expect the NUV transmission spectrum to be strongly affected, as features such as SiO could be in gaseous form on one limb, but condensed into aerosols on the other. The combined effect would be to potentially bias the interpretation toward the hotter-clearer limb albeit with a reduced signal.
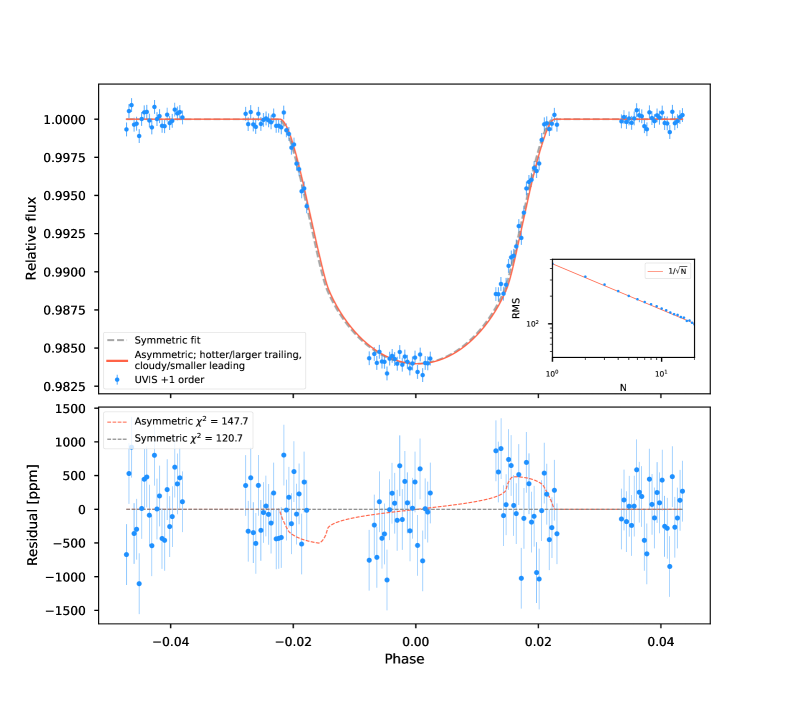
As our data covers some of both ingress and egress, where limb asymmetries have large observable effects, we searched the UVIS data between 0.18 and 0.28 m for terminator asymmetries using catwoman 63. In a scenario where Mg and SiO are condensed on the leading morning terminator and has an effective radius consistent with the optical (=0.111330.0005), the trailing evening terminator would require a radius of =0.12924 in order to match the transit radius ratio of =0.120620.00067 measured in the NUV with the +1 order. The NUV +1 order light curve and magnitude of limb asymmetries are shown in Extended Data Fig. 1. In ingress/egress, such asymmetries are detectable in the data as they are found to have a 500 ppm effect on the transit light curve, which is comparable to the 1- error bars (450 ppm). This simplified model is ruled out at the 5- level by the +1 order alone (see Extended Data Fig. 1). To place further constraints, we used catwoman to fit the +1 and -1 order NUV data (0.18 to 0.28 m) for the two hemisphere planetary radii, and , as well as terminator inclination angle . We found to be unconstrained and and were consistent at 1-, favoring a scenario without limb asymmetry. We also fixed to strictly assume an east/west limb asymmetry. In this case, we also find both hemispheres fit to nearly the same radii, =0.1195 and =0.1211, which are both larger than the optical radius at 3- confidence.
This indicates that the NUV transmission spectral features (SiO/Mg) occur on both the leading and trailing limbs. With no indications either limb being cloudy, potential silicate condensates are confined to the night-side of the planet on WASP-178b. However, WFC3 phase-curve observations of the similar planet WASP-121b 64 show the night-side temperatures do not generally drop low enough to be conducive of silicate material condensation as significant heat is transported.
We also note that the fact that both hemispheres are the same radius to within 1- could point to implications for the atmospheric circulation and heat transport at the low pressures probed in transit at NUV wavelengths. If the atmospheric circulation was dominated by super-rotation at these pressures, one would expect the morning terminator to be much colder, and thus have a smaller radius at a given optical depth, than the evening terminator. Because this does not seem to be the case, our observations might be an indication that the circulation at microbar and less pressures is dominated by a day-to-night flow, whereby the morning and evening terminators would be more similar in temperature, and thus radius. This behavior is in line with theoretical expectations 65.
Data Availability
The raw data from this study is publicly available via the Space Science Telescope Insitute’s Mikulski Archive for Space Telescopes (https://archive.stsci.edu/).
Code Availability
The raw data was reduced with the available STScI CALWF3 pipeline and spectra were extracted with the public IRAF APALL routines. The light curve fitting used custom routines that we opt not to make public due to undocumented intricacies. Model and retrievals were generated using PHOENIX, which is a proprietary code but described in many publications e.g., 66, 67.
Acknowledgements
We thank the reviewers for their helpful report which improved the paper. We thank the UV-SCOPE team for relevant discussion. We thank T. Barman for the use of a computing resources used in the calculation of the atmospheric retrievals. Support for this work was provided by NASA through grant number HST-GO-16086 from the Space Telescope Science Institute, which is operated by AURA, Inc., under NASA contract NAS 5-26555. This research has made use of the NASA Astrophysics Data System and the NASA Exoplanet Archive, which is operated by the California Institute of Technology, under contract with the National Aeronautics and Space Administration under the Exoplanet Exploration Program.
Author Contributions
J.D.L. and D.K.S. contributed equally to this work. J.D.L led the observing proposal and retrieval analysis. D.K.S. led the data analysis with contributions from Z.R., H.R.W., J.J.S., and A.T.W. All authors discussed the data analysis and interpretation and commented on the manuscript.
Competing Interests The authors declare no competing interests.
| Combined | +1 order | -1 order | |||||||
|---|---|---|---|---|---|---|---|---|---|
| (m) | (m) | (ppm) | (ppm) | (ppm) | (ppm) | (ppm) | (ppm) | ||
| 0.1963 | 0.0113 | 15587 | 490 | 1490 | 0. | 1.00 | 4344 | 0 | 1.00 |
| 0.2113 | 0.0037 | 14106 | 575 | 1809 | 287 | 1.06 | 4445 | 0 | 1.00 |
| 0.2188 | 0.0037 | 14775 | 538 | 1751 | 0. | 1.00 | 3355 | 0 | 1.00 |
| 0.2262 | 0.0037 | 14098 | 426 | 1376 | 0. | 1.00 | 2968 | 0 | 1.00 |
| 0.2338 | 0.0037 | 14962 | 405 | 1167 | 0. | 1.00 | 2937 | 0 | 1.00 |
| 0.2412 | 0.0037 | 14828 | 422 | 1333 | 0. | 1.00 | 2487 | 0 | 1.00 |
| 0.2488 | 0.0037 | 15155 | 417 | 1244 | 0. | 1.00 | 2697 | 0 | 1.00 |
| 0.2562 | 0.0037 | 14728 | 391 | 1202 | 0. | 1.00 | 2308 | 0 | 1.00 |
| 0.2637 | 0.0037 | 14714 | 430 | 1317 | 0. | 1.00 | 2692 | 0 | 1.00 |
| 0.2713 | 0.0037 | 14320 | 376 | 1116 | 0. | 1.00 | 2536 | 48 | 1.06 |
| 0.2788 | 0.0037 | 14768 | 469 | 1419 | 0. | 1.00 | 2555 | 0 | 1.00 |
| 0.2862 | 0.0037 | 13969 | 434 | 1314 | 0. | 1.00 | 2750 | 0 | 1.00 |
| 0.2937 | 0.0037 | 13703 | 394 | 1242 | 0. | 1.00 | 2275 | 0 | 1.00 |
| 0.3013 | 0.0037 | 13702 | 385 | 1215 | 0. | 1.00 | 2120 | 0 | 1.00 |
| 0.3088 | 0.0037 | 13360 | 381 | 1243 | 0. | 1.00 | 1943 | 0 | 1.00 |
| 0.3162 | 0.0037 | 12652 | 400 | 1263 | 0. | 1.00 | 2112 | 0 | 1.00 |
| 0.3237 | 0.0037 | 12646 | 408 | 1323 | 0. | 1.00 | 2089 | 0 | 1.00 |
| 0.3313 | 0.0037 | 12647 | 377 | 1169 | 0. | 1.00 | 2042 | 0 | 1.00 |
| 0.3388 | 0.0037 | 12396 | 425 | 1447 | 0. | 1.00 | 1944 | 0 | 1.00 |
| 0.3462 | 0.0037 | 13322 | 418 | 1308 | 0. | 1.00 | 2108 | 0 | 1.00 |
| 0.3537 | 0.0037 | 12112 | 416 | 1373 | 0. | 1.00 | 2247 | 0 | 1.00 |
| 0.3613 | 0.0037 | 12064 | 428 | 1361 | 0. | 1.00 | 2336 | 0 | 1.00 |
| 0.3700 | 0.0050 | 11918 | 379 | 1239 | 0. | 1.00 | 1991 | 0 | 1.00 |
| 0.3800 | 0.0050 | 12490 | 307 | 1155 | 0. | 1.00 | 1432 | 0 | 1.00 |
| 0.3900 | 0.0050 | 11817 | 291 | 985 | 0. | 1.00 | 1562 | 0 | 1.00 |
| 0.4000 | 0.0050 | 12047 | 299 | 930 | 0. | 1.00 | 2841 | 1142 | 1.31 |
| 0.4100 | 0.0050 | 12597 | 229 | 725 | 0. | 1.00 | 1255 | 0 | 1.00 |
| 0.4200 | 0.0050 | 12540 | 230 | 762 | 147 | 1.09 | 1103 | 0 | 1.00 |
| 0.4300 | 0.0050 | 12363 | 217 | 836 | 274 | 1.22 | 1163 | 0 | 1.00 |
| 0.4400 | 0.0050 | 12073 | 261 | 822 | 0. | 1.00 | 1268 | 0 | 1.00 |
| 0.4500 | 0.0050 | 11741 | 242 | 889 | 0. | 1.00 | 1110 | 0 | 1.00 |
| 0.4600 | 0.0050 | 12500 | 270 | 786 | 264 | 1.23 | 1115 | 0 | 1.00 |
| 0.4700 | 0.0050 | 12616 | 283 | 972 | 0. | 1.00 | 1309 | 220 | 1.07 |
| 0.4800 | 0.0050 | 12335 | 277 | 1076 | 172 | 1.06 | 1350 | 0 | 1.00 |
| 0.4900 | 0.0050 | 12361 | 338 | 1094 | 234 | 1.10 | 1833 | 0 | 1.00 |
| 0.5000 | 0.0050 | 12683 | 299 | 1010 | 0. | 1.00 | 1380 | 0 | 1.00 |
| 0.5100 | 0.0050 | 12645 | 292 | 956 | 0. | 1.00 | 1373 | 0 | 1.00 |
| 0.5200 | 0.0050 | 12620 | 329 | 1159 | 0. | 1.00 | 1382 | 0 | 1.00 |
| 0.5300 | 0.0050 | 12022 | 355 | 1219 | 0. | 1.00 | 1580 | 0 | 1.00 |
| 0.5400 | 0.0050 | 12322 | 371 | 1166 | 297 | 1.14 | 1472 | 291 | 1.09 |
| 0.5500 | 0.0050 | 11795 | 332 | 1187 | 0. | 1.00 | 1418 | 0 | 1.00 |
| 0.5600 | 0.0050 | 11316 | 316 | 1079 | 49. | 1.01 | 1464 | 0 | 1.00 |
| 0.5725 | 0.0075 | 11747 | 297 | 996 | 0. | 1.00 | 1440 | 0 | 1.00 |
| 0.5875 | 0.0075 | 11615 | 291 | 1020 | 132 | 1.04 | 1262 | 0 | 1.00 |
| 0.6025 | 0.0075 | 12680 | 363 | 1378 | 0. | 1.00 | 1471 | 0 | 1.00 |
| 0.6175 | 0.0075 | 12253 | 363 | 1221 | 165 | 1.04 | 1552 | 0 | 1.00 |
| 0.6325 | 0.0075 | 12527 | 364 | 1306 | 0. | 1.00 | 1512 | 0 | 1.00 |
| 0.6475 | 0.0075 | 11772 | 451 | 1575 | 0. | 1.00 | 1941 | 63 | 1.00 |
| 0.6625 | 0.0075 | 11818 | 407 | 1383 | 0. | 1.00 | 1778 | 0 | 1.00 |
| 0.6825 | 0.0125 | 12021 | 343 | 1136 | 0. | 1.00 | 1439 | 0 | 1.00 |
| 0.7075 | 0.0125 | 12566 | 423 | 1425 | 0. | 1.00 | 1739 | 0 | 1.00 |
| 0.7325 | 0.0125 | 11859 | 462 | 1735 | 336 | 1.09 | 1724 | 0 | 1.00 |
| 0.7575 | 0.0125 | 12333 | 553 | 1927 | 0. | 1.00 | 2299 | 260 | 1.03 |
*Equilibrium mixing ratios are shown in brackets and are calculated at WASP-178b’s equilibrium temperature (2,450 K) and 0.1 mbar pressure.
| Orbital Parameters | |
|---|---|
| Inclination () | |
| Transit Center () | days |
| Period 7 | 3.34482850.0000012 days |
| Planet Radius () | |
| Retrieved and Equilibrium Atmospheric Log Mixing Ratios | |
| SiO | [-4.46] |
| Fe | [-4.47] |
| Fe II | [-9.44] |
| Mg | [-4.37] |
| Mg II | [-8.67] |
| TiO | [-7.07] |
| VO | [-8.56] |
| [Fe/H] | [0.00] |
References
- 1 Cushing, M. C. et al. A Spitzer Infrared Spectrograph Spectral Sequence of M, L, and T Dwarfs. Astrophys. J. 648, 614–628 (2006).
- 2 Saumon, D. & Marley, M. S. The Evolution of L and T Dwarfs in Color-Magnitude Diagrams. Astrophys. J. 689, 1327–1344 (2008).
- 3 Burningham, B. et al. Cloud busting: Enstatite and quartz clouds in the atmosphere of 2M2224-0158. Mon. Not. R. Astron. Soc. (2021).
- 4 Gao, P. et al. Aerosol composition of hot giant exoplanets dominated by silicates and hydrocarbon hazes. Nature Astronomy 4, 951–956 (2020).
- 5 Lothringer, J. D. et al. An HST/STIS Optical Transmission Spectrum of Warm Neptune GJ 436b. Astron. J. 155, 66 (2018).
- 6 Kitzmann, D. et al. The Peculiar Atmospheric Chemistry of KELT-9b. Astrophys. J. 863, 183 (2018).
- 7 Hellier, C. et al. WASP-South hot Jupiters: WASP-178b, WASP-184b, WASP-185b, and WASP-192b. Mon. Not. R. Astron. Soc. 490, 1479–1487 (2019).
- 8 Rodríguez Martínez, R. et al. KELT-25 b and KELT-26 b: A Hot Jupiter and a Substellar Companion Transiting Young A Stars Observed by TESS. Astron. J. 160, 111 (2020).
- 9 Matsushima, S. Radiative Opacity in Stellar Atmospheres. II. Effect of Ultraviolet Continuum on the Photospheric Radiation Field. Astrophys. J. 154, 715 (1968).
- 10 Fontenla, J. M., Stancil, P. C. & Landi, E. Solar Spectral Irradiance, Solar Activity, and the Near-Ultra-Violet. Astrophys. J. 809, 157 (2015).
- 11 Sharp, C. M. & Burrows, A. Atomic and Molecular Opacities for Brown Dwarf and Giant Planet Atmospheres. Astrophys. J. S. 168, 140–166 (2007).
- 12 Lothringer, J. D., Fu, G., Sing, D. K. & Barman, T. S. UV Exoplanet Transmission Spectral Features as Probes of Metals and Rainout. Astrophys. J. L. 898, L14 (2020).
- 13 Hoeijmakers, H. J. et al. Hot Exoplanet Atmospheres Resolved with Transit Spectroscopy (HEARTS). IV. A spectral inventory of atoms and molecules in the high-resolution transmission spectrum of WASP-121 b. Astron. Astrophys. 641, A123 (2020).
- 14 Stangret, M. et al. Detection of Fe I and Fe II in the atmosphere of MASCARA-2b using a cross-correlation method. Astron. Astrophys. 638, A26 (2020).
- 15 Ehrenreich, D. et al. Nightside condensation of iron in an ultrahot giant exoplanet. Nature 580, 597–601 (2020).
- 16 Kesseli, A. Y. & Snellen, I. A. G. Confirmation of Asymmetric Iron Absorption in WASP-76b with HARPS. Astrophys. J. L. 908, L17 (2021).
- 17 Sing, D. K. et al. The Hubble Space Telescope PanCET Program: Exospheric Mg II and Fe II in the Near-ultraviolet Transmission Spectrum of WASP-121b Using Jitter Decorrelation. Astron. J. 158, 91 (2019).
- 18 Gibson, N. P. et al. Detection of Fe I in the atmosphere of the ultra-hot Jupiter WASP-121b, and a new likelihood-based approach for Doppler-resolved spectroscopy. Mon. Not. R. Astron. Soc. 493, 2215–2228 (2020).
- 19 Cabot, S. H. C., Madhusudhan, N., Welbanks, L., Piette, A. & Gandhi, S. Detection of neutral atomic species in the ultra-hot Jupiter WASP-121b. Mon. Not. R. Astron. Soc. 494, 363–377 (2020).
- 20 Hoeijmakers, H. J. et al. A spectral survey of an ultra-hot Jupiter. Detection of metals in the transmission spectrum of KELT-9 b. Astron. Astrophys. 627, A165 (2019).
- 21 Merritt, S. R. et al. An inventory of atomic species in the atmosphere of WASP-121b using UVES high-resolution spectroscopy. Mon. Not. R. Astron. Soc. (2021).
- 22 Wakeford, H. R. et al. Into the UV: A Precise Transmission Spectrum of HAT-P-41b Using Hubble’s WFC3/UVIS G280 Grism. Astron. J. 159, 204 (2020).
- 23 Visscher, C., Lodders, K. & Fegley, J., Bruce. Atmospheric Chemistry in Giant Planets, Brown Dwarfs, and Low-mass Dwarf Stars. III. Iron, Magnesium, and Silicon. Astrophys. J. 716, 1060–1075 (2010).
- 24 Parmentier, V., Showman, A. P. & Fortney, J. J. The cloudy shape of hot Jupiter thermal phase curves. Mon. Not. R. Astron. Soc. 501, 78–108 (2021).
- 25 Roman, M. T. et al. Clouds in Three-dimensional Models of Hot Jupiters over a Wide Range of Temperatures. I. Thermal Structures and Broadband Phase-curve Predictions. Astrophys. J. 908, 101 (2021).
- 26 Helling, C. et al. Cloud property trends in hot and ultra-hot giant gas planets (WASP-43b, WASP-103b, WASP-121b, HAT-P-7b, and WASP-18b). Astron. Astrophys. 649, A44 (2021).
- 27 Thorngren, D., Gao, P. & Fortney, J. J. The Intrinsic Temperature and Radiative?Convective Boundary Depth in the Atmospheres of Hot Jupiters. Astrophys. J. L. 884, L6 (2019).
- 28 Hörst, S. M. et al. Haze production rates in super-Earth and mini-Neptune atmosphere experiments. Nature Astronomy 2, 303–306 (2018).
- 29 Fleury, B., Gudipati, M. S., Henderson, B. L. & Swain, M. Photochemistry in Hot H2-dominated Exoplanet Atmospheres. Astrophys. J. 871, 158 (2019).
- 30 Kempton, E. M. R. et al. A Framework for Prioritizing the TESS Planetary Candidates Most Amenable to Atmospheric Characterization. Publ. Astron. Soc. Pacif. 130, 114401 (2018).
- 31 Mullally, S. E., Rodriguez, D. R., Stevenson, K. B. & Wakeford, H. R. The Exo.MAST Table for JWST Exoplanet Atmosphere Observability. Research Notes of the American Astronomical Society 3, 193 (2019).
- 32 Luna, J. L. & Morley, C. V. Empirically Determining Substellar Cloud Compositions in the Era of the James Webb Space Telescope. Astrophys. J. 920, 146 (2021).
- 33 Evans, T. M. et al. An Optical Transmission Spectrum for the Ultra-hot Jupiter WASP-121b Measured with the Hubble Space Telescope. Astron. J. 156, 283 (2018).
- 34 Sing, D. K. et al. A continuum from clear to cloudy hot-Jupiter exoplanets without primordial water depletion. Nature 529, 59–62 (2016).
- 35 van Dokkum, P. G. Cosmic-Ray Rejection by Laplacian Edge Detection. Publ. Astron. Soc. Pacif. 113, 1420–1427 (2001).
- 36 Pirzkal, N., Hilbert, B. & Rothberg, B. Trace and Wavelength Calibrations of the UVIS G280 +1/-1 Grism Orders. Space Telescope WFC Instrument Science Report (2017).
- 37 Mandel, K. & Agol, E. Analytic Light Curves for Planetary Transit Searches. Astrophys. J. L. 580, L171–L175 (2002).
- 38 Pont, F., Zucker, S. & Queloz, D. The effect of red noise on planetary transit detection. Mon. Not. R. Astron. Soc. 373, 231–242 (2006).
- 39 Winn, J. N. et al. The Transit Light Curve Project. VII. The Not-So-Bloated Exoplanet HAT-P-1b. Astron. J. 134, 1707–1712 (2007).
- 40 Sing, D. K. Stellar limb-darkening coefficients for CoRot and Kepler. Astron. Astrophys. 510, A21 (2010).
- 41 Schaller, G., Schaerer, D., Meynet, G. & Maeder, A. New grids of stellar models from 0.8 to 120 M_solar at Z=0.020 and Z=0.001. Astron. Astrophys. Suppl. Ser. 96, 269 (1992).
- 42 Lothringer, J. D., Barman, T. & Koskinen, T. Extremely Irradiated Hot Jupiters: Non-oxide Inversions, H- Opacity, and Thermal Dissociation of Molecules. Astrophys. J. 866, 27 (2018).
- 43 Lothringer, J. D. & Barman, T. The Influence of Host Star Spectral Type on Ultra-hot Jupiter Atmospheres. Astrophys. J. 876, 69 (2019).
- 44 Hubeny, I., Burrows, A. & Sudarsky, D. A Possible Bifurcation in Atmospheres of Strongly Irradiated Stars and Planets. Astrophys. J. 594, 1011–1018 (2003).
- 45 Fortney, J. J., Lodders, K., Marley, M. S. & Freedman, R. S. A Unified Theory for the Atmospheres of the Hot and Very Hot Jupiters: Two Classes of Irradiated Atmospheres. Astrophys. J. 678, 1419–1435 (2008).
- 46 Diamond-Lowe, H., Stevenson, K. B., Bean, J. L., Line, M. R. & Fortney, J. J. New Analysis Indicates No Thermal Inversion in the Atmosphere of HD 209458b. Astrophys. J. 796, 66 (2014).
- 47 Lewis, N. K. et al. Into the UV: The Atmosphere of the Hot Jupiter HAT-P-41b Revealed. Astrophys. J. L. 902, L19 (2020).
- 48 Lothringer, J. D. & Barman, T. S. The PHOENIX Exoplanet Retrieval Algorithm and Using H- Opacity as a Probe in Ultrahot Jupiters. Astron. J. 159, 289 (2020).
- 49 ter Braak, C. J. F. & Vrugt, J. A. Differential evolution markov chain with snooker updater and fewer chains. Statistics and Computing 18, 435–446 (2008). URL https://doi.org/10.1007/s11222-008-9104-9.
- 50 Lothringer, J. D. et al. A New Window into Planet Formation and Migration: Refractory-to-Volatile Elemental Ratios in Ultra-hot Jupiters. Astrophys. J. 914, 12 (2021).
- 51 Wilson, J. et al. Gemini/GMOS Optical Transmission Spectroscopy of WASP-121b: signs of variability in an ultra-hot Jupiter? arXiv e-prints arXiv:2103.05698 (2021).
- 52 Parmentier, V. & Guillot, T. A non-grey analytical model for irradiated atmospheres. I. Derivation. Astron. Astrophys. 562, A133 (2014).
- 53 MacDonald, R. J. & Madhusudhan, N. HD 209458b in New Light: Detection of Nitrogen Chemistry, Patchy Clouds and Sub-Solar Water. Mon. Not. R. Astron. Soc. 469, 1979–1996 (2017).
- 54 McCullough, P. R., Crouzet, N., Deming, D. & Madhusudhan, N. Water Vapor in the Spectrum of the Extrasolar Planet HD 189733b. I. The Transit. Astrophys. J. 791, 55 (2014).
- 55 Rackham, B. V., Apai, D. & Giampapa, M. S. The Transit Light Source Effect: False Spectral Features and Incorrect Densities for M-dwarf Transiting Planets. Astrophys. J. 853, 122 (2018).
- 56 Rackham, B. V., Apai, D. & Giampapa, M. S. The Transit Light Source Effect. II. The Impact of Stellar Heterogeneity on Transmission Spectra of Planets Orbiting Broadly Sun-like Stars. Astron. J. 157, 96 (2019).
- 57 Kirk, J. et al. ACCESS and LRG-BEASTS: A Precise New Optical Transmission Spectrum of the Ultrahot Jupiter WASP-103b. Astron. J. 162, 34 (2021).
- 58 Kochanek, C. S. et al. The All-Sky Automated Survey for Supernovae (ASAS-SN) Light Curve Server v1.0. Publ. Astron. Soc. Pacif. 129, 104502 (2017).
- 59 Jayasinghe, T. et al. The ASAS-SN catalogue of variable stars - II. Uniform classification of 412 000 known variables. Mon. Not. R. Astron. Soc. 486, 1907–1943 (2019).
- 60 Lecavelier Des Etangs, A., Pont, F., Vidal-Madjar, A. & Sing, D. Rayleigh scattering in the transit spectrum of HD 189733b. Astron. Astrophys. 481, L83–L86 (2008).
- 61 Ohno, K. & Kawashima, Y. Super-Rayleigh Slopes in Transmission Spectra of Exoplanets Generated by Photochemical Haze. Astrophys. J. L. 895, L47 (2020).
- 62 Powell, D. et al. Transit Signatures of Inhomogeneous Clouds on Hot Jupiters: Insights from Microphysical Cloud Modeling. Astrophys. J. 887, 170 (2019).
- 63 Espinoza, N. & Jones, K. Constraining Mornings and Evenings on Distant Worlds: A new Semianalytical Approach and Prospects with Transmission Spectroscopy. Astron. J. 162, 165 (2021).
- 64 Mikal-Evans, T. et al. Diurnal variations in the stratosphere of an ultrahot planet. Nature Astronomy (2021).
- 65 Showman, A. P., Fortney, J. J., Lewis, N. K. & Shabram, M. Doppler Signatures of the Atmospheric Circulation on Hot Jupiters. Astrophys. J. 762, 24 (2013).
- 66 Hauschildt, P. H., Allard, F. & Baron, E. The NextGen Model Atmosphere Grid for 3000==10,000 K. Astrophys. J. 512, 377–385 (1999).
- 67 Barman, T. S., Hauschildt, P. H. & Allard, F. Irradiated Planets. Astrophys. J. 556, 885–895 (2001).
- 68 Woitke, P. et al. Equilibrium chemistry down to 100 K. Impact of silicates and phyllosilicates on the carbon to oxygen ratio. Astron. Astrophys. 614, A1 (2018).