vskip=0pt
Habitat-Web: Learning Embodied Object-Search Strategies
from Human Demonstrations at Scale
Abstract
We present a large-scale study of imitating human demonstrations on tasks that
require a virtual robot to search for objects in new environments – (1) ObjectGoal Navigation (e.g. ‘find & go to a chair’) and (2) Pick&Place (e.g. ‘find mug, pick mug,
find counter, place mug on counter’).
First, we develop a virtual teleoperation data-collection infrastructure –
connecting Habitat simulator running in a web browser to Amazon Mechanical
Turk, allowing remote users to teleoperate virtual robots, safely and at scale.
We collect demonstrations for ObjectNav and demonstrations for
Pick&Place,
which is an order of magnitude
larger than existing human demonstration datasets
in simulation or on real robots.
Our virtual teleoperation data contains actions, and is equivalent to
hours of real-world teleoperation time, and illustrates
rich, diverse strategies for solving the tasks.
Second, we use this data to answer the question – how does large-scale
imitation learning (IL) (which has not been hitherto possible) compare to
reinforcement learning (RL) (which is the status quo)?
On ObjectNav, we find that IL (with no bells or whistles) using human
demonstrations outperforms RL using agent-gathered trajectories.
This effectively establishes an ‘exchange rate’ – a single human demonstration
appears to be worth agent-gathered ones.
More importantly, we find the IL-trained agent learns efficient object-search behavior from humans –
it peeks into rooms, checks corners for small objects, turns in place to get a panoramic view –
none of these are exhibited as prominently by the RL agent, and to induce these behaviors
via contemporary RL techniques would require tedious reward engineering.
Finally, accuracy vs. training data size plots show promising scaling behavior, suggesting
that simply collecting more demonstrations is likely to advance the state of art further.
On Pick&Place, the comparison is starker – IL agents achieve
success on episodes with new object-receptacle locations when trained
with human demonstrations, while RL agents fail to get beyond .
Overall, our work provides compelling evidence for investing in large-scale imitation learning.
Project page: ram81.github.io/projects/habitat-web.
1 Introduction
General-purpose robots that can perform a diverse set of embodied tasks in a diverse set of environments have to be good at visual exploration. Consider the canonical example of asking a household robot, ‘Where are my keys?’. To answer this (assuming the robot does not remember the answer from memory), the robot would have to search the house, often guided by intelligent priors – e.g. peeking into the washroom or kitchen might be sufficient to be reasonably sure the keys are not there, while exhaustively searching the living room might be much more important since keys are more likely to be there. While doing so, the robot has to internally keep track of where all it has been to avoid redundant search, and it might also have to interact with objects, e.g. check drawers and cabinets in the living room (but not those in the washroom or kitchen!).
This example illustrates fairly sophisticated exploration, involving a careful interplay of various implicit objectives (semantic priors, exhaustive search, efficient navigation, interaction, etc.). Many recent tasks of interest in the embodied AI community – e.g. ObjectGoal Navigation [1, 2], rearrangement [3, 4], language-guided navigation [5, 6] and interaction [7], question answering [8, 9, 10, 11, 12] – involve some flavor of this visual exploration. With careful reward engineering, reinforcement learning (RL) approaches to these tasks have achieved commendable success [13, 14, 15, 16, 17]. However, engineering the ‘right’ reward function so that the learned policy exhibits desired behavior is unintuitive and frustrating (even for domain experts), expensive (requiring multiple rounds of retraining under different rewards), and not scalable to new tasks or behaviors. For complex tasks (e.g. object rearrangement or tasks specified in open-ended natural language), RL from scratch may not even get off the ground.
In this work, we advance the alternative research agenda of imitation learning [18] – i.e. collecting a large dataset of human demonstrations (that implicitly capture intelligent behavior we wish to impart to our agents) and learning policies directly from these human demonstrations.
First, we develop a safe scalable virtual teleoperation data-collection infrastructure – connecting the Habitat simulator running in a browser to Amazon Mechanical Turk (AMT). We develop this in way that enables collecting human demonstrations for a variety of tasks being studied within the Habitat [19, 20] ecosystem (e.g. PointNav [2], ObjectNav [1, 2], ImageNav [21], VLN-CE [6], MultiON [22], etc.).
We use this infrastructure to collect human demonstration datasets for tasks requiring visual search – 1) ObjectGoal Navigation (e.g. ‘find & go to a chair’) and 2) Pick&Place (e.g. ‘find mug, pick mug, find counter, place on counter’). In total we collect human demonstrations, demonstrations for ObjectNav and demonstrations for Pick&Place. In contrast, the largest existing datasets have - human demonstrations in simulation [23, 24, 25] or on real robots [26, 27], an order of magnitude smaller. This virtual teleoperation data contains actions, which is equivalent to hours of real-world teleoperation time assuming a LoCoBot motion model from [28] (details in appendix (Sec. A.3)). The first thing this data provides is a ‘human baseline’ with sufficiently tight error-bars to be taken seriously. On the ObjectNav validation split, humans achieve success and Success Weighted by Path Length (SPL) [2] (vs. success and SPL for the 2021 Habitat ObjectNav Challenge winner [15]). The success rate () suggests that this task is largely doable for humans (but not ). The SPL () suggests that even humans need to explore significantly.
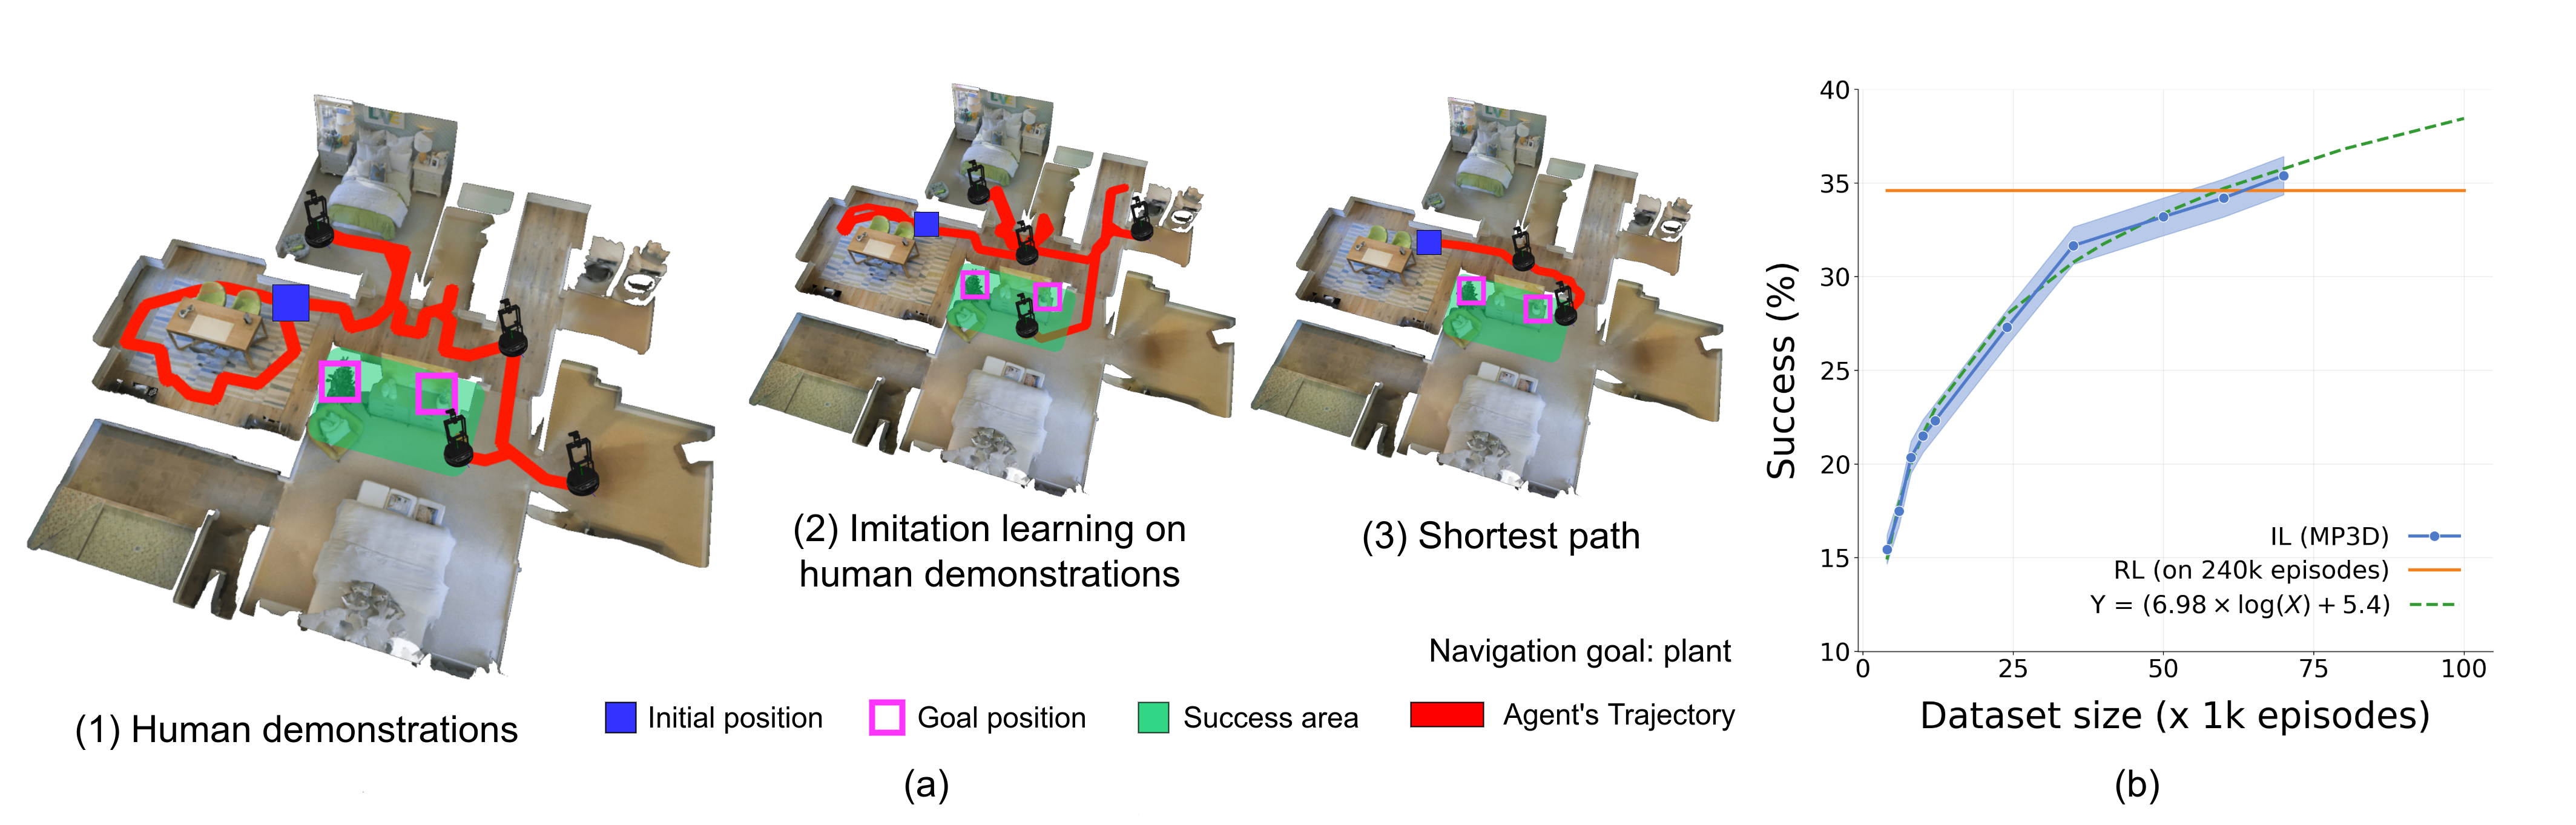
Beyond scale, the data is also rich and diverse in the strategies that humans use to solve the tasks. Fig. 1 shows an example trajectory of an AMT user controlling a LoCoBot looking for a ‘plant’ in a new house – notice the peeking into rooms, looping around the dining table – all of which is (understandably) absent from the shortest path to the goal.
We use this data to answer the question – how does large-scale imitation learning (IL) (which has not been hitherto possible) compare to large-scale reinforcement learning (RL) (which is the status quo)? On ObjectNav, we find that IL (with no bells or whistles) using only human demonstrations outperforms RL using agent-gathered trajectories. This effectively establishes an ‘exchange rate’ – a single human demonstration appears to be worth agent-gathered ones. More importantly, we find the IL-trained agent learns efficient object-search behavior – as shown in Fig. 1 and Sec. 7. The IL agent learns to mimic human behavior of peeking into rooms, checking corners for small objects, turning in place to get a panoramic view – none of these are exhibited as prominently by the RL agent. Finally, the accuracy vs. training-data-size plot (Fig. 1b) shows promising scaling behavior, suggesting that simply collecting more demonstrations is likely to advance the state of art further. On Pick&Place, the comparison is even starker – IL-agents achieve success on episodes with new object-receptacle locations when trained with human demonstrations, while RL agents fail to get beyond .
On both tasks, we find that demonstrations from humans are essential; imitating shortest paths from an oracle produces neither accuracy nor the strategic search behavior. In hindsight, this is perfectly understandable – shortest paths (e.g. Fig. 1(a3)) do not contain any exploration but the task requires the agent to explore. Essentially, a shortest path is inimitable, but imitation learning is invaluable. Overall, our work provides compelling evidence for investing in large-scale imitation learning of human demonstrations.
2 Related work
Embodied Demonstrations from Humans. Prior expert demonstration datasets for embodied tasks combining vision and action (and optionally language) can be broadly categorized into either consisting of shortest-path trajectories from a planner with privileged information [7, 8, 29, 5], or consisting of human-provided trajectories [24, 25, 23]. While some works in the former collect natural language data from humans [7, 5], we contend that collecting navigation data from humans is equally crucial. Datasets with human-provided navigation trajectories are typically small. TEACh [23], CVDN [24] and WAY [25] have episodes, while the EmbodiedQA [8] dataset has human-provided episodes – all prohibitively small for training proficient agents. A key contribution of our work is a scalable web-based infrastructure for collecting human navigation and interaction demonstrations, that is easily extensible to any task situated in the Habitat [19] simulator, including language-based tasks. We have collected x more demonstrations (in total ) compared to prior publicly available datasets. In a similar vein, Abramson et al. [30] study large-scale imitation learning on human demonstrations, but their dataset is not publicly available and the environments used lack visual realism compared to Matterport3D [31].
Exploration. Learning how to explore an environment to gather sufficient information for use in downstream tasks has a rich history [32]. Curiosity-based approaches typically use reinforcement learning to maximize intrinsic rewards that capture the surprise or state prediction error of the agent [33, 34, 35]. State visitation count rewards are also popular for learning exploration [36, 37]. We refer the reader to Ramakrishnan et al. [38] for a review of exploration objectives for embodied agents. For improving exploration in ObjectNav specifically, SemExp [17] made use of a modular policy for semantic mapping and path planning, Ye et al. [15] used time-decaying state visitation count reward, and Maksymets et al. [16] used area coverage reward.
Most relatedly, Chen et al. [39] used human navigation trajectories from the EmbodiedQA dataset [8] (ignoring the questions) to learn task-independent exploration using imitation learning. We likewise train agents via imitation learning on human demonstrations, but rather than encouraging task-agnostic exploration, we consider human demonstrations to be a rich task-specific mix of exploration and efficient navigation, that simple architectures without explicit mapping and planning modules can be trained on.
3 Habitat-WebGL Infrastructure
To be able to train agents via imitation learning on human demonstrations, we first need a reliable pipeline to collect human demonstrations at scale. To this end, we develop a web-based setup to connect the Habitat simulator[19, 20] to AMT users, building on the work of Newman et al. [40].
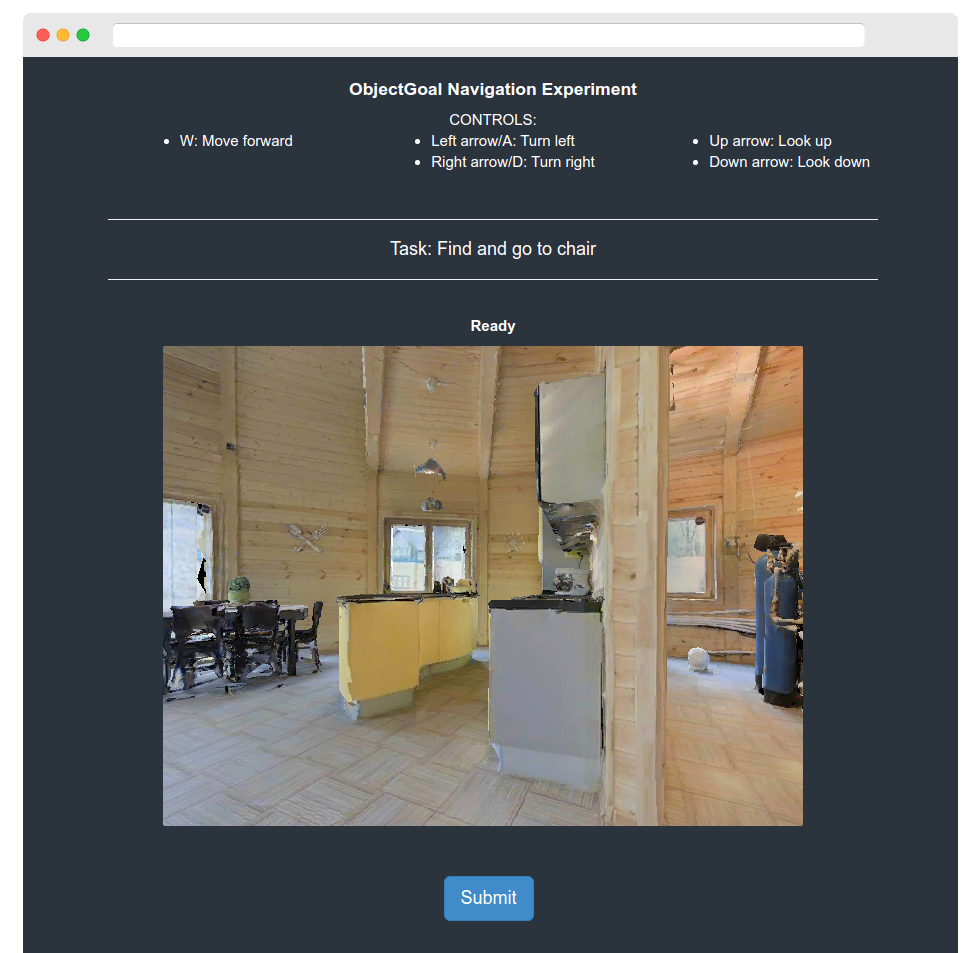
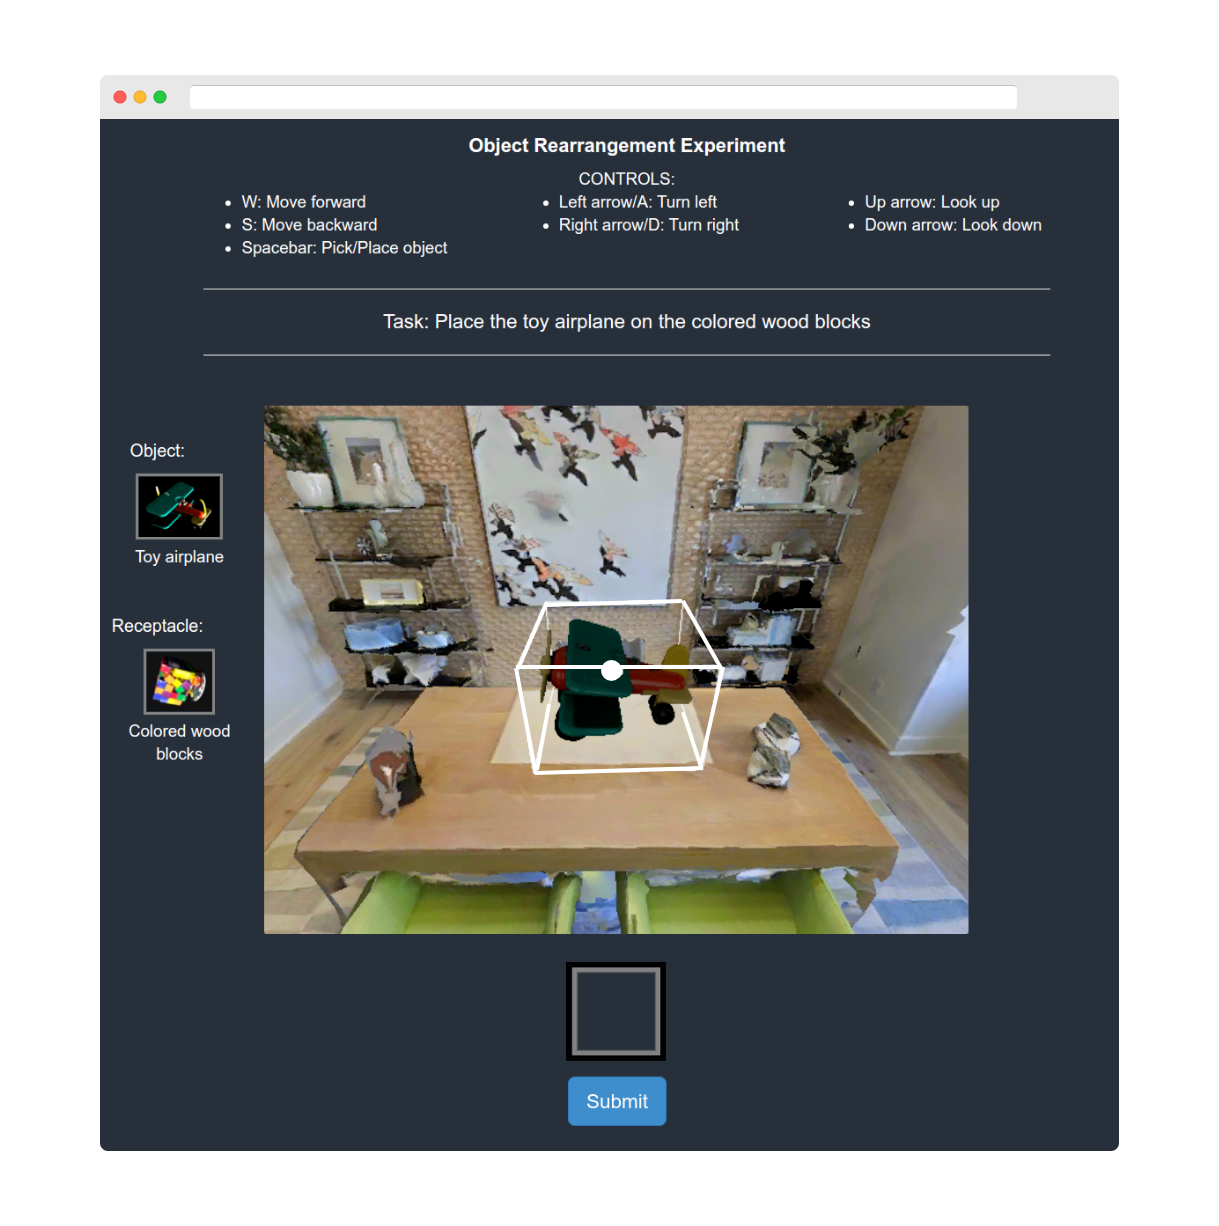
Interface. Fig. 2 shows a screenshot of the interface an AMT user interacts with to complete a data collection task. This web application renders assets from Habitat-Sim running on the user’s browser via WebGL. All data collection in this work was done in Matterport3D [31] scans, but any Habitat-compatible asset may be used in future. Users can see the agent’s first-person RGB view, and can move around and grab / release objects using keyboard controls. On the task page, users are provided an instruction and details about keyboard controls to complete the task. For ObjectNav, we provide an instruction of the form ‘Find and go to the <goal_object_category>’. For tasks requiring interaction with objects (e.g. Pick&Place), we highlight the object under the user’s gaze by drawing a D bounding box around it (pointed to by a crosshair as in video games). In our initial pilots, we found this to improve user experience when grabbing objects instead of users having to guess when objects are available to be picked up. When an object is successfully grabbed, it disappears from the first-person view and immediately appears in the ‘inventory’ area on the task interface. When a grabbed object is released, it is dropped at the center of the user’s screen where the crosshair would be pointing to. If the crosshair points to a distance, the object is dropped on the floor from a height at a distance of from the agent’s location. Upon completion, users submit the task by clicking ‘Submit’. At this point, the sequence of keyboard actions, agent, and object states are recorded in our backend server.
Habitat simulator and PsiTurk. Our Habitat-WebGL application is developed in Javascript, and allows us to access all C++ simulator APIs through Javascript bindings. This lets us use the full set of simulation features available in Habitat. To simulate physics, we use the physics APIs from Habitat [20], including rigid body dynamics support (C++ APIs exposed as Javascript bindings). Our interface executes actions entered by users every ms (rendering frames per second) and then steps physics for ms in the simulator. All of our tasks on AMT are served using PsiTurk and an NGINX reverse proxy, and all data stored in a MySQL database. We use PsiTurk to manage the tasks as it provides us with useful helper functions to log task-related metadata, as well as launch and approve tasks.
See Section A.6 for details on how we validate human-submitted AMT tasks and ensure data quality.
4 Tasks and Datasets
| ObjectNav | Pick-And-Place | |||||
| Human | Shortest Path | Human | Shortest Path | |||
| 1) | Total Episodes | |||||
| 2) | Success | |||||
| 3) | SPL | |||||
| 4) | Occupancy coverage | |||||
| 5) | Sight coverage | |||||
| (a) | ||||||
(b)
(c)
Using our web infrastructure, we collect demonstration datasets for two embodied tasks – ObjectNav [1, 2] and Pick&Place, an instantiation of object rearrangement [3].
4.1 ObjectGoal Navigation
In the ObjectGoal Navigation (ObjectNav) task, an agent is tasked with navigating to an instance of a specified object category (e.g. ‘chair’) in an unseen environment. The agent does not have access to a map of the environment and must navigate using an RGBD camera and a GPS+Compass sensor which provides location and orientation information relative to the start of the episode. The agent also receives the goal object category ID as input. The full action space is discrete and consists of move_forward (), turn_left (), turn_right (), look_up (), look_down (), and stop actions. For the episode to be considered successful, the agent must stop within Euclidean distance of the goal object within a maximum of steps and be able to turn to view the object from that end position [41].
Human Demonstrations (ObjectNav-HD). We collect demonstrations on the training scenes from Matterport3D [31] following the standard splits defined in [31, 2]. For each scene, we collect demonstration episodes for each unique goal object category with a randomly set start location of the human demonstrator for each episode. This amounts to an average of demonstrations per scene. Additionally, we collect demonstrations on training scenes from Gibson [42]. For each Gibson scene, we collect demonstration episodes for each unique goal object category. This amounts to demonstrations per scene. Similar to when training artificial agents, humans can view first-person RGB on the task interface, but unlike artificial agents, humans do not get access to Depth and GPS+Compass. We assume humans are sufficiently proficient at inferring depth and odometry from vision, to the extent required to accomplish the goal. In total, we collect ObjectNav demonstrations amounting to steps of experience, each episode averaging steps.
Shortest Path Demonstrations. To compare against prior embodied datasets of shortest paths [7, 8, 29, 5] and to demonstrate the unique advantage of human demonstrations, we also generate a dataset of shortest paths. The analysis in this section was performed on a subset of k demonstrations of ObjectNav-HD (collected in first phase). These demonstrations are generated by greedily fitting actions to follow the geodesic shortest path to the nearest navigable goal object viewpoint. Since shortest paths are (by design) shorter than human demonstrations (average vs. steps per demonstration), we compensate by generating a larger number of shortest paths to roughly match the steps with human demonstrations ( steps from shortest paths vs. steps from human demonstrations).
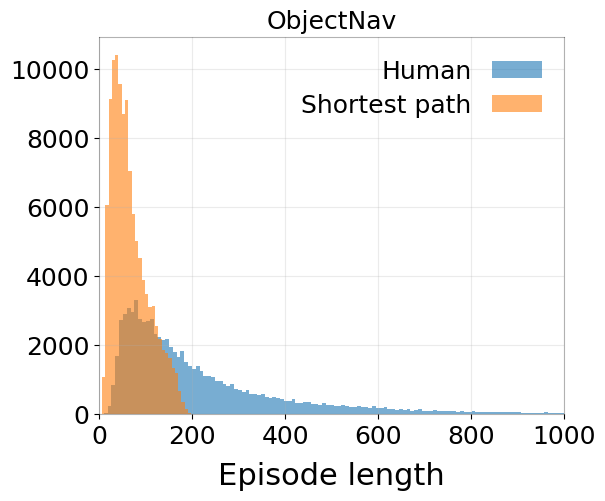
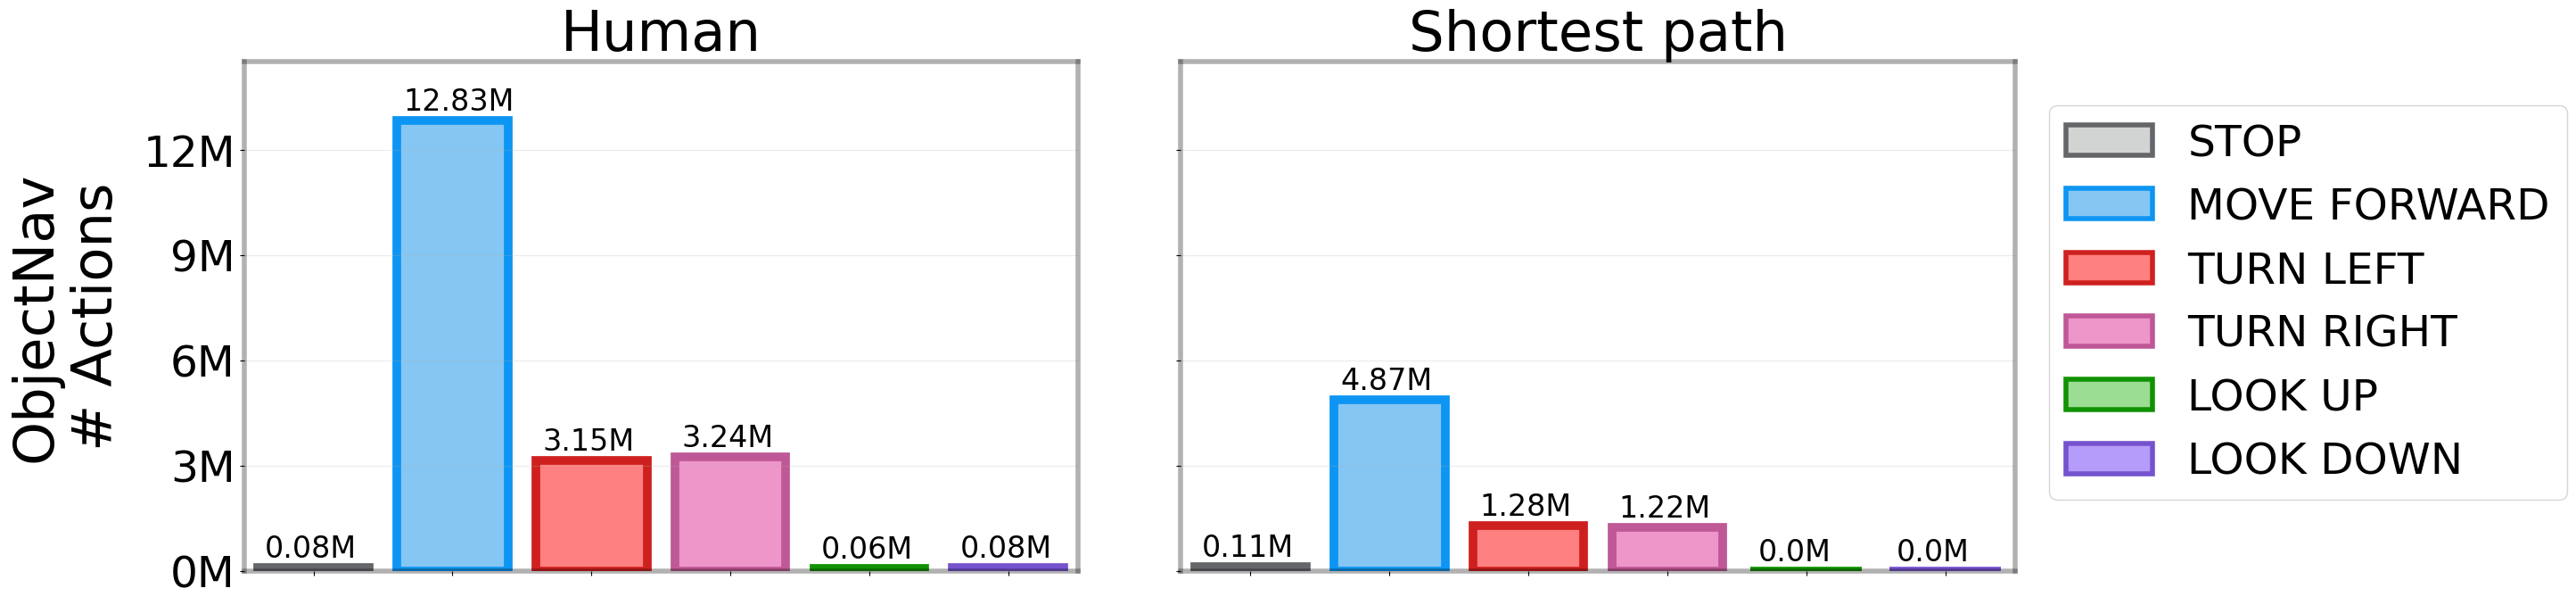
Analysis. Table 3a reports statistics of our human and shortest path demonstration datasets. Recall that an episode is considered a failure if the target object is not found within navigation steps. Under this definition, humans fail on training set episodes; they fail on episodes if we relax the step-limit. Surprisingly, SPL for humans is for training split episodes, significantly lower than for shortest paths underscoring the difficulty in searching for objects in in unseen environments.
We additionally report two metrics to demonstrate that the ObjectNav task requires significant exploration. Occupancy Coverage (OC) measures percentage of total area covered by the agent when navigating. To compute OC, we first divide the map into voxel grids of and increment a counter for each visited voxel. Sight Coverage (SC) measures the percentage of total navigable area visible to the agent in its field of view (FOV) during an episode. To compute SC, we project a mask on the top-down map of the environment using the agent’s FOV, that is iteratively updated at every step to update the area seen by the agent. OC and SC metrics for human demonstrations show that humans traverse x and observe x the area of the environment when performing this task compared to shortest paths.
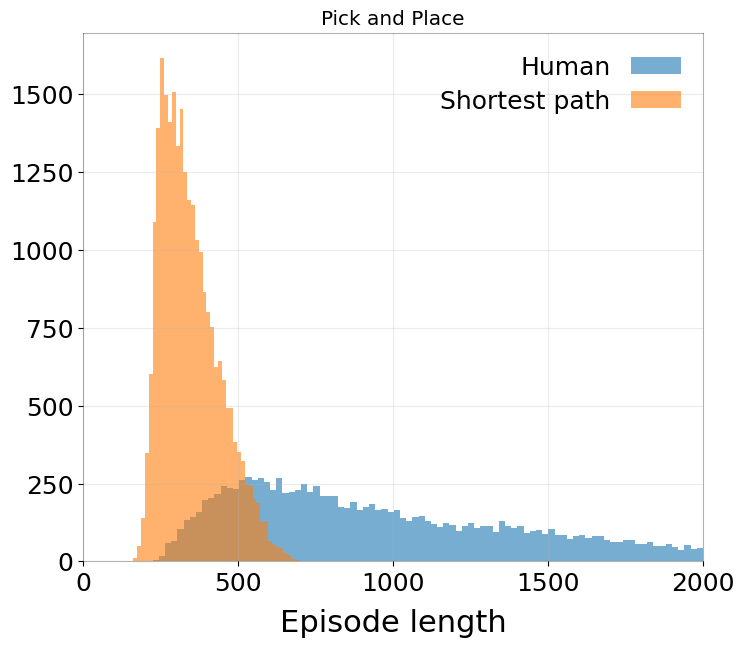
Fig. 3b,c show episode length and action histograms for human and shortest path demonstrations. Human demonstrations are longer (average vs. steps per demonstration) and have a slightly more uniform action distribution.
4.2 Object Rearrangement – Pick&Place
In the pick-and-place task (Pick&Place), an agent must follow an instruction of the form ‘Place the <object> on the <receptacle>’, without being told the location of the <object> or <receptacle> in a new environment. The agent must explore and navigate to the object, pick it up, explore and navigate to the receptacle, and place the previously picked-up object on it. Similar to ObjectNav, agents are not equipped with a map of the environment, and only have access to an RGBD camera and a GPS+compass sensor. At a high level, Pick&Place can be thought of as a natural extension of ObjectNav, performing it twice in the same episode – once to find the specified object and again to find the specified receptacle – delimited by grab and release actions. For object interaction, we use the ‘magic pointer’ abstraction defined in [3]. If the agent is not holding any object, the grab/release action will pick the object pointed to by its crosshair (at the center of its viewpoint) if within of the object. If the agent is already holding an object, the grab/release action will drop the object at the crosshair location. If there is no drop-off point within in the direction of the crosshair, the object will be dropped on the floor in front of the agent. The full action space is discrete and consists of move_forward (), move_backward (), turn_left (), turn_right (), look_up (), look_down (), grab_release, no_op (step physics ), and stop. For the episode to be considered successful, the agent must place the object on top of the receptacle – i.e. the object center should be at a height greater than the receptacle center, and within of the receptacle object center – within steps. We picked this threshold distance between the object and receptacle based on pilots on AMT. was sufficiently strict for avoiding false positives in the collected demonstrations where users are able to submit the task without necessarily placing the object on top of the receptacle.
Human Demonstrations (Pick&Place-HD). We collect human demonstrations for Pick&Place on scenes from Matterport3D [31]. In each episode, objects and receptacles are instantiated by randomly sampling from possible object-receptacle pairs. We initialize the object and receptacle at randomly sampled locations in the environment, and collect demonstrations for each object-receptacle pair. The agent, object, and receptacle locations are randomized across all episodes (including the we collect for each object-receptacle pair). In total, we have unique object-receptacle-agent position initializations per scene, amounting to demonstrations, which is M steps in experience, each episode averaging steps.
Shortest Path Demonstrations. Similar to ObjectNav, we generate shortest path demonstrations for Pick&Place. These demonstrations are generated by first using the geodesic shortest-path follower to the object, then using a heuristic action planner to face and pick up the object, then following the geodesic shortest-path to the receptacle, and again using a heuristic action planner to drop the object on the receptacle. We generated k shortest path demonstrations for Pick&Place, each averaging steps, amounting to a total of million steps of experience.
Analysis. Table 3a reports statistics for human and shortest path demonstrations. Similar to ObjectNav, humans have significantly lower SPL, and x higher occupancy and sight coverage compared to shortest paths, suggesting the need for exploration. Comparing episode lengths and action histograms (see appendix (Sec. A.1.1) for figure), human demonstrations are longer and make use of all actions. Interestingly, humans often use the move_backward action to backtrack, which the shortest path agents do not use (by design), instead of turning and moving forward. This behavior does not appear in ObjectNav shortest path demonstrations because there is just one target object, and so the geodesic shortest path would never involve backtracking or making turns.
5 Imitation Learning from Demonstrations
| Method | Success | SPL | |
| 6) | RL (ExploreTillSeen) [16] | ||
| 7) | RL (ExploreTillSeen + THDA) [16] | ||
| 8) | RL (Red Rabbit) [15] | ||
| 9) | RL (EmbCLIP) [43] | ||
| 10) | IL w/ Shortest Paths | ||
| 11) | IL w/ Human Demos (similar steps as row 4) | ||
| 12) | IL w/ Human Demos | ||
| 13) | IL w/ Human Demos (includes THDA [16]) | ||
| 14) | IL w/ Human Demos | ||
| 15) | IL w/ Human Demos (includes Gibson [42]) | ||
| 16) | IL w/ Human Demos | ||
| 17) | Humans | ||
| (c) ObjectNav results on MP3D-val |
We use behavior cloning to learn a policy from demonstrations. Let denote a policy parametrized by that maps observations to a distribution over actions . Let denote a trajectory consisting of state, observation, human action tuples: and denote a dataset of human demonstrations. The learning problem can be summarized as:
| (1) |
Inflection weighting introduced in Wijmans et al. [9], adjusts the loss function to upweight timesteps where actions change (i.e. ). Specifically, the inflection weighting loss coefficient is computed as total no. of actions in the dataset divided by the total no. of inflection points, and this coefficient is multiplied with the loss at each inflection timestep where . This approach was found to be useful for tasks like navigation with long sequences of the same actions, e.g. several ‘forward’ actions when navigating corridors [9]. We use inflection weighting in all our experiments and found it to help over vanilla behavior cloning.
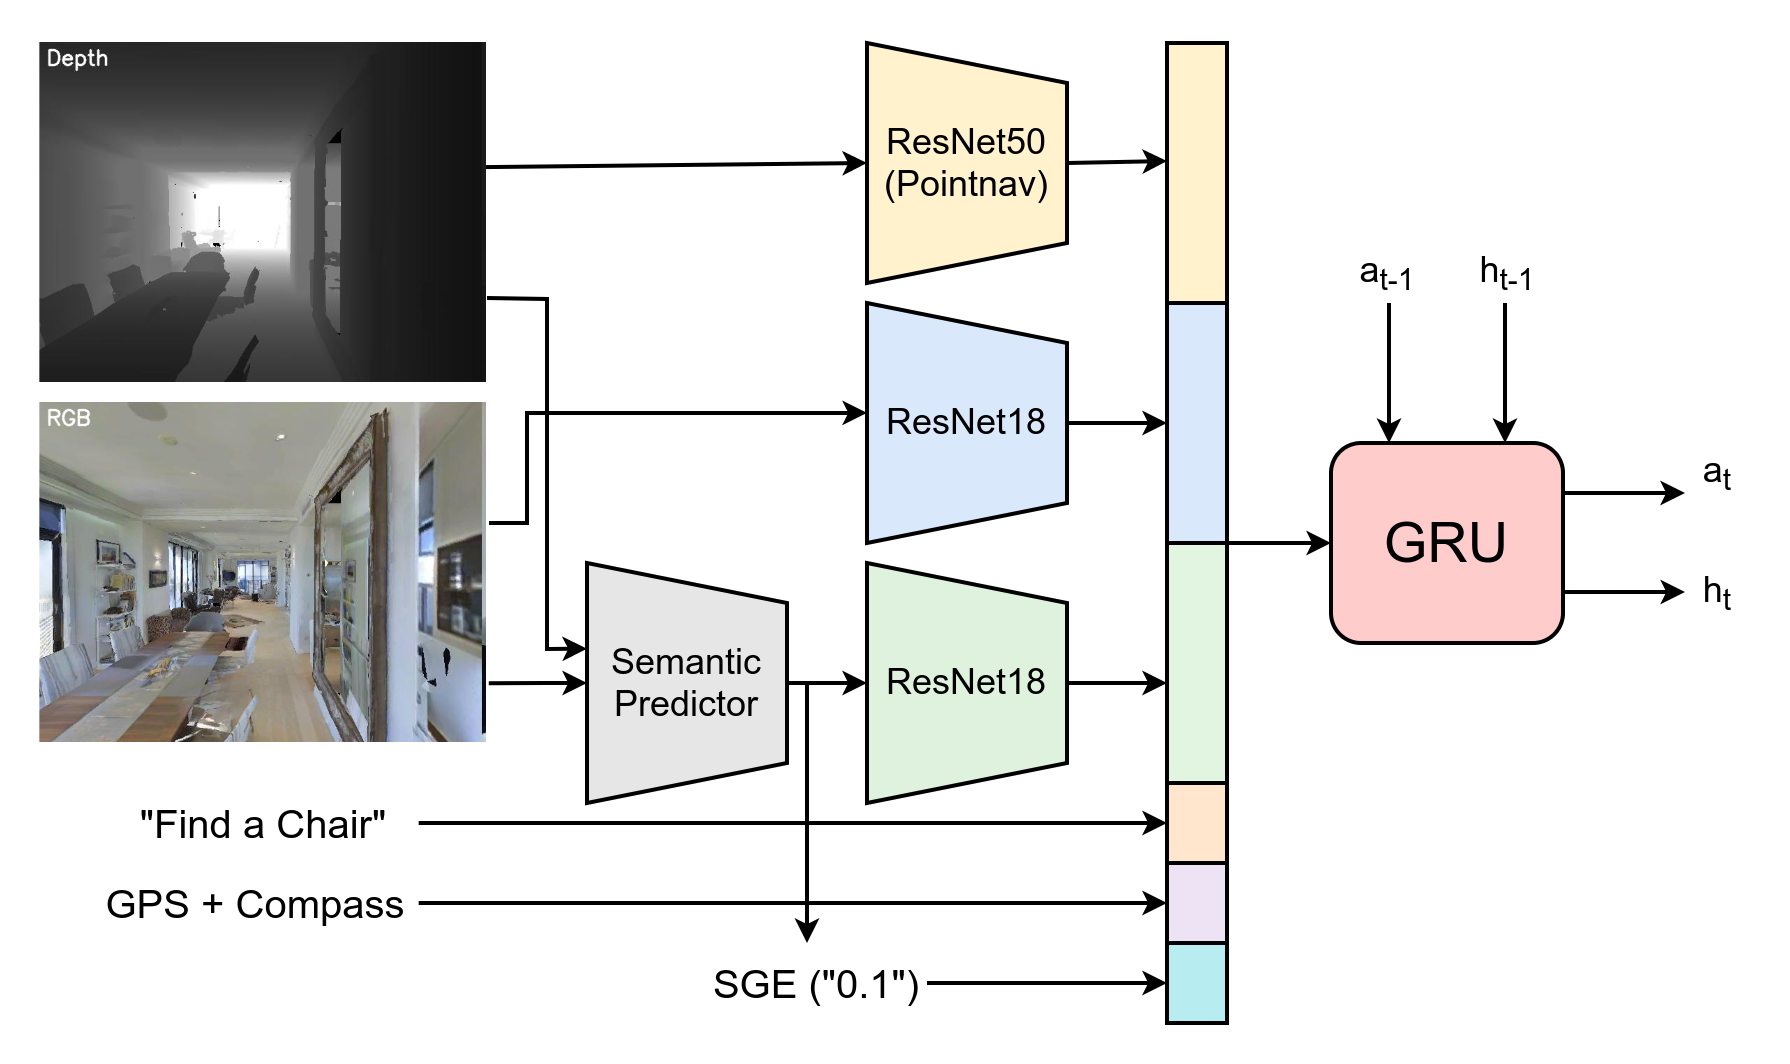
Our base policy is a simple CNN+RNN architecture. We first embed all sensory inputs using feed-forward modules. For RGB, we use a randomly initialized ResNet18 [44]. For depth, we use a ResNet50 that was pretrained on PointGoal navigation using DD-PPO [13]. Then these RGB and depth features (and optionally other task-specific features) are concatenated and fed into a GRU [45] to predict a distribution over actions . Task-specific architectural choices over this base policy are described in the next sections.
5.1 ObjectNav
Fig. 4(a) shows our ObjectNav architecture. Similar to Anand et al. [46], we feed in RGBD inputs of size passed through a 2x2-AvgPool layer to reduce the resolution (performing low-pass filtering + downsampling). The agent also has a GPS+Compass sensor, which provides location and orientation relative to start of the episode. GPS+Compass inputs are pass through fully-connected layers to embed them to -d vectors. In addition to RGBD and GPS+Compass, following Ye et al. [15], we use two additional semantic features – semantic segmentation (SemSeg) of the input RGB and a ‘Semantic Goal Exists’ (SGE) scalar which is the fraction of the visual input occupied by the goal category. These semantic features are computed using a pretrained and frozen RedNet [47] that was pretrained on SUN RGB-D [48] and finetuned on randomly sampled front-facing views rendered in the Habitat simulator. Finally, we also feed in the object goal category embedded into a -d vector. All of these input features are concatenated to form an observation embedding, and fed into a -layer, -d GRU at every timestep. We train this policy for M steps ( epochs on demonstration episodes). We evaluate checkpoints at every M steps for the last M steps of training, and report metrics for checkpoints with the highest success on the validation split.
5.2 Pick&Place
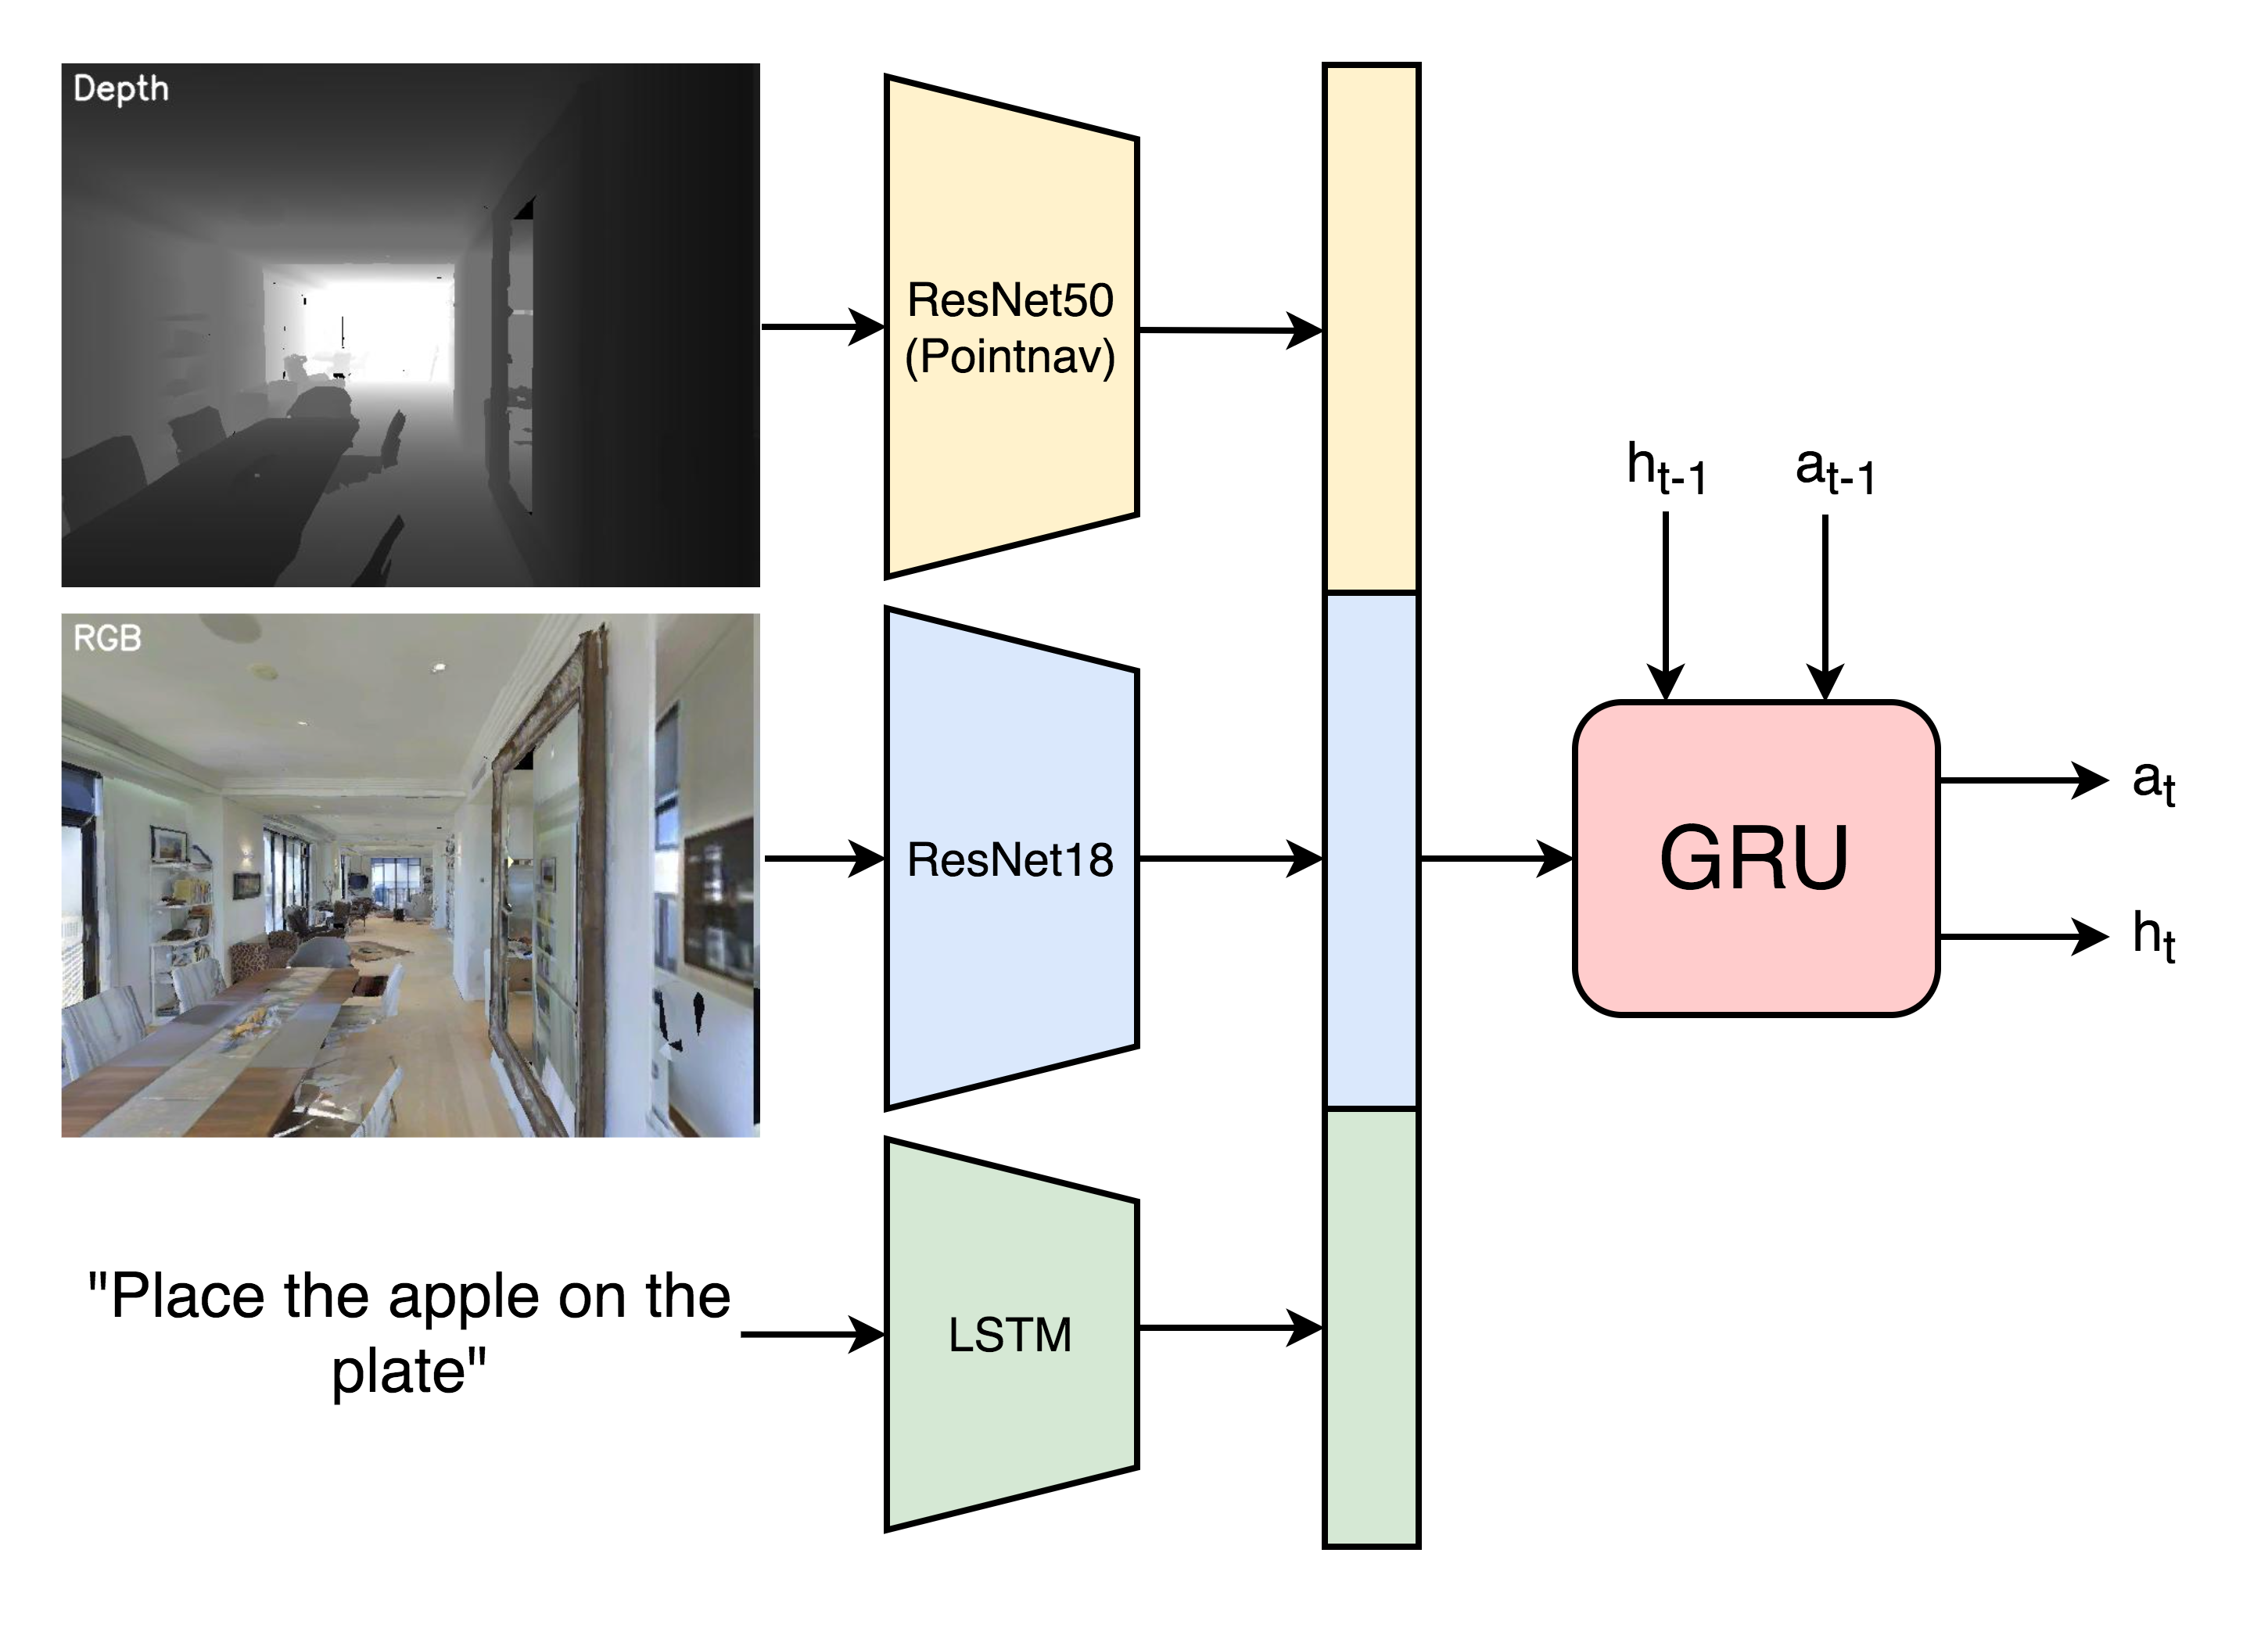
Fig. 4(b) shows our Pick&Place architecture. We feed in RGBD inputs of size . In addition to RGBD observations, the policy gets as input language instructions of the form ‘Place the <object> on the <receptacle>’ encoded using a single-layer LSTM [49]. RGBD and instruction features are concatenated to form an observation embedding, which is fed into a -layer, -d GRU at every timestep. We train this policy for M steps ( epochs on demonstration episodes). We evaluate checkpoints at every M steps during training, and report metrics for checkpoints with the highest success on the validation split.
6 Experiments & Results
6.1 ObjectNav
Table 4c reports results on the MP3D val split for several baselines. First, we compare our approach with two state-of-the-art RL approaches from prior work. Maksymets et al. [16] (row ) train their policy using a reward structure that breaks ObjectNav into two subtasks – exploration and direct navigation to goal object once it is spotted. This agent gets a positive reward for maximizing area coverage until it sees the goal object. It then receives a navigation reward to minimize distance-to-object. This policy achieves success and SPL (row ). [16] then combine this reward structure with Treasure Hunt Data Augmentation (THDA) – inserting arbitrary D target objects in the scene to augment the set of training episodes. With THDA, this achieves success and SPL (row ), worse and better respectively than behavior cloning on human demonstrations (row ). Ye et al. [15] (row ) train their policy with a combination of exploration and distance-based navigation rewards, and their representations with several auxiliary tasks (e.g. inverse dynamics and predicting map coverage). This achieves success and SPL (row ), which is worse on success and worse on SPL than our approach (row ). Khandelwal et al. [43] (row ) train a policy using CLIP [50] as a visual backbone with simple distance-based navigation rewards. This achieves success and SPL (row ), which is worse on success and worse on SPL than our approach (row ). IL on a dataset of shortest paths achieves success and SPL (row ), significantly worse than training on human demonstrations ( success, SPL). Recall that comparison of shortest path demonstrations was done with a subset of ObjectNav-HD demonstrations that were collected in the first phase of the project. Next, we also collected human demonstrations on ObjectNav episodes generated in THDA fashion – i.e. asking humans to find randomly inserted objects. Notice that this involves pure exhaustive search, since there are no semantic priors that humans can leverage in this setting. An IL agent trained on THDA demonstrations combined with the original demonstrations achieves success and SPL (row ) which is better on success and better on SPL than non-THDA demonstrations (row ), i.e. adding these THDA demonstrations with exhaustive search behavior helps. We also collected demonstrations on Gibson[42] ObjectNav episodes to compare effect of different scene datasets. An agent trained on Gibson demonstrations combined with MP3D demonstrations achieves success and SPL (row ), which is worse on success and worse on SPL compared to when we use MP3D-only demonstrations (row ).
Finally, we also benchmark human performance on the MP3D val split – success, SPL (row ).
| Method | Success | SPL |
|---|---|---|
| 18) IL wo/ Vision | ||
| 19) IL wo/ Semantic Input | ||
| 20) IL w/ RGBD + Semantic Input |
ObjectNav Sensor Ablations. Table 1 reports results on the MP3D val split for various ablations of our approach trained on human demonstrations. First, without any visual input (row ), i.e. no RGBD and semantic inputs, the agent fails to learn anything ( success, SPL). Second, without SemSeg and SGE features (and keeping only RGB and Depth features) to the policy, performance drops by success and SPL (row vs. ).
Habitat ObjectNav Challenge Results. Table 2 compares our results with prior approaches from the and Habitat Challenge leaderboards. Our approach (IL w/ demonstrations) achieves success and SPL (row ), outperforming prior RL-trained counterparts – better success, better SPL than Red Rabbit (6-Act Base) [15] (row 5), and better success, better SPL than ExploreTillSeen + THDA [16] (row 7).
| Team / Method | Success | SPL | |
|---|---|---|---|
| 21) | DD-PPO baseline [13, 15] | ||
| 22) | Active Exploration (Pre-explore) | ||
| 23) | SRCB-robot-sudoer | ||
| 24) | SemExp [51] | ||
| 25) | Red Rabbit (6-Act Base) [15] | ||
| 26) | Red Rabbit (6-Act Tether) [15] | ||
| 27) | ExploreTillSeen + THDA [16] | ||
| 28) | IL w/ Human Demos |
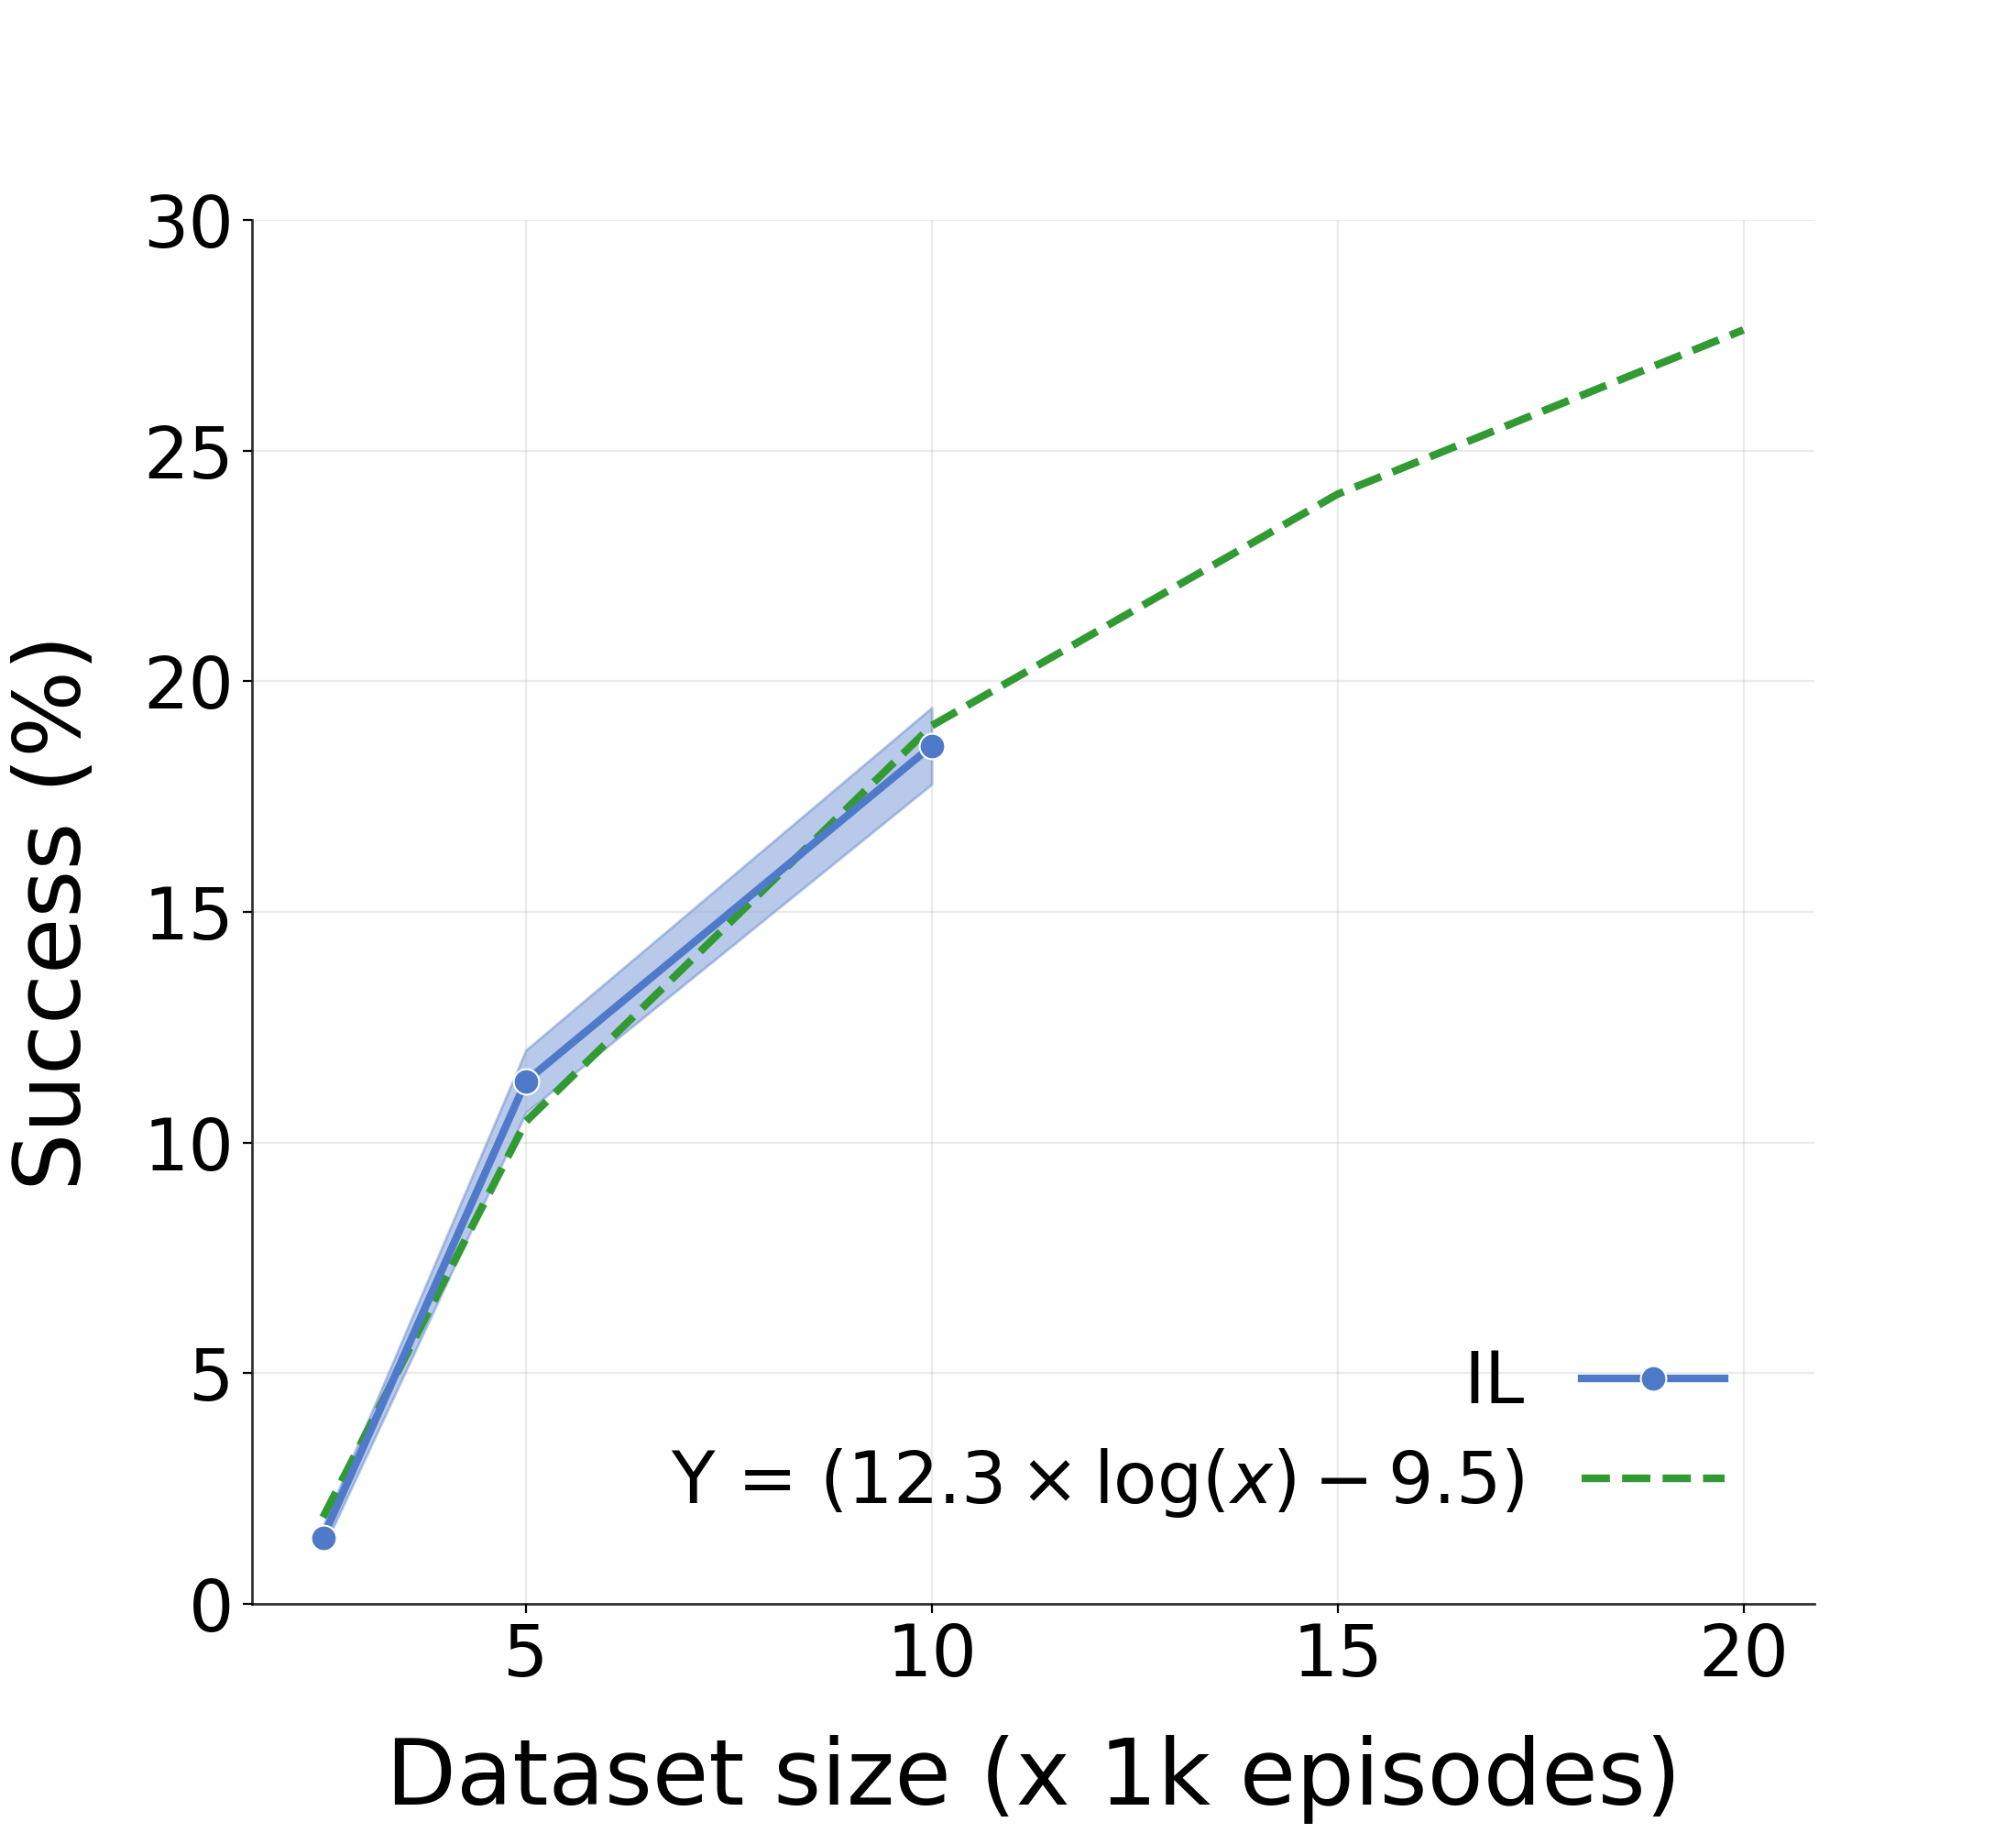
Performance vs. Dataset size. To investigate scaling behavior, we plot val success against the size of the human demonstrations dataset in Fig. 1b. We created splits of the human demonstrations’ dataset of increasing sizes, from to , and trained models with the same set of hyperparameters on each split. All hyperparameters were picked early in the course of the data collection (on the and subsplits) and fixed for later experiments. So val performance in the small-data regime may be an optimistic estimate and in the large data regime a pessimistic estimate. True scaling behavior may be even stronger. Increasing dataset size consistently improves performance and has not yet saturated, suggesting that simply collecting more demonstrations is likely to lead to further gains.
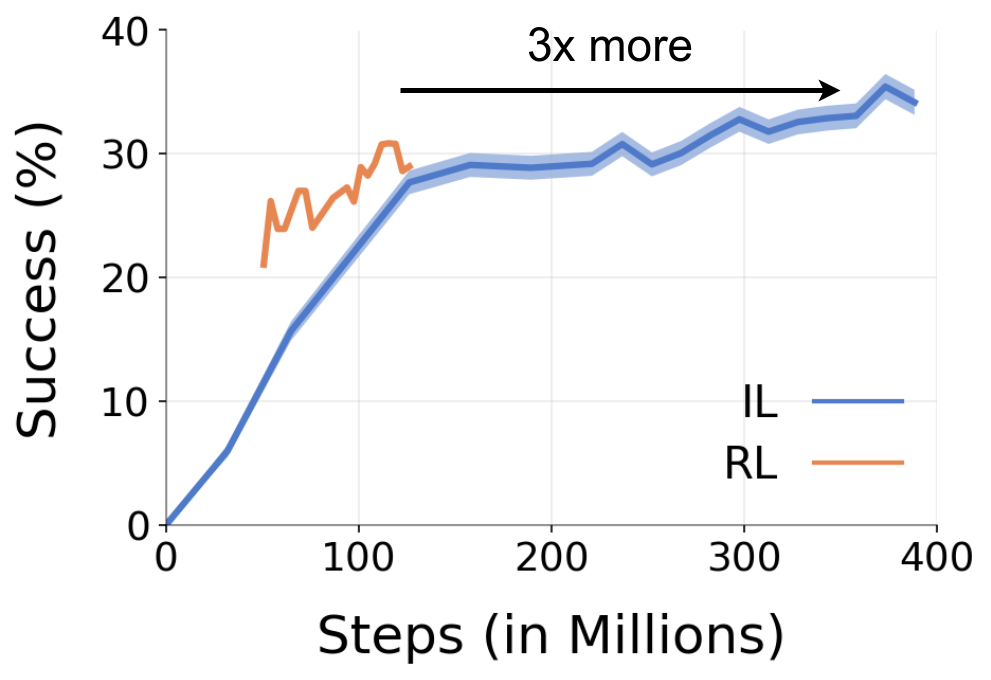
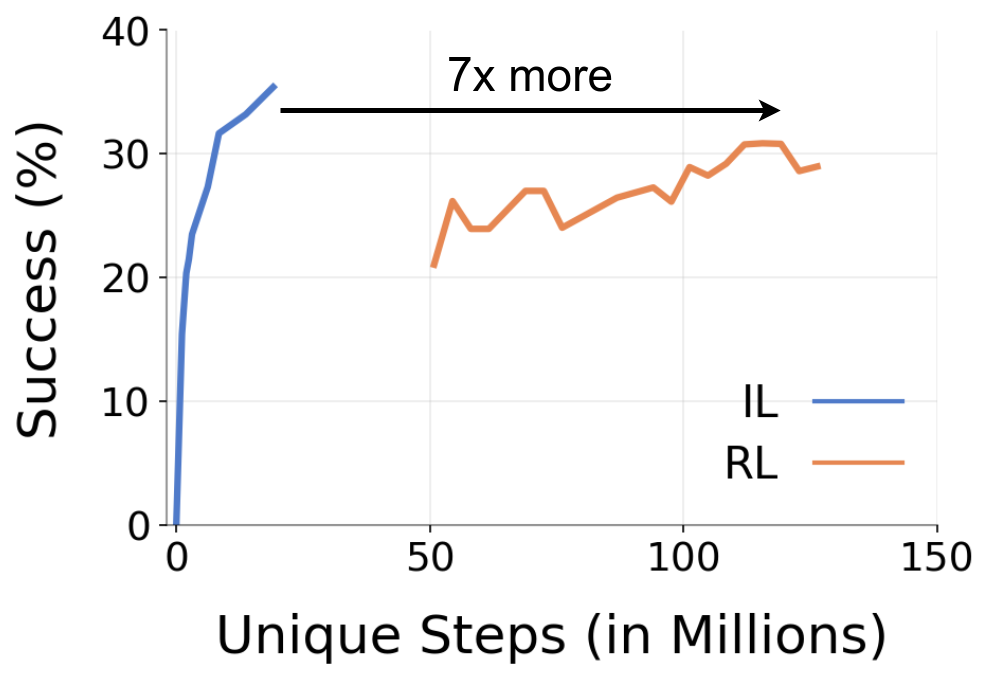
Sample Efficiency. Fig. 5 plots val success against no. of training steps of experience (in millions) in Fig. 5(a) and against unique steps of experience in Fig. 5(b). Recall that IL involves epochs on a static dataset of demos, while RL (from [15]) gathers unique agent-driven trajectories on-the-fly. Fig. 5(a) shows that IL behaves like supervised learning (as expected) with improvements coming from long training schedules; unfortunately, this means that wall-clock training times are not lower than RL. Fig. 5(b) shows that IL requires x fewer unique steps of experience to outperform success and is thus much more sample-efficient.
6.2 Pick&Place
| val | test | ||||||
|---|---|---|---|---|---|---|---|
| Method | Success | SPL | Success | SPL | |||
| New Inits. | |||||||
| 29) | IL w/ Shortest Paths | ||||||
| 30) | IL w/ Human Demos | ||||||
| 31) | Humans | ||||||
| \hdashline New Instr. | |||||||
| 32) | IL w/ Shortest Paths | ||||||
| 33) | IL w/ Human Demos | ||||||
| 34) | Humans | ||||||
| \hdashline New Envs | |||||||
| 35) | IL w/ Shortest Paths | ||||||
| 36) | IL w/ Human Demos | ||||||
| 37) | Humans | ||||||
| Method | OC (%) | SC (%) | GRTS (%) | Peeks (%) | PT (%) | Beeline (%) | ES (%) | |
|---|---|---|---|---|---|---|---|---|
| 38) | IL w/ shortest paths | |||||||
| 39) | IL w/ human demos | |||||||
| 40) | RL [15] | |||||||
| 41) | Humans | - |
Results. We report results in Table 3 across three evaluation splits. 1) New Initializations: new locations of objects and receptacles. This tests generalization to unseen locations in seen environments. 2) New Instructions: compositionally novel object-receptacle combinations of objects and receptacles individually seen during training. 3) New Environments: generalization to scenes held out from training. Similar to ObjectNav and as described in Section 4, we also report results with shortest paths. Again, these paths are significantly shorter (average vs. steps per demonstration) and hence, we generate a larger dataset of episodes roughly matching the cumulative steps of experience with human demonstrations ( shortest path steps vs. human steps). Training on human demonstrations achieves success, SPL on new object-receptacle initializations (row ). Across splits, training on shortest paths hurts success by -. Going to new object-receptacle pairs, success drops by (row vs. ), and then going to new environments further hurts success by (row vs. ). We also trained an RL policy with the exploration and distance-based rewards from [16], but it failed to get beyond success on new object-receptacle intializations. See the appendix (Sec. A.1.2) for training details.
Performance vs. Dataset size. Similar to ObjectNav, we trained policies on to subsets of our Pick&Place data, and found that performance continues to improve with more data. Figure in appendix (Sec. A.1.3).
7 Characterizing Learned Behaviors
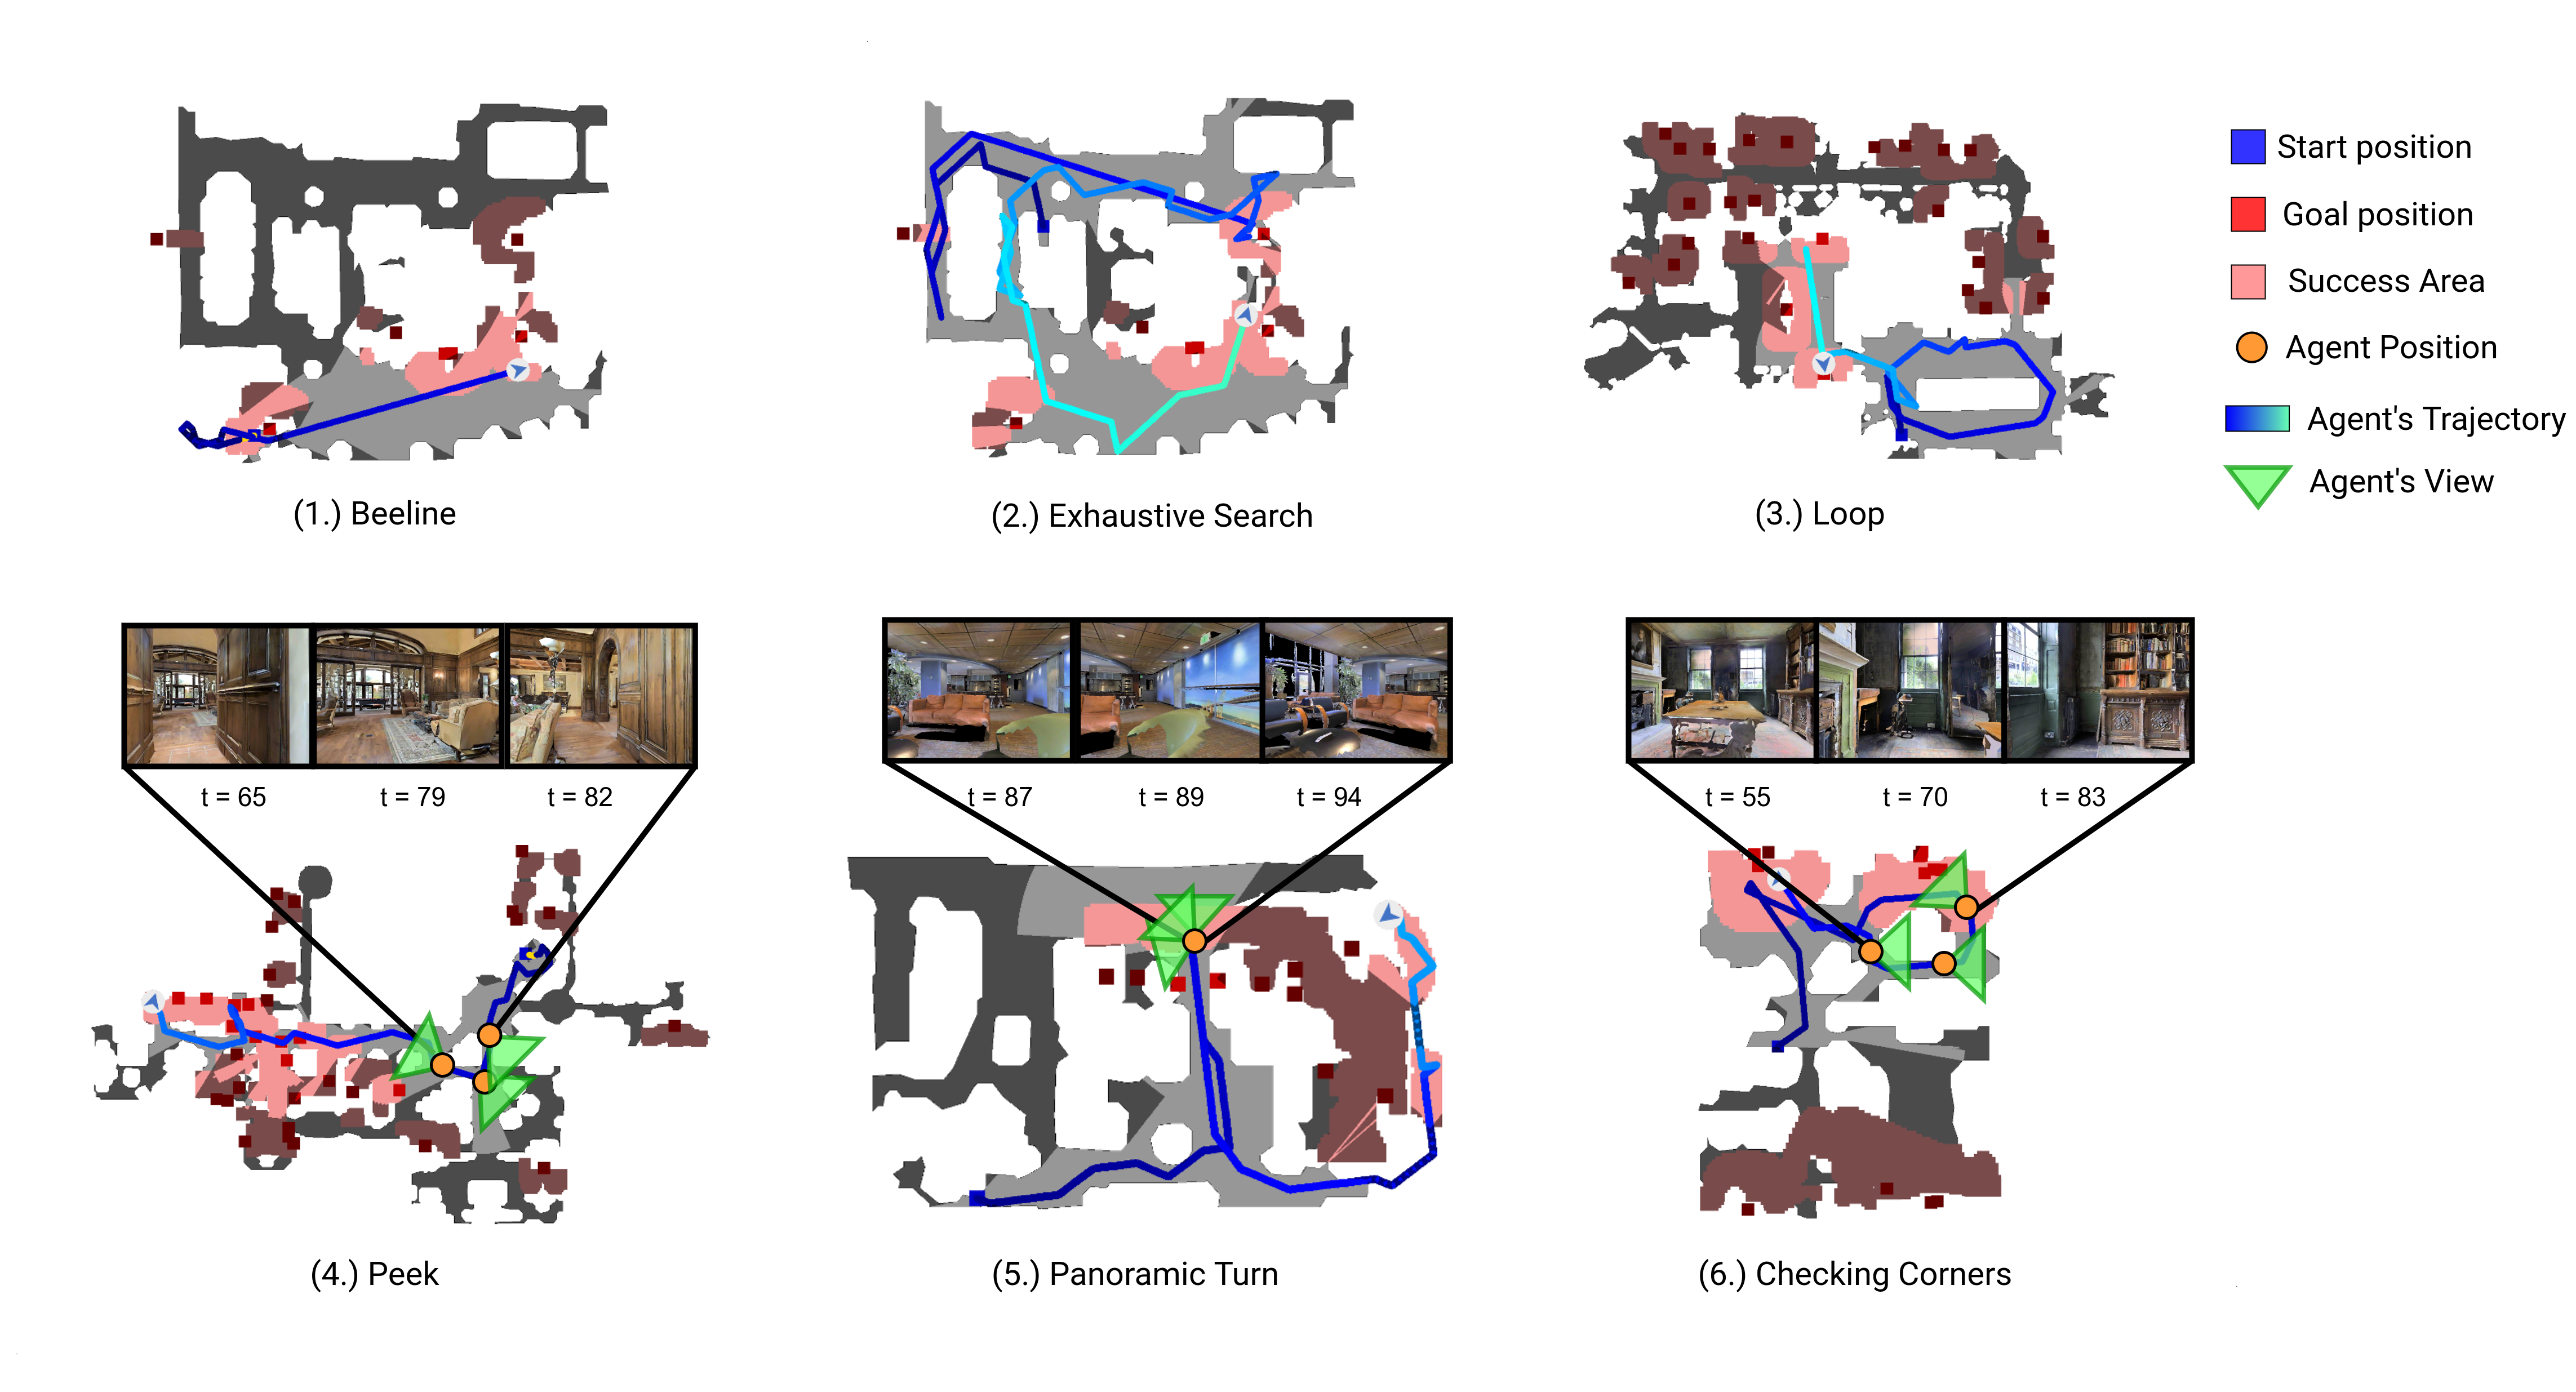
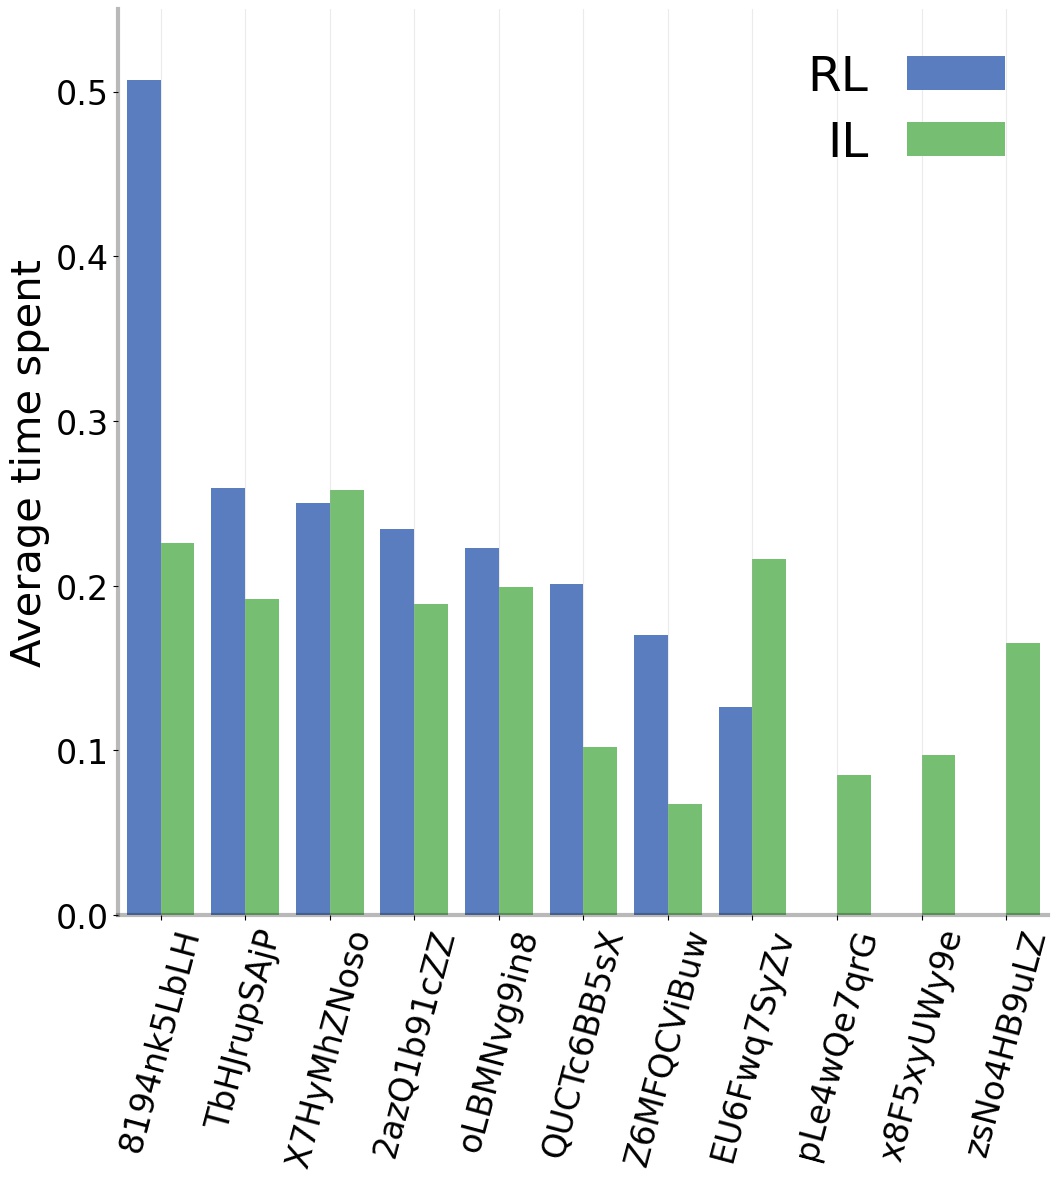
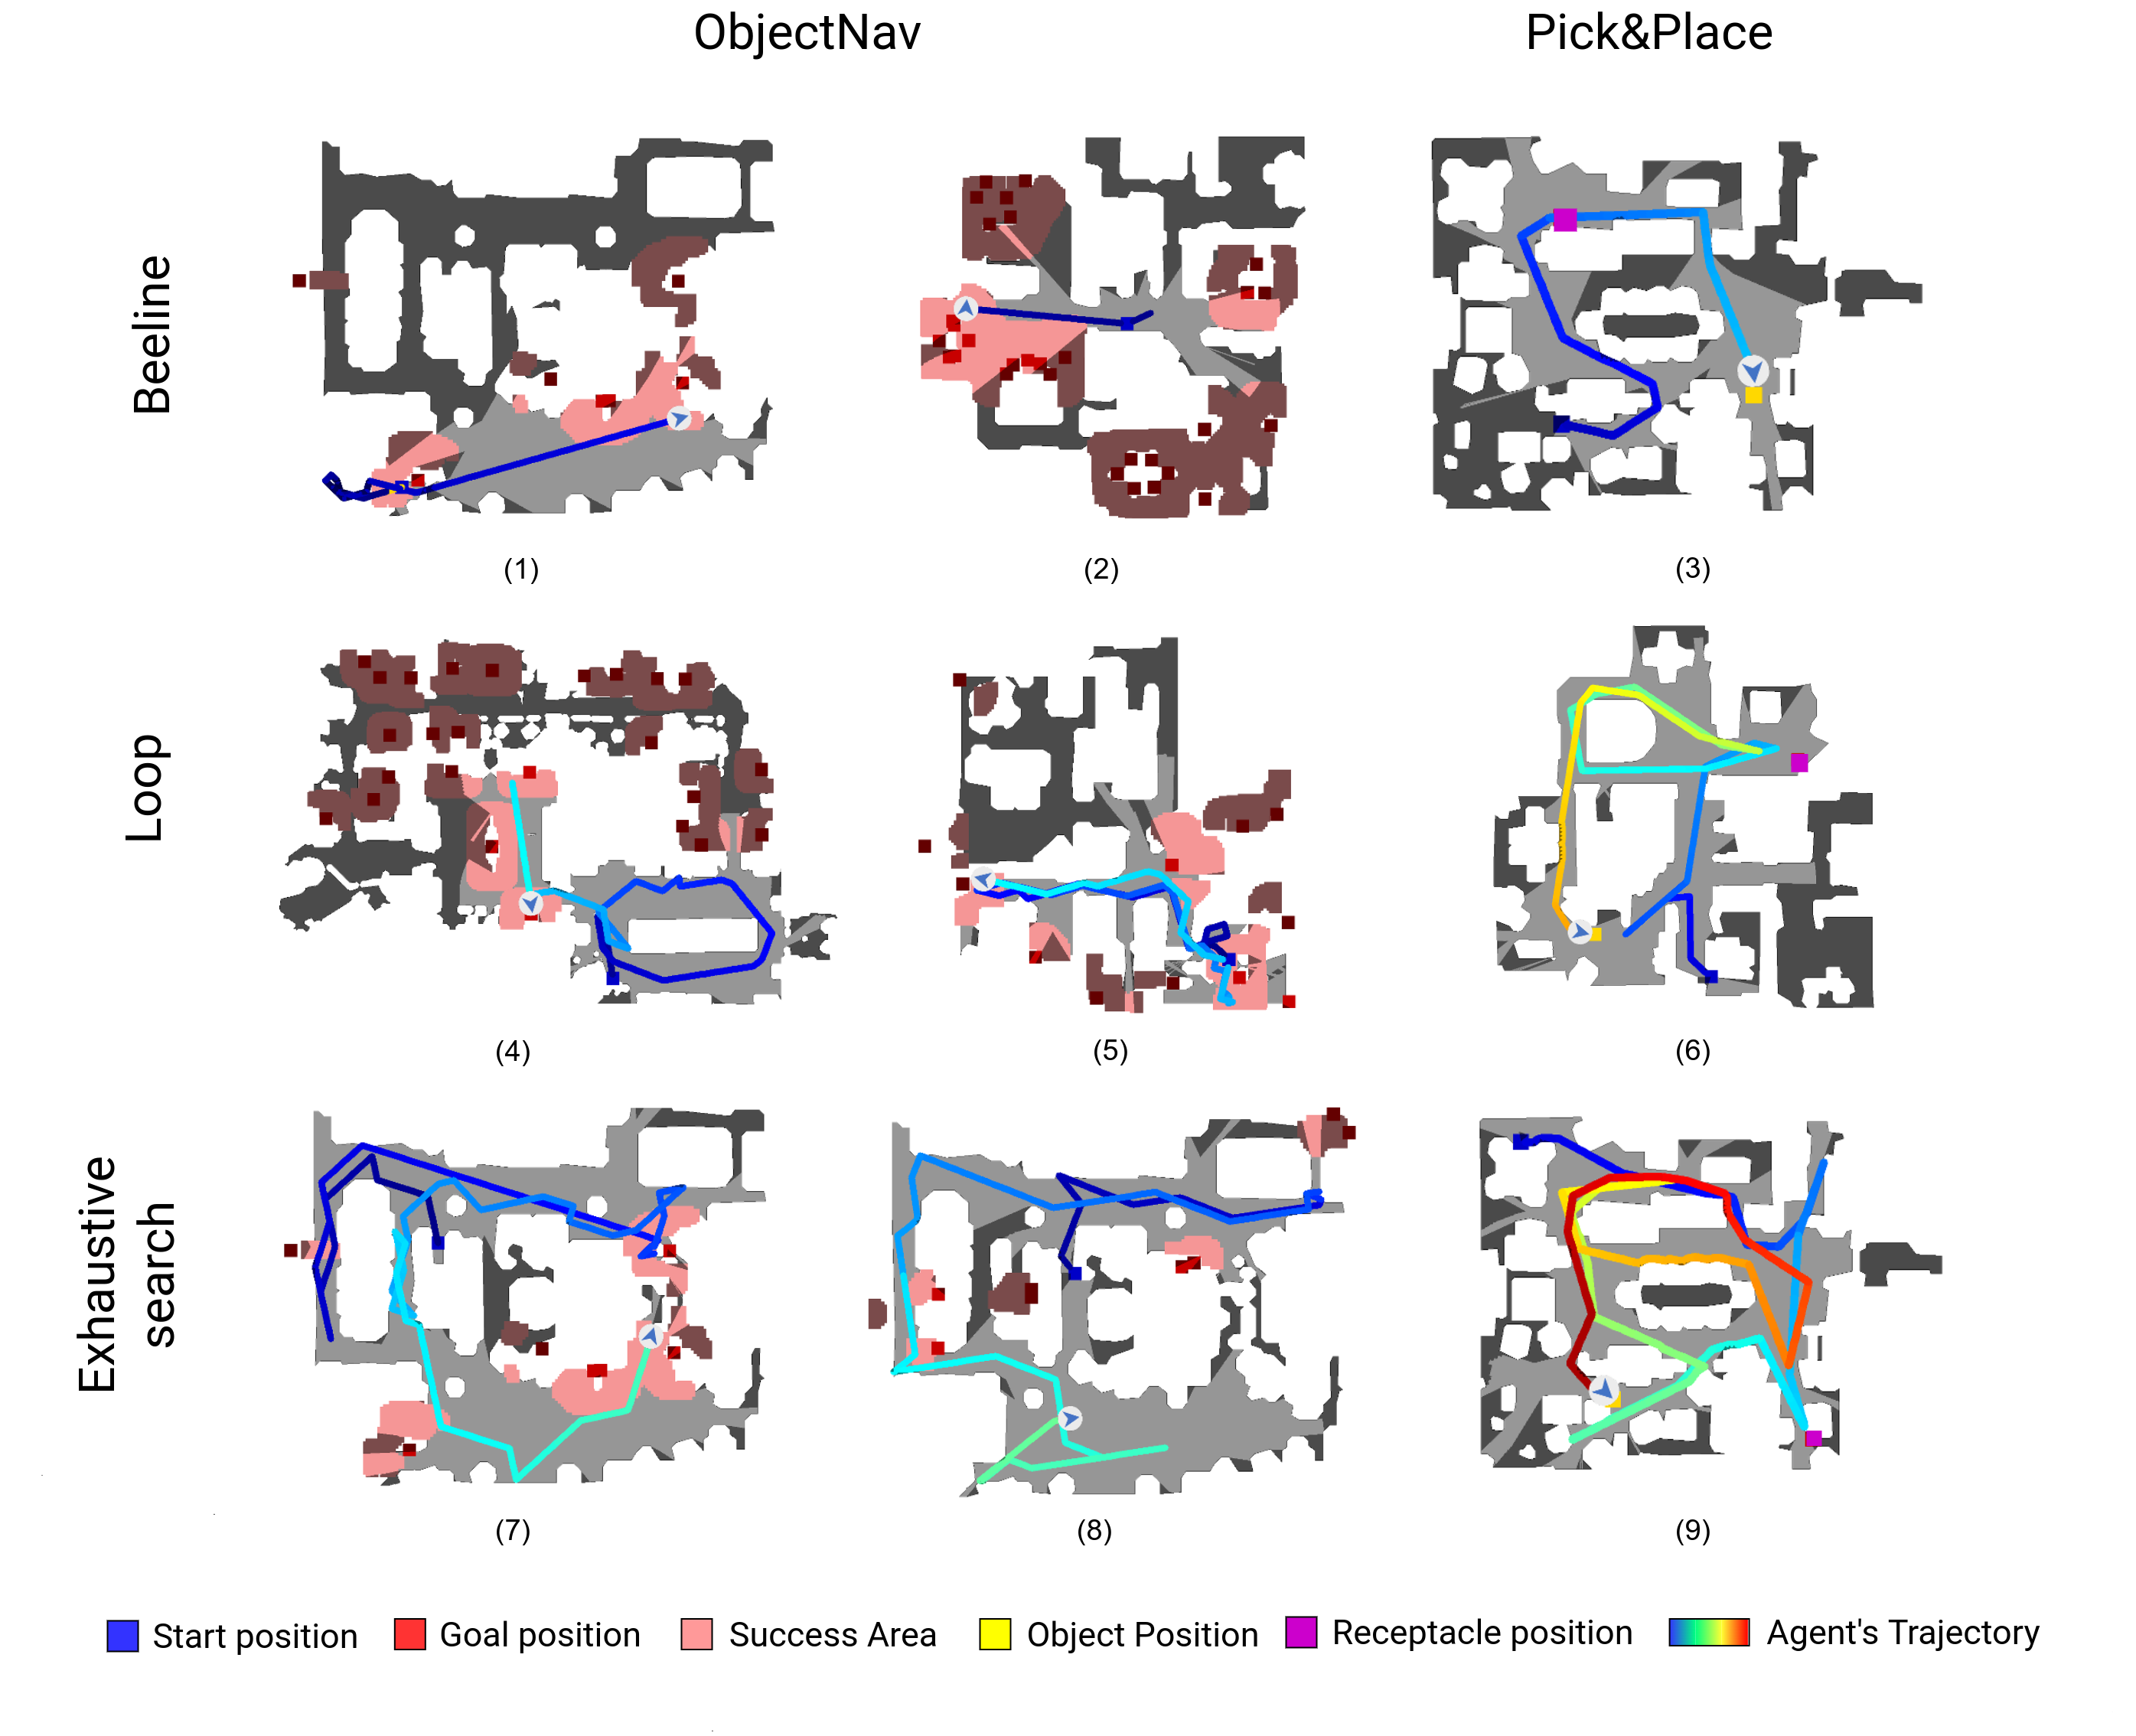
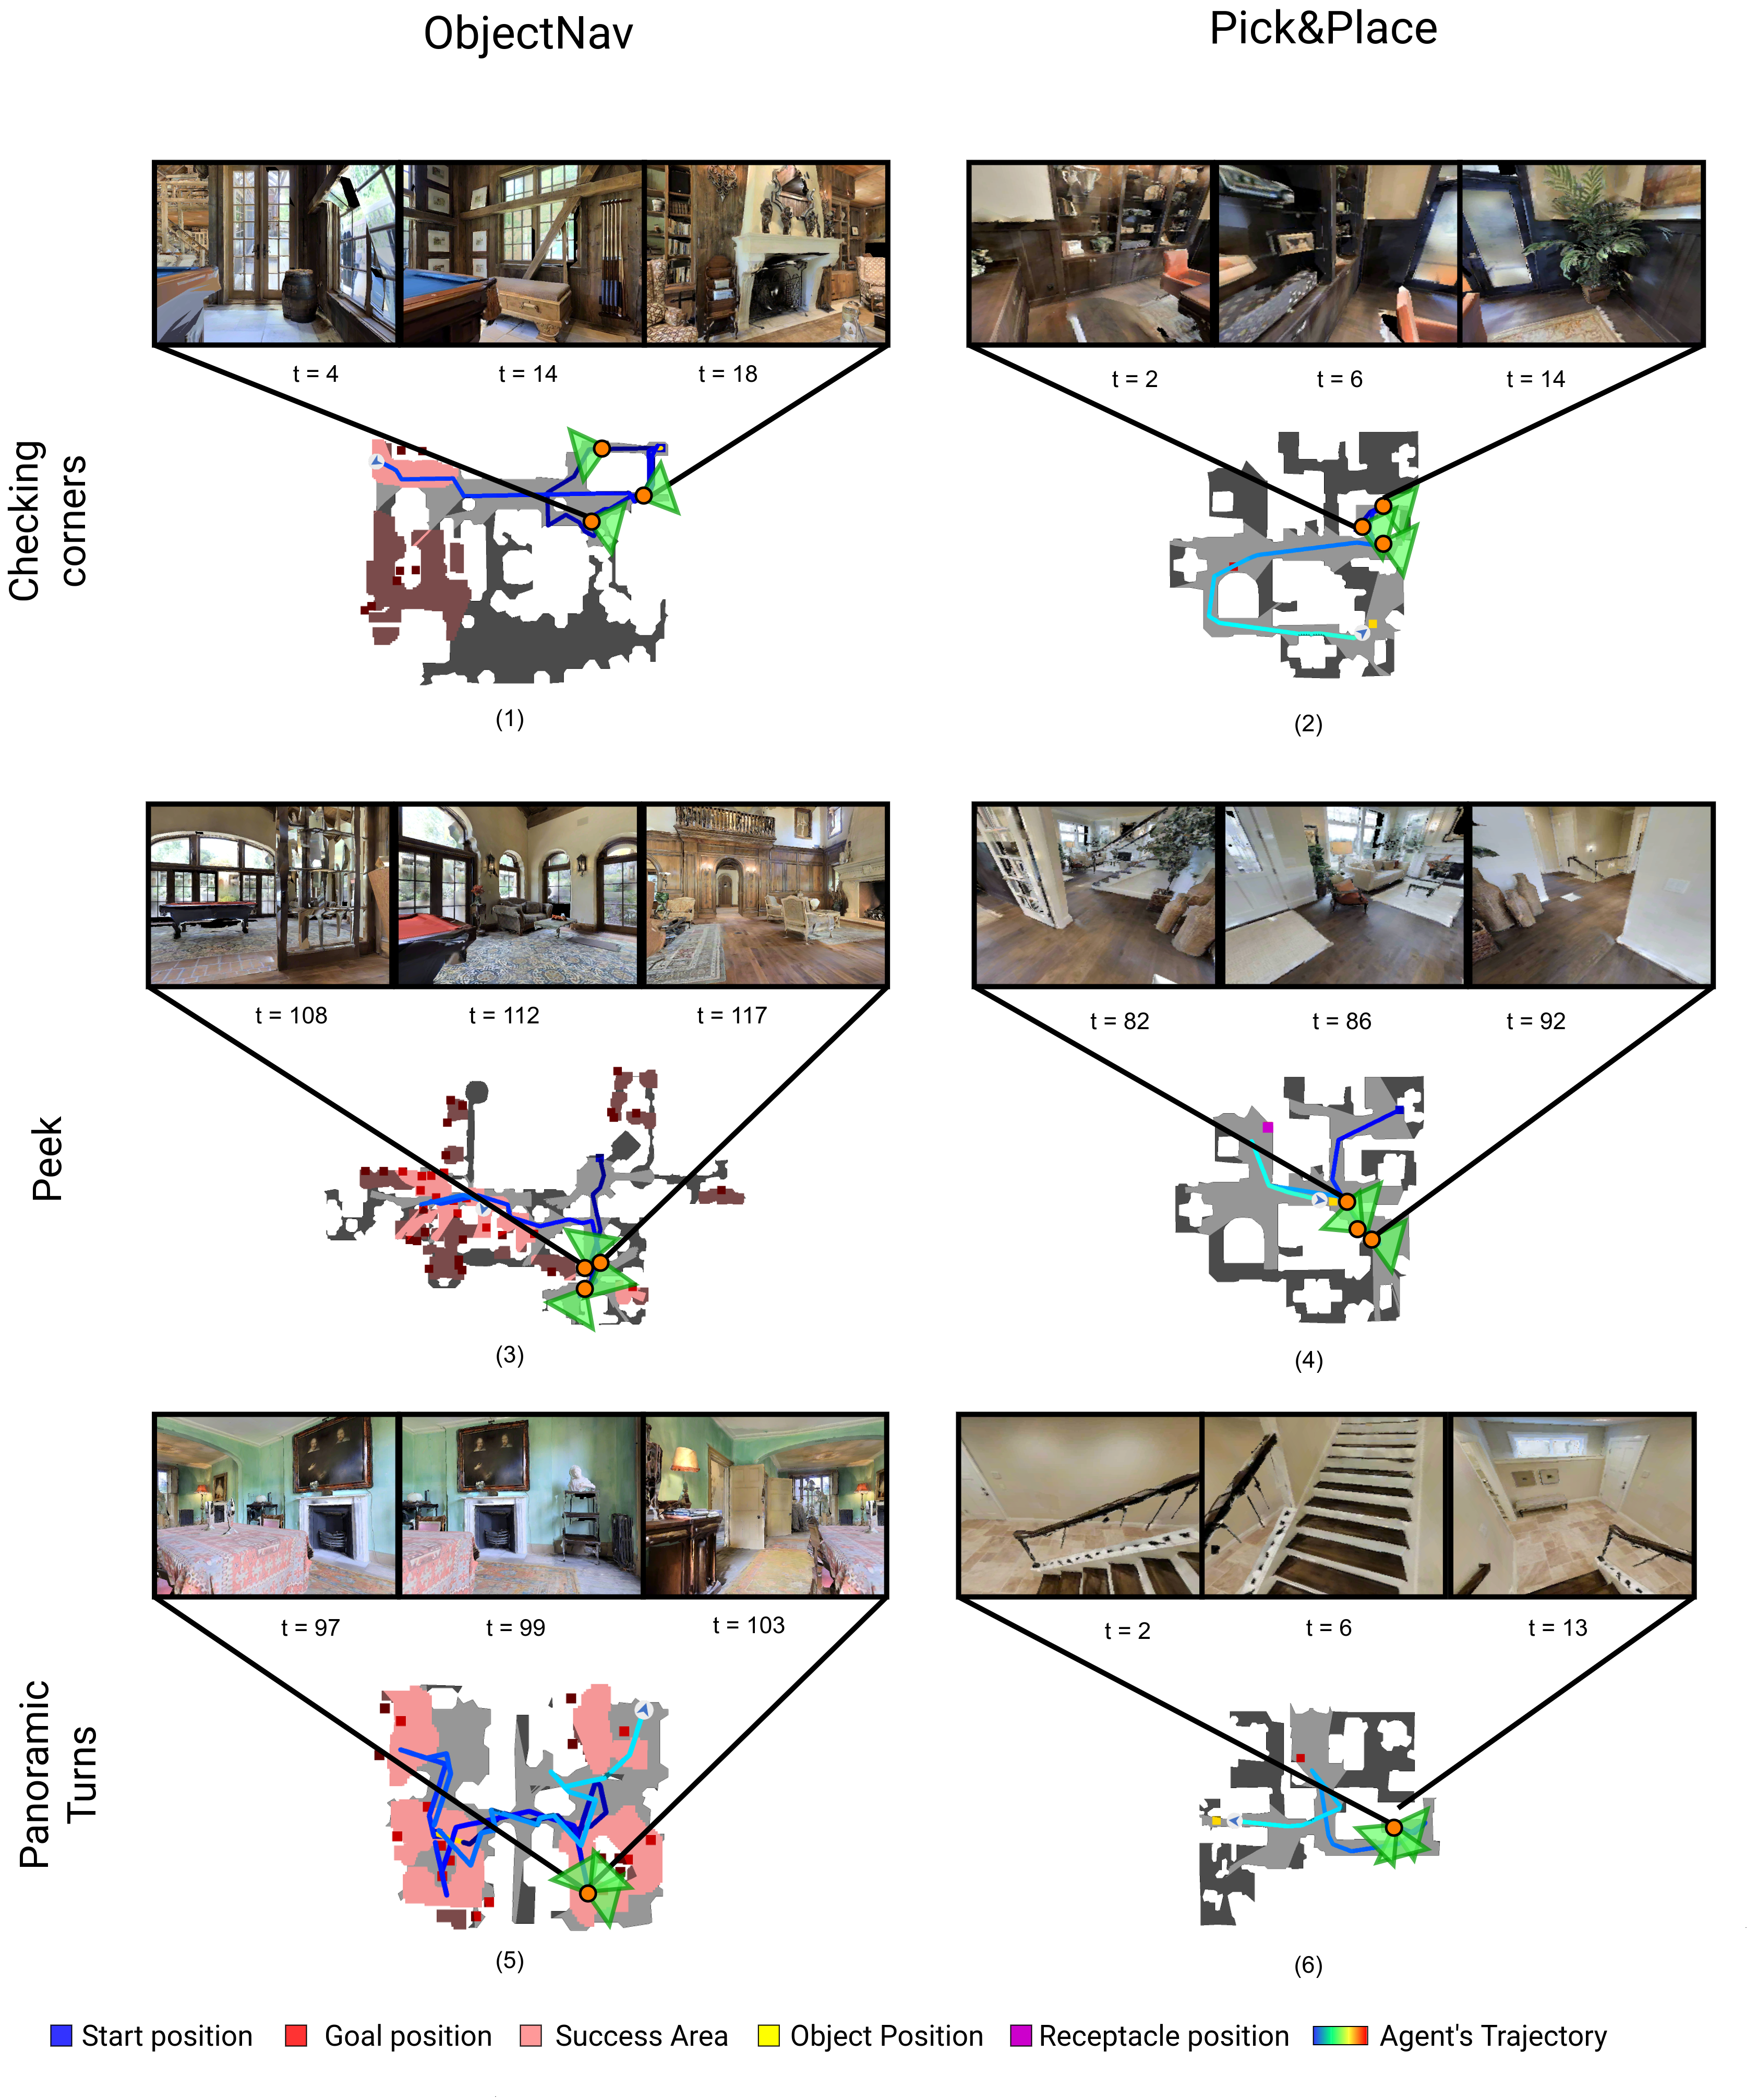
To characterize the behaviors learnt by our best IL agents, we first sample validation ObjectNav episodes for each method and manually categorize the behavior observed. A subset of observed behaviors are visualized in Fig. 6. Our agents demonstrate sophisticated object-search behaviors e.g. peeking into rooms to maximize sight coverage (SC), instead of occupancy coverage (OC), checking corners of rooms for small objects, beelining to goal object once seen, exhaustive search (ES), turning in place to get a panoramic view (PT), and looping back to recheck some areas. Amusingly, unlike shortest path / RL agents, these IL agents also stand idle and ‘look around’ i.e. turn in place, like humans. Table 4 quantifies these behaviors. See appendix (Sec. A.4) for details on how these were computed. Agents trained with IL on human demonstrations have higher coverage (both occupancy and sight), peeking behavior, panoramic turns, beelines, and exhaustive search than RL. RL-trained agents achieve higher average Goal Room Time Spent (GRTS) – i.e. time spent in the room containing the target object – but also have significantly higher variance in GRTS across scenes compared to IL agents. See appendix (Sec. A.4) for a per-scene breakdown of GRTS as well as histograms of time spent in each room (instead of just target room) when searching for a target object. We also discuss limitations of our approach in the appendix Sec. A.7.
8 Conclusion
We developed the infrastructure to collect human demonstrations at scale and using this, trained imitation learning (IL) agents on human demonstrations for ObjectNav and Pick&Place. On ObjectNav, we found that IL using human demonstrations outperforms RL using agent-gathered trajectories, and on Pick&Place, IL agents get to success while RL fails to get beyond . Qualitatively, we found that IL agents pick up on sophisticated object-search behavior implicitly captured in human demonstrations, much more prominently than RL agents. Overall, we believe our work makes a compelling case for investing in large-scale imitation learning of human demonstrations.
Acknowledgements. We thank Devi Parikh for help with brainstorming and direction, Joel Ye for answering questions about his Red Rabbit [15], Oleksandr Maksymets for the THDA [16] episode generation pipeline, and Erik Wijmans for help with debugging DDP. The Georgia Tech effort was supported in part by NSF, ONR YIP, and ARO PECASE. The views and conclusions contained herein are those of the authors and should not be interpreted as necessarily representing the official policies or endorsements, either expressed or implied, of the U.S. Government, or any sponsor.
References
- [1] M. Savva, A. X. Chang, A. Dosovitskiy, T. Funkhouser, and V. Koltun, “MINOS: Multimodal indoor simulator for navigation in complex environments,” arXiv preprint arXiv:1712.03931, 2017.
- [2] P. Anderson, A. X. Chang, D. S. Chaplot, A. Dosovitskiy, S. Gupta, V. Koltun, J. Kosecka, J. Malik, R. Mottaghi, M. Savva, and A. R. Zamir, “On evaluation of embodied navigation agents,” arXiv preprint arXiv:1807.06757, 2018.
- [3] D. Batra, A. X. Chang, S. Chernova, A. J. Davison, J. Deng, V. Koltun, S. Levine, J. Malik, I. Mordatch, R. Mottaghi, M. Savva, and H. Su, “Rearrangement: A Challenge for Embodied AI,” arXiv preprint arXiv:2011.01975, 2020.
- [4] L. Weihs, M. Deitke, A. Kembhavi, and R. Mottaghi, “Visual room rearrangement,” in CVPR, 2021.
- [5] P. Anderson, Q. Wu, D. Teney, J. Bruce, M. Johnson, N. Sünderhauf, I. Reid, S. Gould, and A. van den Hengel, “Vision-and-language navigation: Interpreting visually-grounded navigation instructions in real environments,” in CVPR, 2018.
- [6] J. Krantz, E. Wijmans, A. Majumdar, D. Batra, and S. Lee, “Beyond the nav-graph: Vision-and-language navigation in continuous environments,” in ECCV, 2020.
- [7] M. Shridhar, J. Thomason, D. Gordon, Y. Bisk, W. Han, R. Mottaghi, L. Zettlemoyer, and D. Fox, “ALFRED: A Benchmark for Interpreting Grounded Instructions for Everyday Tasks,” in CVPR, 2020.
- [8] A. Das, S. Datta, G. Gkioxari, S. Lee, D. Parikh, and D. Batra, “Embodied Question Answering,” in CVPR, 2018.
- [9] E. Wijmans, S. Datta, O. Maksymets, A. Das, G. Gkioxari, S. Lee, I. Essa, D. Parikh, and D. Batra, “Embodied Question Answering in Photorealistic Environments with Point Cloud Perception,” in CVPR, 2019.
- [10] A. Das, F. Carnevale, H. Merzic, L. Rimell, R. Schneider, J. Abramson, A. Hung, A. Ahuja, S. Clark, G. Wayne, and F. Hill, “Probing emergent semantics in predictive agents via question answering,” in ICML, 2020.
- [11] A. Das, Building agents that can see, talk, and act. PhD thesis, Georgia Institute of Technology, 2020.
- [12] L. Yu, X. Chen, G. Gkioxari, M. Bansal, T. L. Berg, and D. Batra, “Multi-target embodied question answering,” in CVPR, 2019.
- [13] E. Wijmans, A. Kadian, A. Morcos, S. Lee, I. Essa, D. Parikh, M. Savva, and D. Batra, “DD-PPO: Learning near-perfect pointgoal navigators from 2.5 billion frames,” in ICLR, 2020.
- [14] J. Ye, D. Batra, E. Wijmans, and A. Das, “Auxiliary tasks speed up learning pointgoal navigation,” in CoRL, 2020.
- [15] J. Ye, D. Batra, A. Das, and E. Wijmans, “Auxiliary Tasks and Exploration Enable ObjectNav,” in ICCV, 2021.
- [16] O. Maksymets, V. Cartillier, A. Gokaslan, E. Wijmans, W. Galuba, S. Lee, and D. Batra, “THDA: Treasure Hunt Data Augmentation for Semantic Navigation,” in ICCV, 2021.
- [17] D. S. Chaplot, D. Gandhi, A. Gupta, and R. Salakhutdinov, “Object goal navigation using goal-oriented semantic exploration,” in NeurIPS, 2020.
- [18] S. Schaal, “Learning from demonstration,” in NIPS, 1996.
- [19] M. Savva, A. Kadian, O. Maksymets, Y. Zhao, E. Wijmans, B. Jain, J. Straub, J. Liu, V. Koltun, J. Malik, et al., “Habitat: A platform for embodied AI research,” in ICCV, 2019.
- [20] A. Szot, A. Clegg, E. Undersander, E. Wijmans, Y. Zhao, J. Turner, N. Maestre, M. Mukadam, D. S. Chaplot, O. Maksymets, A. Gokaslan, V. Vondrus, S. Dharur, F. Meier, W. Galuba, A. Chang, Z. Kira, V. Koltun, J. Malik, M. Savva, and D. Batra, “Habitat 2.0: Training home assistants to rearrange their habitat,” in NeurIPS, 2021.
- [21] Y. Zhu, R. Mottaghi, E. Kolve, J. J. Lim, A. Gupta, L. Fei-Fei, and A. Farhadi, “Target-driven visual navigation in indoor scenes using deep reinforcement learning,” in ICRA, 2017.
- [22] S. Wani, S. Patel, U. Jain, A. X. Chang, and M. Savva, “MultiON: Benchmarking Semantic Map Memory using Multi-Object Navigation,” in NeurIPS, 2020.
- [23] A. Padmakumar, J. Thomason, A. Shrivastava, P. Lange, A. Narayan-Chen, S. Gella, R. Piramuthu, G. Tur, and D. Hakkani-Tur, “TEACh: Task-driven Embodied Agents that Chat,” arXiv preprint arXiv:2110.00534, 2021.
- [24] J. Thomason, M. Murray, M. Cakmak, and L. Zettlemoyer, “Vision-and-dialog navigation,” in CoRL, 2020.
- [25] M. Hahn, J. Krantz, D. Batra, D. Parikh, J. M. Rehg, S. Lee, and P. Anderson, “Where are you? localization from embodied dialog,” arXiv preprint arXiv:2011.08277, 2020.
- [26] A. Mandlekar, D. Xu, J. Wong, S. Nasiriany, C. Wang, R. Kulkarni, L. Fei-Fei, S. Savarese, Y. Zhu, and R. Martín-Martín, “What matters in learning from offline human demonstrations for robot manipulation,” in CoRL, 2021.
- [27] F. Ebert, Y. Yang, K. Schmeckpeper, B. Bucher, G. Georgakis, K. Daniilidis, C. Finn, and S. Levine, “Bridge data: Boosting generalization of robotic skills with cross-domain datasets,” arXiv preprint arXiv:2109.13396, 2021.
- [28] J. Krantz, A. Gokaslan, D. Batra, S. Lee, and O. Maksymets, “Waypoint models for instruction-guided navigation in continuous environments,” in ICCV, 2021.
- [29] D. Gordon, A. Kembhavi, M. Rastegari, J. Redmon, D. Fox, and A. Farhadi, “IQA: Visual Question Answering in Interactive Environments,” in CVPR, 2018.
- [30] J. Abramson, A. Ahuja, I. Barr, A. Brussee, F. Carnevale, M. Cassin, R. Chhaparia, S. Clark, B. Damoc, A. Dudzik, et al., “Imitating interactive intelligence,” arXiv preprint arXiv:2012.05672, 2020.
- [31] A. Chang, A. Dai, T. Funkhouser, M. Halber, M. Niessner, M. Savva, S. Song, A. Zeng, and Y. Zhang, “Matterport3D: Learning from RGB-D Data in Indoor Environments,” in 3DV, 2017. MatterPort3D dataset license: http://kaldir.vc.in.tum.de/matterport/MP_TOS.pdf.
- [32] J. Schmidhuber, “A possibility for implementing curiosity and boredom in model-building neural controllers,” in Proc. of the international conference on simulation of adaptive behavior: From animals to animats, 1991.
- [33] B. C. Stadie, S. Levine, and P. Abbeel, “Incentivizing exploration in reinforcement learning with deep predictive models,” arXiv preprint arXiv:1507.00814, 2015.
- [34] D. Pathak, P. Agrawal, A. A. Efros, and T. Darrell, “Curiosity-driven exploration by self-supervised prediction,” in ICML, 2017.
- [35] Y. Burda, H. Edwards, D. Pathak, A. Storkey, T. Darrell, and A. A. Efros, “Large-scale study of curiosity-driven learning,” arXiv preprint arXiv:1808.04355, 2018.
- [36] M. Bellemare, S. Srinivasan, G. Ostrovski, T. Schaul, D. Saxton, and R. Munos, “Unifying count-based exploration and intrinsic motivation,” in NeurIPS, 2016.
- [37] H. Tang, R. Houthooft, D. Foote, A. Stooke, X. Chen, Y. Duan, J. Schulman, F. De Turck, and P. Abbeel, “# exploration: A study of count-based exploration for deep reinforcement learning,” in NeurIPS, 2017.
- [38] S. K. Ramakrishnan, D. Jayaraman, and K. Grauman, “An exploration of embodied visual exploration,” arXiv preprint arXiv:2001.02192, 2020.
- [39] T. Chen, S. Gupta, and A. Gupta, “Learning exploration policies for navigation,” in ICLR, 2019.
- [40] B. Newman, K. Carlberg, and R. Desai, “Optimal assistance for object-rearrangement tasks in augmented reality,” arXiv preprint arXiv:2010.07358, 2020.
- [41] D. Batra, A. Gokaslan, A. Kembhavi, O. Maksymets, R. Mottaghi, M. Savva, A. Toshev, and E. Wijmans, “Objectnav revisited: On evaluation of embodied agents navigating to objects,” arXiv preprint arXiv:2006.13171, 2020.
- [42] F. Xia, A. R. Zamir, Z. He, A. Sax, J. Malik, and S. Savarese, “Gibson env: Real-world perception for embodied agents,” in CVPR, 2018. Gibson dataset license agreement available at storage.googleapis.com/gibson_material/Agreement GDS 06-04-18.pdf.
- [43] A. Khandelwal, L. Weihs, R. Mottaghi, and A. Kembhavi, ‘‘Simple but Effective: CLIP Embeddings for Embodied AI,’’ in CVPR, 2022.
- [44] K. He, X. Zhang, S. Ren, and J. Sun, ‘‘Deep Residual Learning for Image Recognition,’’ in CVPR, 2016.
- [45] K. Cho, B. Van Merriënboer, C. Gulcehre, D. Bahdanau, F. Bougares, H. Schwenk, and Y. Bengio, ‘‘Learning phrase representations using rnn encoder-decoder for statistical machine translation,’’ in EMNLP, 2014.
- [46] A. Anand, E. Belilovsky, K. Kastner, H. Larochelle, and A. Courville, ‘‘Blindfold baselines for embodied qa,’’ arXiv preprint arXiv:1811.05013, 2018.
- [47] J. Jiang, L. Zheng, F. Luo, and Z. Zhang, ‘‘RedNet: Residual Encoder-Decoder Network for indoor RGB-D Semantic Segmentation,’’ arXiv preprint arXiv:1806.01054, 2018.
- [48] S. Song, S. P. Lichtenberg, and J. Xiao, ‘‘Sun RGB-D: A RGB-D scene understanding benchmark suite,’’ in CVPR, 2015.
- [49] S. Hochreiter and J. Schmidhuber, ‘‘Long Short-Term Memory,’’ Neural Computation, 1997.
- [50] A. Radford, J. W. Kim, C. Hallacy, A. Ramesh, G. Goh, S. Agarwal, G. Sastry, A. Askell, P. Mishkin, J. Clark, et al., ‘‘Learning transferable visual models from natural language supervision,’’ in ICML, 2021.
- [51] D. S. Chaplot, D. Gandhi, A. Gupta, and R. Salakhutdinov, ‘‘Object goal navigation using goal-oriented semantic exploration,’’ in NeurIPS, 2020.
- [52] H. Team, ‘‘Habitat challenge, 2020.’’ https://aihabitat.org/challenge/2020, 2020.
- [53] S. K. Ramakrishnan, D. S. Chaplot, Z. Al-Halah, J. Malik, and K. Grauman, ‘‘PONI: Potential Functions for ObjectGoal Navigation with Interaction-free Learning,’’ in CVPR, 2022.
- [54] A. Mousavian, A.toshev, M. Fiser, J. Kosecka, A. Wahid, and J. Davidson, ‘‘Visual representations for semantic target driven navigation,’’ in ICRA, 2019.
- [55] D. S. Chaplot, S. Gupta, D. Gandhi, A. Gupta, and R. Salakhutdinov, ‘‘Learning to explore using active neural mapping,’’ in ICLR, 2020.
Appendix A Appendix
A.1 Pick&Place
Recall that in the pick-and-place task (Pick&Place), an agent must follow an instruction of the form ‘Place the <object> on the <receptacle>’, without being told the location of the <object> or <receptacle> in a new environment. The agent must explore and navigate to the object, pick it up, explore and navigate to the receptacle, and place the previously picked-up object on it. In this section, we go over statistics of the human demonstrations dataset, how our Pick&Place imitation learning (IL) agents scale as a function of training dataset size, and details of our reinforcement learning baseline for Pick&Place.
A.1.1 Dataset Stats
Fig. 8 compares the episode length and action histograms for human and shortest path demonstrations for Pick&Place. Human demonstrations are longer (average vs steps per demonstration) and have a more uniform action distribution compared to shortest paths. Human demonstrations also make use of all actions whereas shortest path demonstrations use only actions. Notice, humans also tend to stand idle and do nothing (ms of idle time is translated to a NO_OP action). They likely use this time to strategize their next set of actions to explore the environment, which is not the case in shortest path demonstrations (by design).
A.1.2 RL Baseline
Similar to the imitation learning baseline, our base policy is a simple CNN+RNN architecture. We first embed all sensory inputs using feed-forward modules. For RGB, we use a randomly initialized ResNet18 [44]. For depth, we use a ResNet50 that was pretrained on PointGoal navigation using DDPPO [13]. In addition to RGBD observations, the policy gets as input language instructions of the form ‘Place the <object> on the <receptacle>’ encoded using a single-layer LSTM [49]. RGBD and instruction features are concatenated to form an observation embedding, which is fed into a -layer, -d GRU at every timestep. We train this policy for M steps on episodes.
Rewards. The agent receives a sparse success reward , a slack reward to motivate faster goal-seeking, an exploration reward , an object seen reward , a grab/release success reward , and a drop penalty reward to penalize dropping the object far from the receptacle. For incentivizing exploration, we use a visitation-based coverage reward from Ye et al. [15]. We first divide the map into a voxel grid of voxels and reward the agent for visiting each voxel. Similar to [15], we smooth by decaying it by number of steps the agent has spent in the voxel (visit count ). To ensure that the agent prioritizes Pick&Place (and not just exploration), we decay based on episode timestep with a decay constant of . The agent is provided a reward for exploration until it sees the object. Once it sees the object, it receives a significant positive reward , and then the reward switches to a path-efficiency based navigation reward. In addition, the agent also receives a significant positive reward when it successfully grabs a object or releases the object close to the receptacle.
| (2a) | ||||
| (2b) | ||||
| (2c) | ||||
| (2d) | ||||
| (2e) | ||||
| (2f) | ||||
| (2g) | ||||
| (2h) | ||||
Results. A policy trained with this reward for M steps fails to get beyond success on the Pick&Place task. The agent learns to pick up the object at the start of training if it sees the object while navigating but it fails to search for the receptacle and place the object on top of receptacle. Overall, throughout training, the agent doesn’t solve the task successfully even once demonstrating the difficulty of the task and inadequacy of the above reward structure.
A.1.3 Performance vs. Dataset Size
Fig. 7 plots Val success of our IL agent vs. the size of the Pick&Place human demonstrations dataset. We trained policies on to subsets of the data. Performance continues to improve with more data and has not saturated.

A.2 Zero-shot ObjectNav results on Gibson
To test generalization of the IL agents trained on human demonstrations, we report zero-shot results by transferring our policy trained on human demonstrations to the Gibson dataset [42] val split in Table 5. To enable zero-shot transfer of semantic features, we remap the common goal categories (chair, couch, potted plant, bed, toilet, TV, dining-table) from Matterport3D [31] to Gibson goal category IDs. Our IL agent achieves success and SPL (row 7) with no finetuning on Gibson dataset. Comparing our zero-shot results to approaches trained on Gibson, our IL agent is better on success and better on SPL than an RL baseline that takes RGBD + Semantics as input (row 3 vs. row 7). Next, we compare our approach with SemExp [51] which builds explicit semantic maps and learns a goal-oriented semantic exploration policy which learns semantic priors for efficient navigation. Our approach is worse on success and worse on SPL compared to SemExp [51] (row 6 vs. row 7). [53] uses a modular framework for ObjectNav by using a potential function conditioned on a semantic map which is used to decide where to look for unseen object in an environment. Our approach is worse on success and worse on SPL.
A.3 Estimating time using a LoCoBot motion model
To estimate the time a robot would take to execute the collected human trajectories in the real world, we use the LoCoBot motion model from Krantz et al. [28]. This model consists of a rotation function that maps turn angle to time and a translation function that maps straight-line distance to time. For estimating time required for grab/release actions, we replace them with forward steps and use the straight-line distance translation function. We use the MoveBase controller from [28] for all our time estimates, with the following rotation and translation equations:
| (3) |
| (4) |
A.4 Characterizing Learnt Behaviors
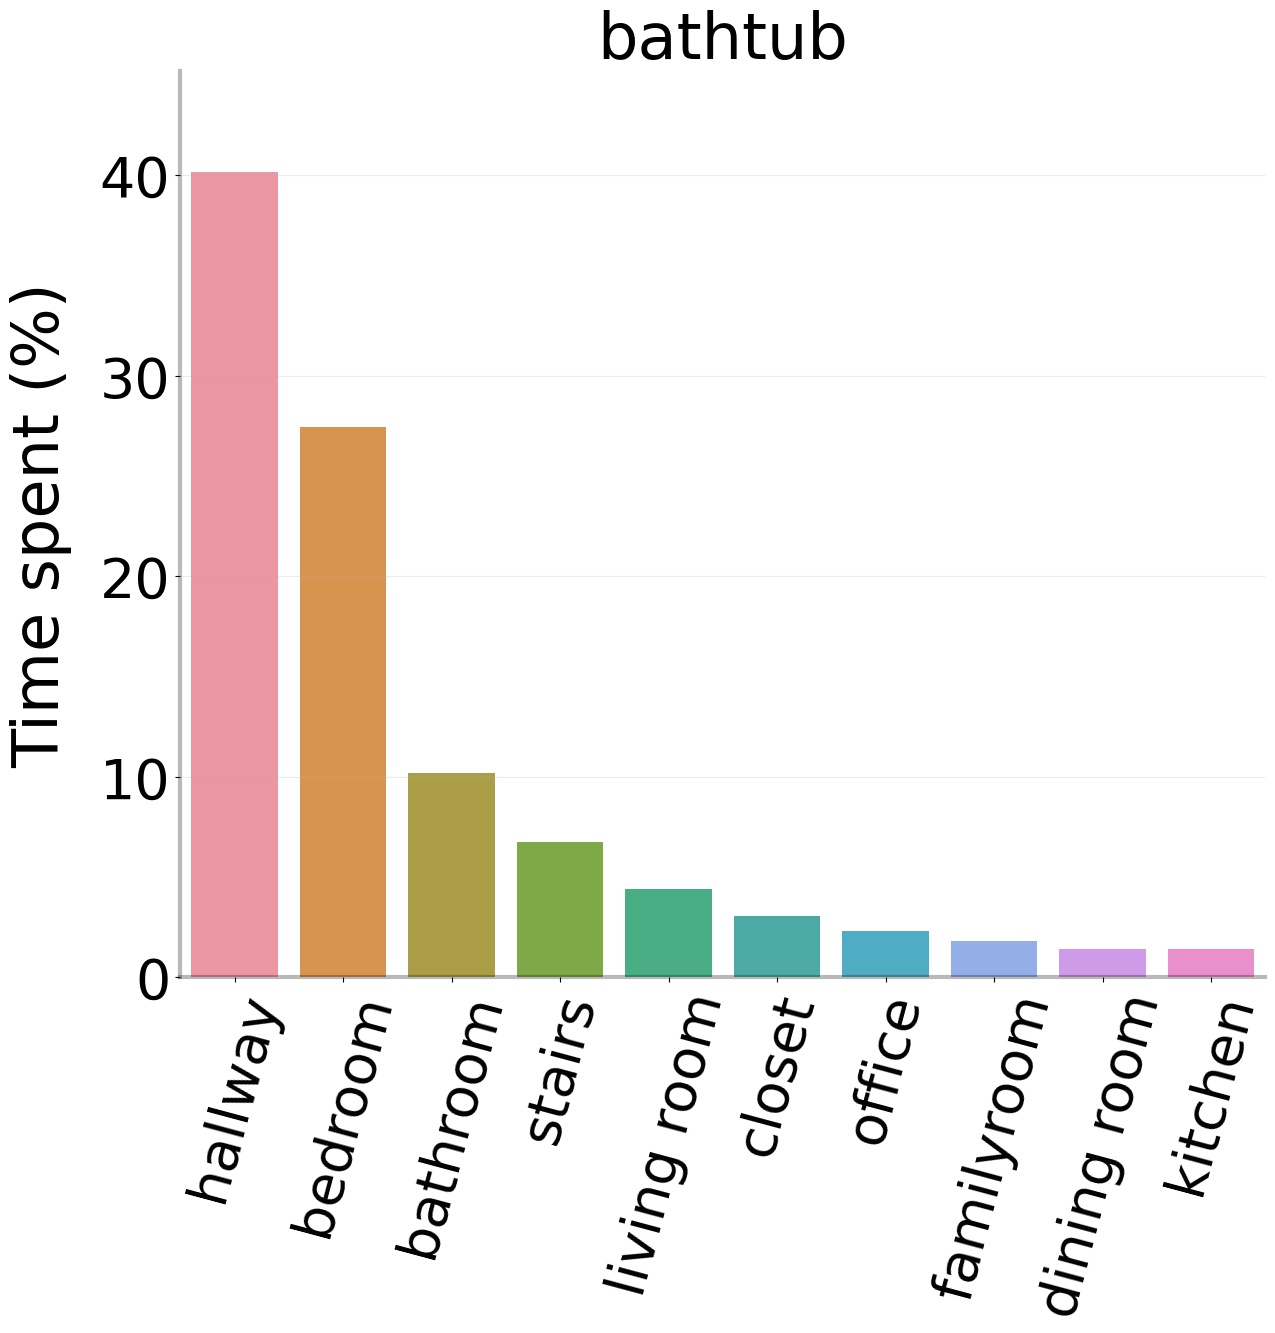
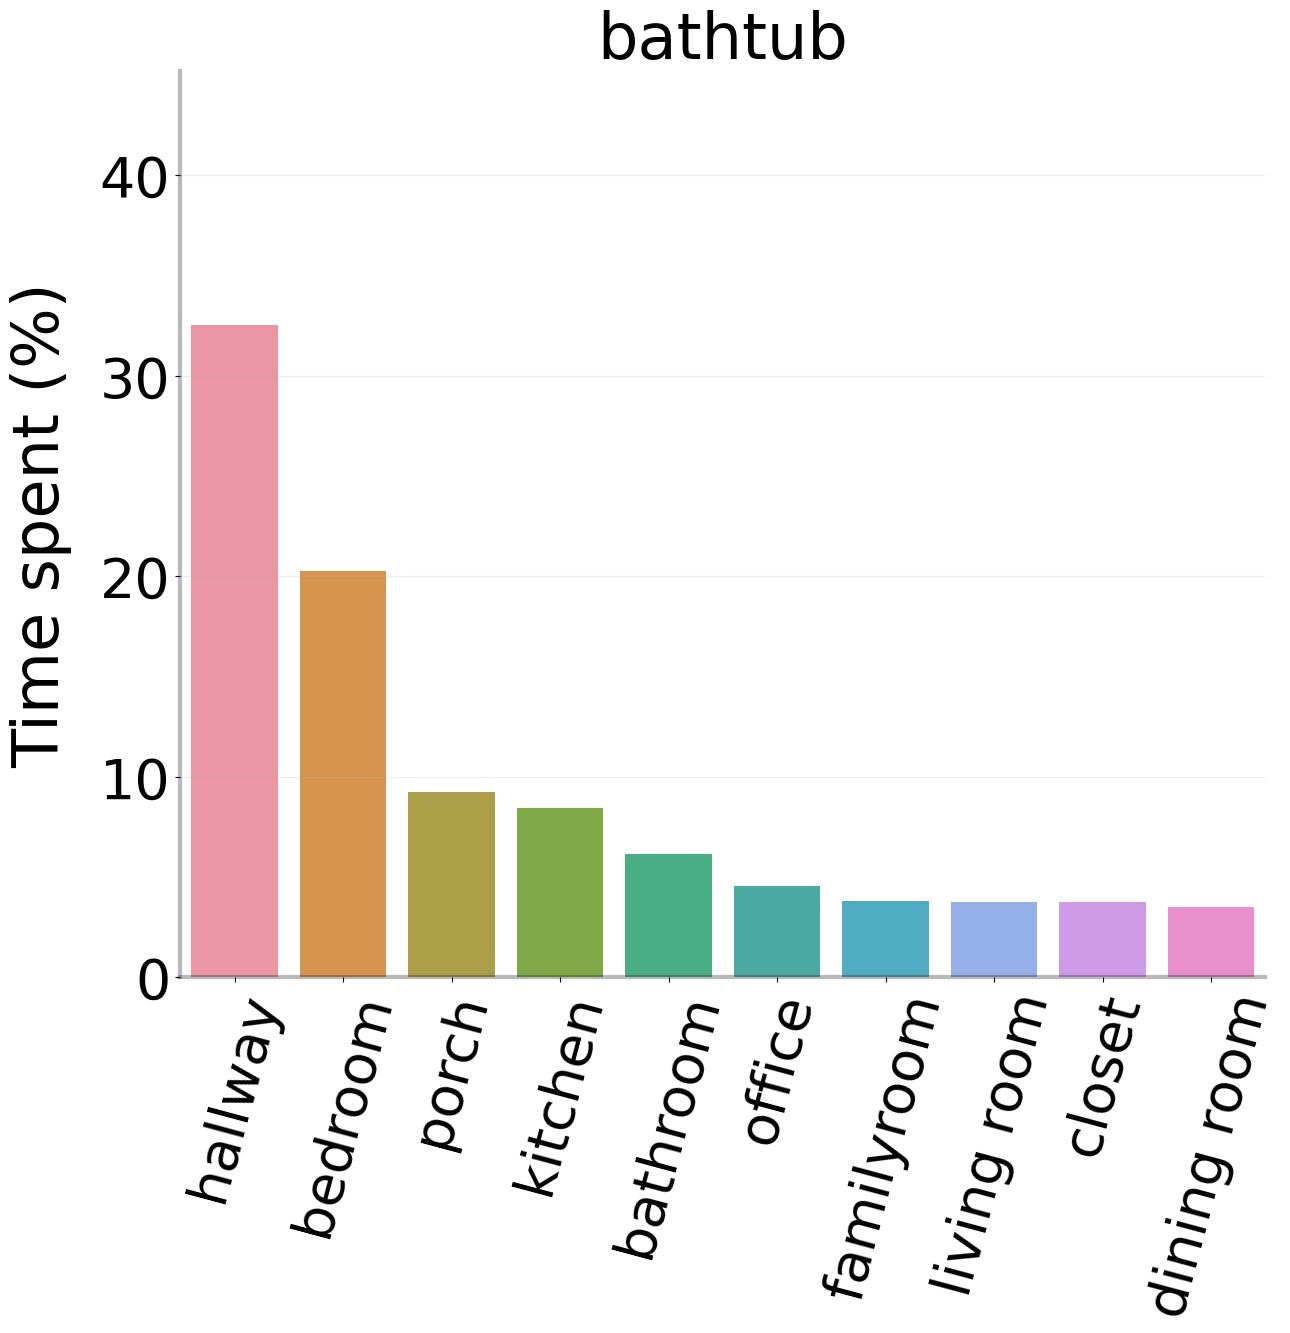
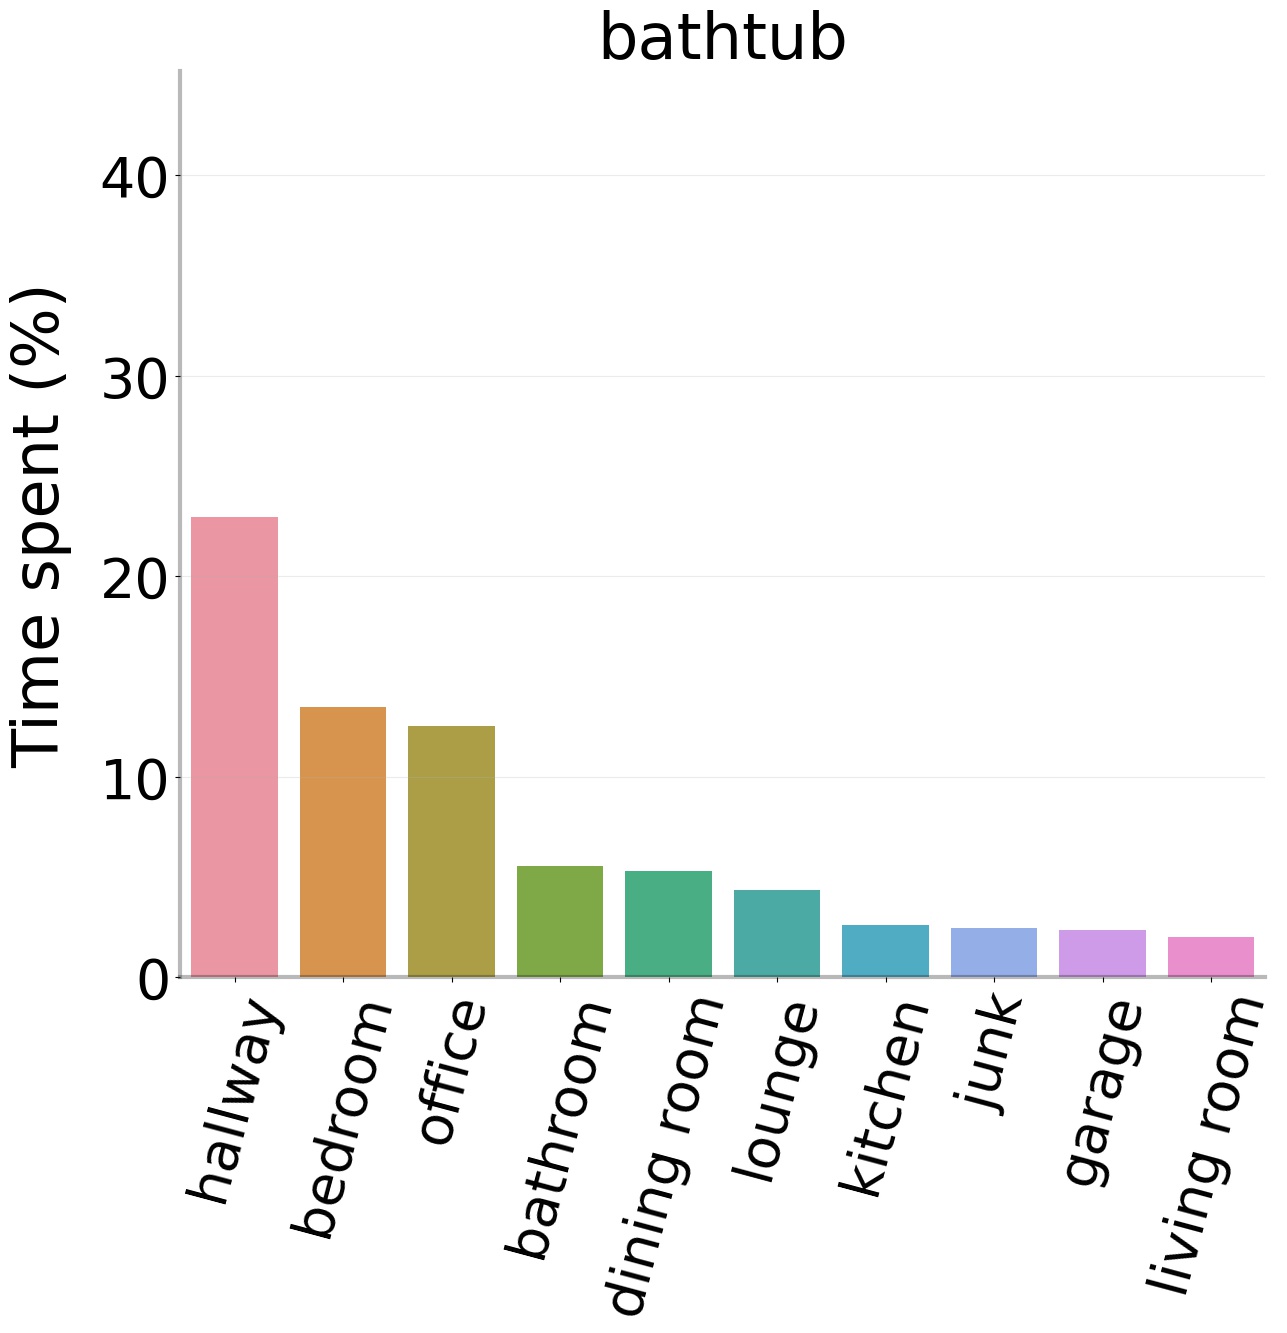
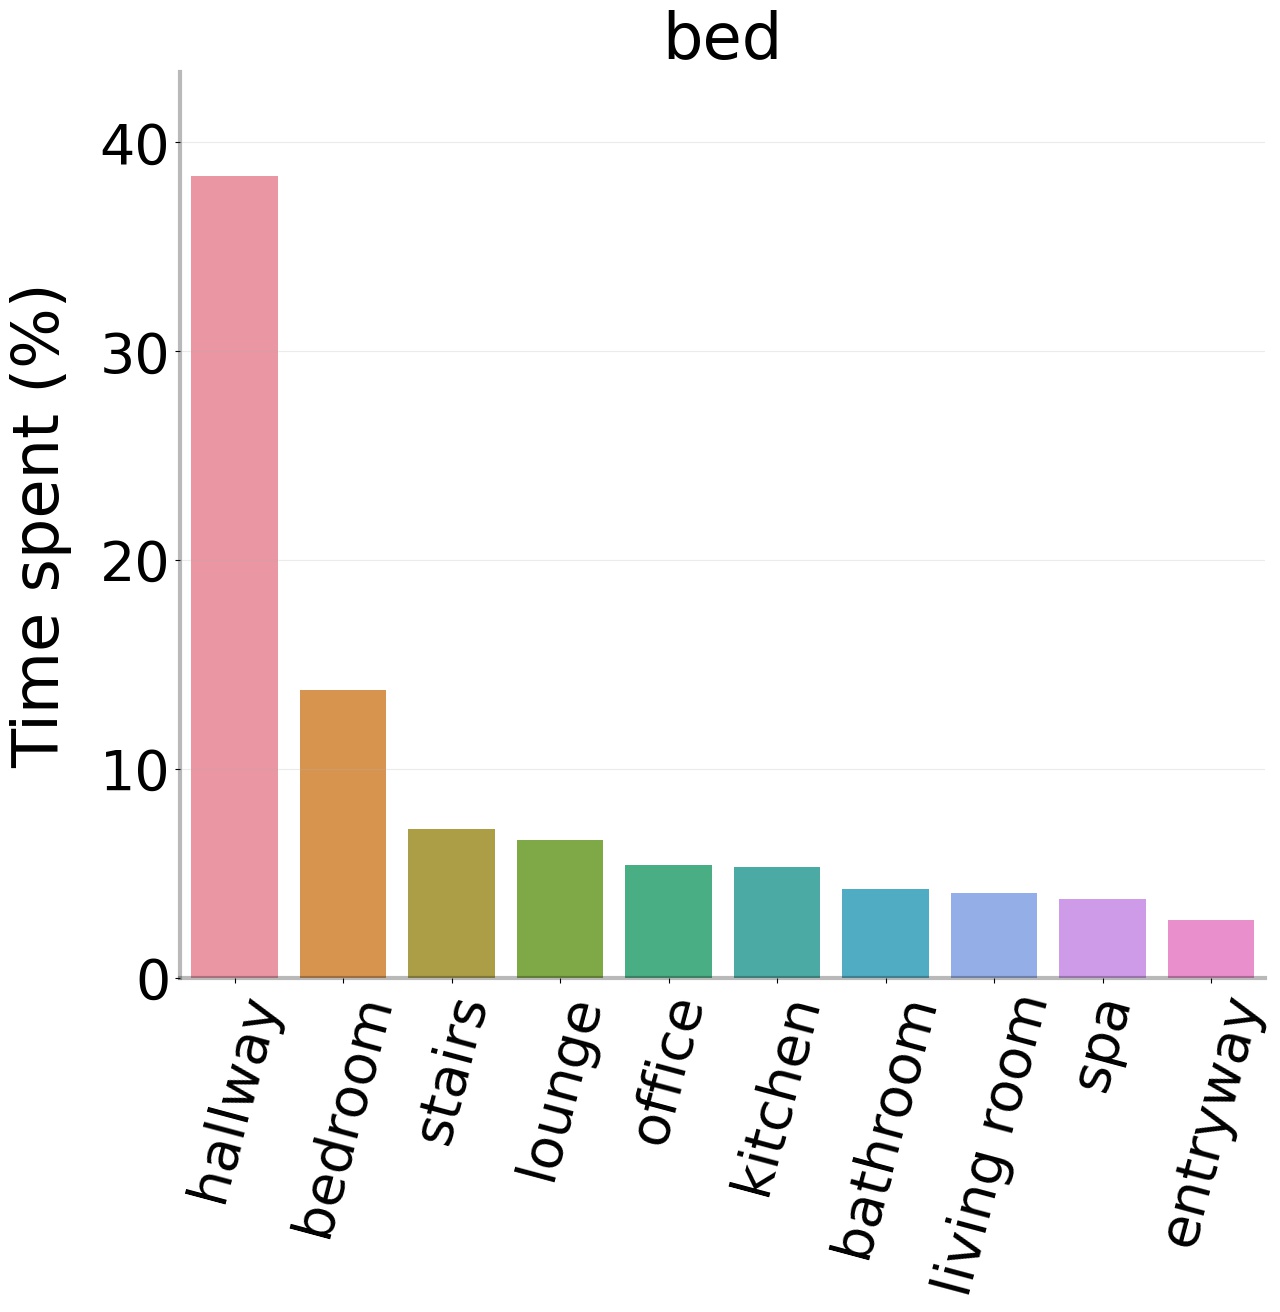
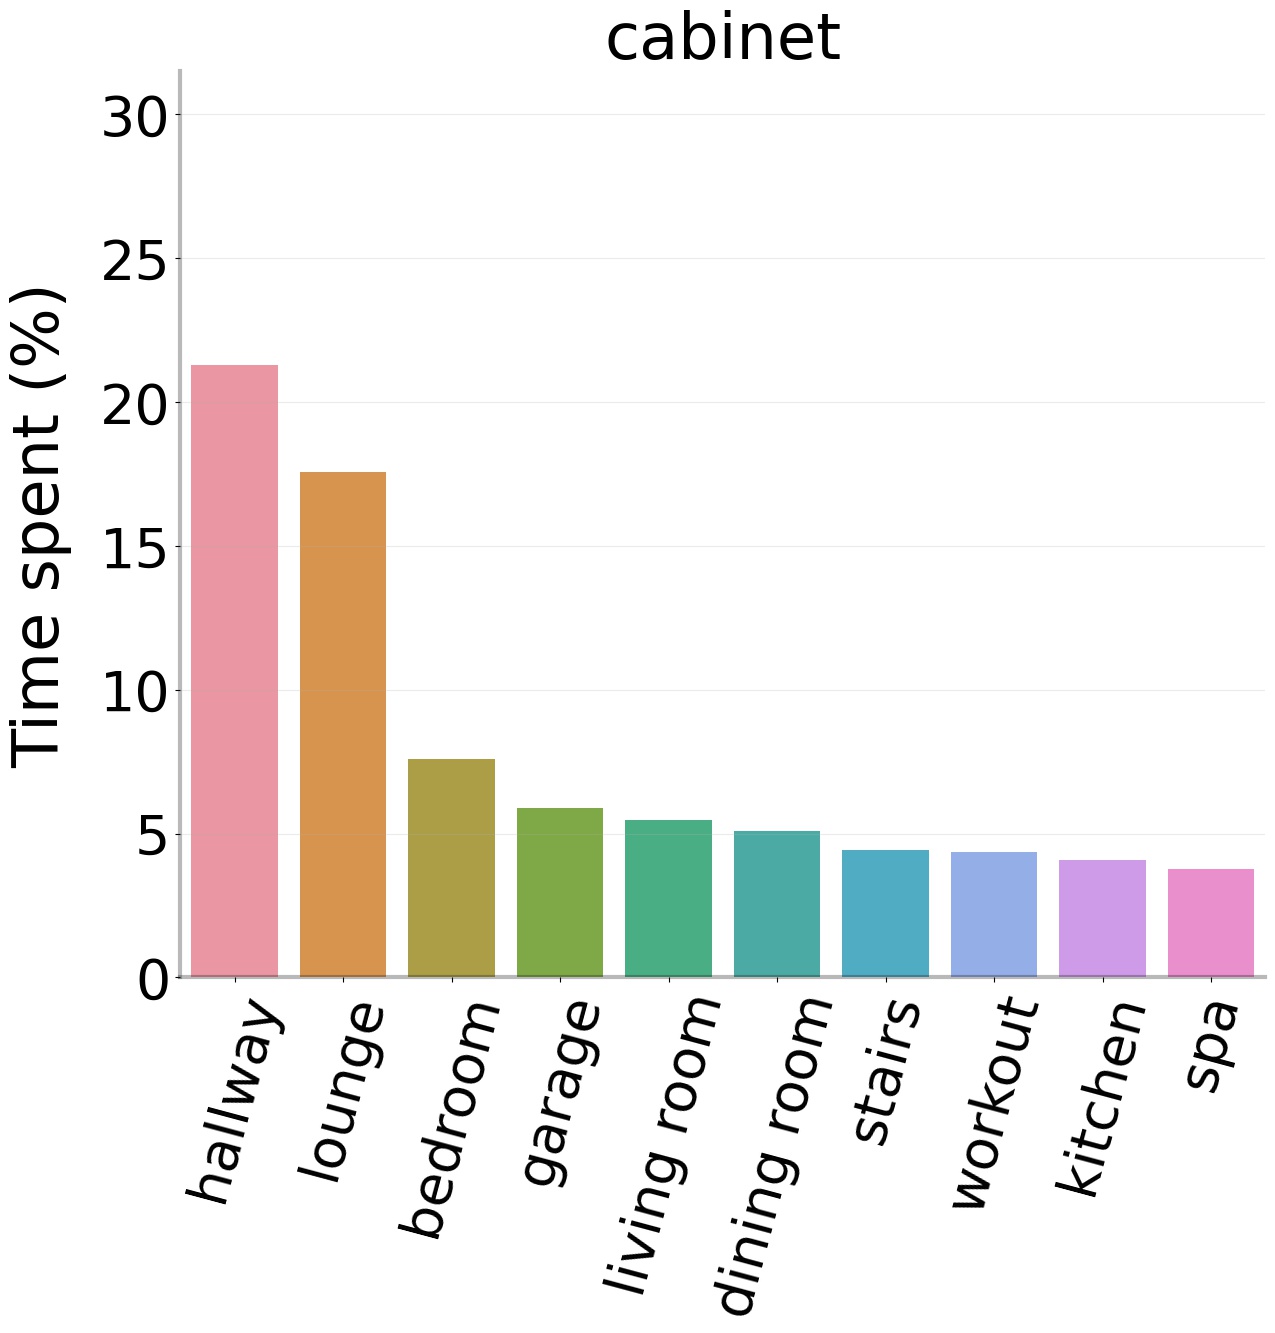
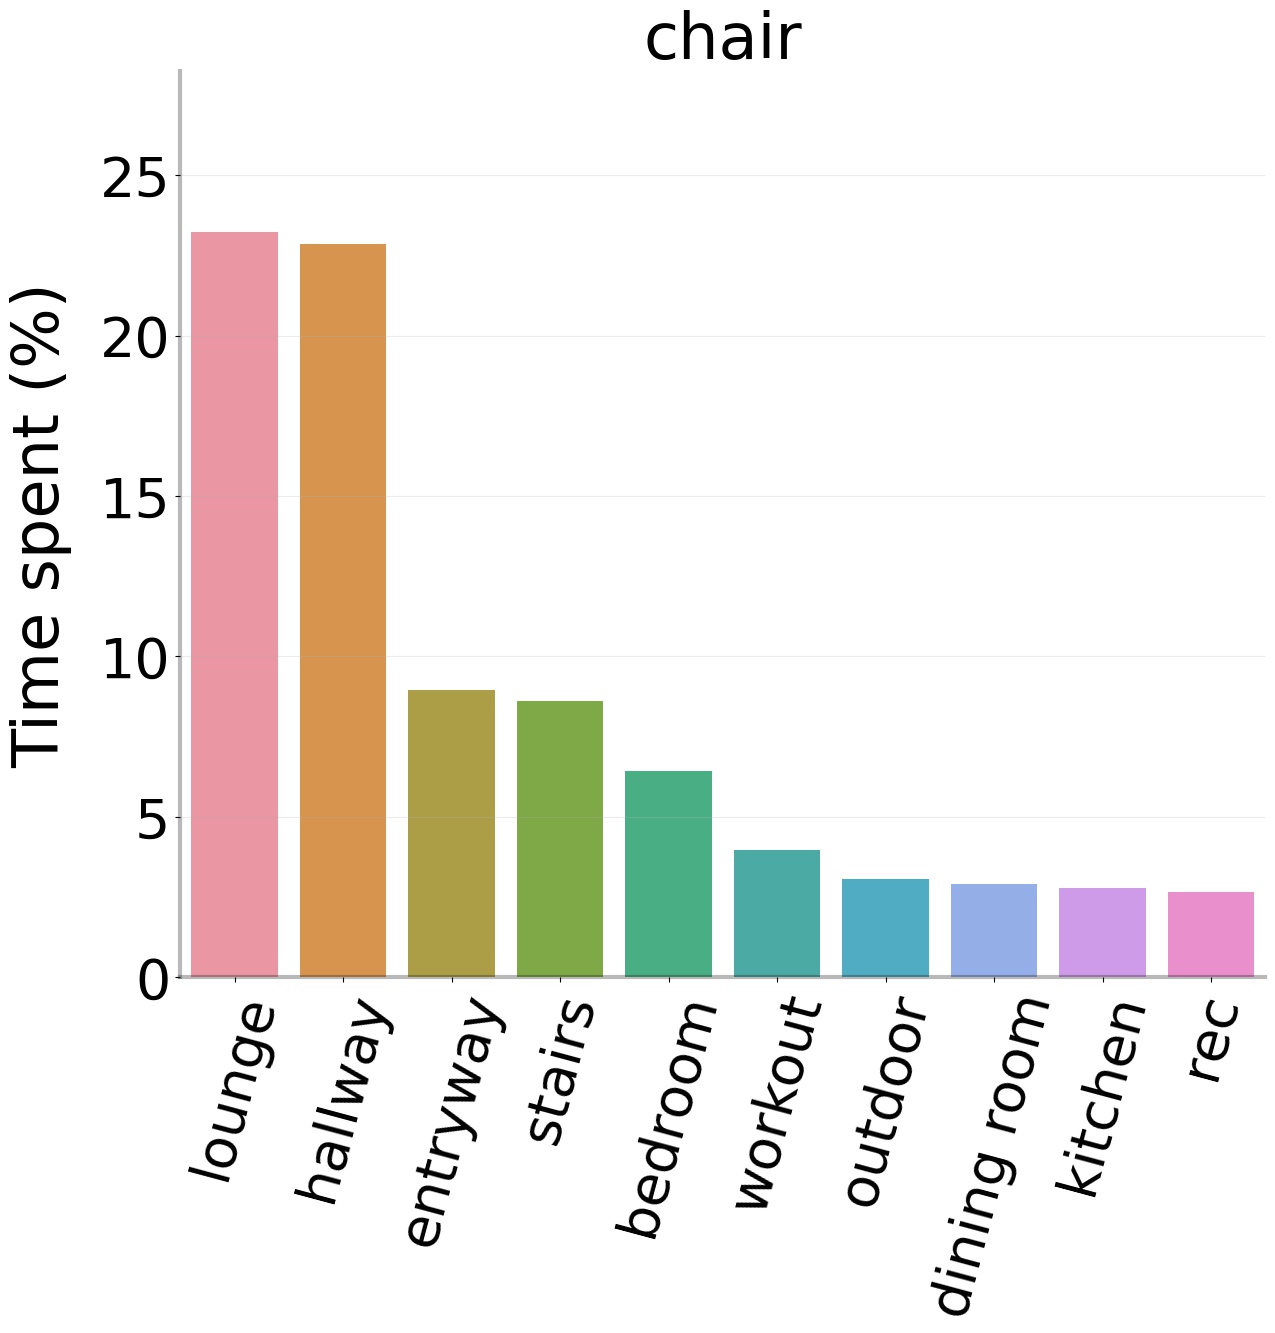
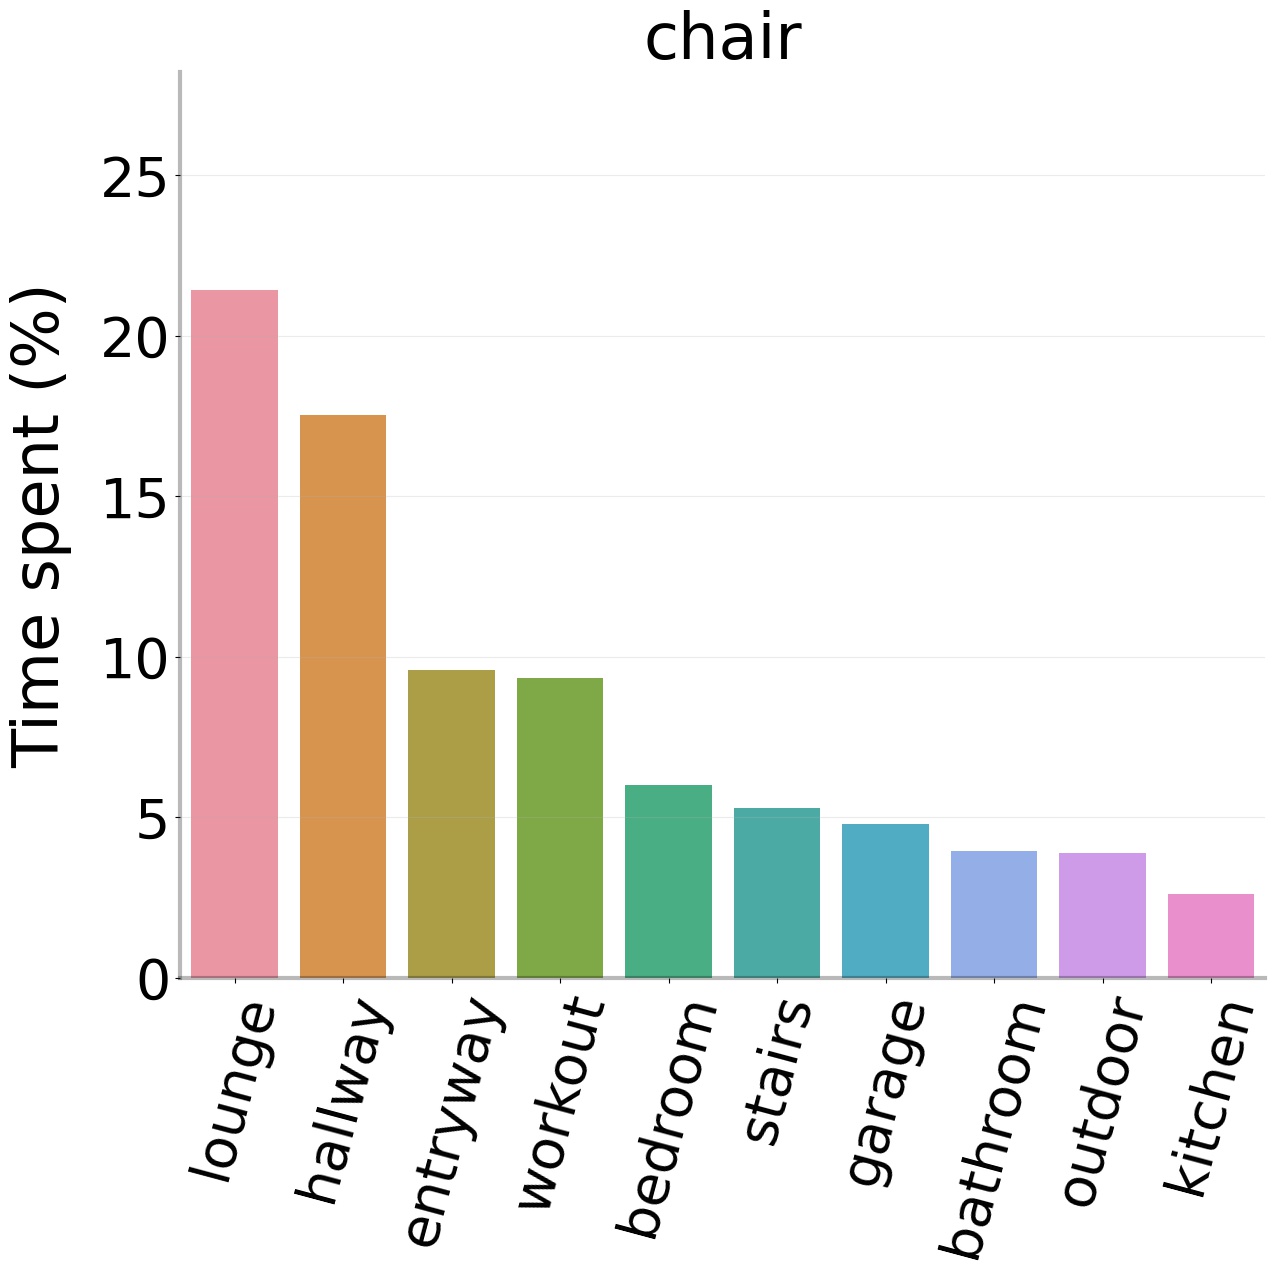
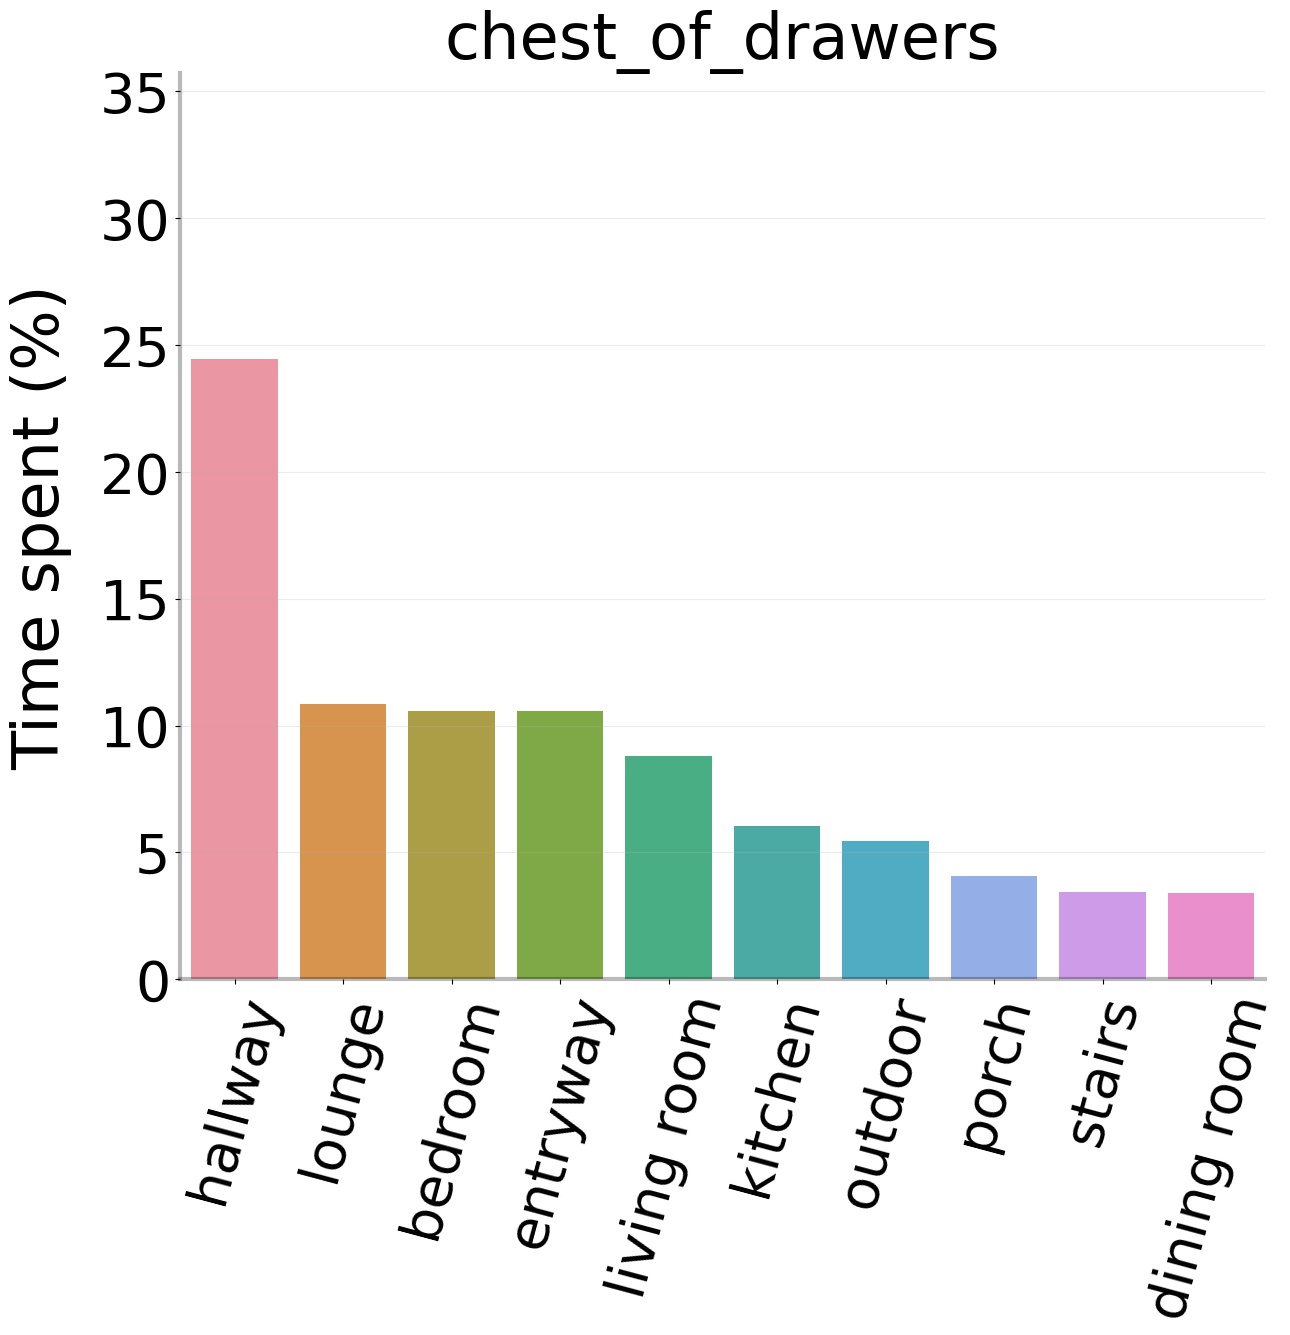
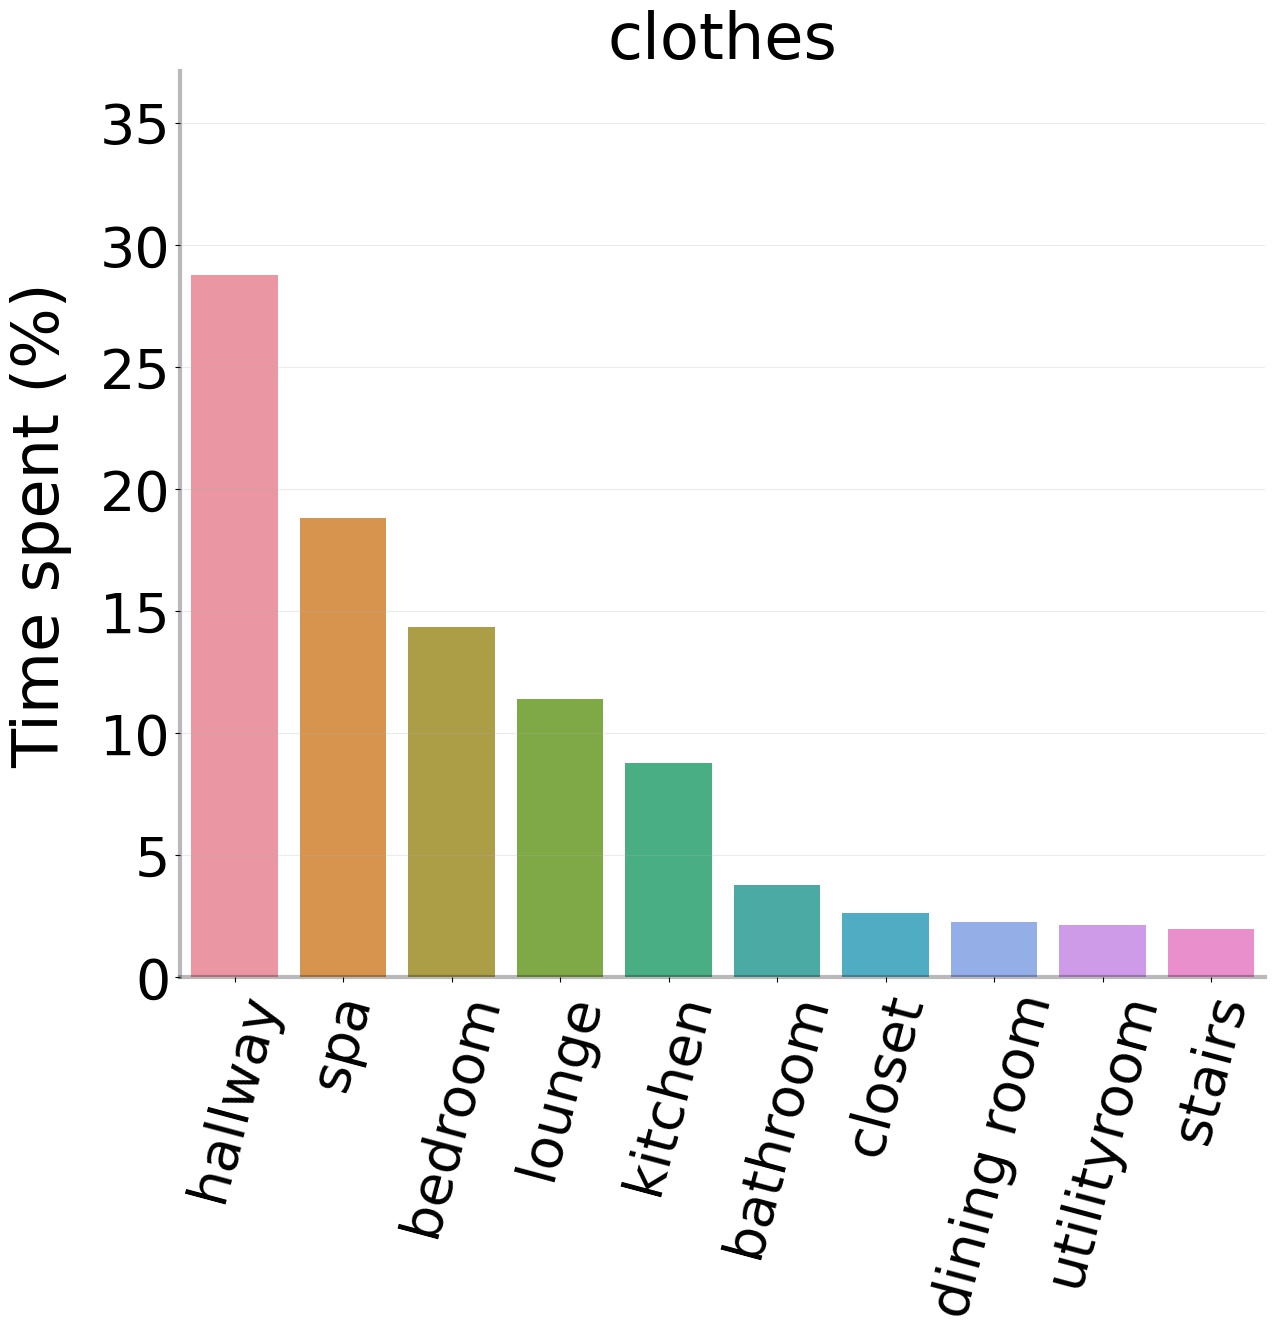
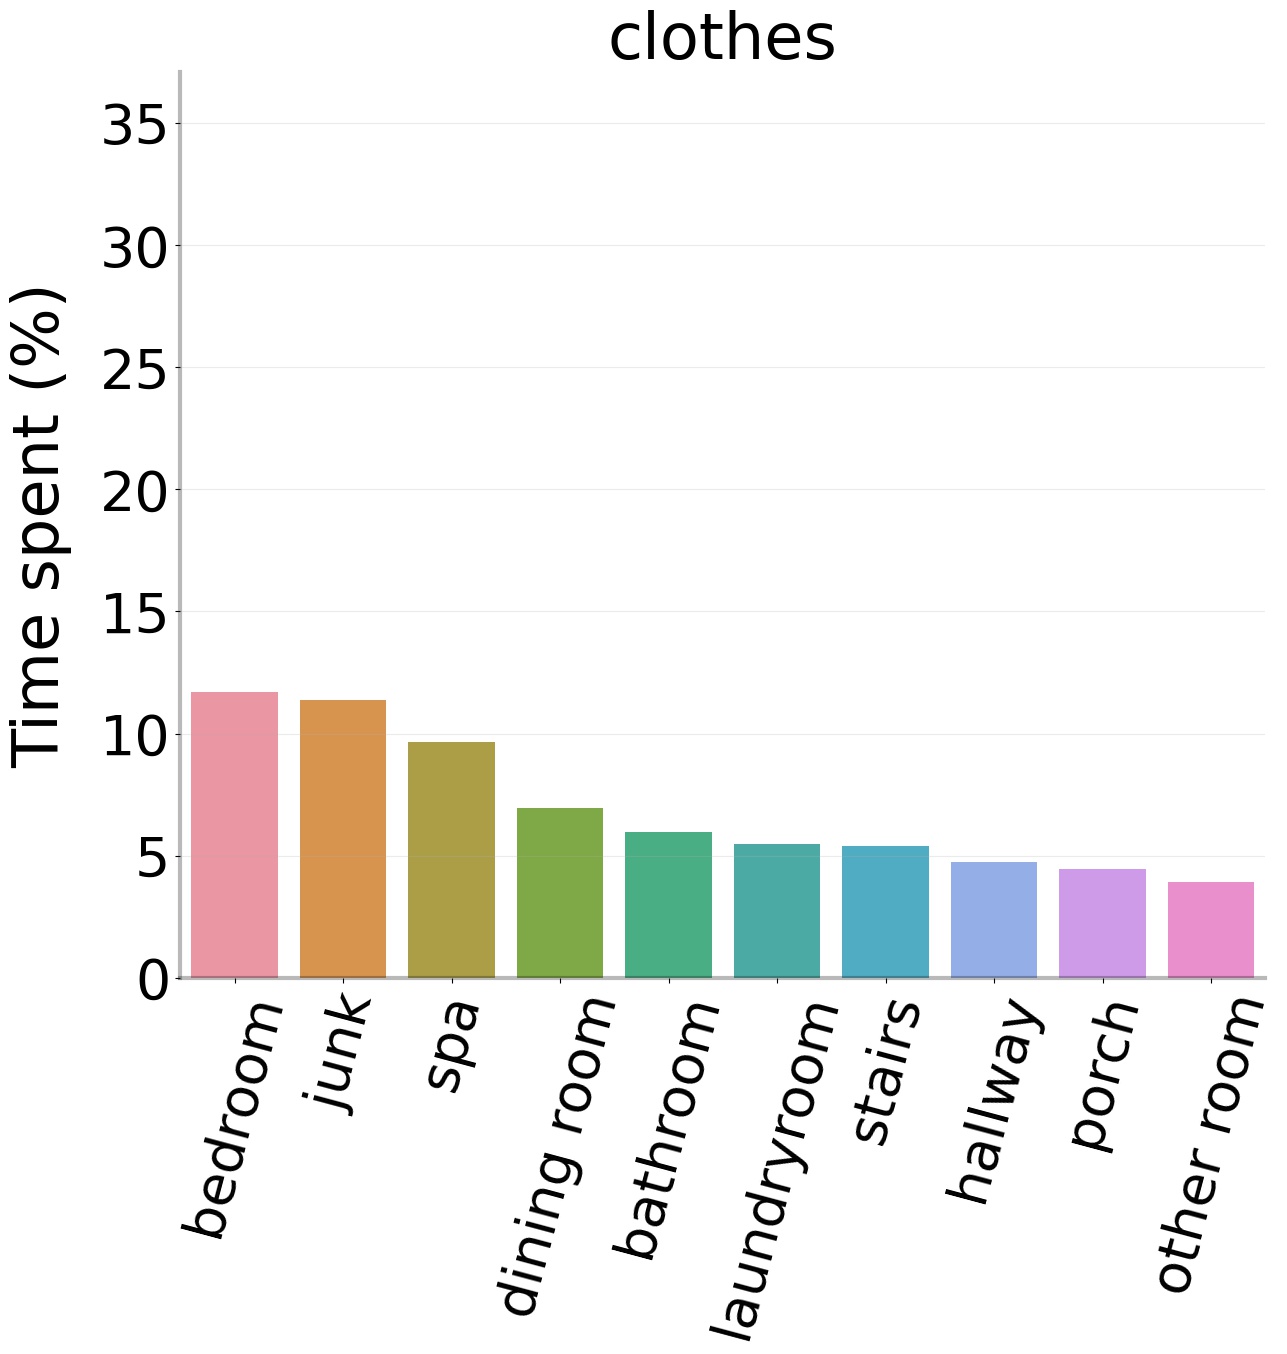
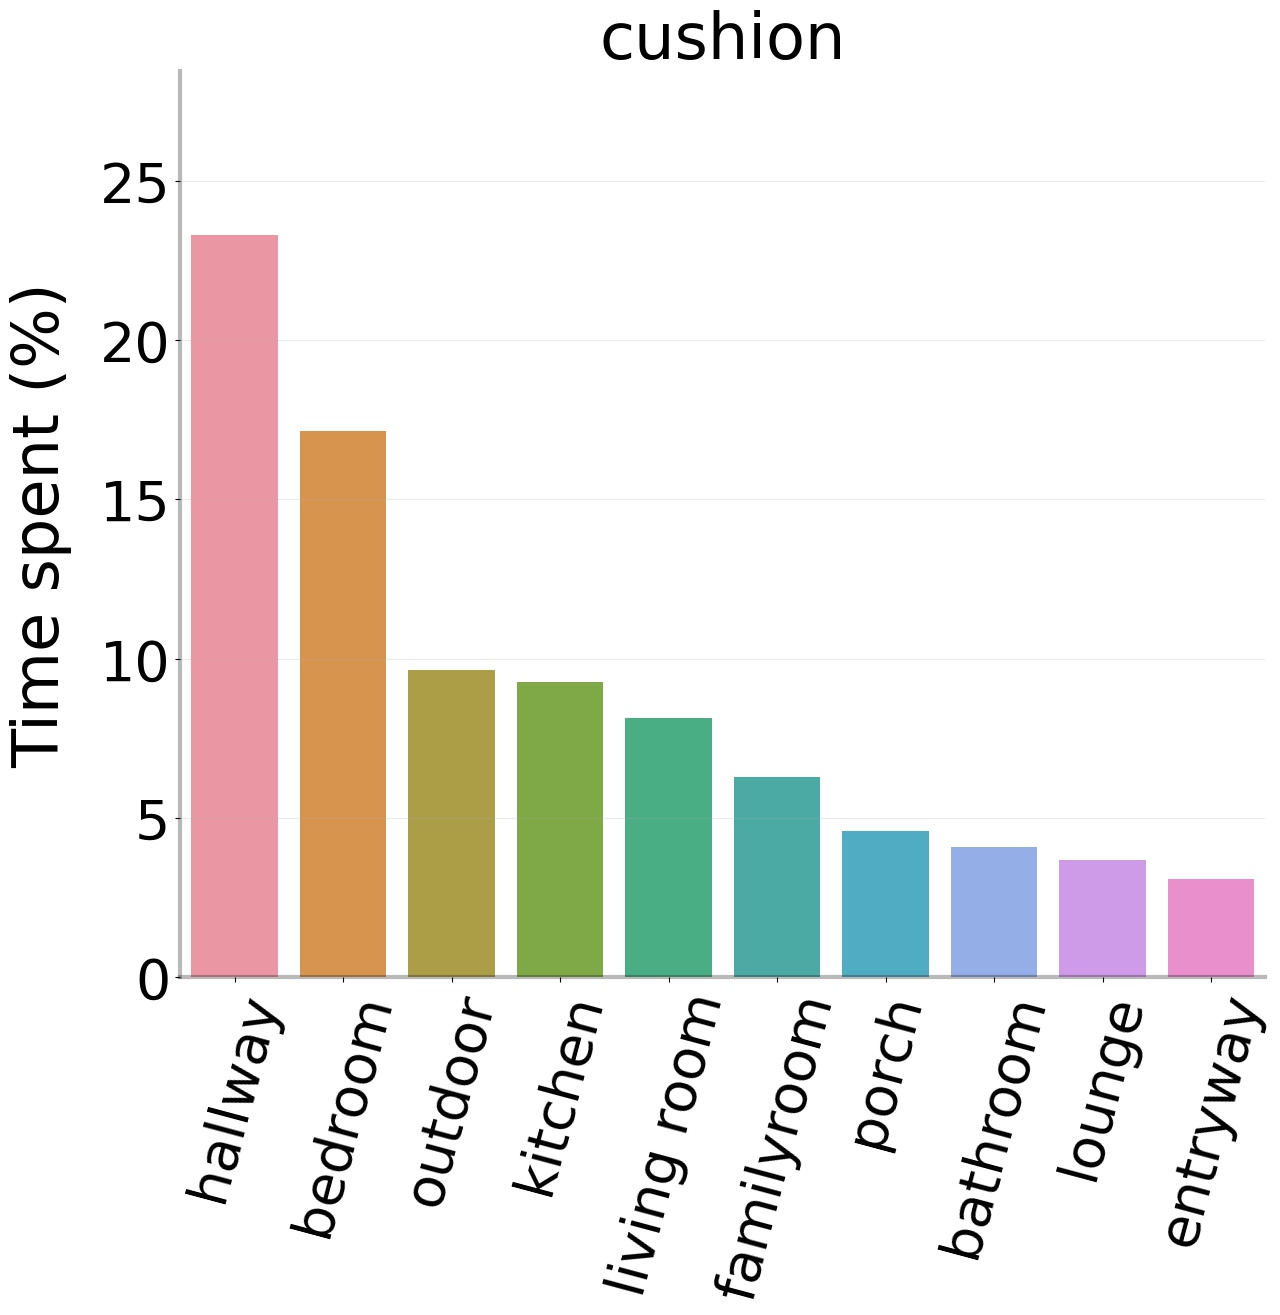
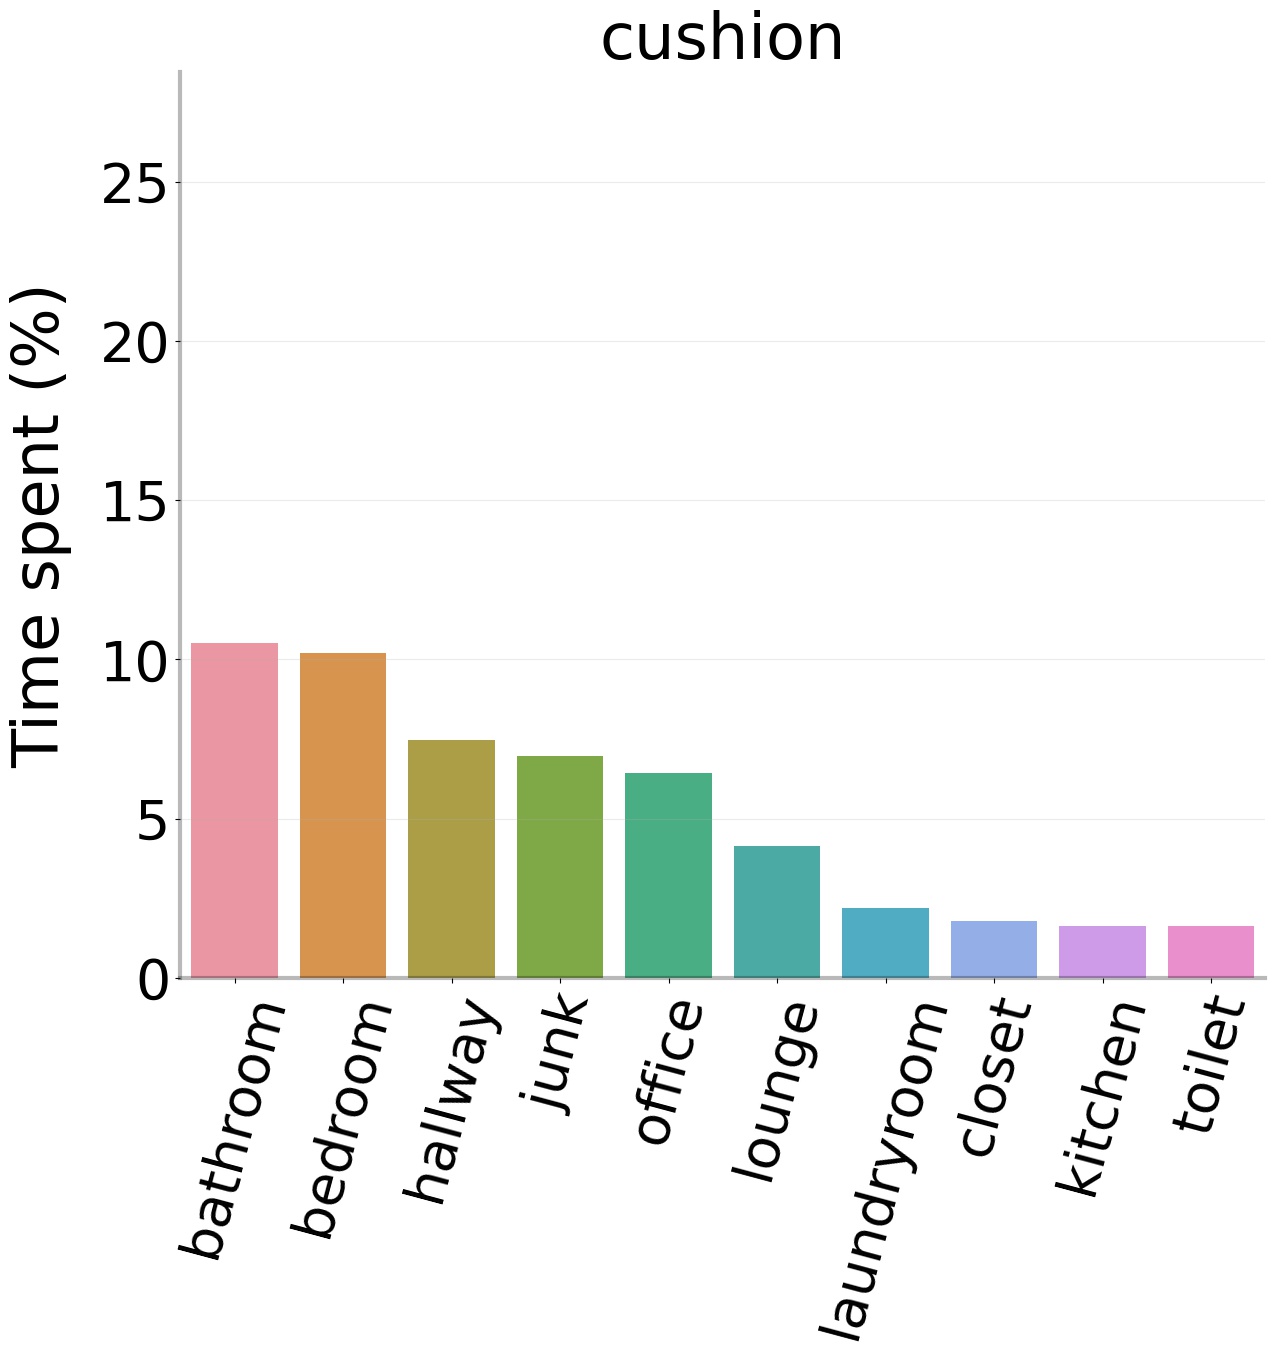
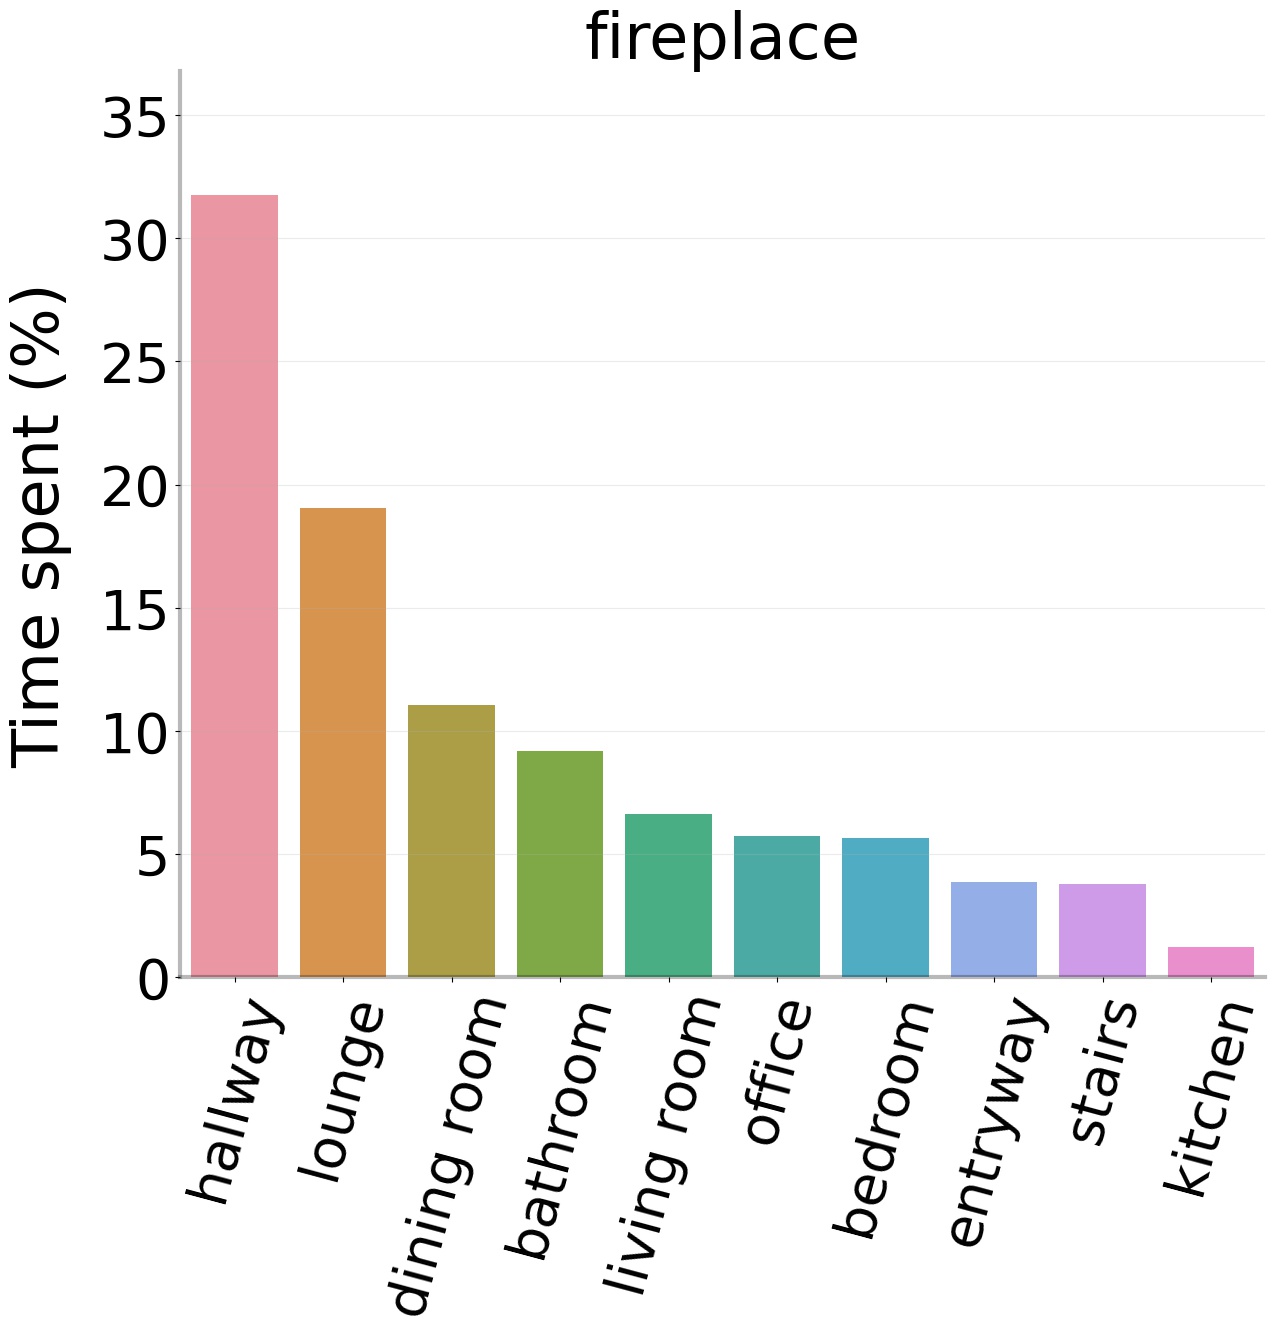
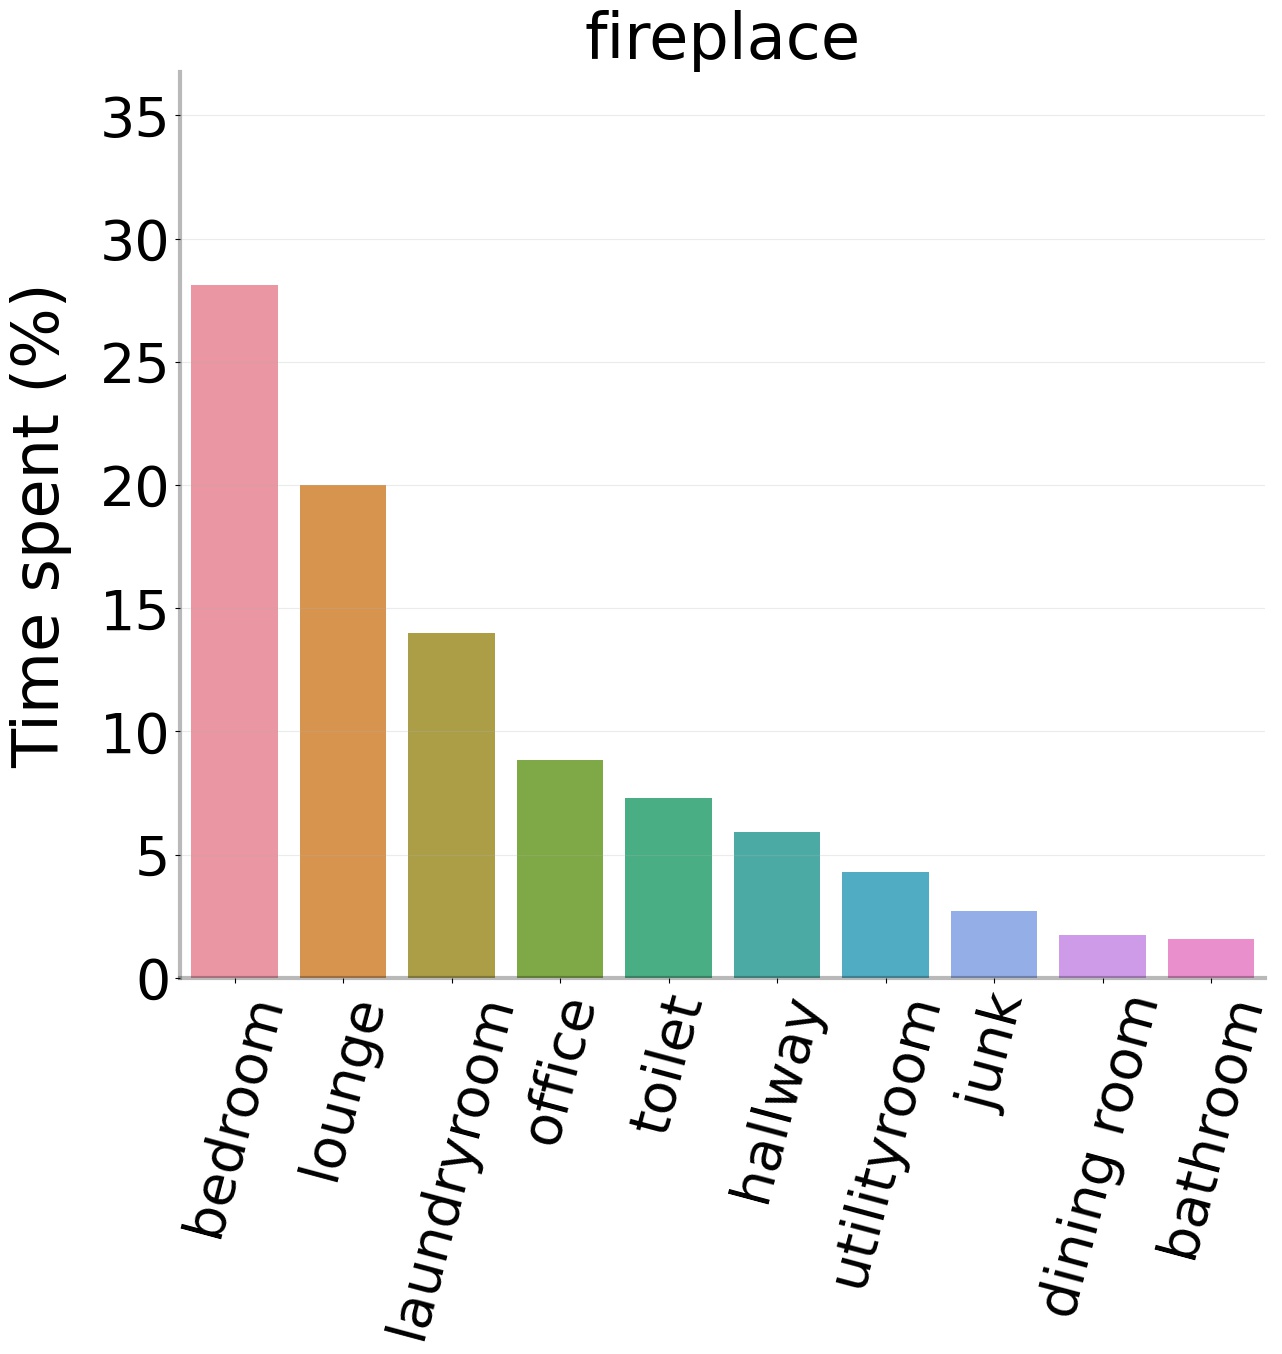
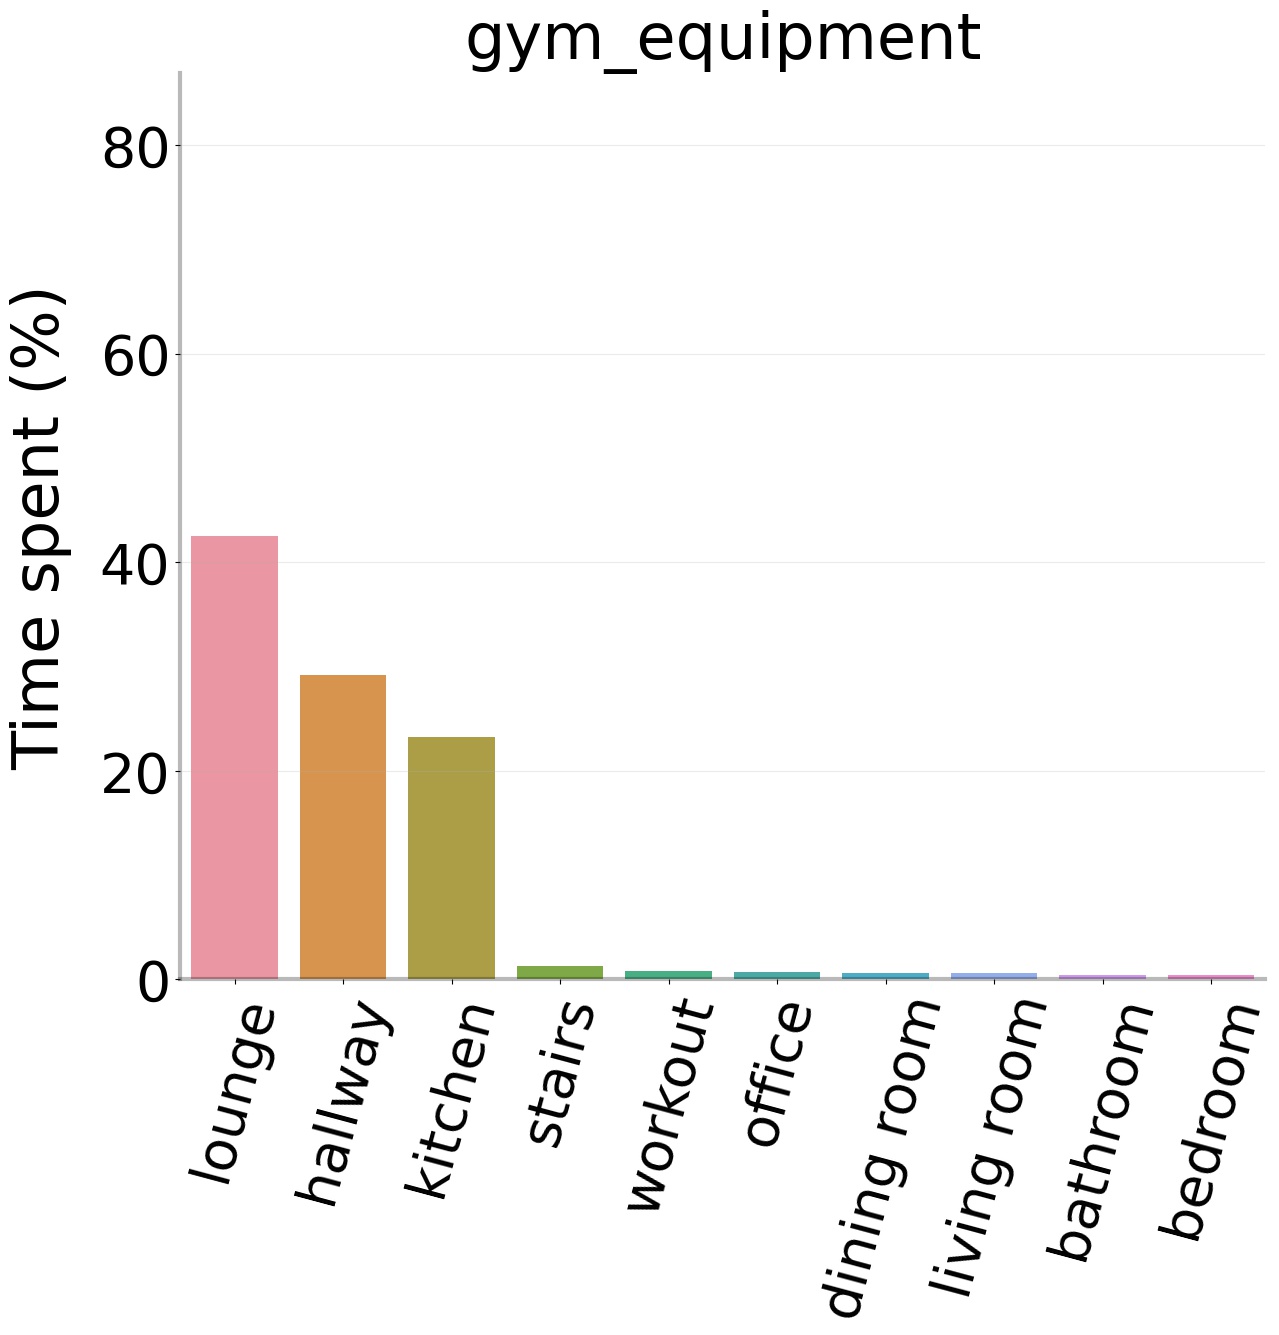
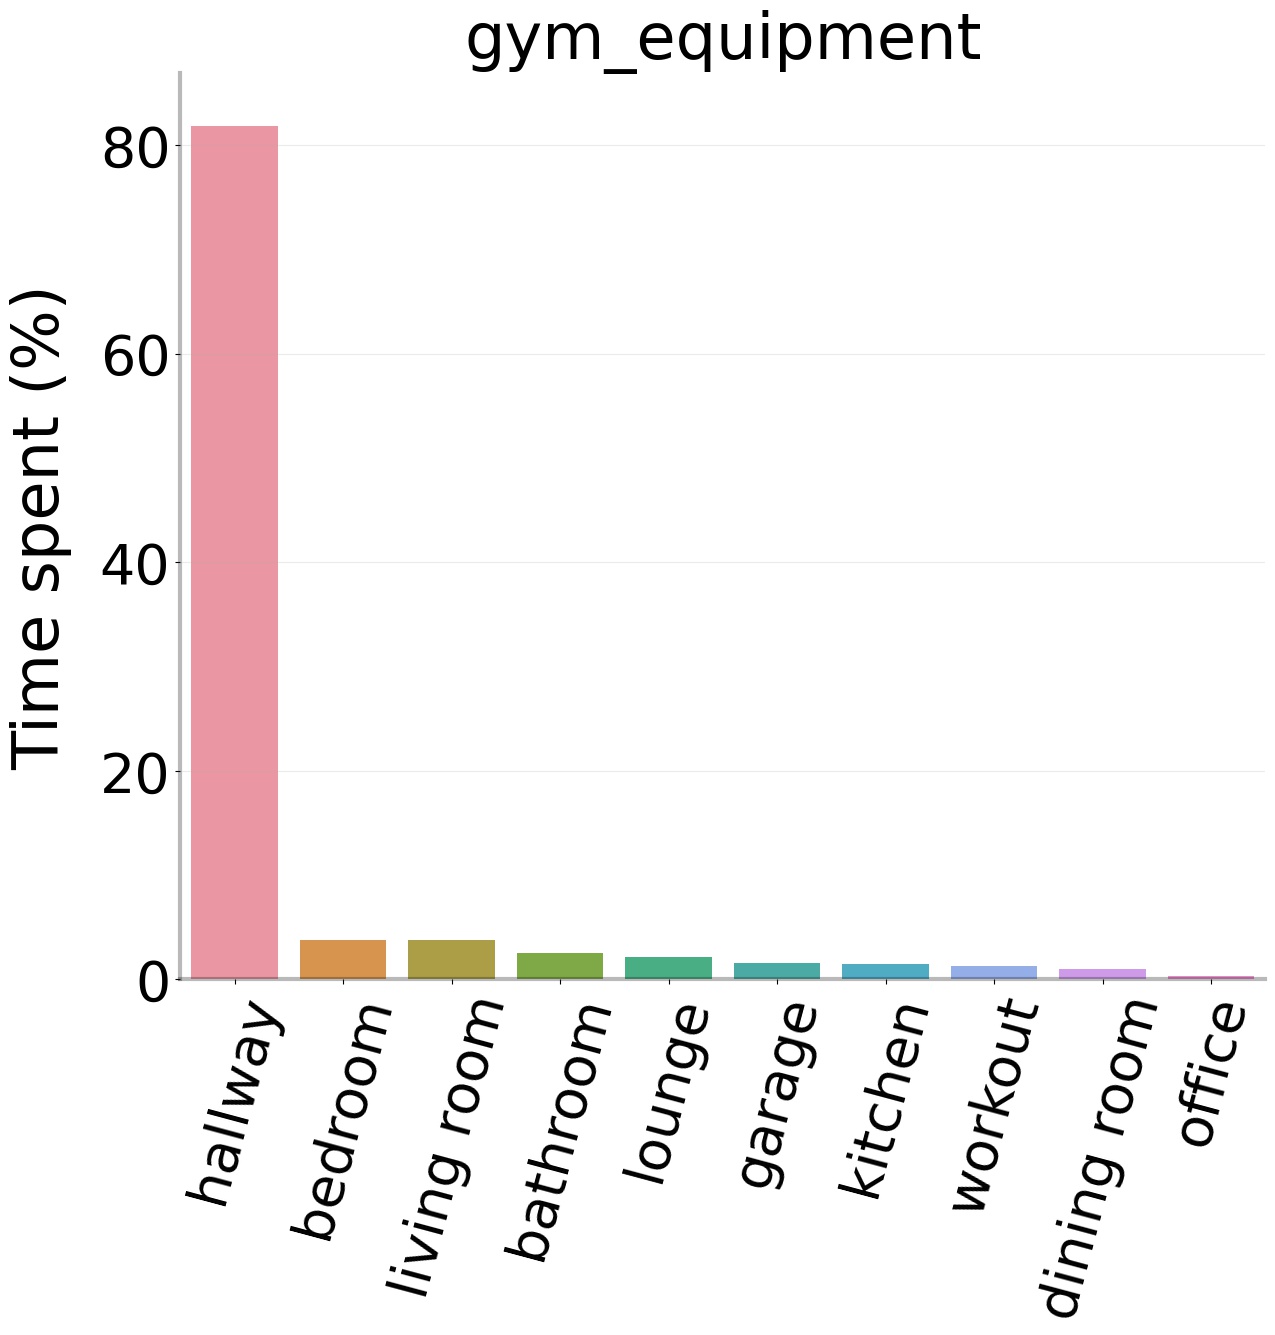
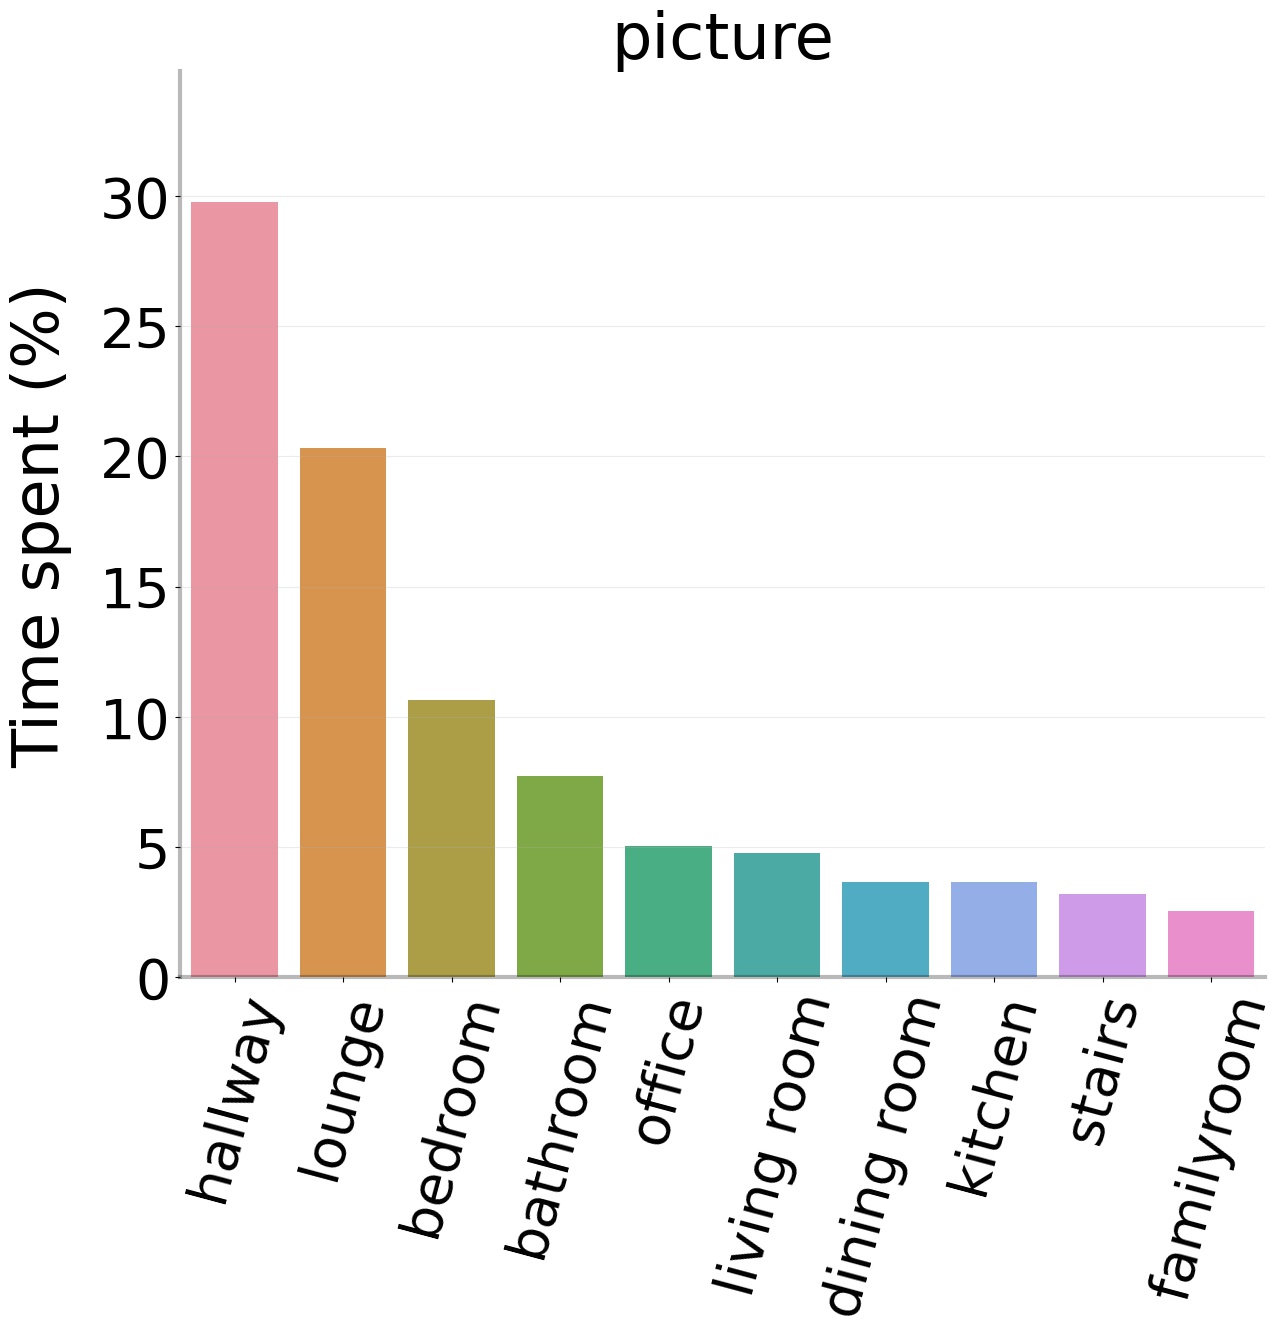
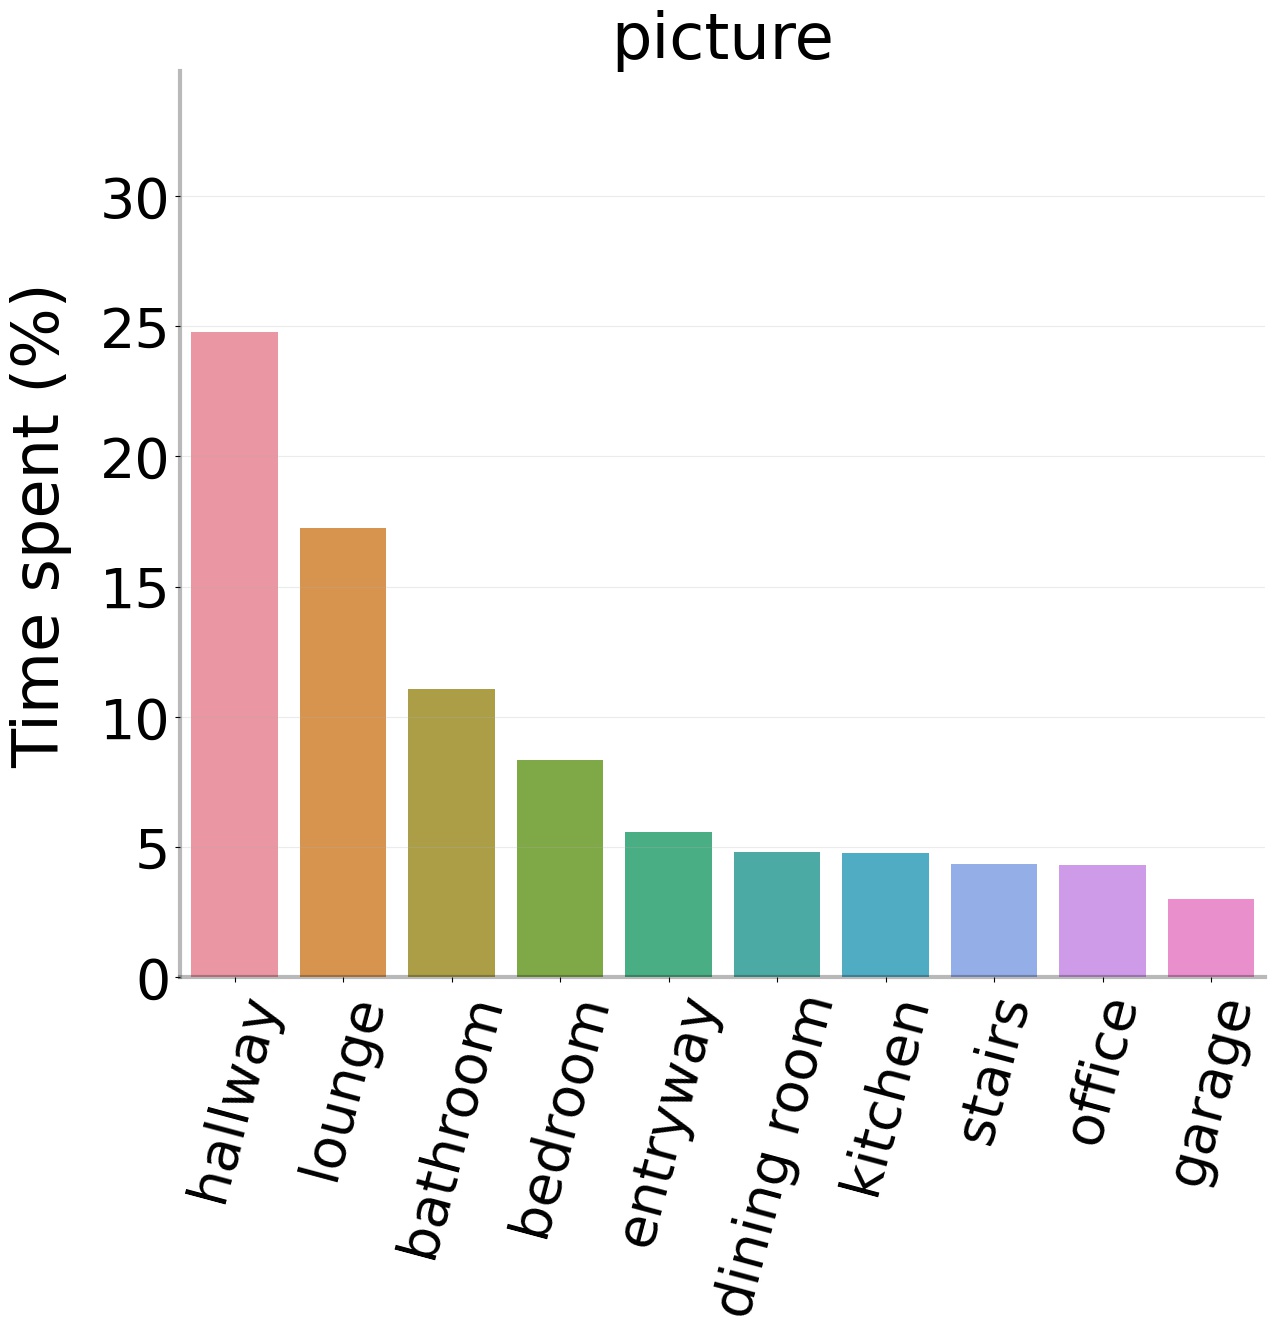
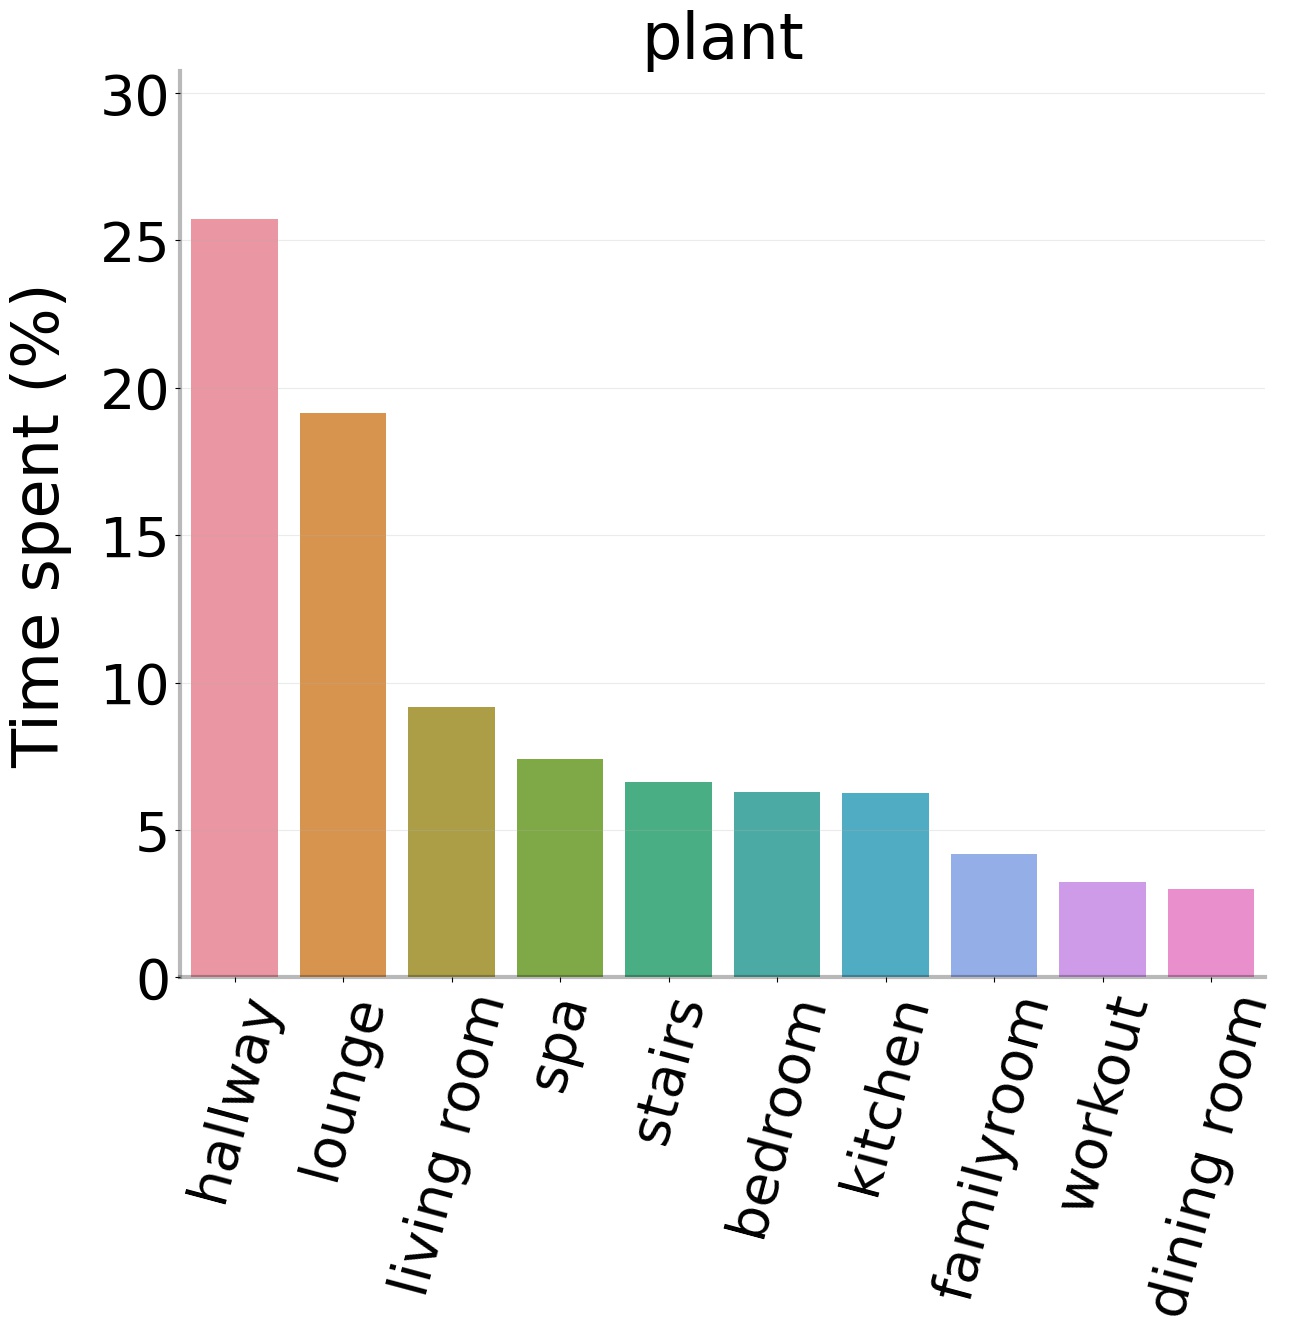
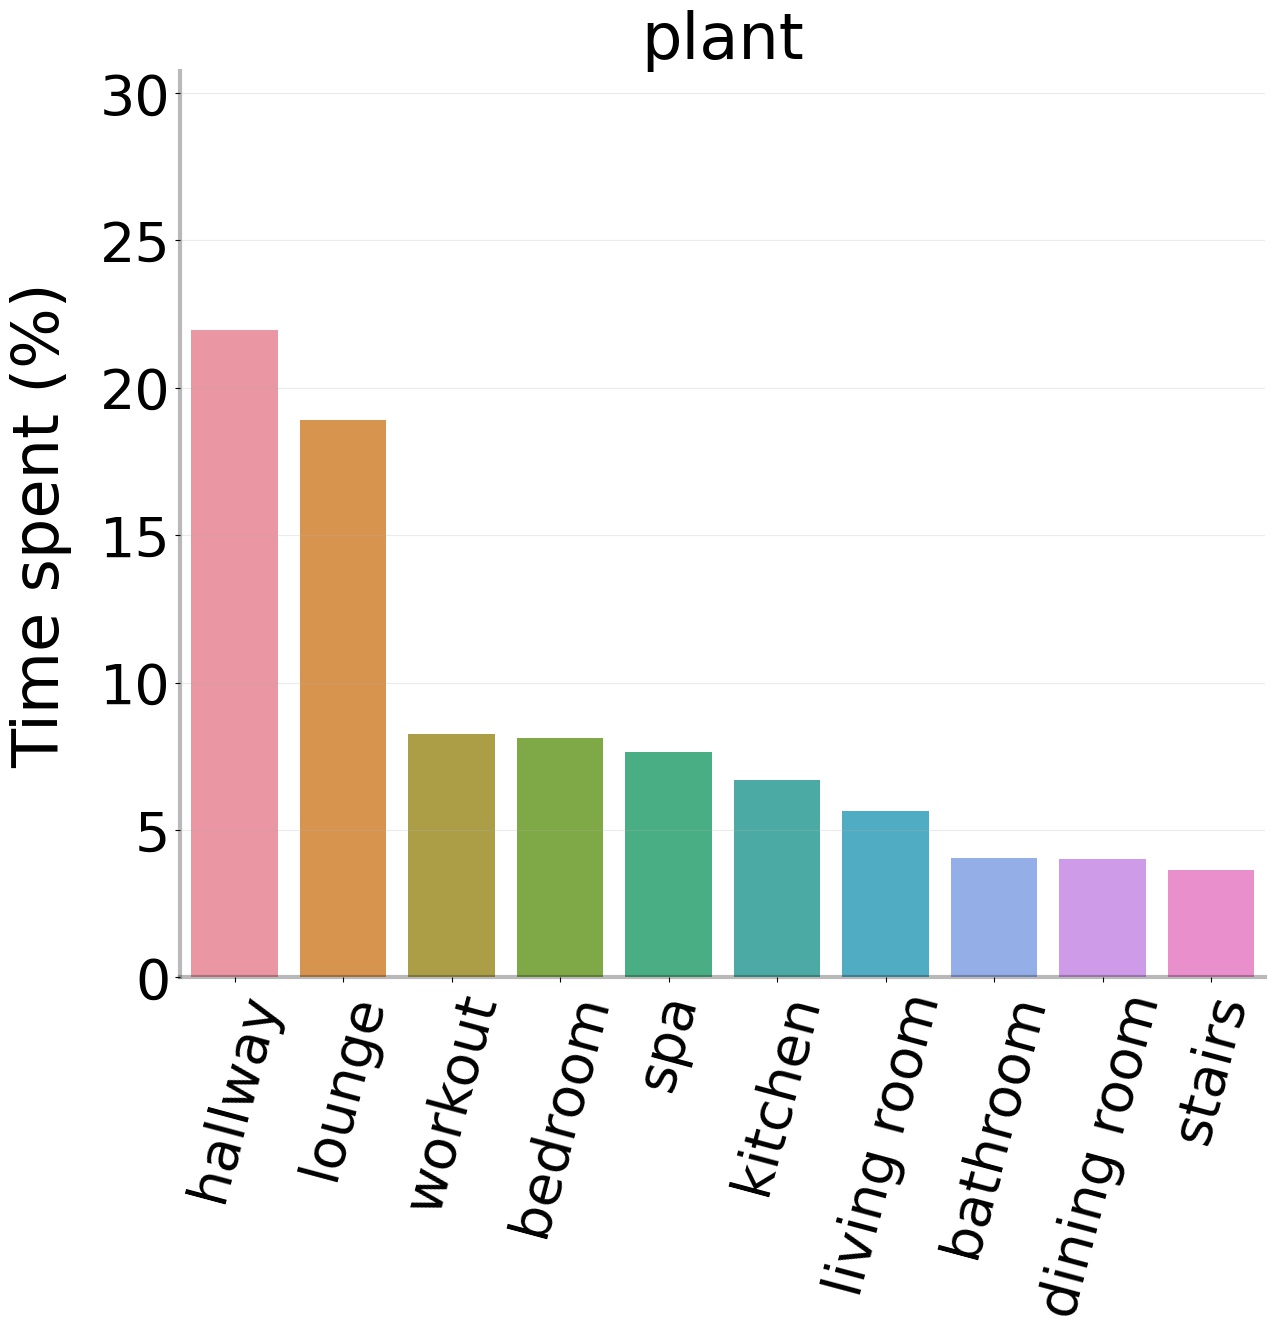
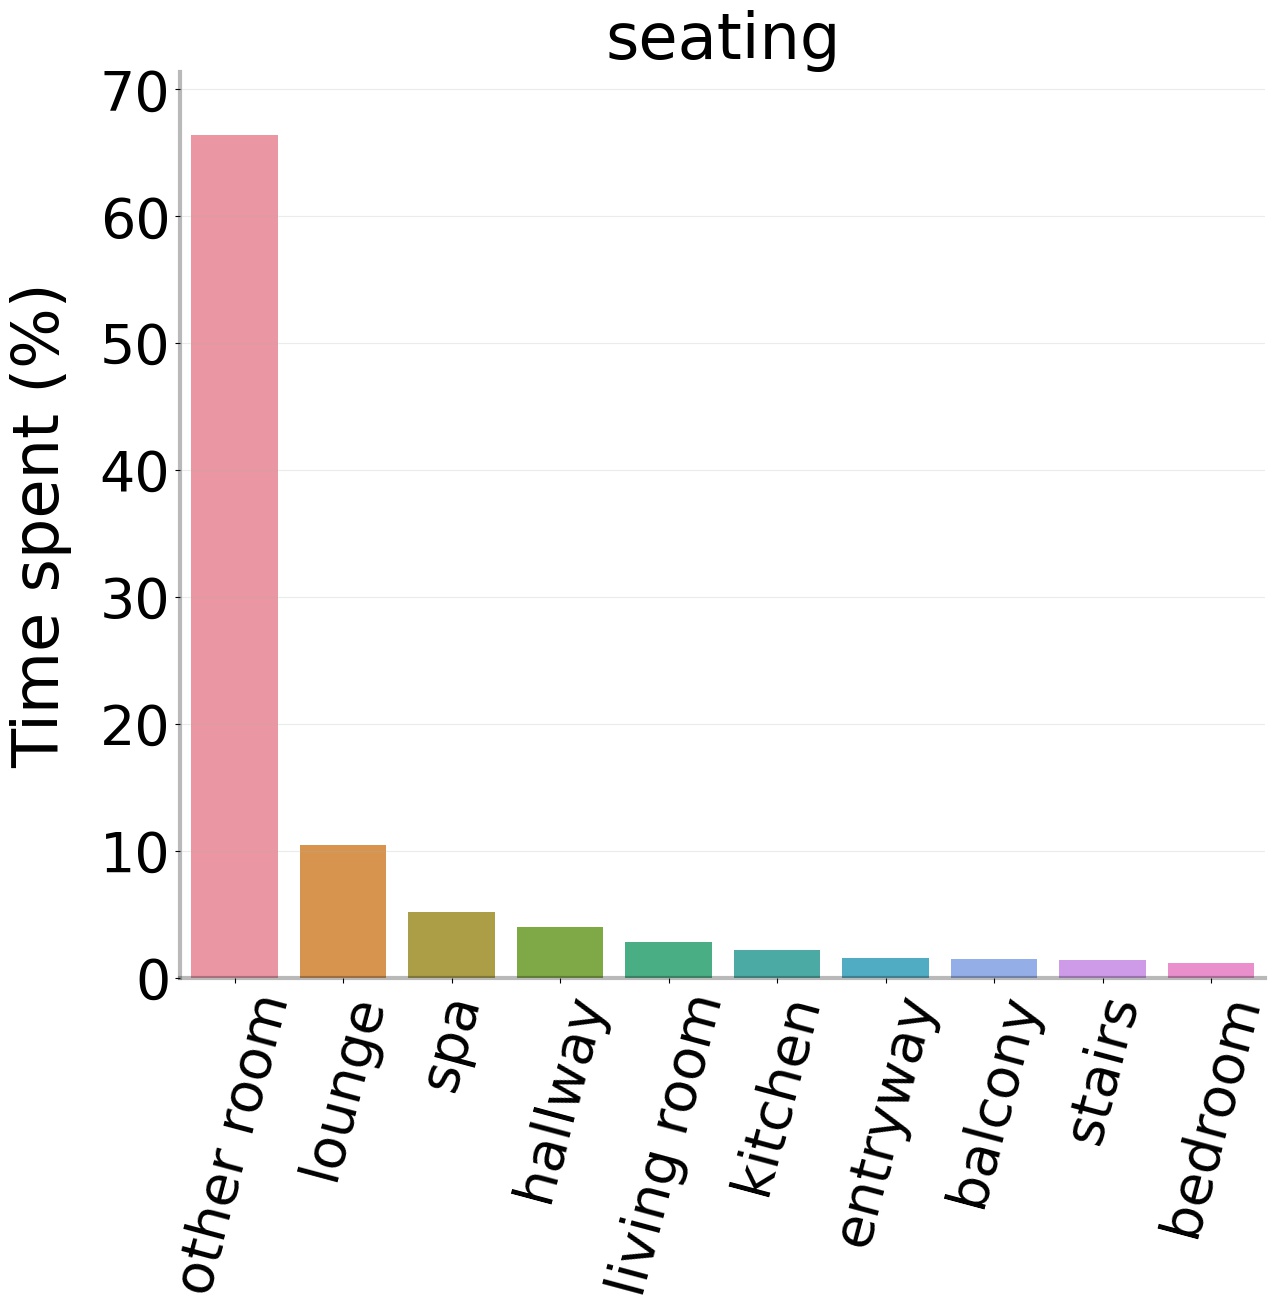
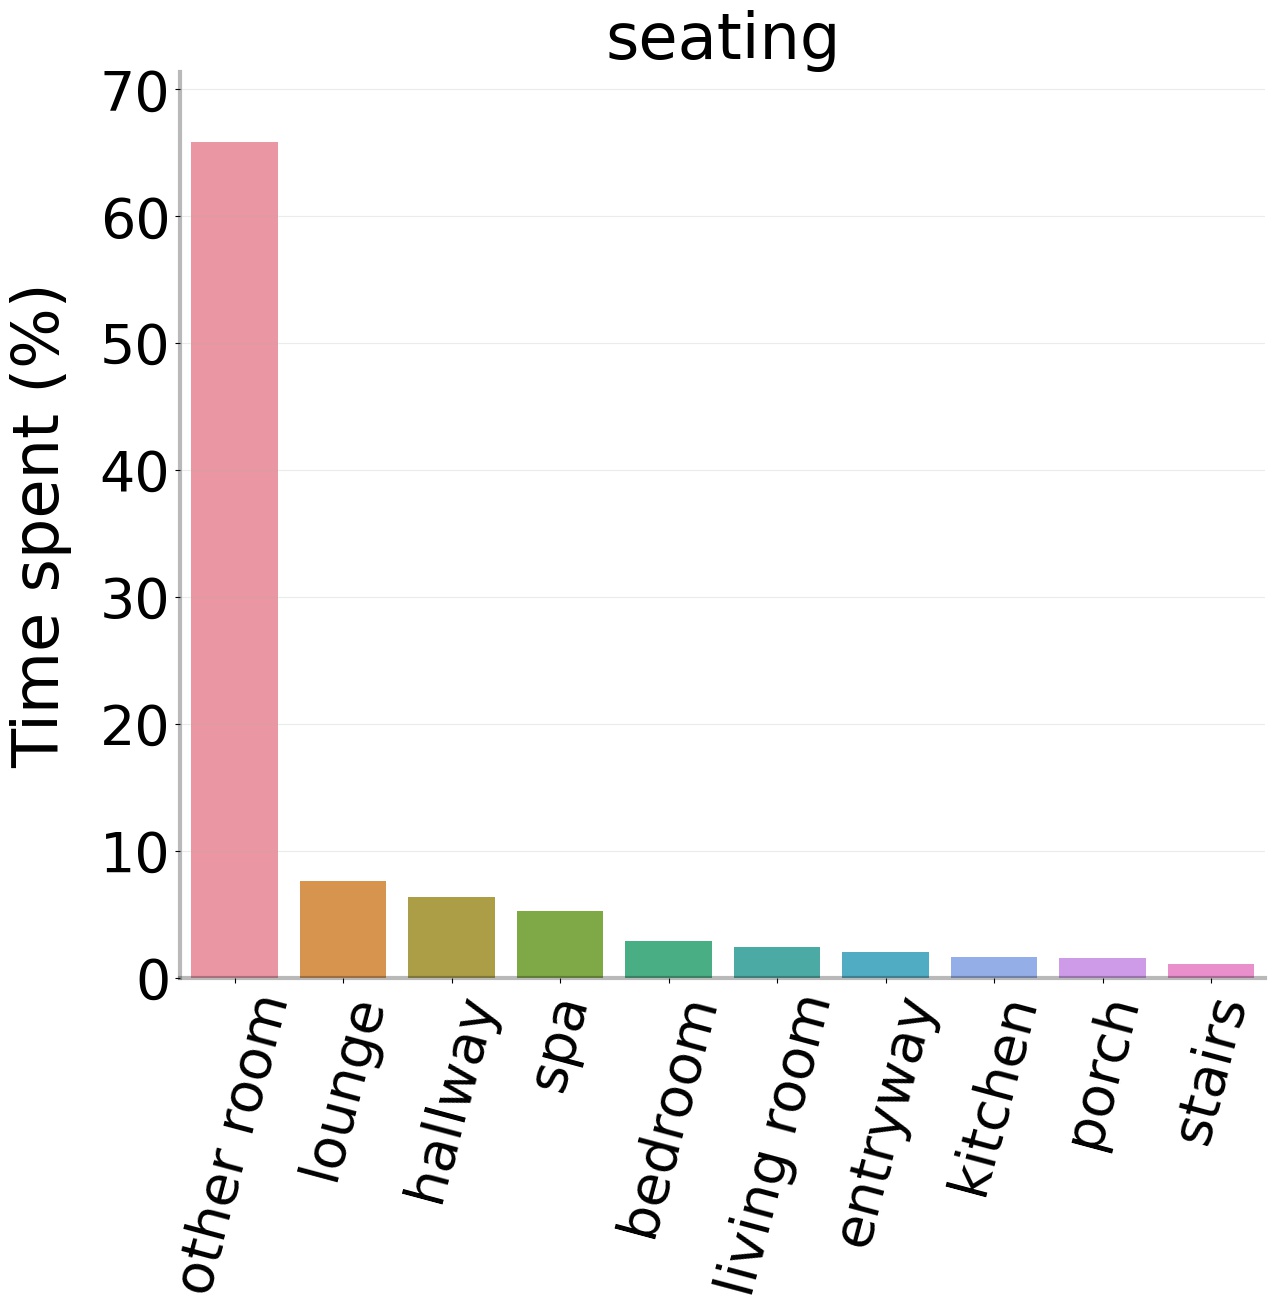
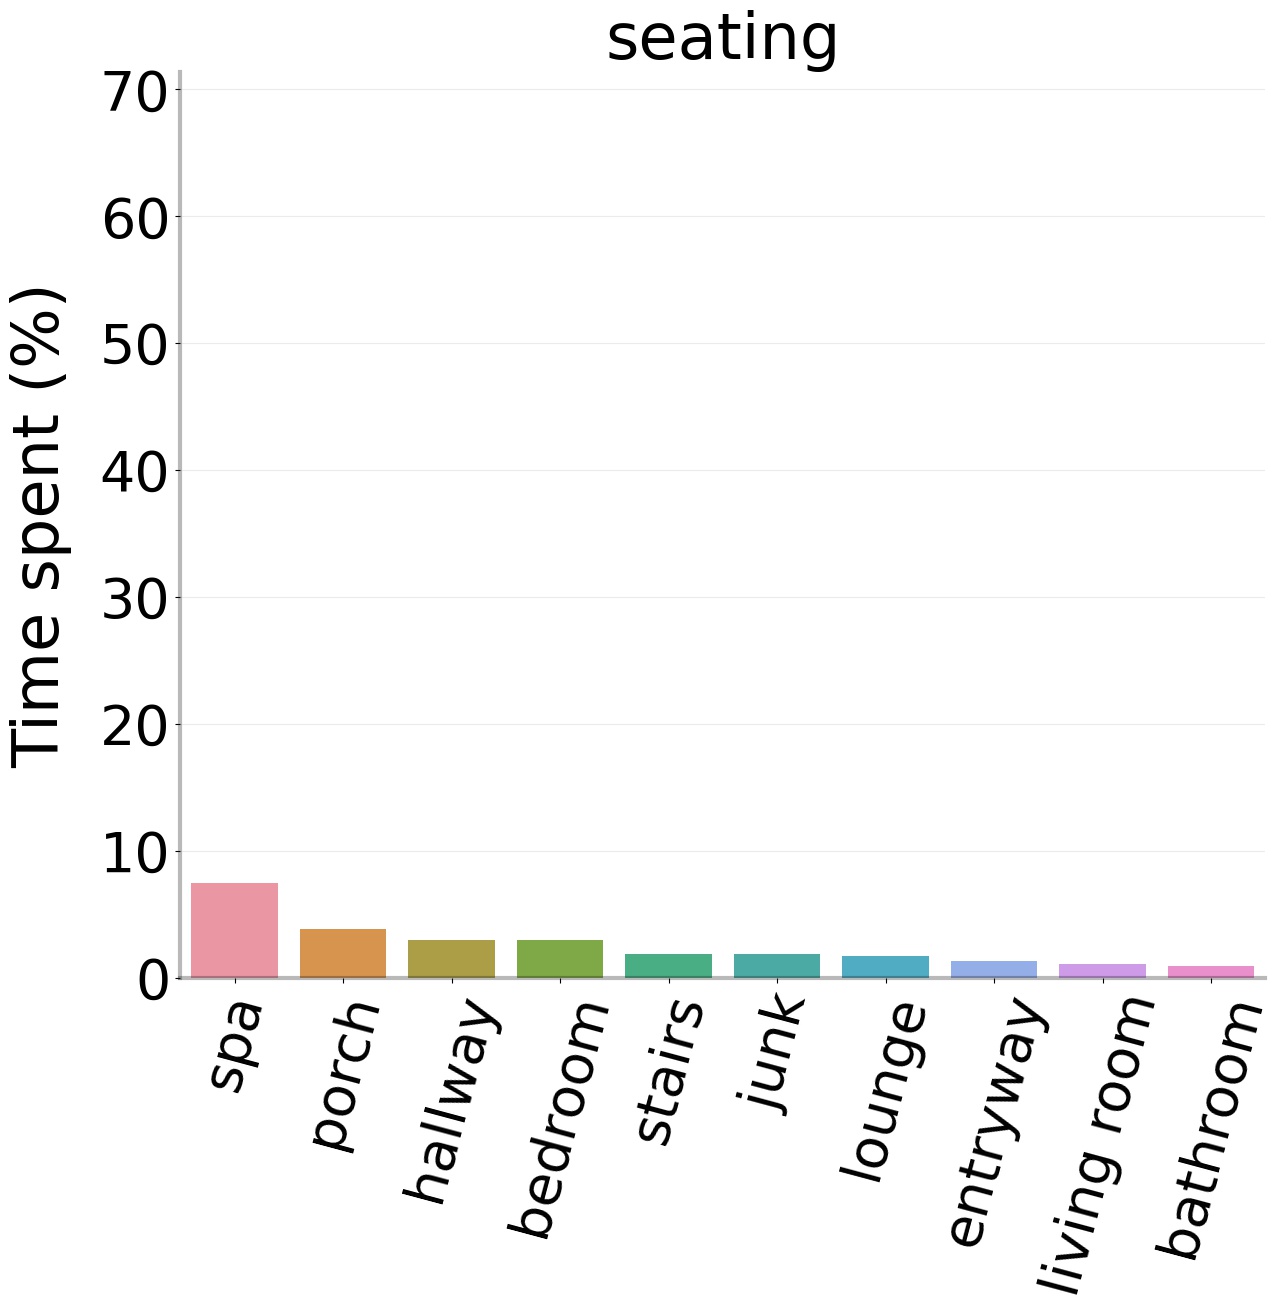
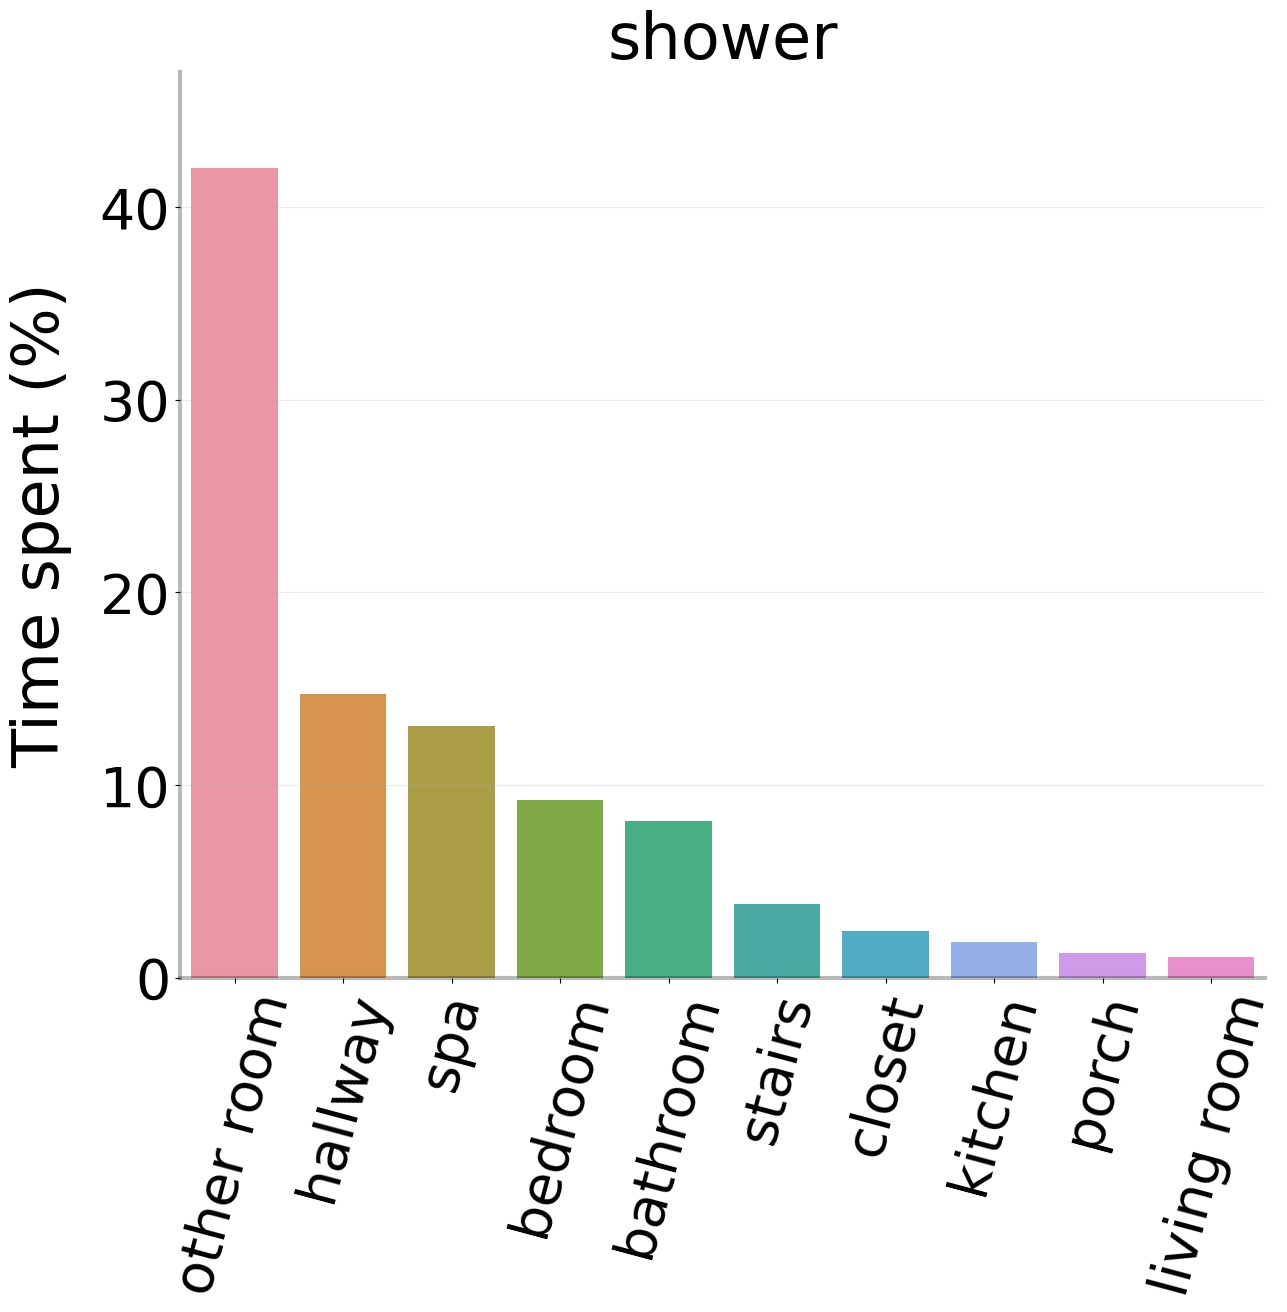
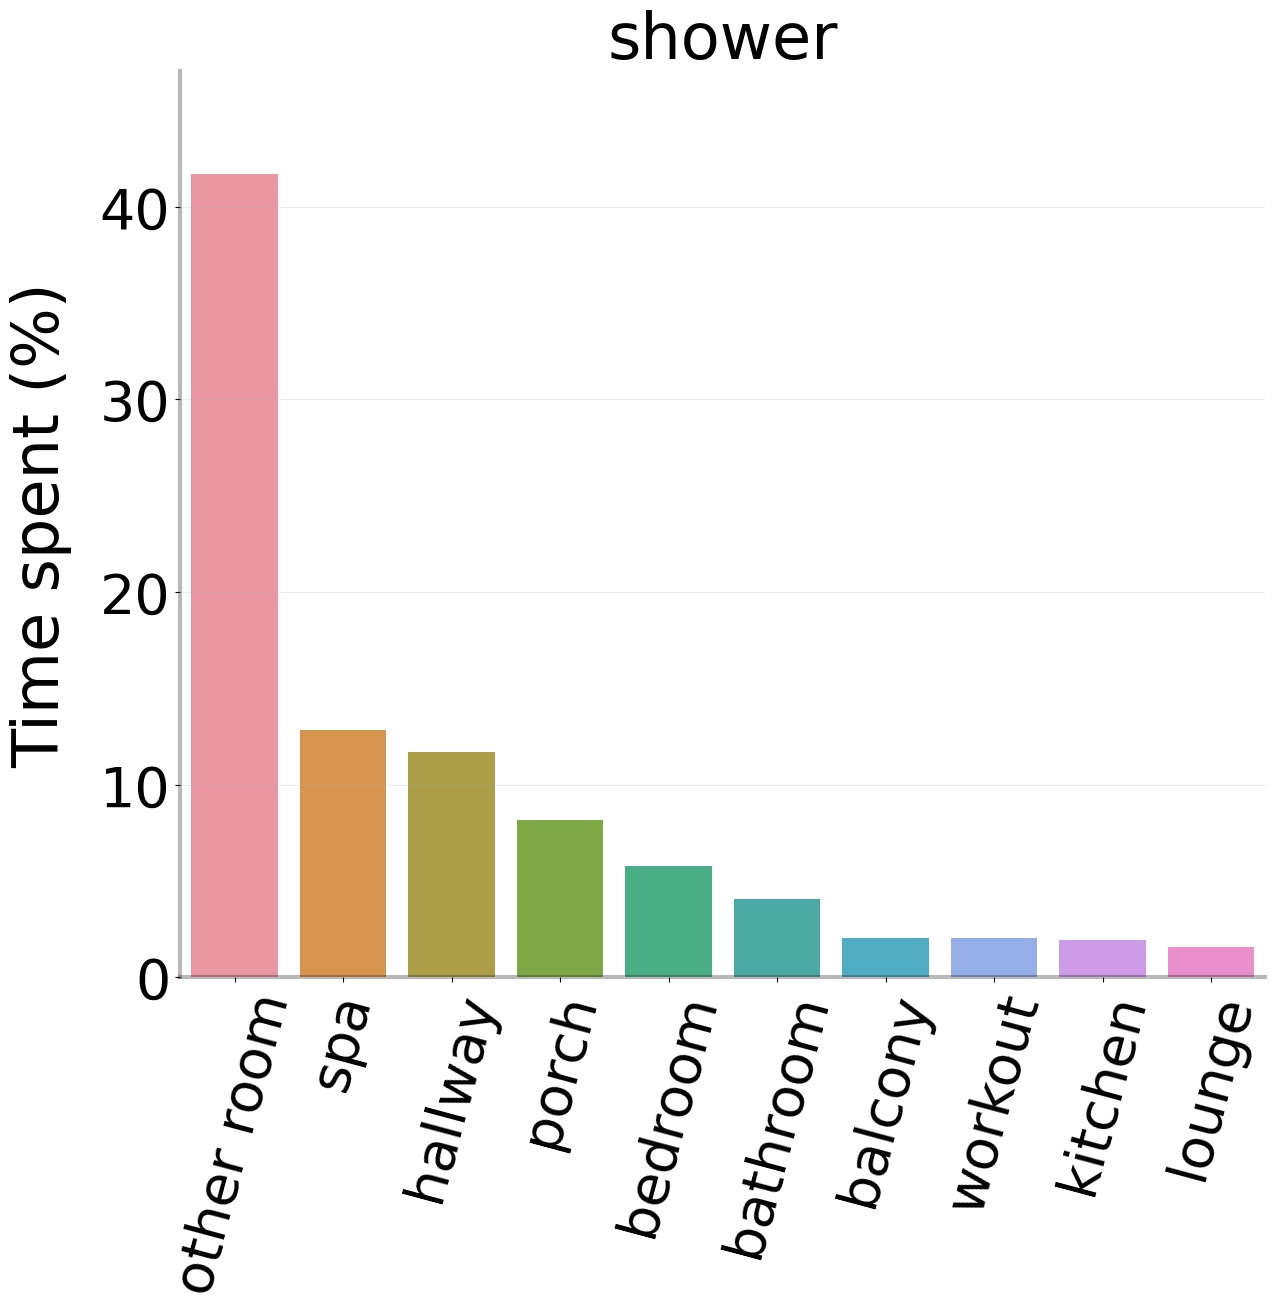
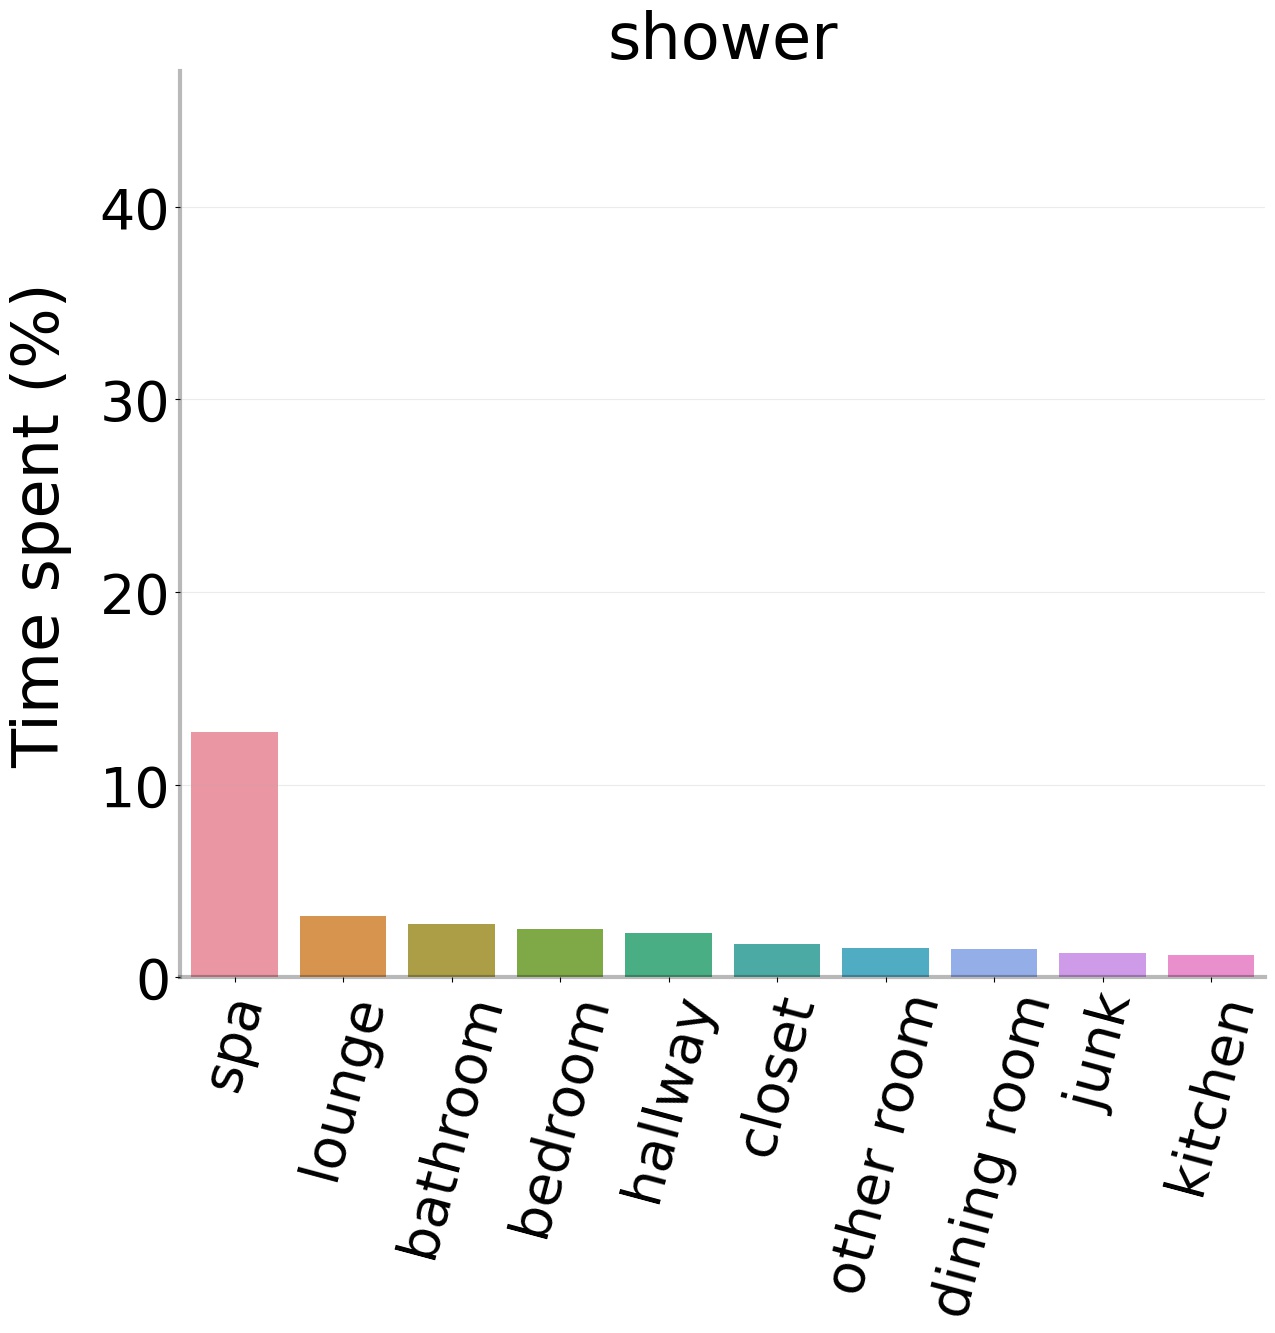
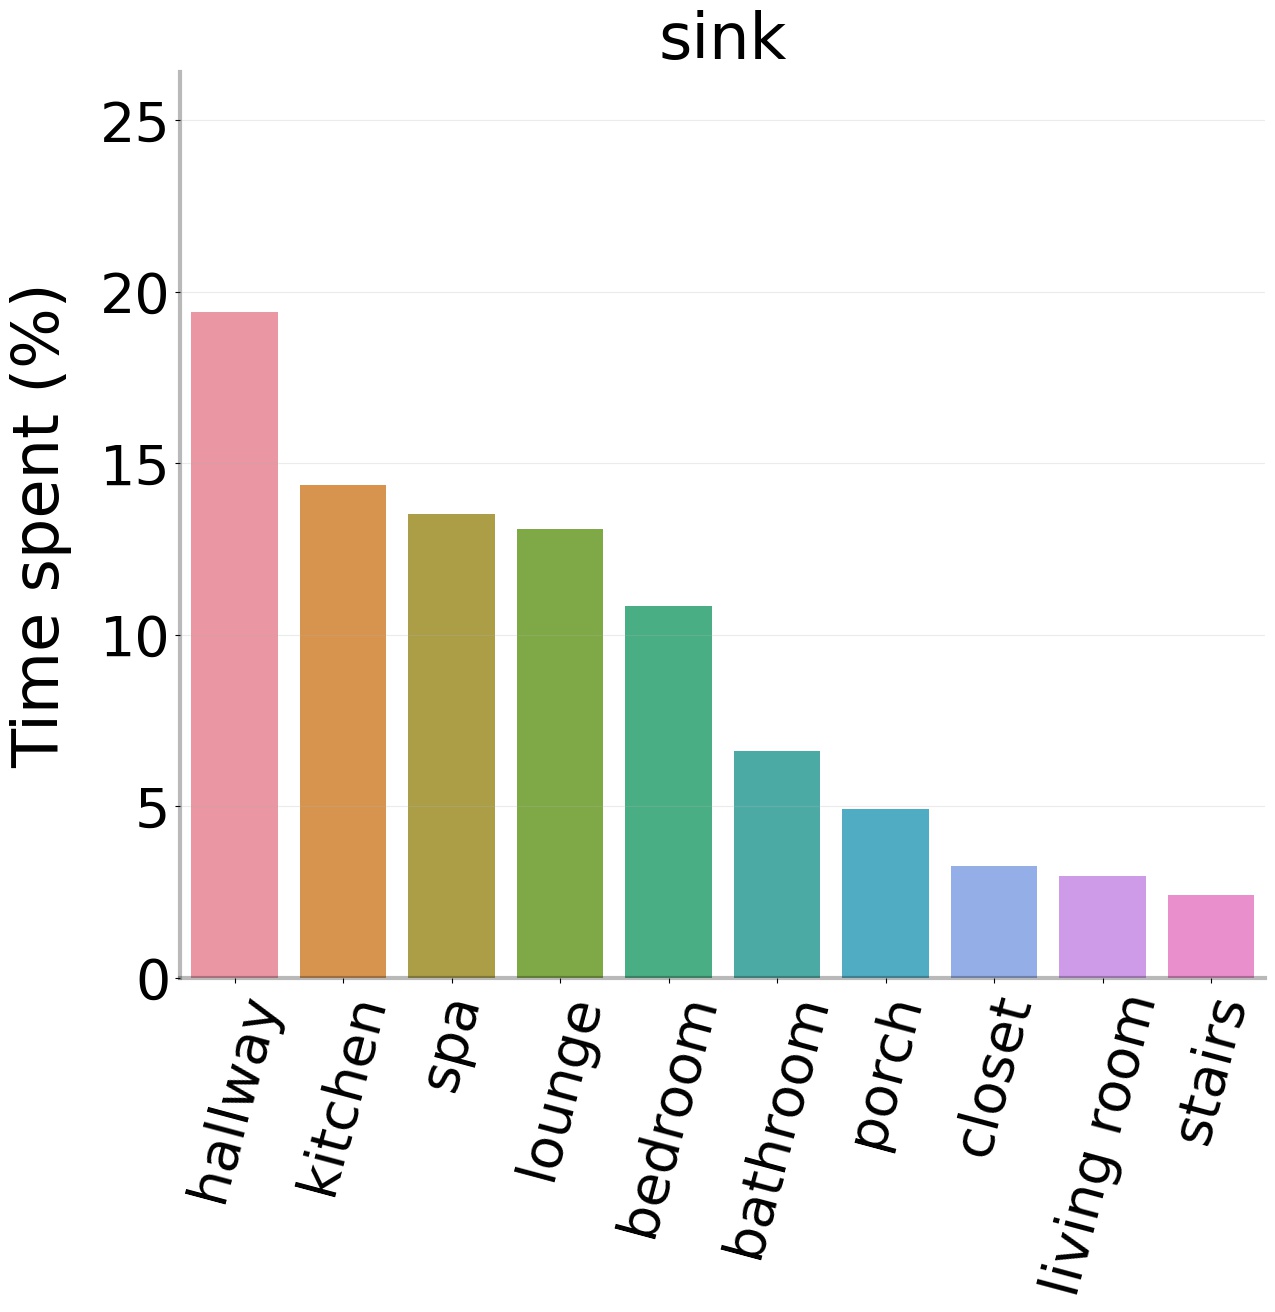
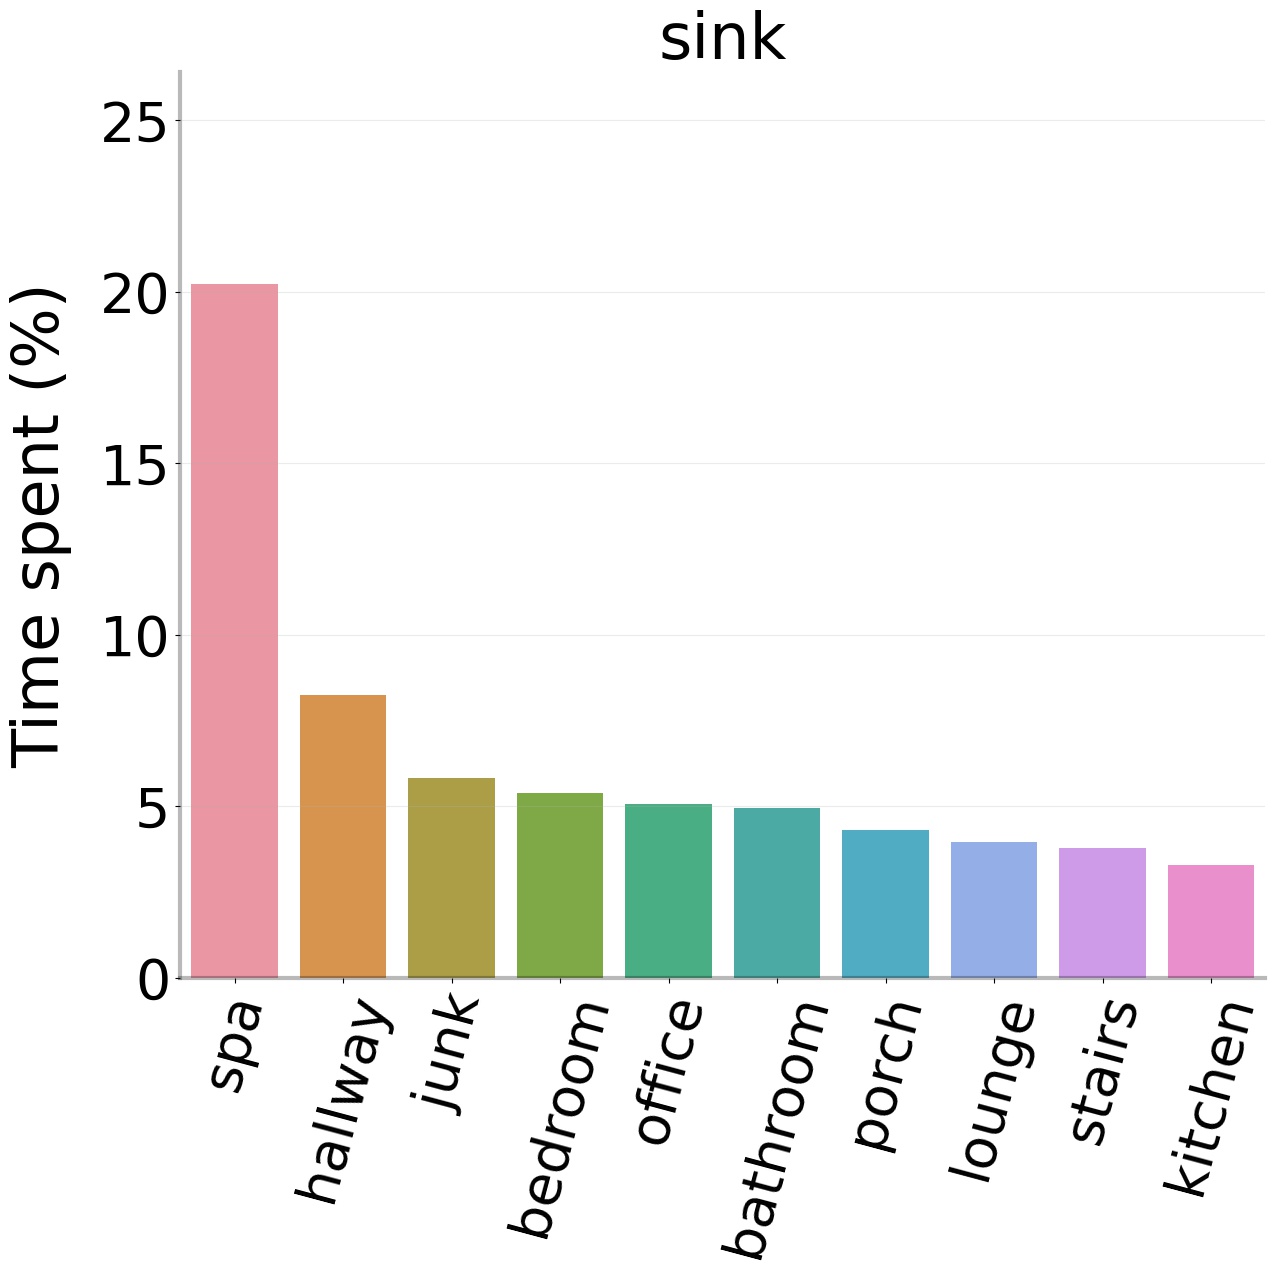
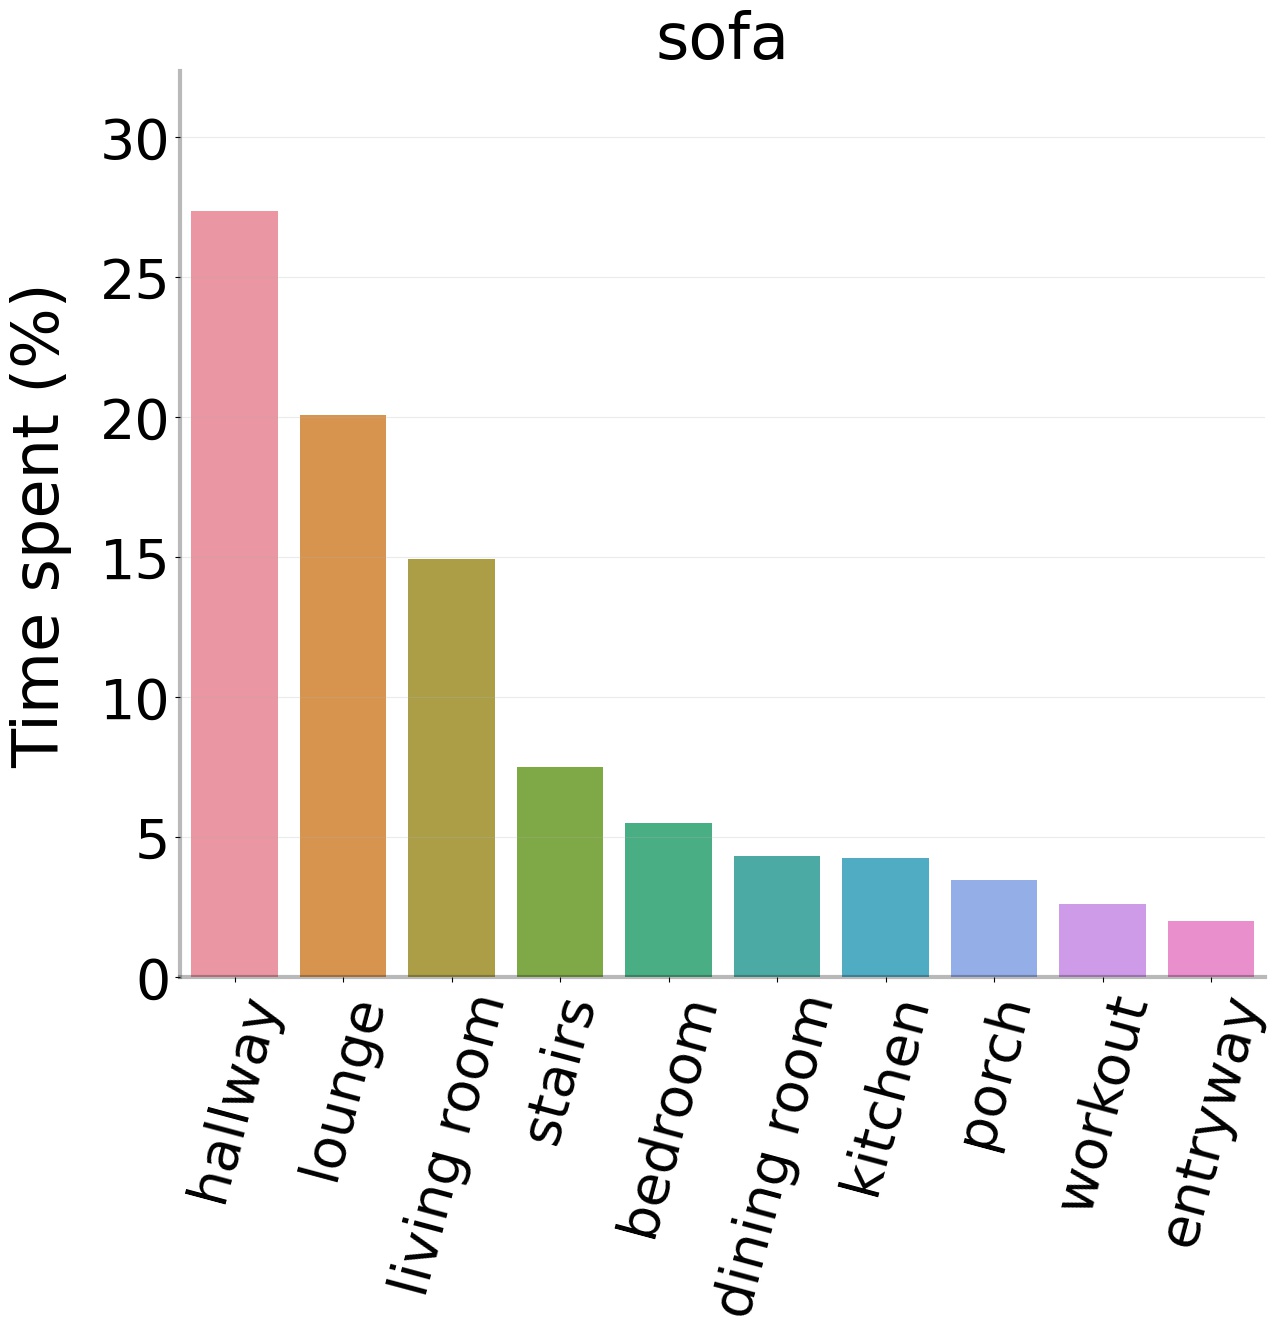
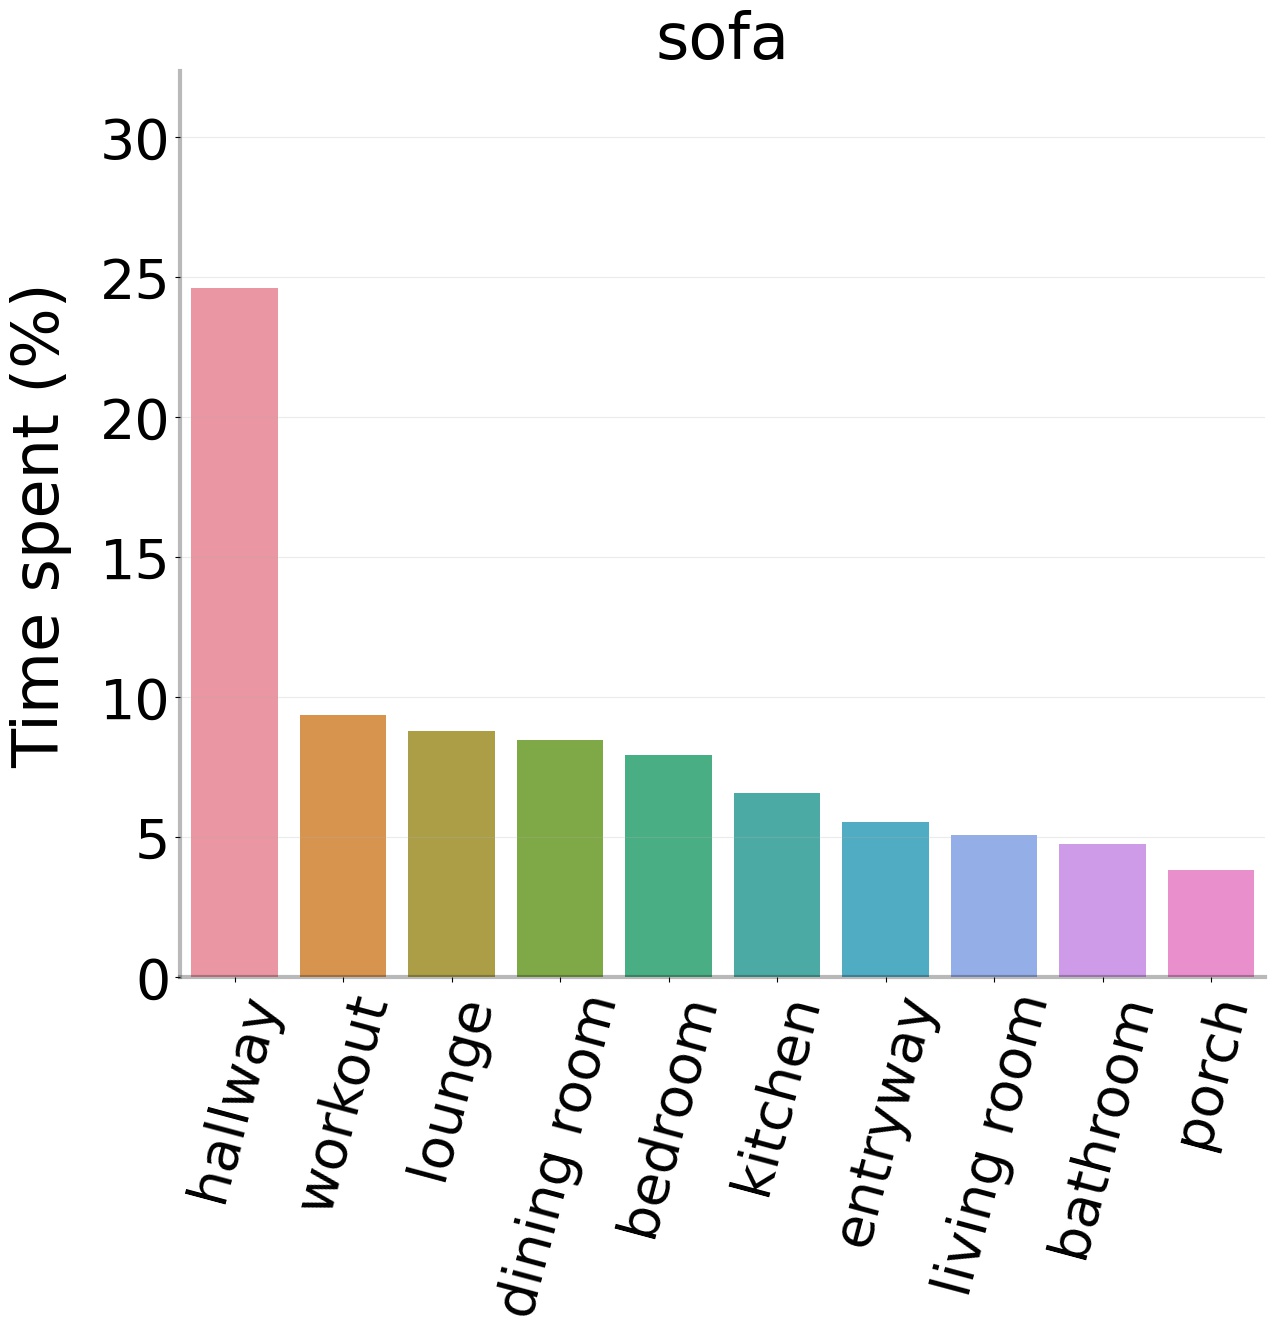
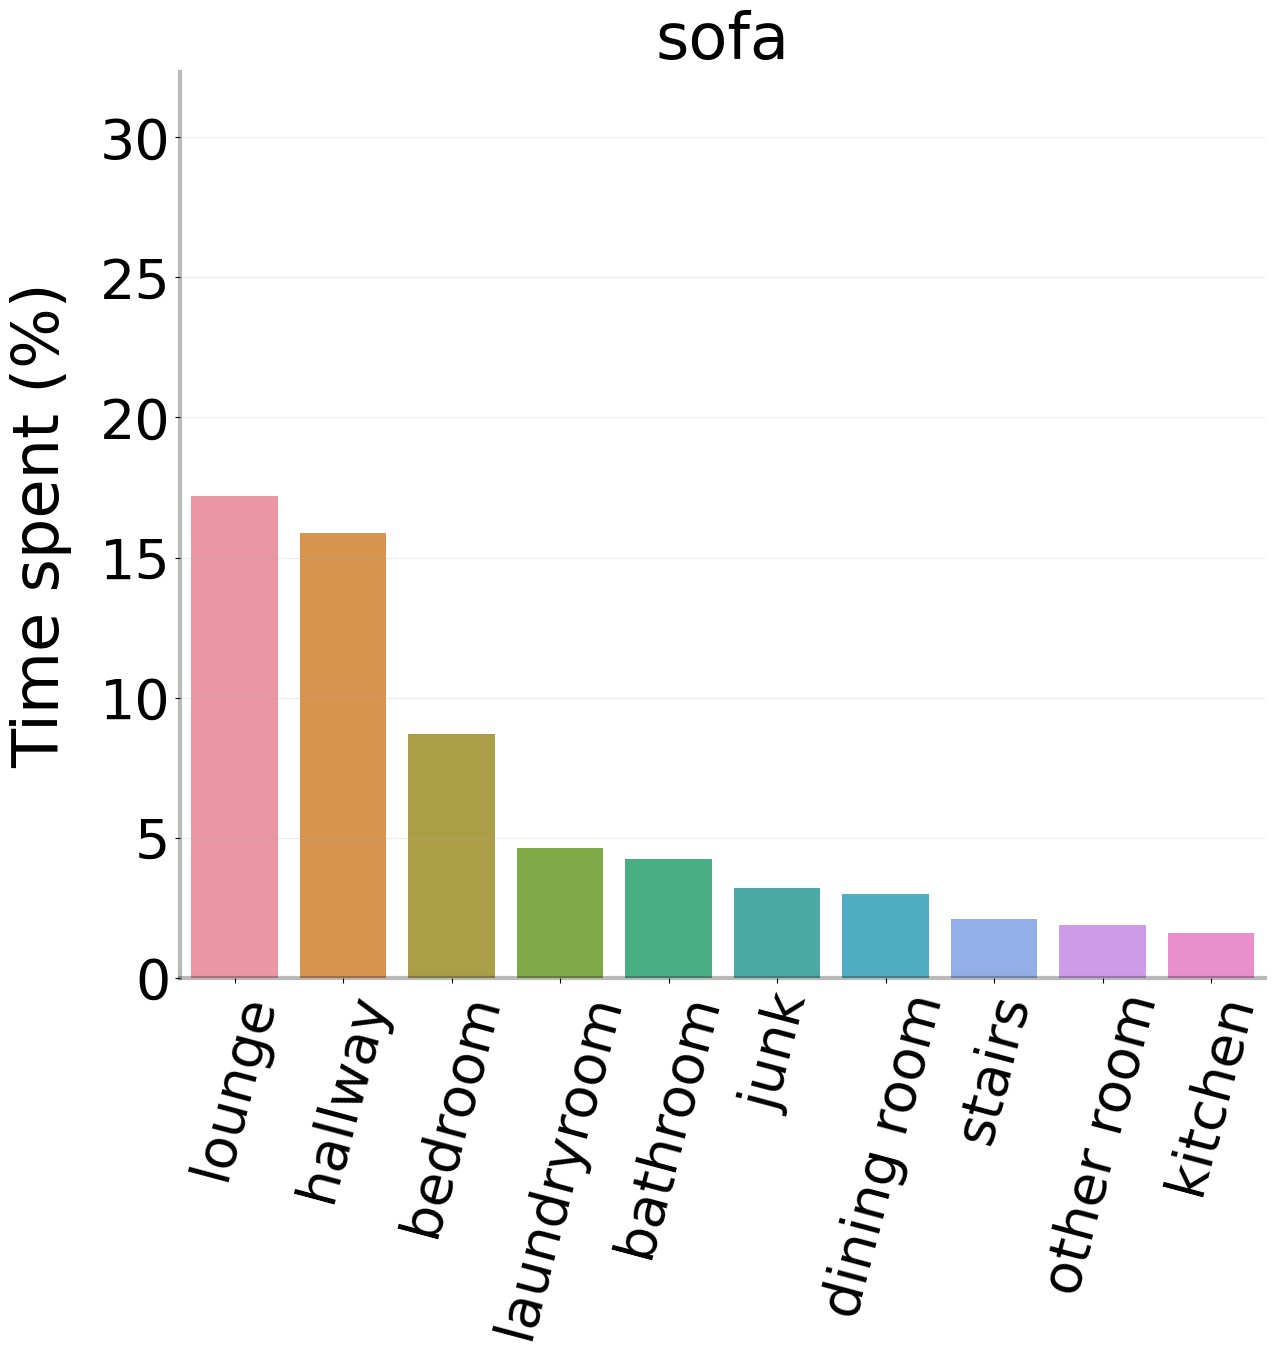
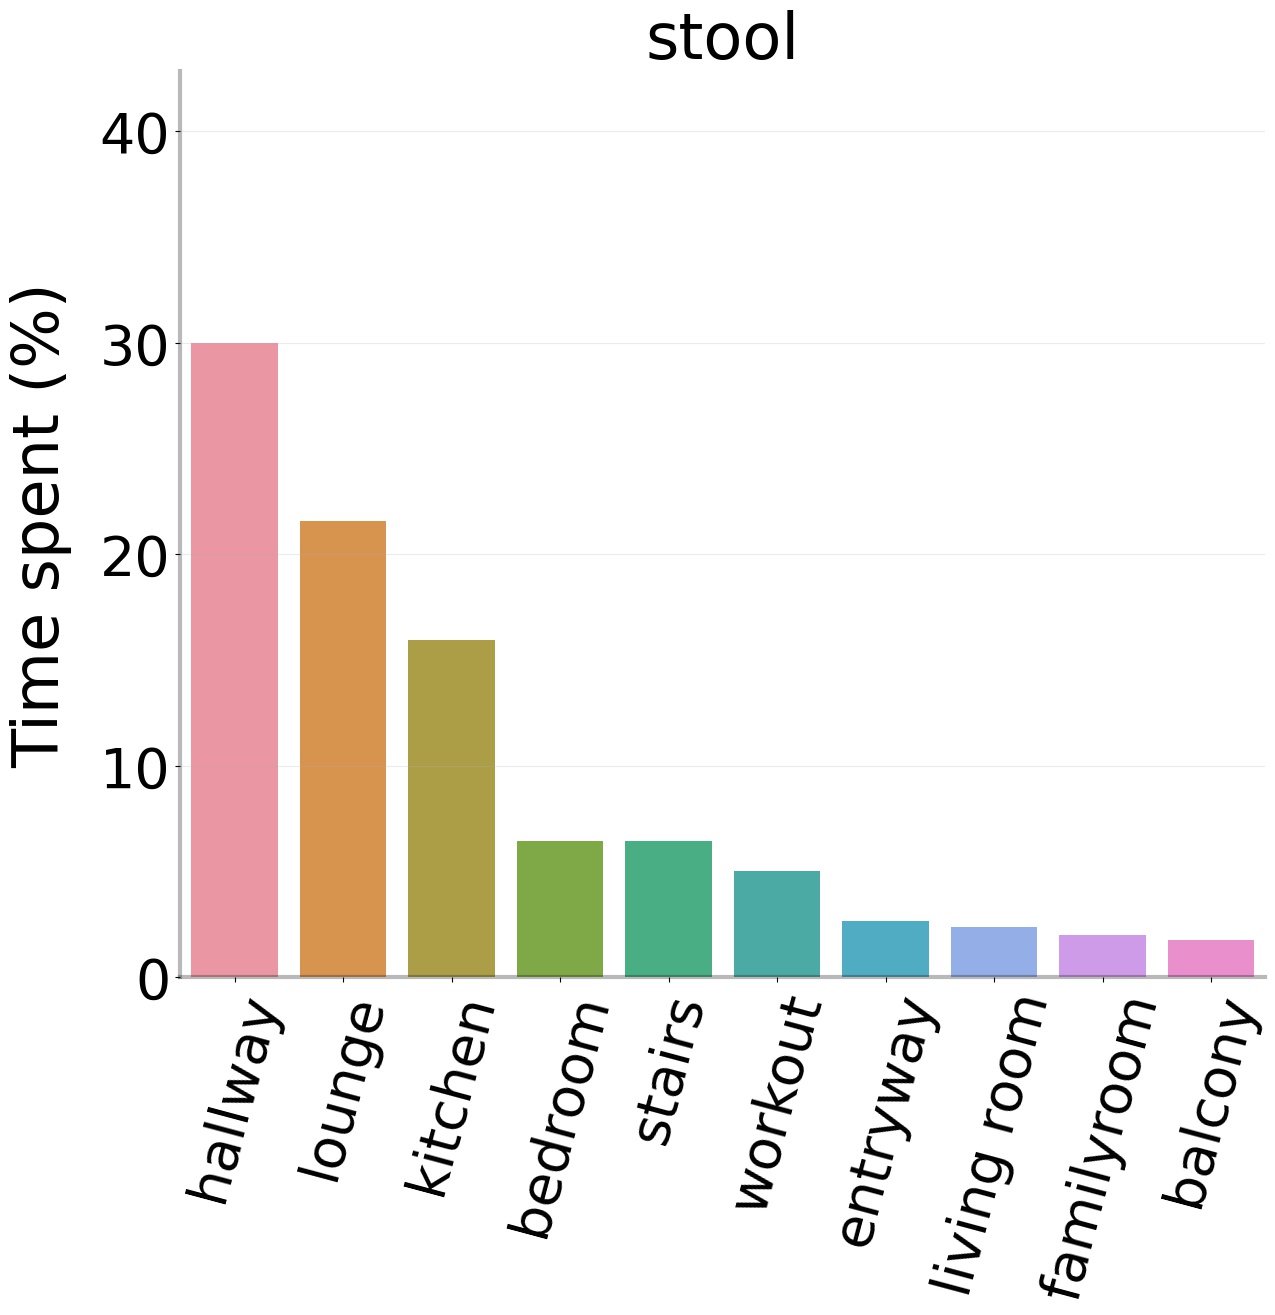
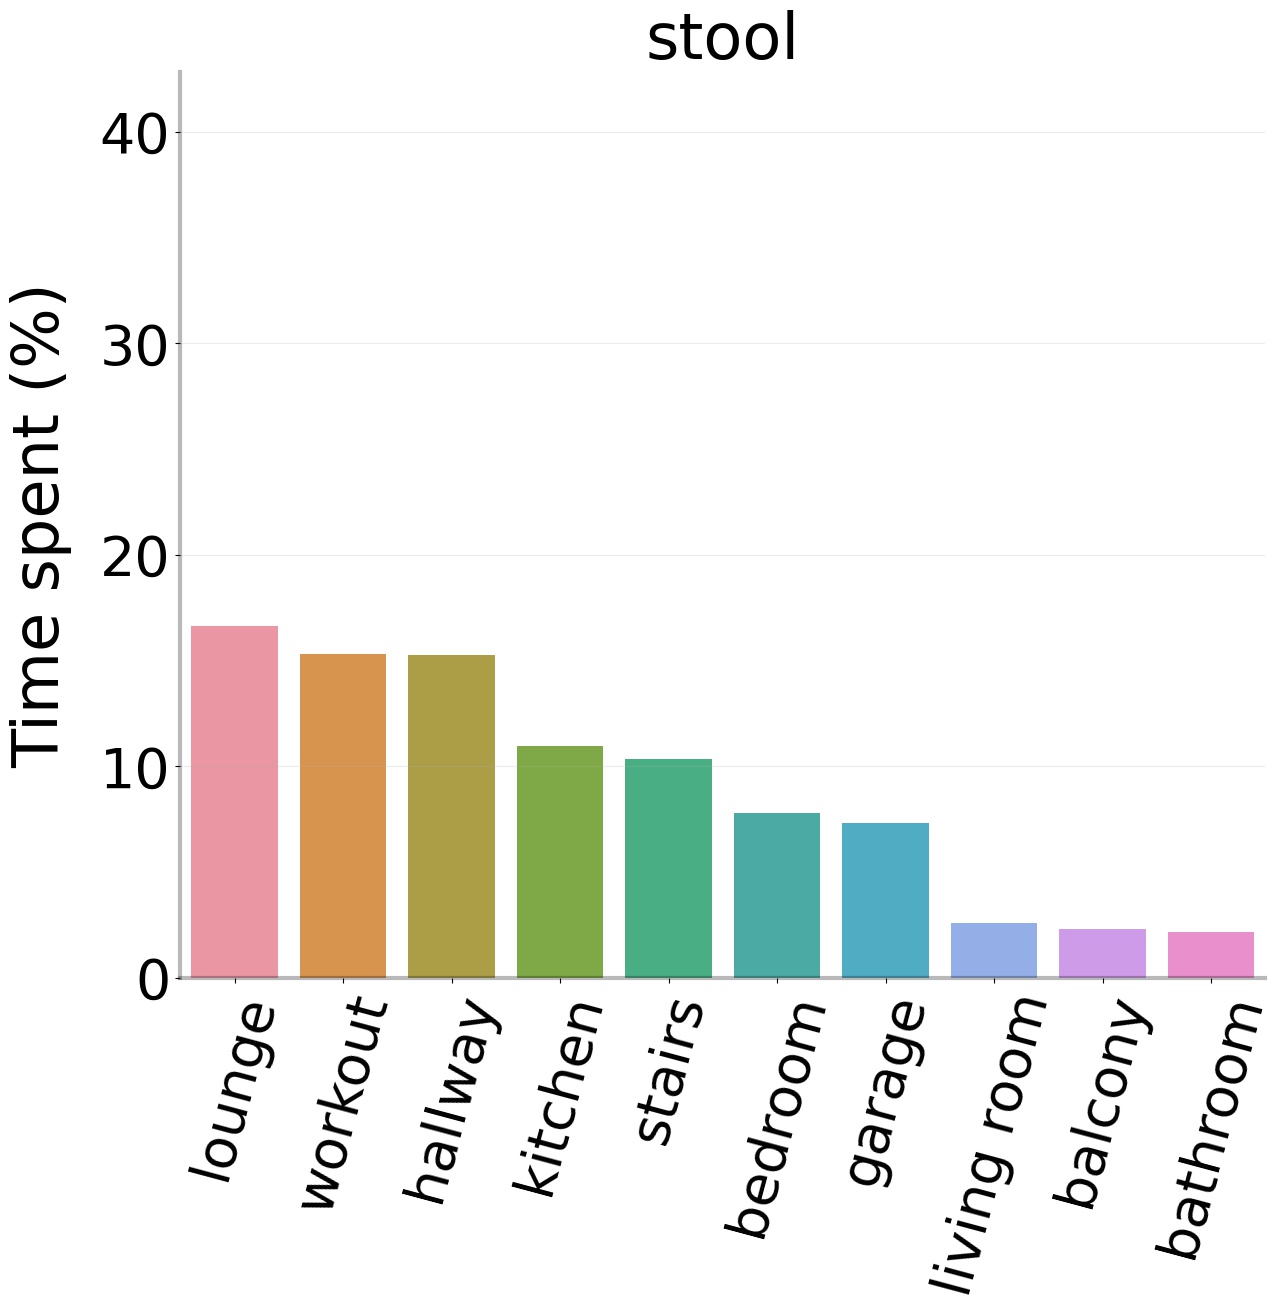
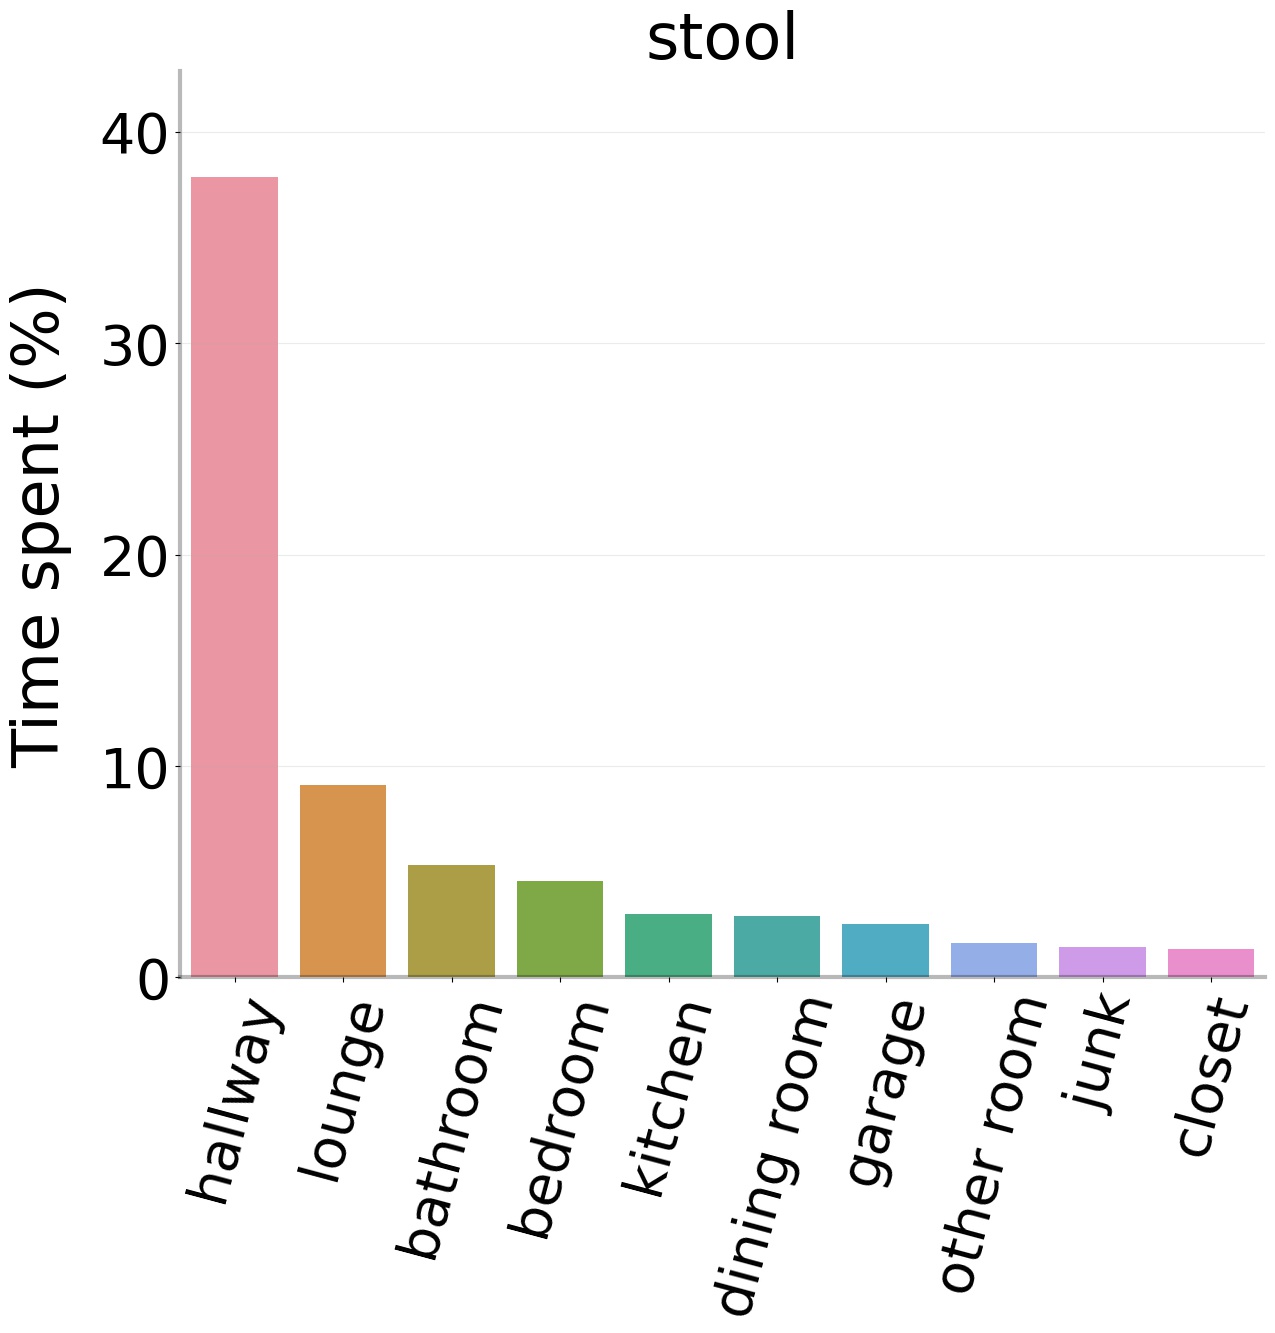
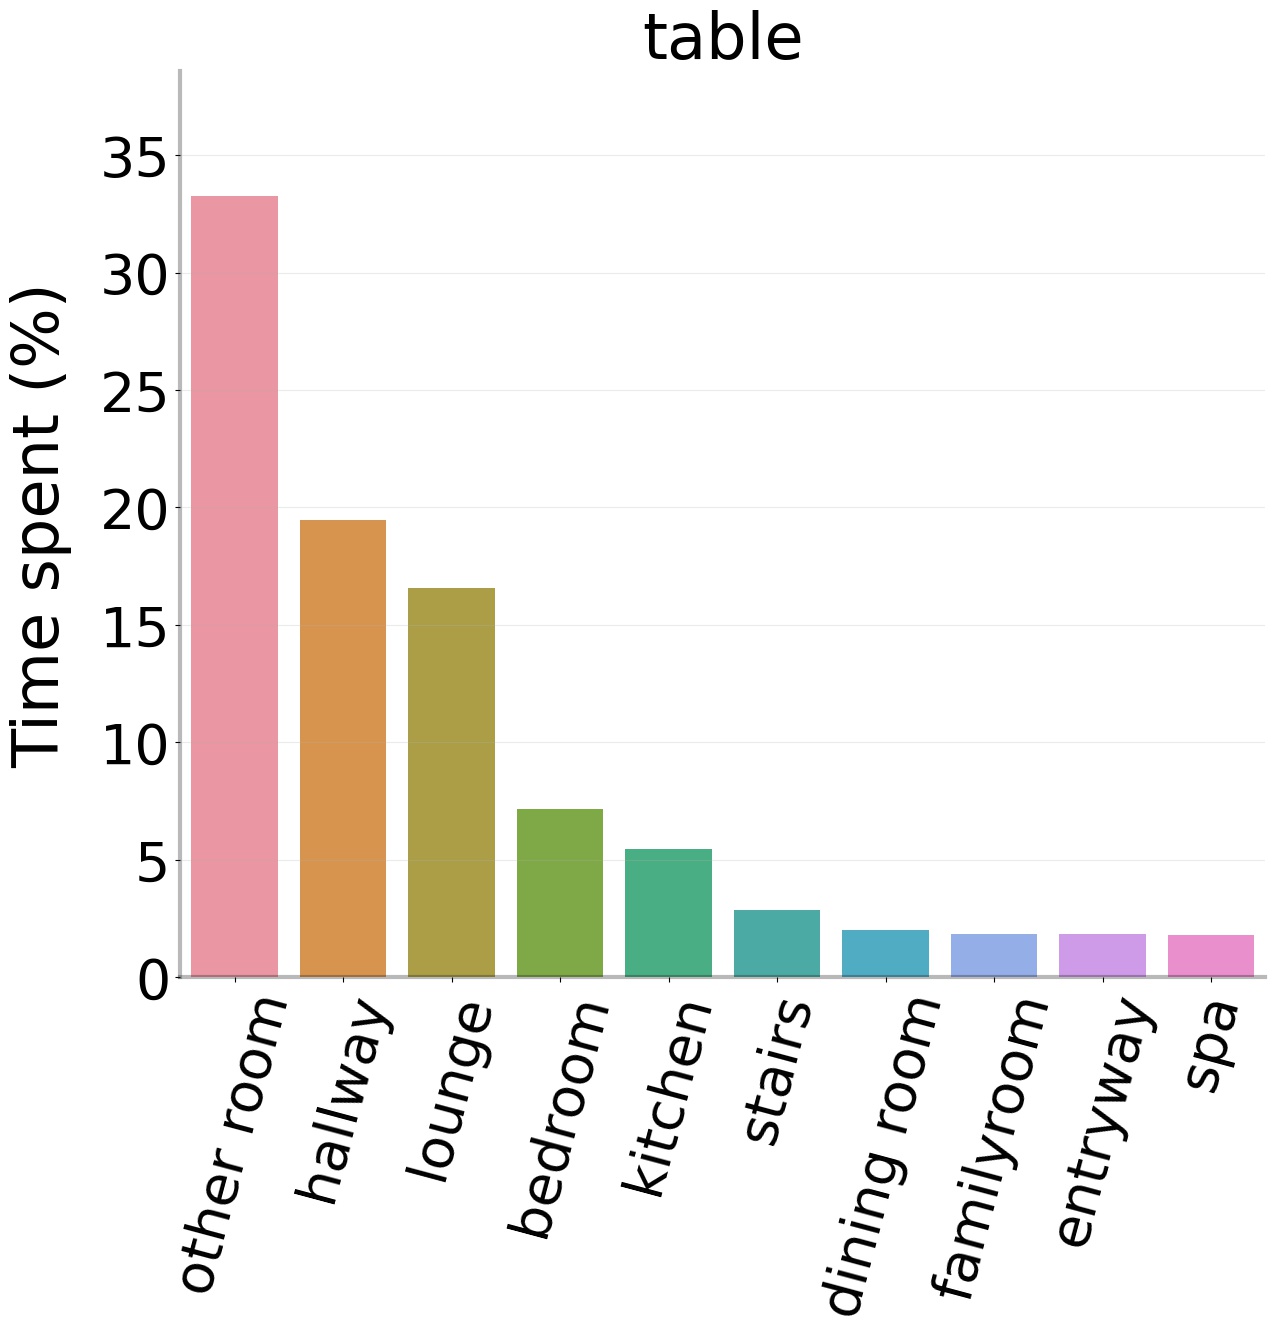
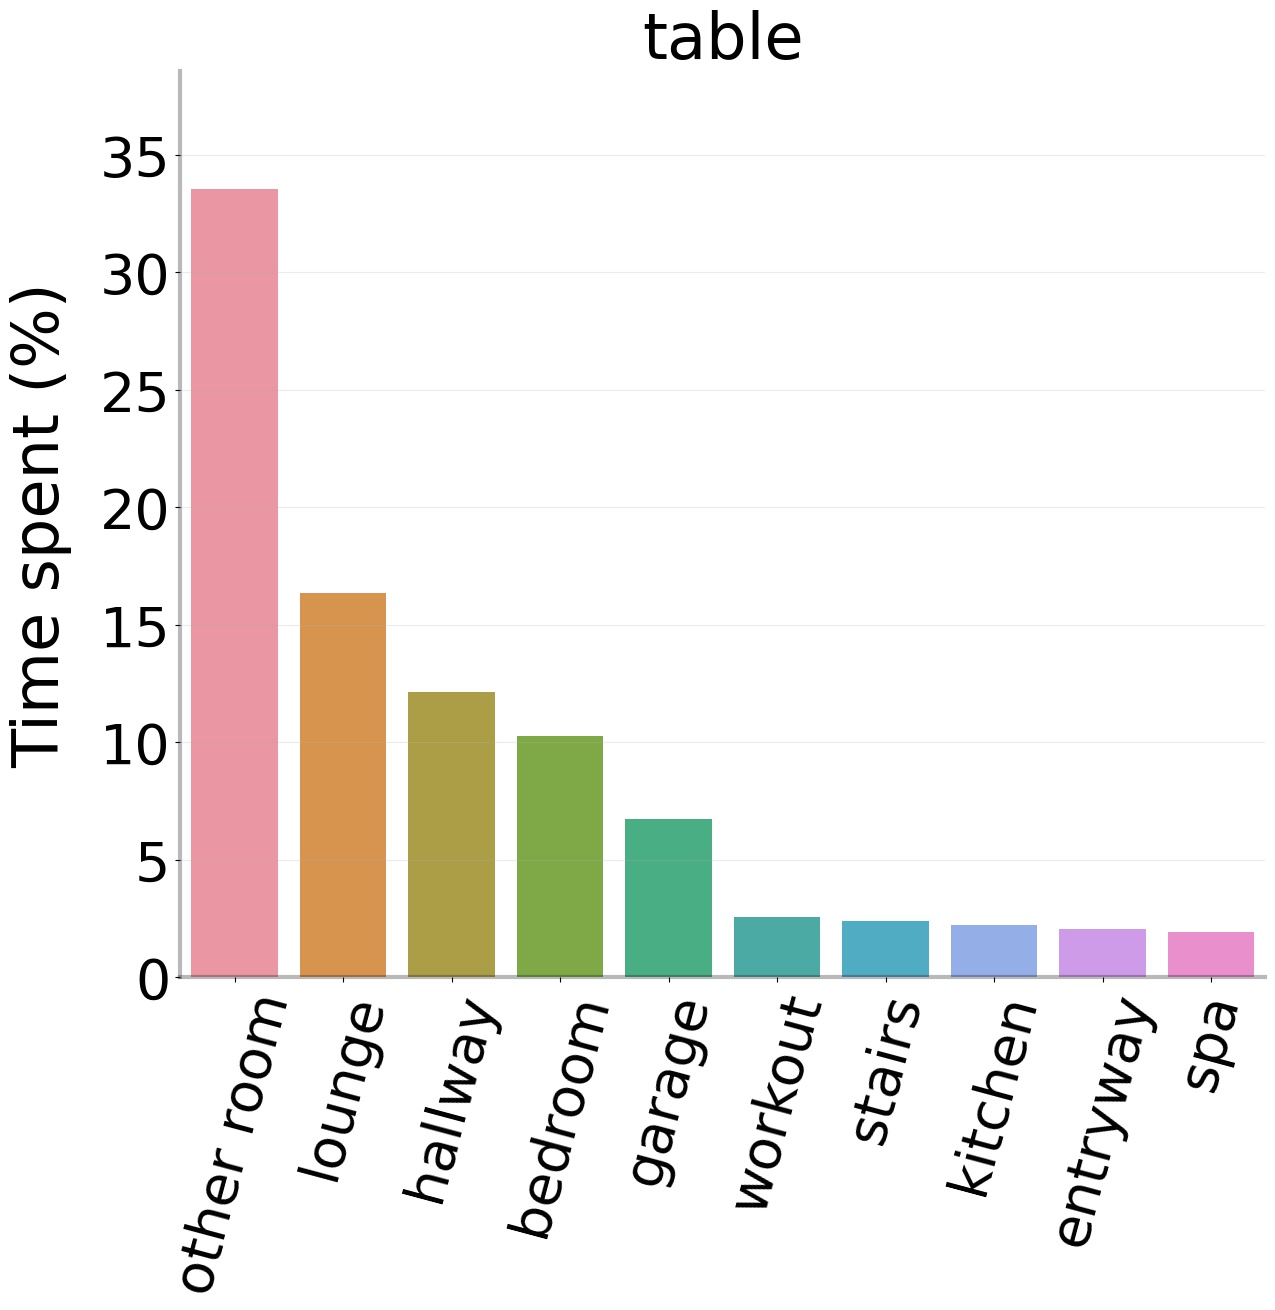
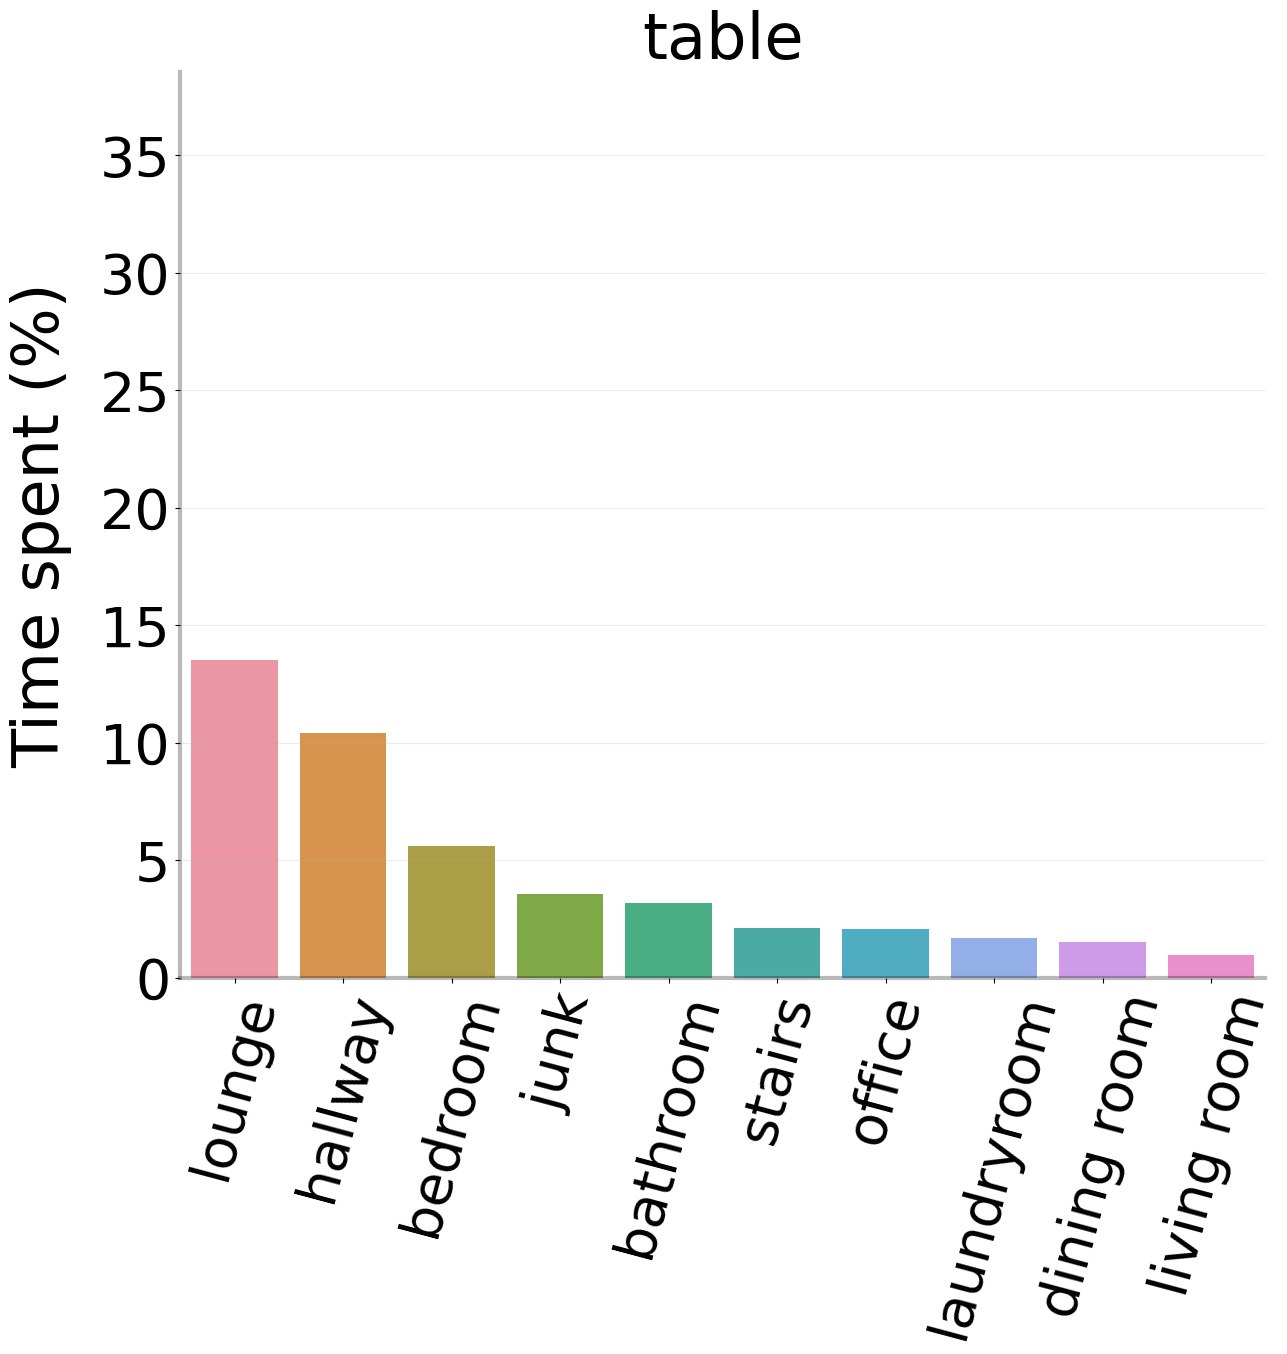
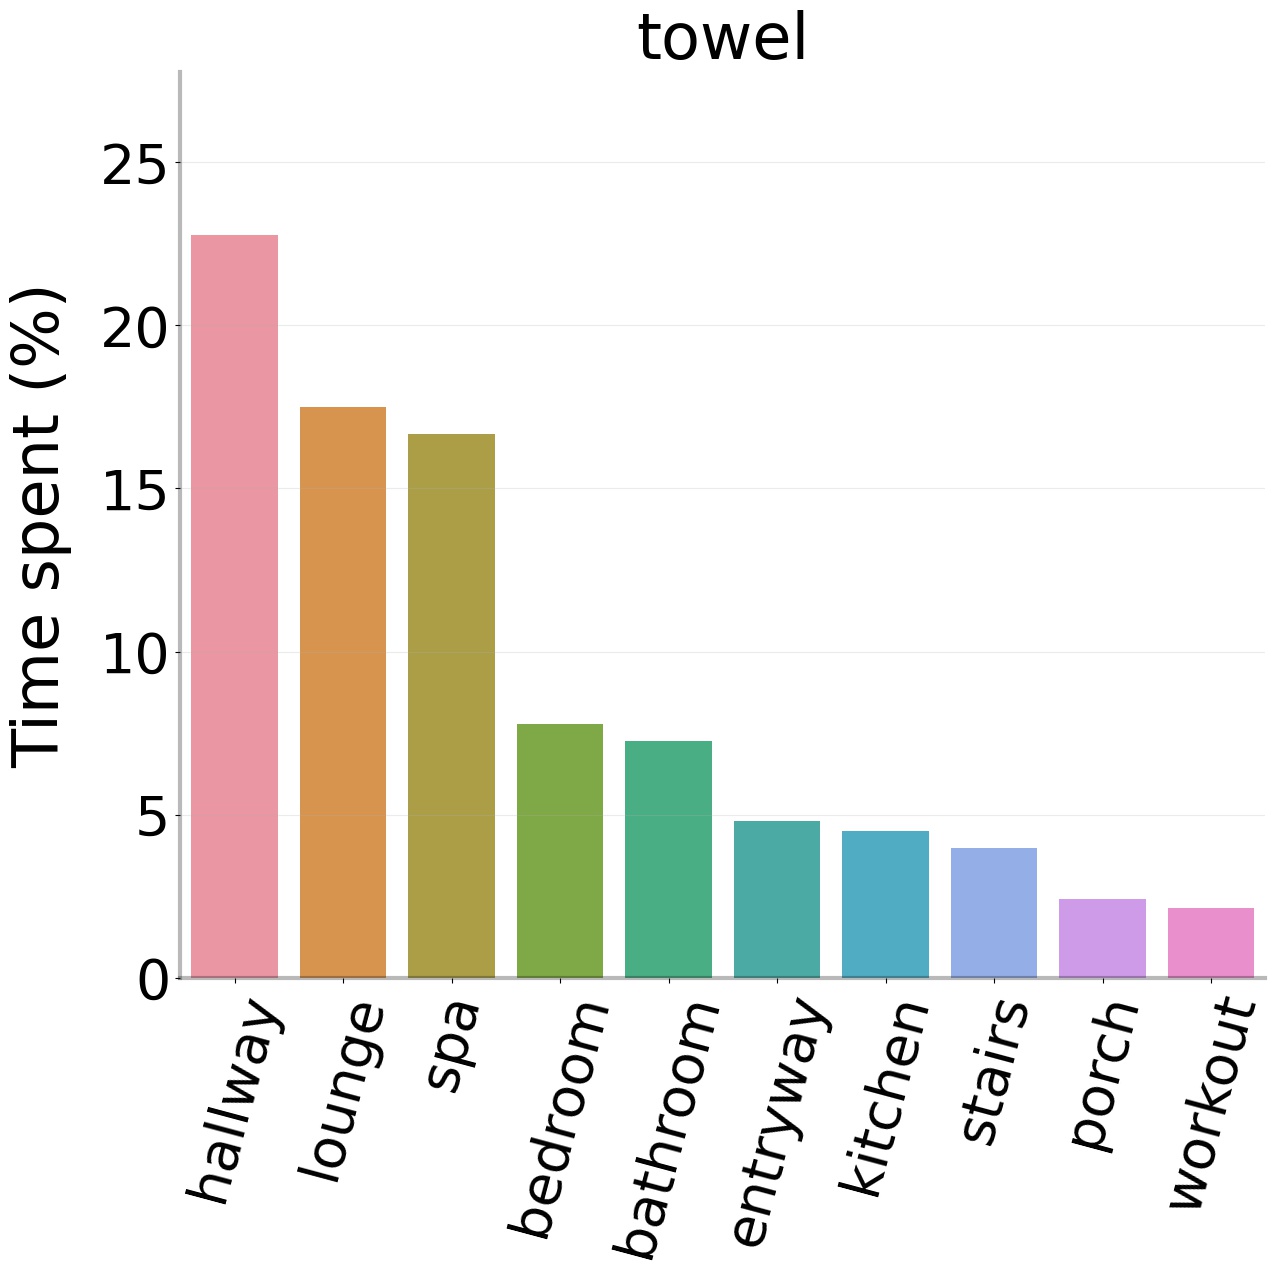
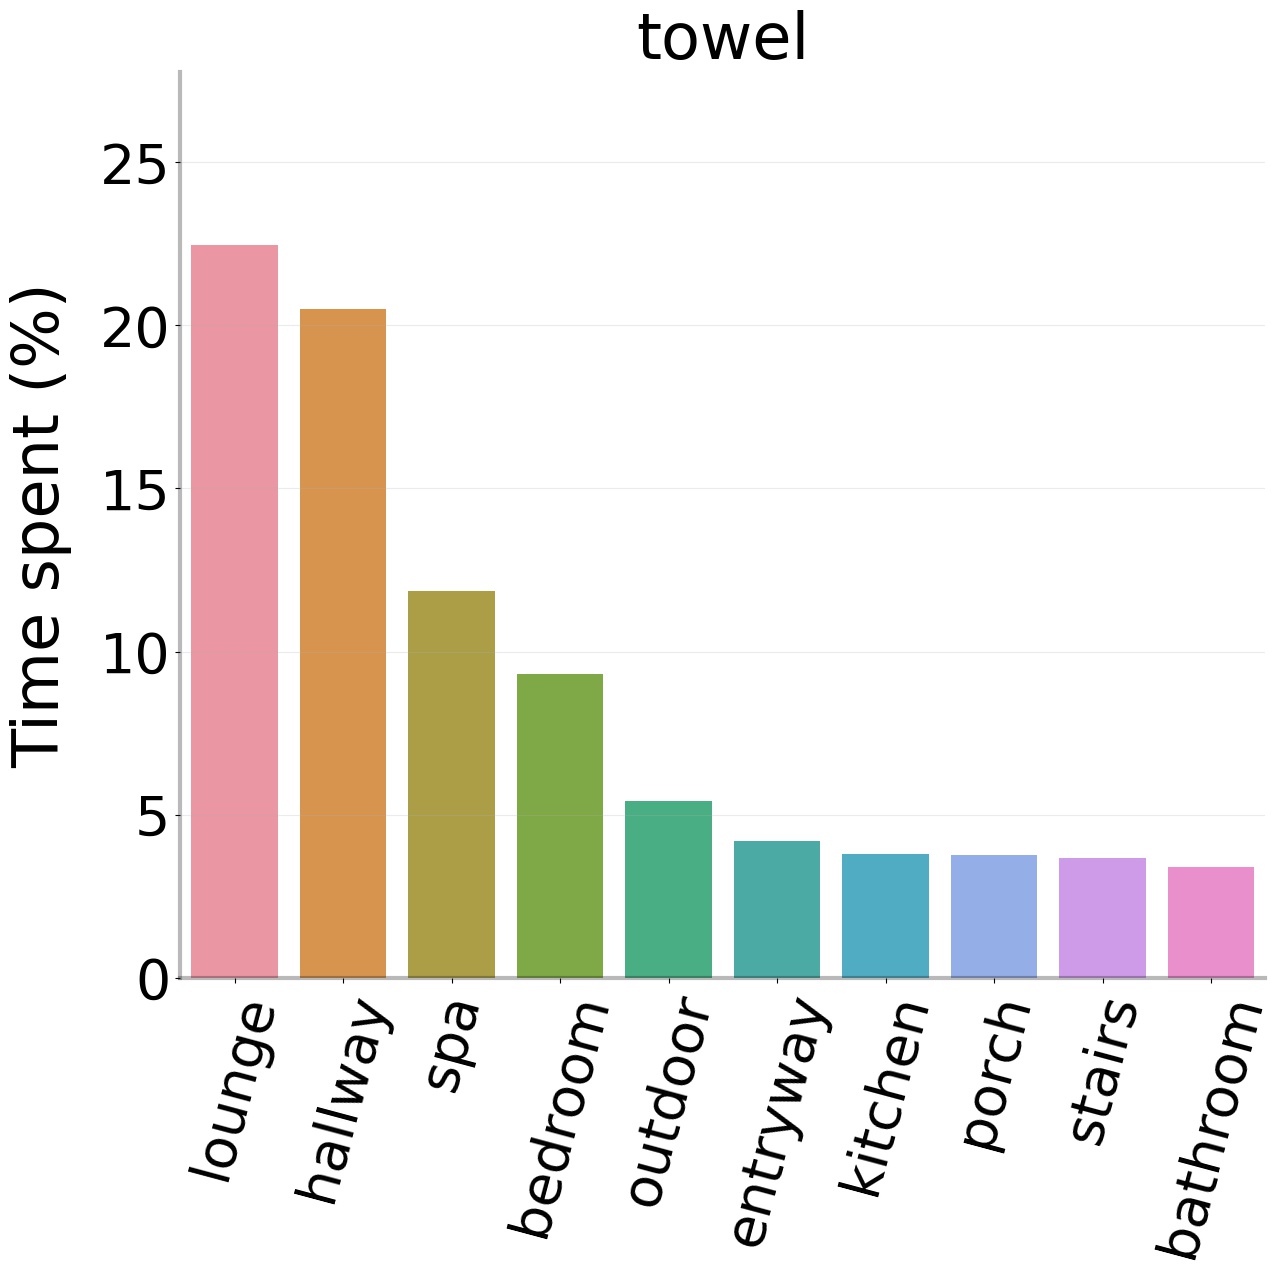
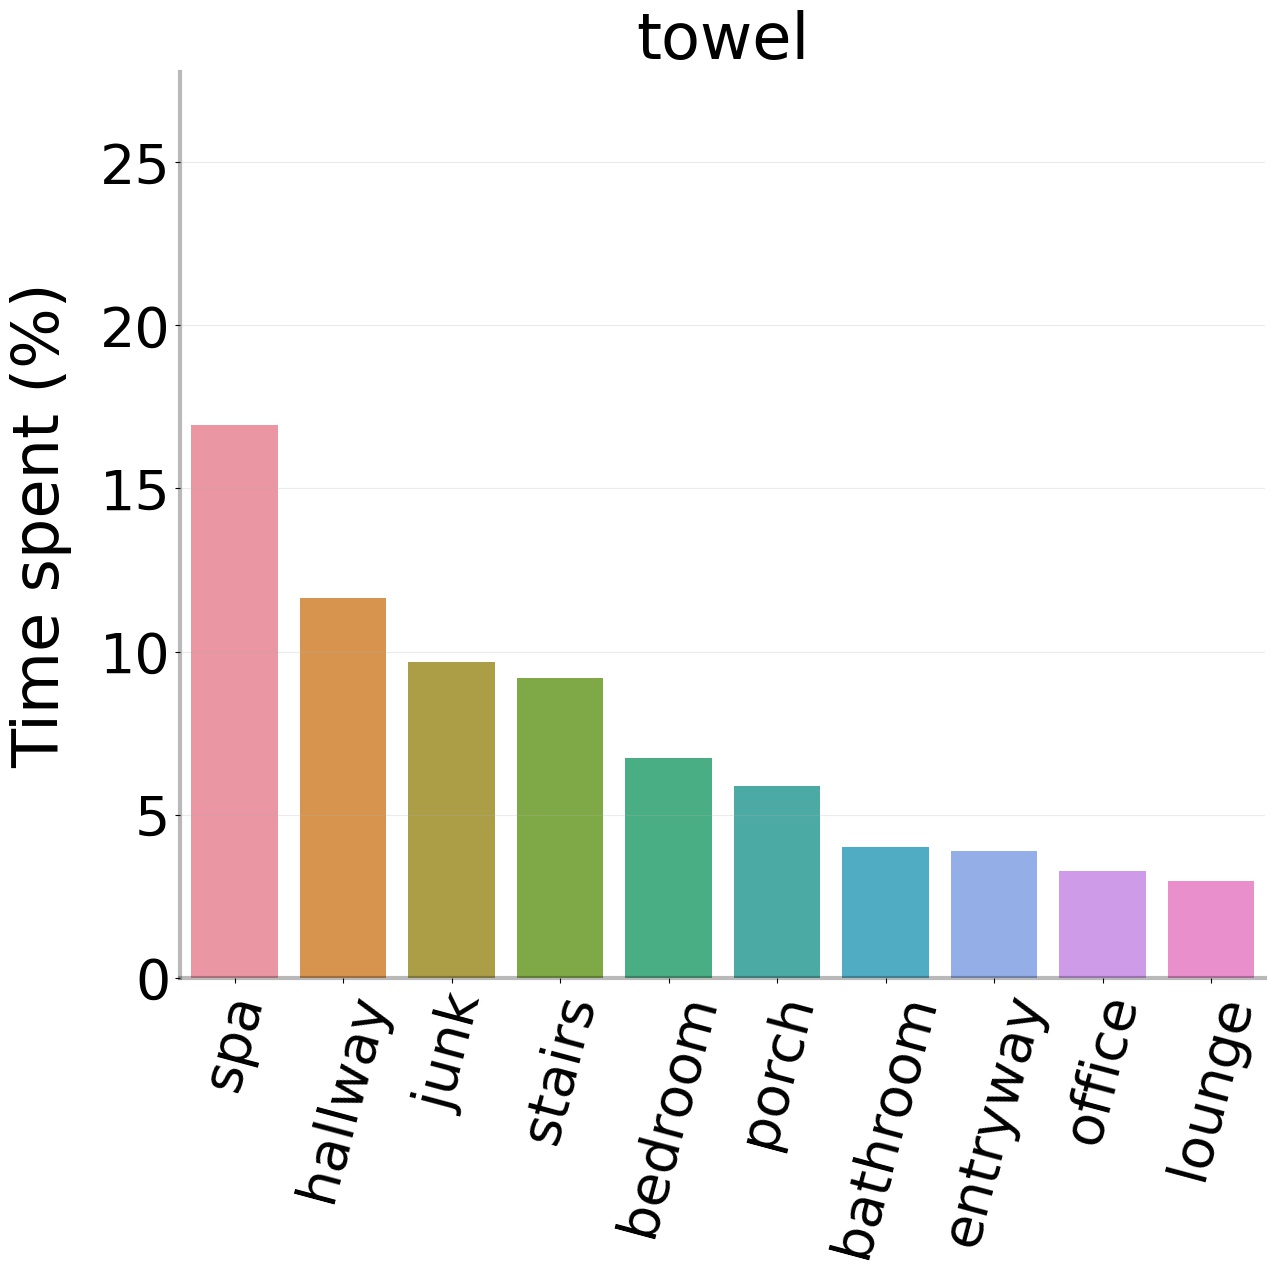
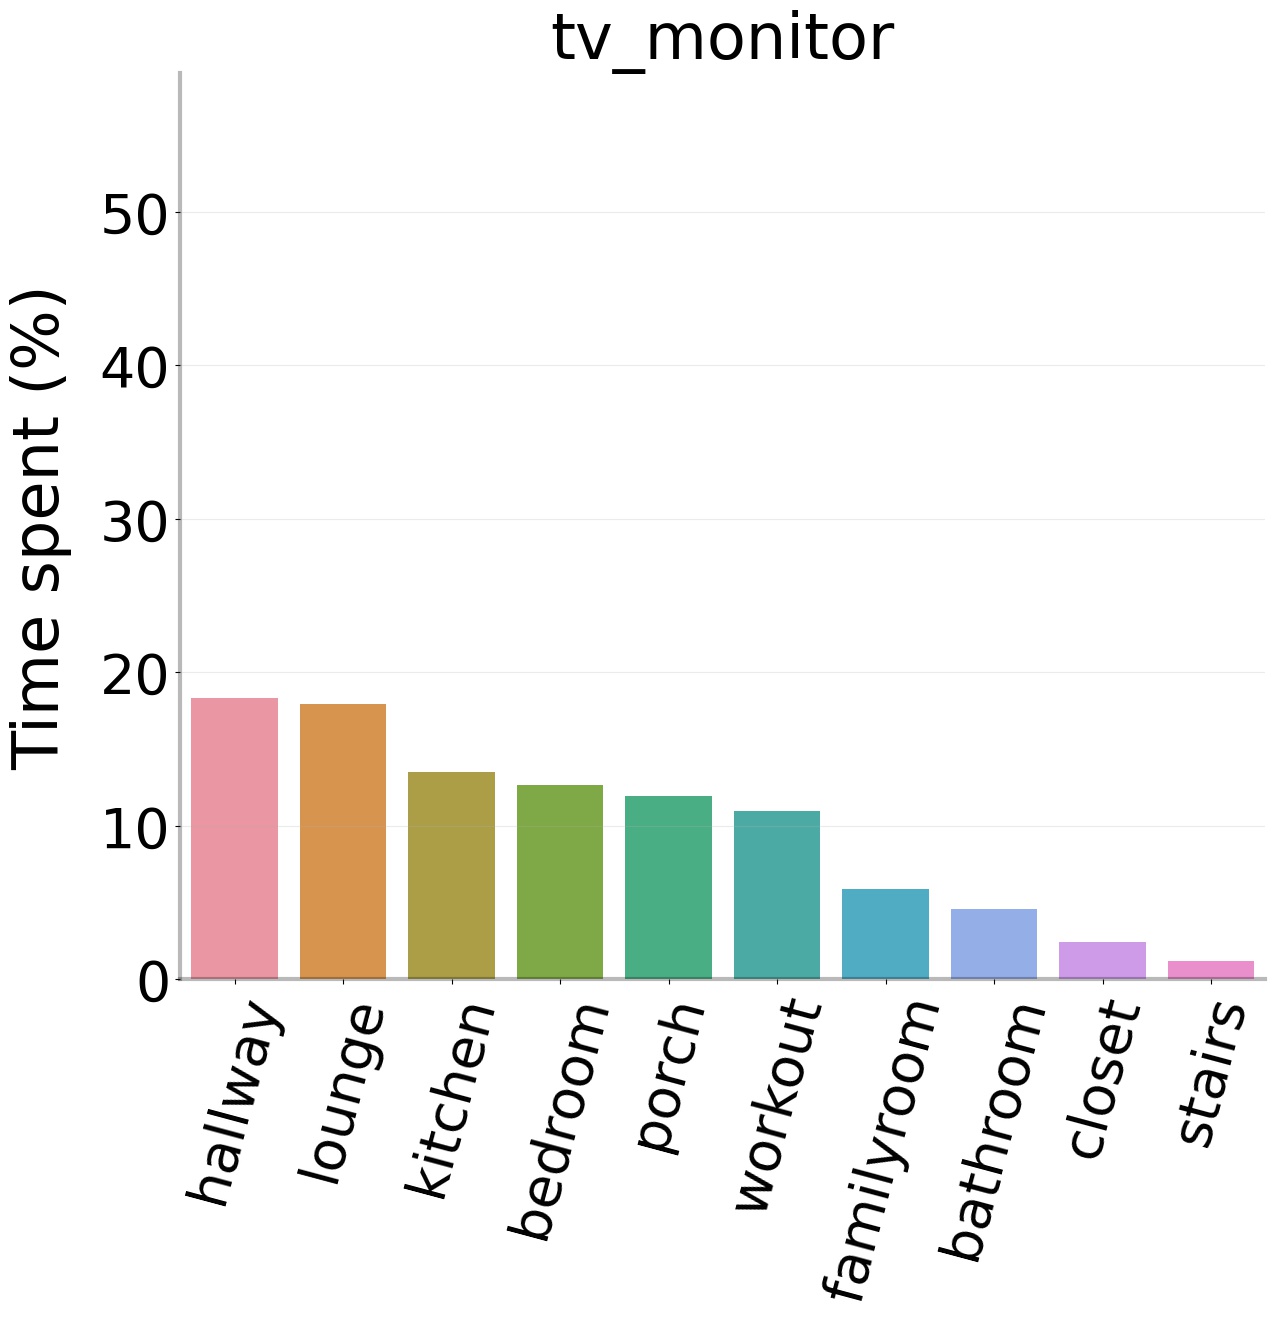
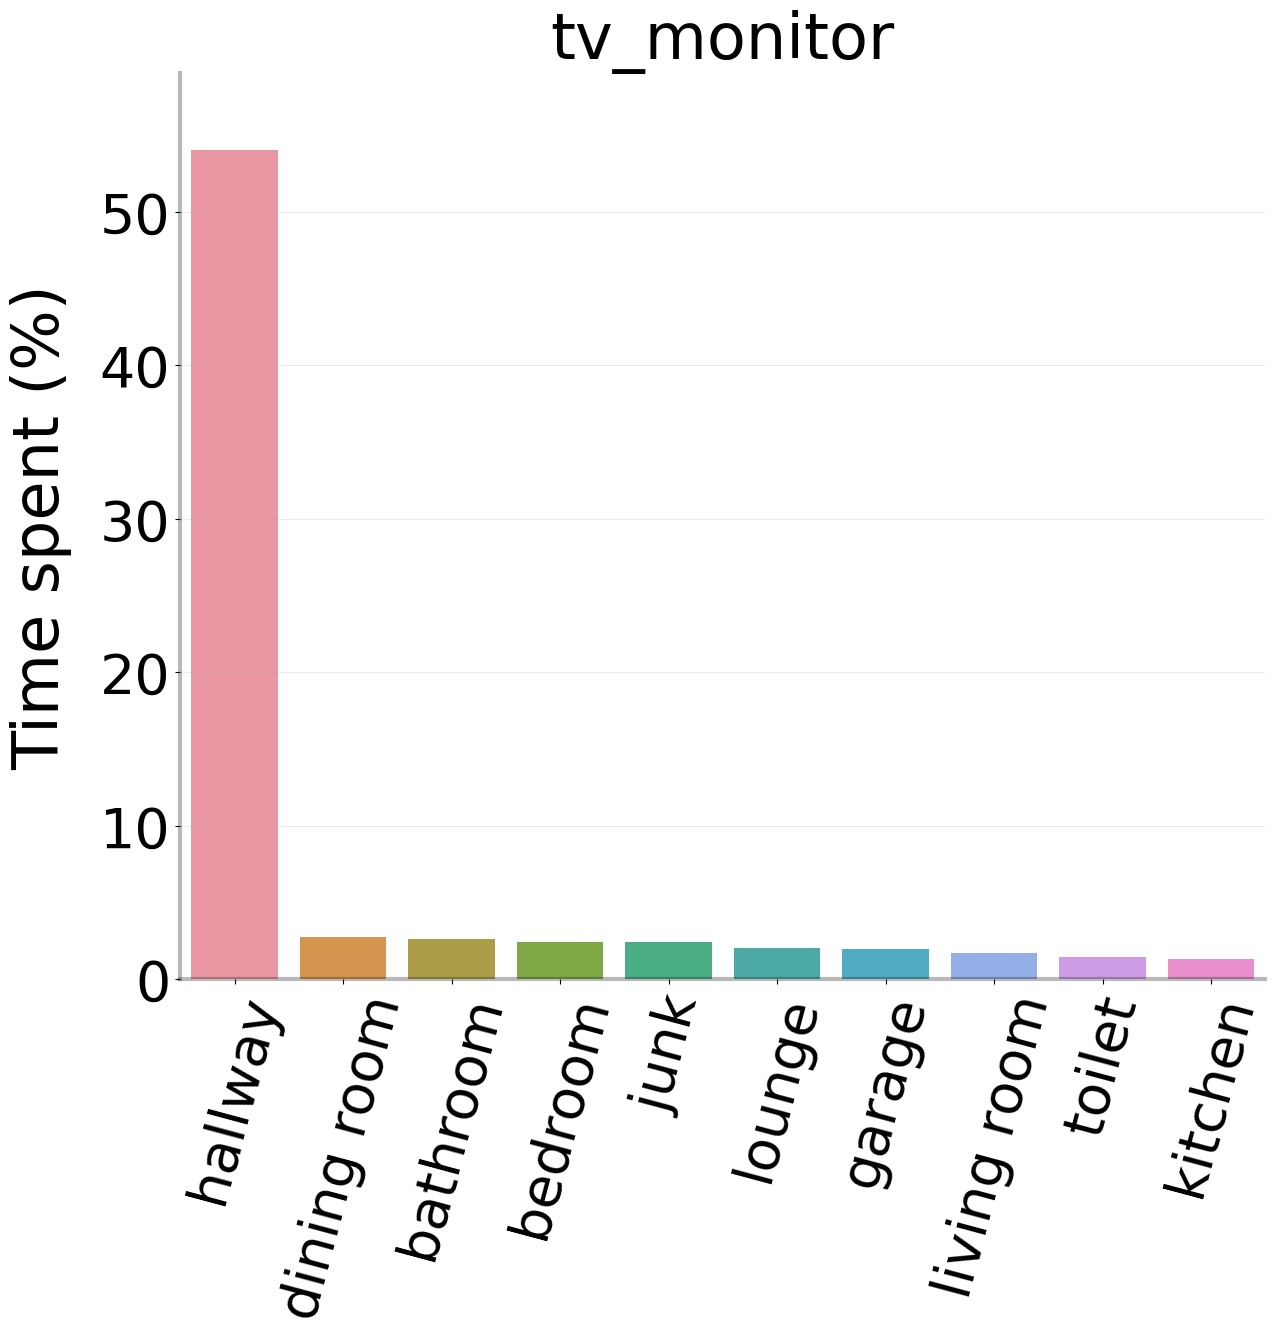
In this section, we describe the metrics used to characterize the exploration behavior exhibited by these agents in Sec. 7 in the main paper. These include 1) Occupancy Coverage (OC) and 2) Sight Coverage (SC) introduced in Sec. 4 in the main paper, as well as 3) Goal Room Time Spent (GRTS) – the number of steps as a fraction of total episode length an agent takes within the room bounding box containing the target object, 4) Peeks – check if the agent steps back into the last visited room after taking just steps in another room, 5) Panoramic Turn (PT) – whether the agent stands at one place and turns left and right to get sweeping views, 6) Beeline – if the agent takes continuous forward actions before reaching the goal in the last steps, 7) Exhaustive Search (ES) – sight coverage. To compute these metrics, we use the semantic annotations in Matterport3D. These annotations provide D bounding box coordinates for each room category in an environment. We use these bounding box coordinates to track the rooms an agent visits during an episode. GRTS gives us a measure of how often the agent ends up reaching goal object room but doesn’t successfully locate the object. A higher GTRS suggests that the agent is at least good at reaching semantically meaningful locations in search of the goal object. We find that RL agents have higher average GRTS but also significantly higher variance in GRTS across scenes while our IL agents have lower average GRTS but more consistently spend time in the target room (see Fig. 9). To evaluate not just the final room the agent ends up at, but all the rooms it visits through the course of an episode, we also plot distributions of the time spent per room category for each goal object (see Fig. 15) for human demonstrations vs. IL agents trained on human demonstrations vs. RL agents.
A.5 Inter-human Variance in ObjectNav
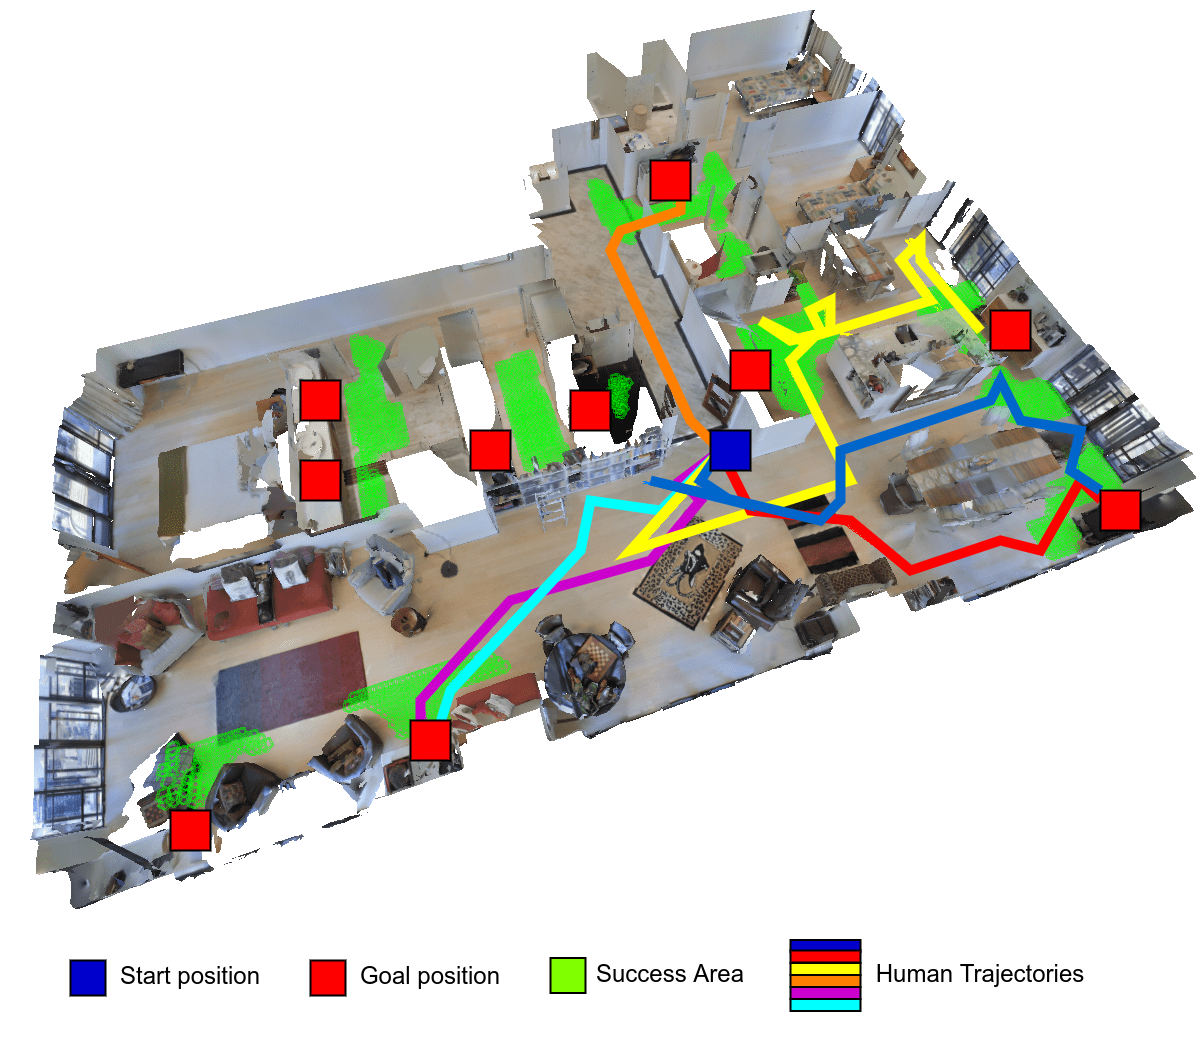
To get a sense for the variance in ObjectNav human demonstrations, we collected unique human-provided trajectories for the same initial location and target object (‘cabinet’). This is visualized in Fig. 10. We see that there is quite a bit of diversity in navigation trajectories across humans. They often navigate to different instances of the goal object category ‘cabinet’, and even when multiple humans go to the same object instance, the routes taken are different (red vs. blue trajectory).
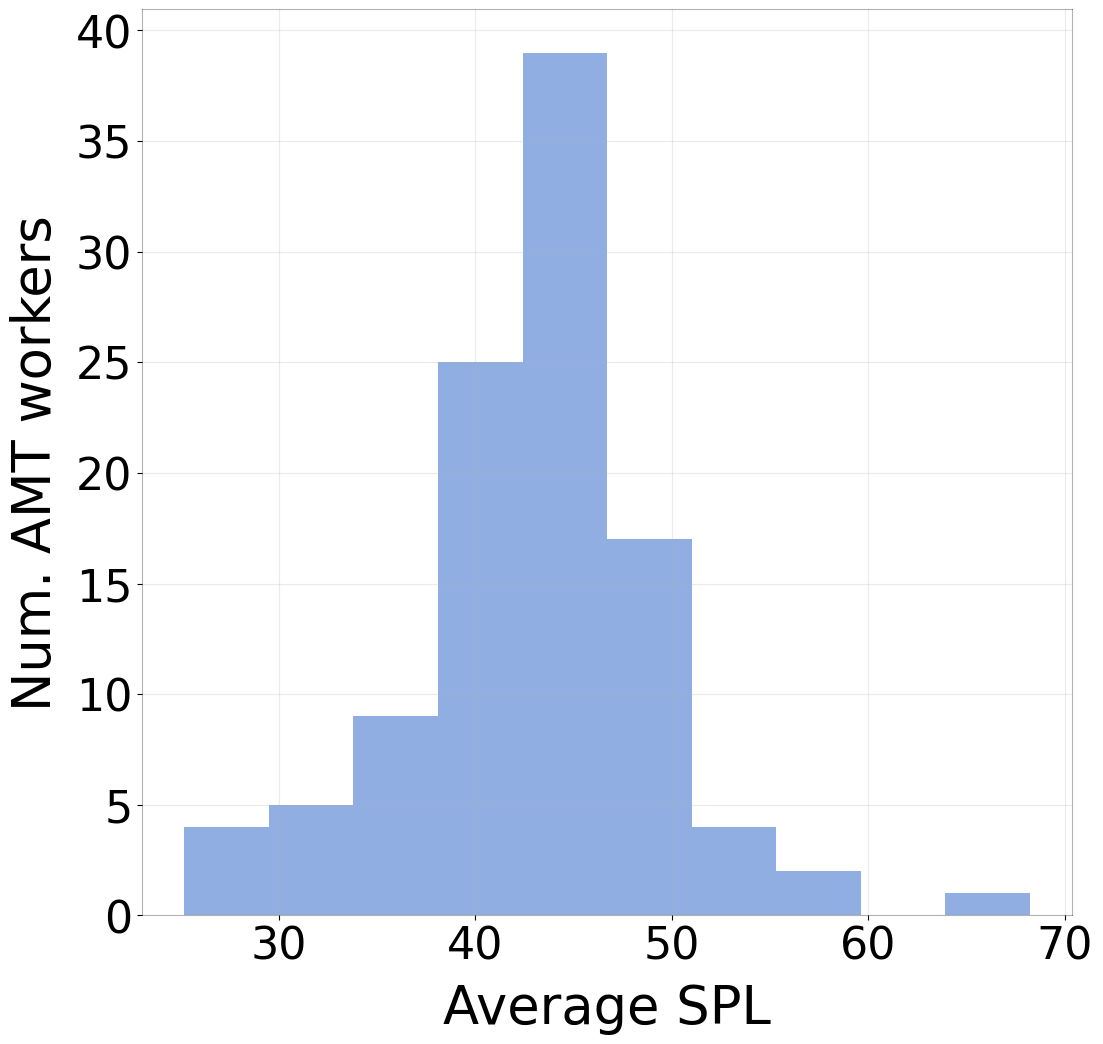
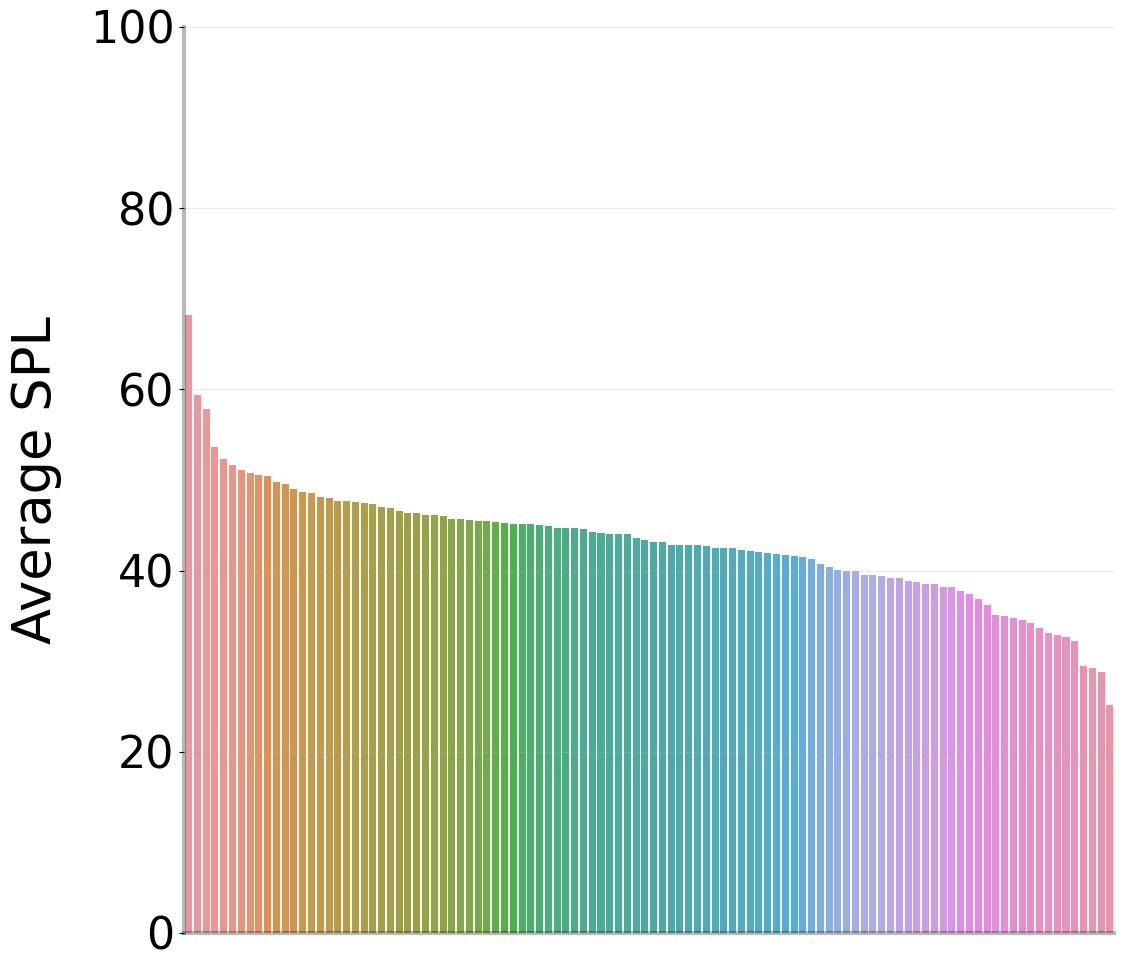
We also plot the average SPL per AMT user in our dataset in Fig. 11. We find that human performance has a lot of variability, ranging from to (Fig. 11(a)). The SPL range that has the most humans is . The best-performing human annotator achieves an SPL of averaged over episodes (Fig. 11(b)), which is particularly close to shortest paths and arguably super-human.
A.6 AMT Interface
Fig. 12 shows a screenshot of our AMT interface for collecting Pick&Place demonstrations. For the Pick&Place task, we provide humans with an instruction of the form ‘Place the <object> on the <receptacle>’, without being told the location of the <object> or <receptacle> in a new environment, and they can see agent’s first-person view of the environment. They can make the agent move, look around, and interact with the environment using keyboard controls. Once the AMT user completes the task they can submit the task by clicking the ‘Submit’ button. We then run task-specific validation checks to ensure only successful tasks get submitted.
Validation. To ensure data quality, every submitted AMT task goes through a set of validation checks. For ObjectNav, we use the same set of validation checks as the Habitat challenge evaluation setup, i.e. a task is considered successful only when the user has moved the agent to within of the goal object. We do not limit the maximum number of steps to allow users on AMT to explore the environment. This captures key human exploration behavior necessary to succeed at these tasks. Similarly, for Pick&Place, a task is considered successful when the target object is placed on a receptacle object. Specifically, we check if the Euclidean distance between the centers of the target and receptable objects is less than , and that the target object is at a height greater than the receptacle center.
A.7 Limitations
Our approach is fundamentally limited by the limitations of imitation learning as our approach uses vanilla behavior cloning with inflection weighting. Additionally, these agents trained on human demonstrations exhibit some common failure cases. Some examples of common failure cases are – reaching close to the goal object but not within goal radius and ending episode early, trying to move straight when agent is colliding and getting stuck, looping around multiple instances of the goal object and as a result, exceeding maximum episode steps, and exploring the environment and not finding the goal object. Our approach is also limited by the amount of human demonstrations we can gather and the agent architecture being trained on this dataset. Currently, we use a vanilla CNN+RNN architecture to learn imitation learning policies but we can build better architecture which make full use of the rich semantic information these human demonstrations have.