Star-dust geometry main determinant of dust attenuation in galaxies
Abstract
Analysing a large representative sample of local galaxies (8707), we find that the variation in the shape of their dust attenuation curves is driven primarily by their structure, i.e., distribution of stars (and dust) within them. The attenuation curve for spheroid dominated galaxies, as compared to the disc dominated ones, is nearly twice as steep. Both structural types cover distinct ranges of attenuation slope values. Similar findings are reflected in the case of star-forming and passive galaxies. Spheroids and passive galaxies witness minimal attenuation in the optical compared to UV wavelengths underlining the lack of dusty birth-clouds that define complex star-dust geometry. The distinction in the attenuation properties of spheroids and discs is maintained in each stellar mass range emphasising that structure is the primal cause of variation. However, within a structural group, the attenuation curve becomes shallower with both the increase in total stellar mass and optical depth of the galaxy. Overall, with the extinction curve fixed to be the same for all galaxies, the star-dust geometry emerges to be the prime determinant of the variation in their attenuation properties.
keywords:
galaxies: ISM, galaxies: star formation, galaxies: structure, ISM: structure, (ISM:) dust, extinction1 Introduction
Dust, produced according to the star formation history of a galaxy, is a vital player in its ongoing and future star formation activity (Lutz, 2014; Madau & Dickinson, 2014). Unravelling the connection between this dust and other physical properties of the galaxy is, therefore, a powerful diagnostic for the processes involved in its evolution (Dunne et al., 2011; Santini et al., 2014). The properties of dust inside a galaxy are deduced by analysing its affect on the galaxy’s stellar emission over the spectrum (Calzetti, 1997; Draine, 2003). This affect is encapsulated by the dust attenuation curve of the galaxy that gives its optical depth as a function of wavelength. Constant efforts are made to compute these curves for galaxies in an increasingly accurate manner as it is a prerequisite for correct estimation of galaxies’ stellar properties (Walcher et al., 2011; Conroy, 2013).
Several methods have been applied, over the years, for the estimation of these curves (see review by Salim & Narayanan, 2020). The method that has lately gained traction for providing most reliable attenuation curves for galaxies individually is the ‘model method’. This involves the creation of a library of dust-free SEDs spanning a large range of star formation histories and metallicities through the usage of stellar population synthesis models. The dust-free SEDs are then attenuated and compared with observed SEDs to obtain estimates of galaxy parameters and dust content. The main critique of this method has been the usage of a single dust prescription for computational ease and to break the formidable dust-metallicity-age degeneracy. In recent years, modellers have successfully resolved this issue by amending the procedure in such a way that best-fit dust attenuation parameters are also extracted along with other galaxy properties (Leja et al., 2017; Salim et al., 2018). The amendment includes improvisation in the Bayesian MCMC fitting technique (Boquien et al., 2019; Johnson et al., 2019) and inclusion of IR observations to constrain total dust emission. Salim et al. (2018) implemented this ‘energy balanced SED fitting’ technique on a quarter million local galaxies with far-UV to far-IR observations. They have been the first ones to obtain a detailed set of dust attenuation parameters for galaxies individually, covering a wide stellar mass and star formation activity range, i.e., including passive sources as well.
This is an important procurement, not only for the accurate estimation of stellar properties but also to decipher the forces regulating the attenuation curves in galaxies. For a thorough probe, the attenuation parameters of a galaxy need to be compared with all its other defining properties, for a statistically large representative sample (Salim & Narayanan, 2020). Although several studies have attempted this (Wild et al., 2011; Battisti et al., 2016), they were constrained by either the choice of their sample or the availability of the whole set of attenuation parameters and other physical properties for each galaxy individually.
This constraint is lately getting resolved with the growing number of surveys focused on small extra-galactic patches, along with the attempts to measure all defining properties of galaxies in those patches. For example, for Stripe 82 - a 270 square degrees area in the sky - spectroscopic redshifts, deep images and spectra are available for tens of thousands of local (0.3) galaxies (Dawson et al., 2013; Annis et al., 2014). Utilizing that, Bottrell et al. (2019) has computed the detailed set of structural parameters for all galaxies (17000) in this area, in optical wavebands. Structural parameters in the infrared ( band), reflecting the underlying mass distribution, are also available for a subset of the full sample from our earlier work (Sachdeva et al., 2020). In addition to that, all defining dust attenuation and stellar parameters are available for these galaxies from GSWLC2 (GALEX-SDSS-WISE Legacy Catalog 2, Salim et al., 2018). Thus, detailed structural, stellar and attenuation curve defining parameters - understood to be the most accurate till date - are available for all (17000) galaxies in the Stripe 82 region. In this paper, we employ this data to perform an in-depth investigation of the processes and properties responsible for the observed variation in dust attenuation parameters of galaxies covering a wide stellar mass () and star formation activity () range.
2 Data
Stripe 82 is a 270 degree square strip along the celestial equator with mag deeper SDSS imaging in all optical bands () compared to the SDSS Legacy survey data (Jiang et al., 2014). In addition to deep optical imaging, it has spectroscopic redshift measurements from BOSS (Dawson et al., 2013), deep UV observations from GALEX (Bianchi et al., 2017) and near to far IR coverage from Spitzer (Papovich et al., 2016), Herschel (Viero et al., 2014) and VISTA (VICS82, Geach et al., 2017) amongst others.
Recently, Bottrell et al. (2019) computed the whole range of multi-component structural parameters for all local (16908, 0.3, 17.77) galaxies in this field using deep co-added SDSS images. They have fitted both a single component (Sérsic profile) model and a two component (Sérsic profile exponential disc) model on each galaxy using a Bayesian maximum-likelihood optimisation algorithm (GIM2D, Simard, 1998). They demonstrate that fitting of galaxies using deeper images results in more accurate measurements mainly due to the reduction in systematics associated with background noise.
The dust attenuation parameters for this sample are available from GSWLC2 (Salim et al., 2018). Measurements made in GSWLC2 are based on the ‘model method’ which involves the adoption of a parametric form for the attenuation curves. To avoid any potential bias stemming from this adoption, the slope of the assumed curve (Calzetti et al., 2000) is allowed to deviate in the fitting process. Based on the relationship between stellar and nebular reddening, different attenuation levels are assumed for young and old populations, which is argued to be a more physically relevant approach as young stars are embedded in birth-clouds (Salim et al., 2018). However, it is noted that this assumption may affect the steepness of the derived curves. An important improvisation over earlier efforts is the inclusion of IR luminosity (from WISE and HERSCHEL) that acts as a constraint on the total dust emission, thus allowing the attenuation curves to be fitted freely by the advanced software (CIGALE, Salim et al., 2018; Johnson et al., 2019). The stellar parameters of galaxies are estimated with regard to the best fit attenuation curves.
Thus, both attenuation and structural parameters are available for our chosen sample of local Stripe 82 galaxies (16908), covering a wide stellar mass and star formation activity range. For this work, we select only those galaxies that have been observed in both UV and IR bands, i.e., have and in the GSWLC2 catalog. This selection ensures that our sample (8707 galaxies) has the most accurate attenuation measurements. Note that the range and representative quality of the full sample is not affected by this selection. In our previous work (Sachdeva et al., 2020), we focused on a subset of the total sample (1263 galaxies) to extract multi-component structural parameters in the near-IR range using band images from the VICS82 survey (Geach et al., 2017). This subset allows us to examine if the structure related findings apply to the distribution of stellar mass or only the bright optical light within a galaxy. Thus, we have an ideal sample to analyse the cause of variation observed in the attenuation curves of galaxies.
3 Results
To decipher the primary regulators of dust cycle inside a galaxy, we examine the dependence of attenuation curve on galaxy’s physical properties including structure, inclination, total stellar mass and star formation activity. Towards that goal, our foremost step is the selection of a representative dust attenuation curve parameter.
3.1 Dust attenuation curve parameter
Our primary step is the identification of a dust attenuation curve parameter that is representative of its characteristics. The slope of the curve at short wavelengths, mainly ultraviolet, is known to be the best in that regard (Salim & Narayanan, 2020). This is driven by the fact that UV is most strongly attenuated by dust. Thus, a comparison of attenuation in UV with that in other wavebands is an ideal determinant of the effect of interstellar dust on galaxy’s stellar emission. Through GSWLC2, we have dust attenuation amplitudes in three bands, i.e., FUV, B and V. We, thus, select normalised slope of the curve in FUV (/) as the defining dust attenuation parameter. We find that the trends, reported in this work, become stronger with the selection of reddening-normalised slope (). Nevertheless, to facilitate comparison with other studies on the matter, we focus on the normalised slope.
3.2 Structural classification and correlation
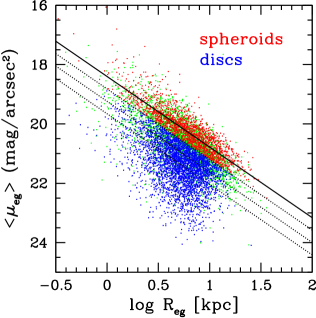
Prior to the examination of correlation with dust attenuation, we classify the structure into two categories, ‘spheroid’ and ‘disc’. Here, ‘spheroid’ means that the galaxy has properties attributed to elliptical galaxies and ‘disc’ means that the galaxy has properties attributed to disc galaxies. To classify, we apply two criteria concurrently, this includes the placement of galaxies on a projection of the fundamental plane, i.e., the Kormendy plane (Kormendy, 1977) and the value of their global Sérsic index (). Note that both these criteria, in past studies, have been found to be complimentary and efficient indicators of a galaxy’s dominant structure (Gadotti, 2009; Sachdeva et al., 2015; Sachdeva et al., 2017). In Figure 1 (left-most plot), the placement of our full sample (8707 galaxies) is shown on the Kormendy plane, i.e., global effective radius () versus average surface brightness inside that radius (). Galaxies are coloured according to their classification, i.e., spheroids (red), discs (blue) and the rest (green).
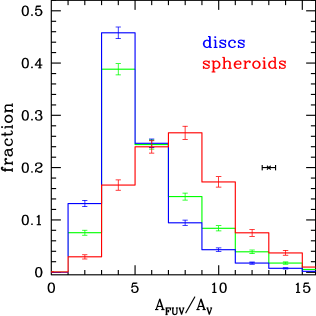
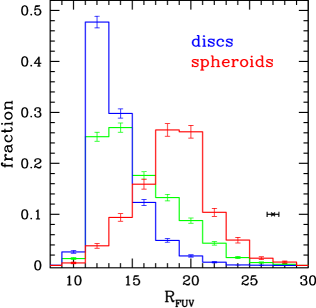
Based on the classification, we examine the fractional distribution of the structural types in different bins of the normalised slope of the dust attenuation curve (/). As shown in Figure 1 (central plot), the two structural types exhibit distinct distribution of slope values. Most discs () have slope value less than 6.5, whereas spheroids () have slopes above this value. Note that the distinction becomes even stronger in the case of the reddening normalised slope (), where most discs () have slope value less than 16.0 and spheroids () have slopes above this value (Figure 1 (right-most plot). For both normalised and reddening-normalised slopes, the average value for spheroids is nearly twice that for discs, i.e., their curve is twice as steep. The slope values for discs are constrained to a narrow range in both cases indicating homogeneous attenuation behaviour within a structural group.
Parameters of a galaxy, determined using optical images, might be biased towards the distribution of bright stellar populations. To investigate this possibility, we employ a representative subset of the full sample (1263), for which we have multi-component structural measurements in the band from our earlier work (Sachdeva et al., 2020). Since -band covers near-IR wavelengths, where dust attenuation is significantly lower than optical wavelengths, it is known to represent the underlying mass distribution of a galaxy in the best manner. We find that the distribution of galaxies based on their attenuation parameters remains unaltered between the optical and band. Thus, the inferences drawn are applicable to the overall distribution of stellar mass within galaxies.
3.3 Stellar classification and correlation
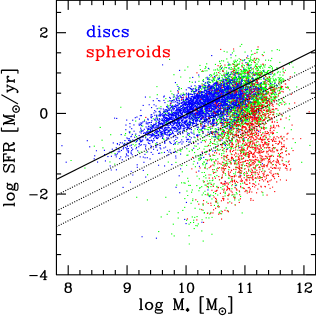
We classify the galaxies based on their star formation activity into two categories, ‘star-forming’ and ‘passive’. In Figure 2 (left-most plot), the placement of our full sample (8707 galaxies) is shown on the main sequence (MS). The MS relation known for local star forming galaxies (Belfiore et al., 2018), and its lower boundaries are marked. We classify the galaxies within the 1 boundary as ‘star-forming’ and those outside the 3 boundary as ‘passive’. We find that the classifications pertaining to structure and star formation activity result in a similar selection (Figure 2, left-most plot). The disc sample () is within the 2 boundaries of the MS relation and the spheroid sample () is outside those boundaries.
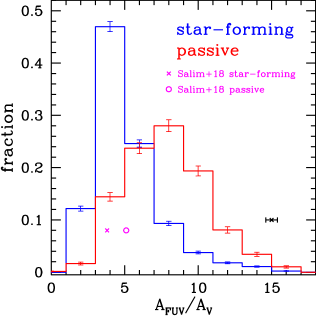
It is thus expected that the distinction in the attenuation curve slopes observed in the case of structure, will be reflected in the case of star formation activity as well. This is indeed seen to be the case in Figure 2 (central plot) where the fractional distribution of star-forming and passive galaxies is shown in different bins of normalised attenuation slope (/). The attenuation curves for passive galaxies are twice as steep as those for star-forming galaxies.
We have compared our results with those obtained by Salim et al. (2018) (Figure 2 central plot). While the average value of the slope for their star-forming galaxies (3.8) matches with our computation, the value for passive galaxies (5.1) is lower than our estimation. This difference is due to the fact that we have applied a more stringent criteria for the selection of passive galaxies and kept ambiguous cases separately.
3.4 Correlation with mass, inclination and optical depth
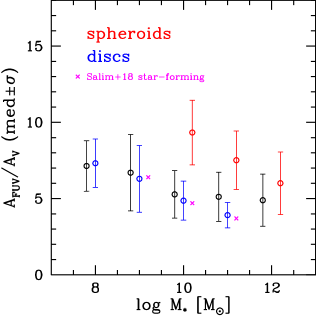
In Figure 2 (right-most plot), the median and median absolute deviation values of the normalised attenuation slope (/) are shown for different ranges of total stellar mass (). Notably, our earlier finding that the median slope value for spheroids is nearly double the value for discs, is maintained in each stellar mass bin. This confirms that the difference of attenuation curves for the two structural types is driven by the distribution of stellar mass rather than its total amount. However, within a structural group, the total amount is consequential, such that larger results in a slightly shallower slope, as reported in earlier works (Salim et al., 2018). The median values of the slope in different stellar mass bins for discs matches those computed by Salim et al. (2018) for star-forming galaxies, as shown in Figure 2 (right-most plot).
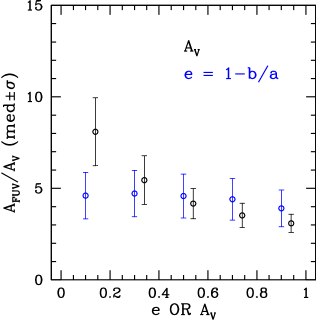
In addition to mass, we study the trend in the median values of the slope with the ellipticity of the disc component (Figure 3, left-most plot). In fitting galaxies, the ellipticity of the whole system gets measured with a much less error margin than that of its components (Bottrell et al., 2019). We thus select this global parameter for our disc dominated sample to study the affect of inclination. Note that ellipticity (or axial-ratio) of a galaxy is only an indicator of its inclination because the conversion involves assumptions regarding the thickness of the galaxy disc (Unterborn & Ryden, 2008). As shown in Figure 3, the ellipticity depicts no trend with the median slope values, adding to the argument that increase in the dust mass encountered by the galaxy may not be the primal cause of variation in attenuation curves of galaxies.
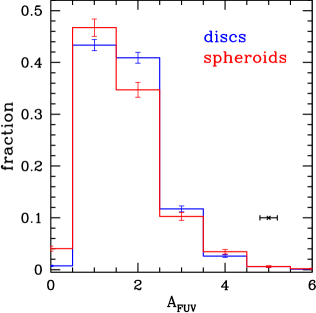
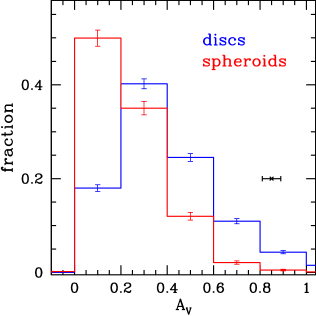
To probe that further, we analyse the trend in median slope values with the amplitude of attenuation in the optical band () for the full sample (Figure 3, left-most plot). In agreement with earlier works (Salim & Narayanan, 2020), the curve does becomes shallower with the increase in the optical depth. We argue that this trend is also driven by the structure of the galaxies. As shown in the Figure 3 (central and right-most plot), while spheroids witness minimal attenuation in the optical compared to the ultraviolet, discs witness similar attenuation in both bands. Thus, discs - supporting shallower slopes - populate on the larger side of and spheroids - supporting steeper slopes - populate on the smaller side of . Discs, being more gas rich and star-forming, have larger compared to spheroids.
4 Discussion and summary
We have probed the cause of variation in the dust attenuation curves of galaxies by studying the trend of the normalised attenuation slope in ultraviolet with the structure, star formation activity, total stellar mass, inclination and optical depth of galaxies. The main findings are discussed:
-
•
The attenuation curve for spheroid dominated galaxies is twice as steep as that for disc dominated ones. Both structural types occupy non-overlapping ranges of the attenuation slope value (10-20% overlap). Thus, stellar mass distribution within a galaxy is one of the main determinant of its dust attenuation behaviour. More importantly, within a structural group, i.e., that of discs, slope values are constrained to a narrow range, emphasising the primacy of structure in determining dust properties.
-
•
The steepness of the attenuation curve for spheroids is driven by minimal attenuation in the optical bands compared to that in ultraviolet. Thus, only newly formed stars get attenuated in the case of spheroids. In contrast, the shallowness of the curve in the case of discs is driven by near uniform attenuation in ultraviolet and optical bands. Thus, all stars face attenuation in the case of discs, both due to a more dominant presence of ‘birth clouds’ and a denser interstellar medium (Charlot & Fall, 2000).
-
•
The trends observed in the case of structure are reflected in the case of star formation activity as well. The slope for passive galaxies is twice as steep as that for star-forming ones. This is expected because most (85-90%) discs are star-forming and spheroids are passive. Since star-forming galaxies are more gas rich, clumpier and have a larger presence of birth-clouds compared to passive galaxies, it provides further evidence that the distribution of stellar mass and dust inside a galaxy is the main cause of variation in attenuation curves (Inoue, 2005).
-
•
The distinction in the median slope value for spheroids and discs is maintained in each stellar mass range, adding to the argument that structure is the primary determinant of attenuation behaviour. Within a structural group, the attenuation slope becomes shallower with increasing stellar mass. This is in agreement with earlier works that have reported that increase in the dust mass encountered by a galaxy, reduces the steepness of its attenuation slope (Salim et al., 2018; Salim & Narayanan, 2020).
-
•
All our findings add up to the argument that if the extinction curve is assumed to be universal, the distribution of stars and dust, i.e., star-dust geometry, is the primal determinant of attenuation properties of a galaxy. Recently, under similar assumptions, Narayanan et al. (2018) have shown through simulations that star-dust geometry drives the variation in attenuation curves. Our results confirm that.
Acknowledgements
We are thankful to the reviewer for insightful comments that have improved the quality of this work.
Data availability
The data that has not been explicitly presented in the paper will be made available upon request to the first author.
References
- Annis et al. (2014) Annis J., et al., 2014, ApJ, 794, 120
- Battisti et al. (2016) Battisti A. J., Calzetti D., Chary R. R., 2016, ApJ, 818, 13
- Belfiore et al. (2018) Belfiore F., et al., 2018, MNRAS, 477, 3014
- Bianchi et al. (2017) Bianchi L., Shiao B., Thilker D., 2017, ApJS, 230, 24
- Boquien et al. (2019) Boquien M., Burgarella D., Roehlly Y., Buat V., Ciesla L., Corre D., Inoue A. K., Salas H., 2019, A&A, 622, A103
- Bottrell et al. (2019) Bottrell C., Simard L., Mendel J. T., Ellison S. L., 2019, MNRAS, 486, 390
- Calzetti (1997) Calzetti D., 1997, AJ, 113, 162
- Calzetti et al. (2000) Calzetti D., Armus L., Bohlin R. C., Kinney A. L., Koornneef J., Storchi-Bergmann T., 2000, ApJ, 533, 682
- Charlot & Fall (2000) Charlot S., Fall S. M., 2000, ApJ, 539, 718
- Conroy (2013) Conroy C., 2013, ARA&A, 51, 393
- Dawson et al. (2013) Dawson K. S., et al., 2013, AJ, 145, 10
- Draine (2003) Draine B. T., 2003, ApJ, 598, 1017
- Dunne et al. (2011) Dunne L., et al., 2011, MNRAS, 417, 1510
- Gadotti (2009) Gadotti D. A., 2009, MNRAS, 393, 1531
- Geach et al. (2017) Geach J. E., et al., 2017, ApJS, 231, 7
- Inoue (2005) Inoue A. K., 2005, MNRAS, 359, 171
- Jiang et al. (2014) Jiang L., et al., 2014, ApJS, 213, 12
- Johnson et al. (2019) Johnson B. D., Leja J. L., Conroy C., Speagle J. S., 2019, Prospector: Stellar population inference (ascl:1905.025)
- Kormendy (1977) Kormendy J., 1977, ApJ, 218, 333
- Leja et al. (2017) Leja J., Johnson B. D., Conroy C., van Dokkum P. G., Byler N., 2017, ApJ, 837, 170
- Longhetti et al. (2007) Longhetti M., et al., 2007, MNRAS, 374, 614
- Lutz (2014) Lutz D., 2014, ARA&A, 52, 373
- Madau & Dickinson (2014) Madau P., Dickinson M., 2014, ARA&A, 52, 415
- Narayanan et al. (2018) Narayanan D., Conroy C., Davé R., Johnson B. D., Popping G., 2018, ApJ, 869, 70
- Papovich et al. (2016) Papovich C., et al., 2016, ApJS, 224, 28
- Sachdeva et al. (2015) Sachdeva S., Gadotti D. A., Saha K., Singh H. P., 2015, MNRAS, 451, 2
- Sachdeva et al. (2017) Sachdeva S., Saha K., Singh H. P., 2017, ApJ, 840, 79
- Sachdeva et al. (2019) Sachdeva S., Gogoi R., Saha K., Kembhavi A., Raychaudhury S., 2019, MNRAS, 487, 1795
- Sachdeva et al. (2020) Sachdeva S., Ho L. C., Li Y. A., Shankar F., 2020, ApJ, 899, 89
- Salim & Narayanan (2020) Salim S., Narayanan D., 2020, ARA&A, 58, 529
- Salim et al. (2018) Salim S., Boquien M., Lee J. C., 2018, ApJ, 859, 11
- Santini et al. (2014) Santini P., et al., 2014, A&A, 562, A30
- Simard (1998) Simard L., 1998, in Albrecht R., Hook R. N., Bushouse H. A., eds, ASPC Vol. 145, ADASS VII. p. 108
- Unterborn & Ryden (2008) Unterborn C. T., Ryden B. S., 2008, ApJ, 687, 976
- Viero et al. (2014) Viero M. P., et al., 2014, ApJS, 210, 22
- Walcher et al. (2011) Walcher J., Groves B., Budavári T., Dale D., 2011, Ap&SS, 331, 1
- Wild et al. (2011) Wild V., Charlot S., Brinchmann J., Heckman T., Vince O., Pacifici C., Chevallard J., 2011, MNRAS, 417, 1760