Melting of magnetic order in by fs laser pulses
Abstract
NaOsO3 has recently attracted significant attention for the strong coupling between its electronic band structure and magnetic ordering. Here, we used time-resolved magnetic X-ray diffraction to determine the timescale of the photoinduced antiferromagnetic dynamics in NaOsO3. Our measurements are consistent with a sub-100 fs melting of the antiferromagnetic long-range order, that occurs significantly faster than the lattice dynamics as monitored by the transient change in intensity of selected Bragg structural reflections, which instead show a decrease of intensity on a timescale of several ps.
- Usage
-
Secondary publications and information retrieval purposes.
- PACS numbers
-
May be entered using the
\pacs{#1}command.
pacs:
Valid PACS appear hereI Introduction
The discovery of sub-ps demagnetization in ferromagnets upon ultrafast laser excitation Beaurepaire et al. (1996) has triggered an intense wave of research focusing on understanding the fundamental mechanisms involved in the dissipation of the spin and orbital angular momenta Battiato et al. (2010); Mueller et al. (2013); Turgut et al. (2016); Hofherr et al. (2017); Ritzmann et al. (2020); Dornes et al. (2019). This fundamental research interest in the ultrafast manipulation of magnetic order is complemented by its potential applications for high-speed data storage and processing technologies, as well as its relevance for faster spintronic architectures; where, for example, one major goal of research on these systems is to develop new, ultrafast methods of switching between metastable magnetic states. Stanciu et al. (2007); Lambert et al. (2014); Schubert et al. (2014a); Hadri et al. (2017); Beens et al. (2019); Ciuciulkaite et al. (2020)
Recent research efforts within ultrafast magnetism have been partly focused on antiferromagnets Wadley et al. (2016); Bodnar et al. (2018); Meinert et al. (2018); Meer et al. (2021); Chen et al. (2019) since they possess resonant frequencies in the terahertz (THz) range, which is three orders of magnitude higher than observed for ferromagnets (see Ref. Němec et al., 2018 and reference therein). Furthermore, in these systems the angular momentum can be directly exchanged between the spin up and spin down magnetic sublattices. Having equivalent stable states with zero net angular momentum in the spin system, antiferromagnets are expected to exhibit faster dynamics, different from those observed in ferromagnets, where momentum transfer to the lattice occurs. Given the ubiquity of antiferromagnetic materials, they offer a rich playground for investigating ultrafast spin dynamics. Of particular interest is the fact that in the majority of antiferromagnetic systems the magnetic ordering is intimately related to the electronic structure of the material. Therefore by manipulating the electronic structure, one also affects the antiferromagnetic order parameter. Indeed, theoretical predictions Werner et al. (2012); Mentink and Eckstein (2014); Eckstein and Werner (2016) suggest that in antiferromagnetic materials falling in the weak and strong electron coupling regime quenching of the antiferromagnetic order parameter occurs concomitantly within the photo-excited dynamics of the electronic system, which implies a few-fs or faster time scales are possible. Laser-induced ultrafast reorientation or switching of the antiferromagnetic order parameter has been demonstrated in several materials Kimel et al. (2004, 2009); Kanda et al. (2011); Satoh et al. (2015); Kimel et al. (2002); Kampfrath et al. (2011); Yamaguchi et al. (2010); Baierl et al. (2016); Němec et al. (2018), including Mott insulators Kimel et al. (2002); Kanda et al. (2011); Kampfrath et al. (2011). However, there have been a limited amount of reports that discuss the ultimate time scale of the antiferromagnetic quenching in strongly-correlated systems following an ultrafast photo-excitation. Kimel et al. (2002); Caviglia et al. (2013); Afanasiev et al. (2019); Mazzone et al. (2021); Stoica et al. (2020) In these reports, the time scales have been limited either by the experimental time resolution or found to be in the 100-400 fs range, which is significantly slower when compared with the values predicted theoretically Werner et al. (2012); Mentink and Eckstein (2014); Eckstein and Werner (2016) or reported for ferromagnetic materials and multilayer films Beaurepaire et al. (1996); Hohlfeld et al. (1997); Scholl et al. (1997); Stamm et al. (2007); Kirilyuk et al. (2010); Rudolf et al. (2012). It is therefore interesting to ascertain on which timescales the electronic and magnetic properties can be modified, in particular in systems in which antiferromagnetic order occurs concomitantly with an abrupt change in the electronic properties of the material, as occurring at an insulator-to-metal transition.
In this work we report the ultrafast manipulation of the antiferromagnetic order and the electronic structure in NaOsO3. The photoexcitation of NaOsO3 by femtosecond laser pulses with photon energy above the insulating gap drives simultaneously the dynamics of electrons and spins. To uniquely access the laser-induced ultrafast spin dynamics we use time-resolved femtosecond X-ray diffraction on a magnetic Bragg peak. Our results show that the manipulation of the antiferromagnetic order parameter occurs on a sub-100 fs time scale.
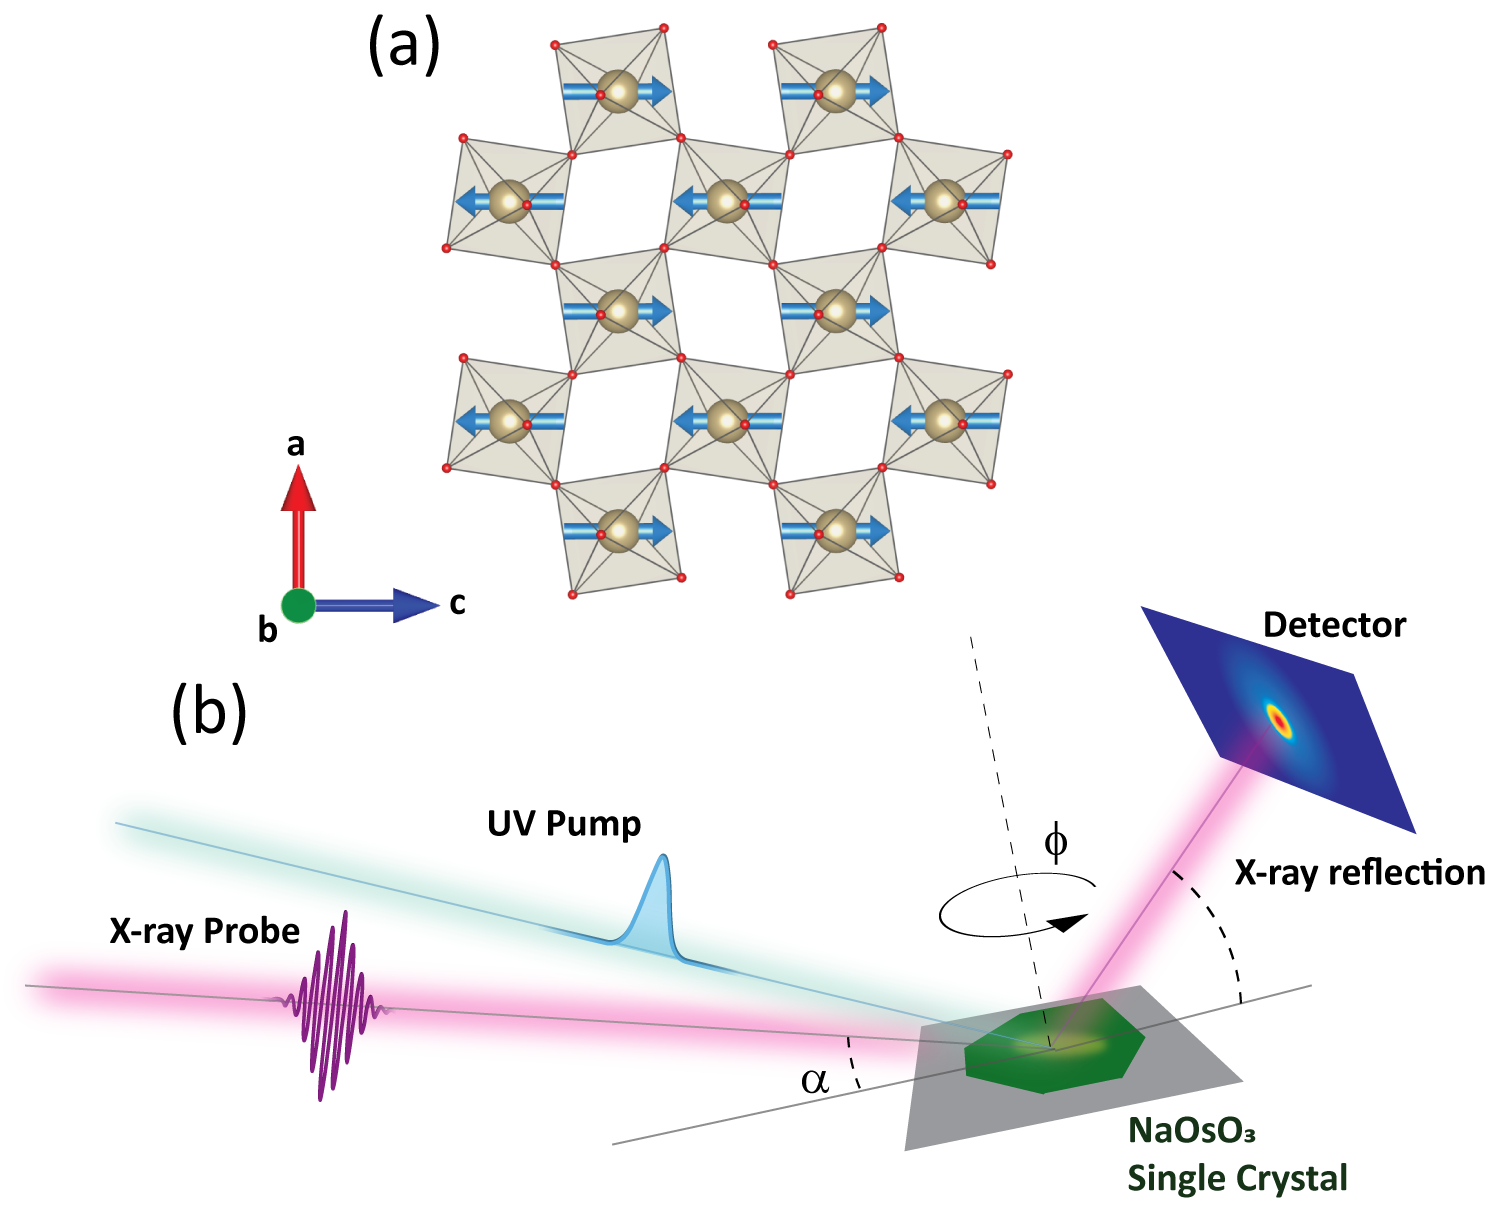
NaOsO3 undergoes an insulator-to-metal transition concomitant with antiferromagnetic ordering at = 410(1) K. Shi et al. (2009) In this compound, the absence of crystallographic symmetry breaking Calder et al. (2012); Gurung et al. (2018) is suggestive of a magnetically driven insulator-to-metal transition. However, due to the presence of energetically similar competing interactions, a consensus on the nature of the metal-insulator mechanism operating in this perovskite is absent Calder et al. (2012); Middey et al. (2014); Gurung et al. (2018); Kim et al. (2016a); Vale et al. (2018a, b). In the insulating phase, with a gap at low temperature of 102(3) meV Vecchio et al. (2013), the magnetic moment determined by neutron diffraction refinement is , and it suggests a coexistence of localized and itinerant magnetism Calder et al. (2012). Below , magnetic moments order almost parallel to the -axis in a G-type antiferromagnet with a very small () ferromagnetic component along the -axis. The strong enhancement of magnetic diffraction at the Os edge (10.787 keV) makes this material very appealing for time resolved X-ray diffraction measurements of the antiferromagnetic dynamics. The latter can be related to the changes in the conductivity response of the material upon fs laser excitation, which are expected to drive an insulator-to-metal transition in the system.
This paper is organized as follows: in Sec. II we describe the sample preparation and the experimental details of the pump-probe experiments. In Sec. III, we present the experimental results describing the antiferromagnetic dynamics in a time window of few ps subsequent to a sub 100 fs laser excitation. These results are analysed with a time-dependent order parameter model that was applied previously to manganite materials. Beaud et al. (2014) We find that the melting of the antiferromagnetic order following a fs laser excitation occurs on a timescale comparable with the experimental time resolution and faster compared to other 5 oxide materials. Lattice dynamics, monitored via the transient change of the intensity of structural Bragg peaks, occur on a time scale of several ps.
II Experimental details
The resonant X-ray diffraction experiment was carried out at the EH2 endstation of the BL3 beamline at the SACLA X-ray free electron laser Ishikawa et al. (2012), using a Huber four-circle (, , and ) diffractometer in horizontal scattering geometry equipped with a single module MultiPort Charged Coupled Device (MPCCD) detector Kameshima et al. (2014). An illustration of the experimental setup is shown in Fig. 1. In the experiment, a NaOsO3 single-crystal sample with a surface normal direction close to [1 0 0]Pbnm and an area of 100 100 m2 was mounted on a goniometer with a nitrogen cryostream to stabilize the temperature at approximately 293 K. A 65 fs full width at the half maximum (FWHM) optical pulse with wavelength 400 nm excited the sample with a repetition rate of 60 Hz. The laser spot size at the sample position was measured to be 300 m 300 m. The horizontal polarized X-ray beam operating at 30 Hz and with a pulse duration of 10 fs (FWHM) was focused to a spot size of 10 m 10 m. During the experiment, the angle between the X-ray- and laser- beams was kept fixed at 7 degrees. An X-ray grazing incidence geometry () was used to match the X-ray and laser penetration lengths, with the latter estimated to be 50 nm from Ref. Vecchio et al., 2013 for a powder sample. Independent shutters for the laser and X-rays beams were used to collect data with and without laser excitation.
The X-ray beam energy was tuned within the vicinity of the Os L3 edge ( transition) at around 10.787 keV (0.115 nm). The temporal jitter between X-ray and optical laser pulses was measured shot-by-shot using a transmission grating based timing tool, which has an accuracy 10 fs (FWHM) Katayama et al. (2016). The temporal fingerprint of each shot was then used to re-bin all data into fs time-segments Nakajima et al. (2018). The effective time-resolution of the experiment was estimated to be fs (FWHM). As it is customary to model time traces using an erf(/) function Glownia et al. (2010); Gierz et al. (2015), which is characterized by a timescale which is different from the timescale expressed in terms of the FWHM, the experimental time resolution can also be expressed as == 51(4) fs.
III Results and Modelling
In order to monitor the time evolution of the antiferromagnetic order parameter in response to an ultrafast laser excitation, we have taken advantage of the enhancement of the X-ray magnetic cross section in the vicinity of the Os edge. Based on the experimental geometric constraints, we have selected the (1 0) magnetic reflection as the most suitable one with which to perform our pump-probe measurements.
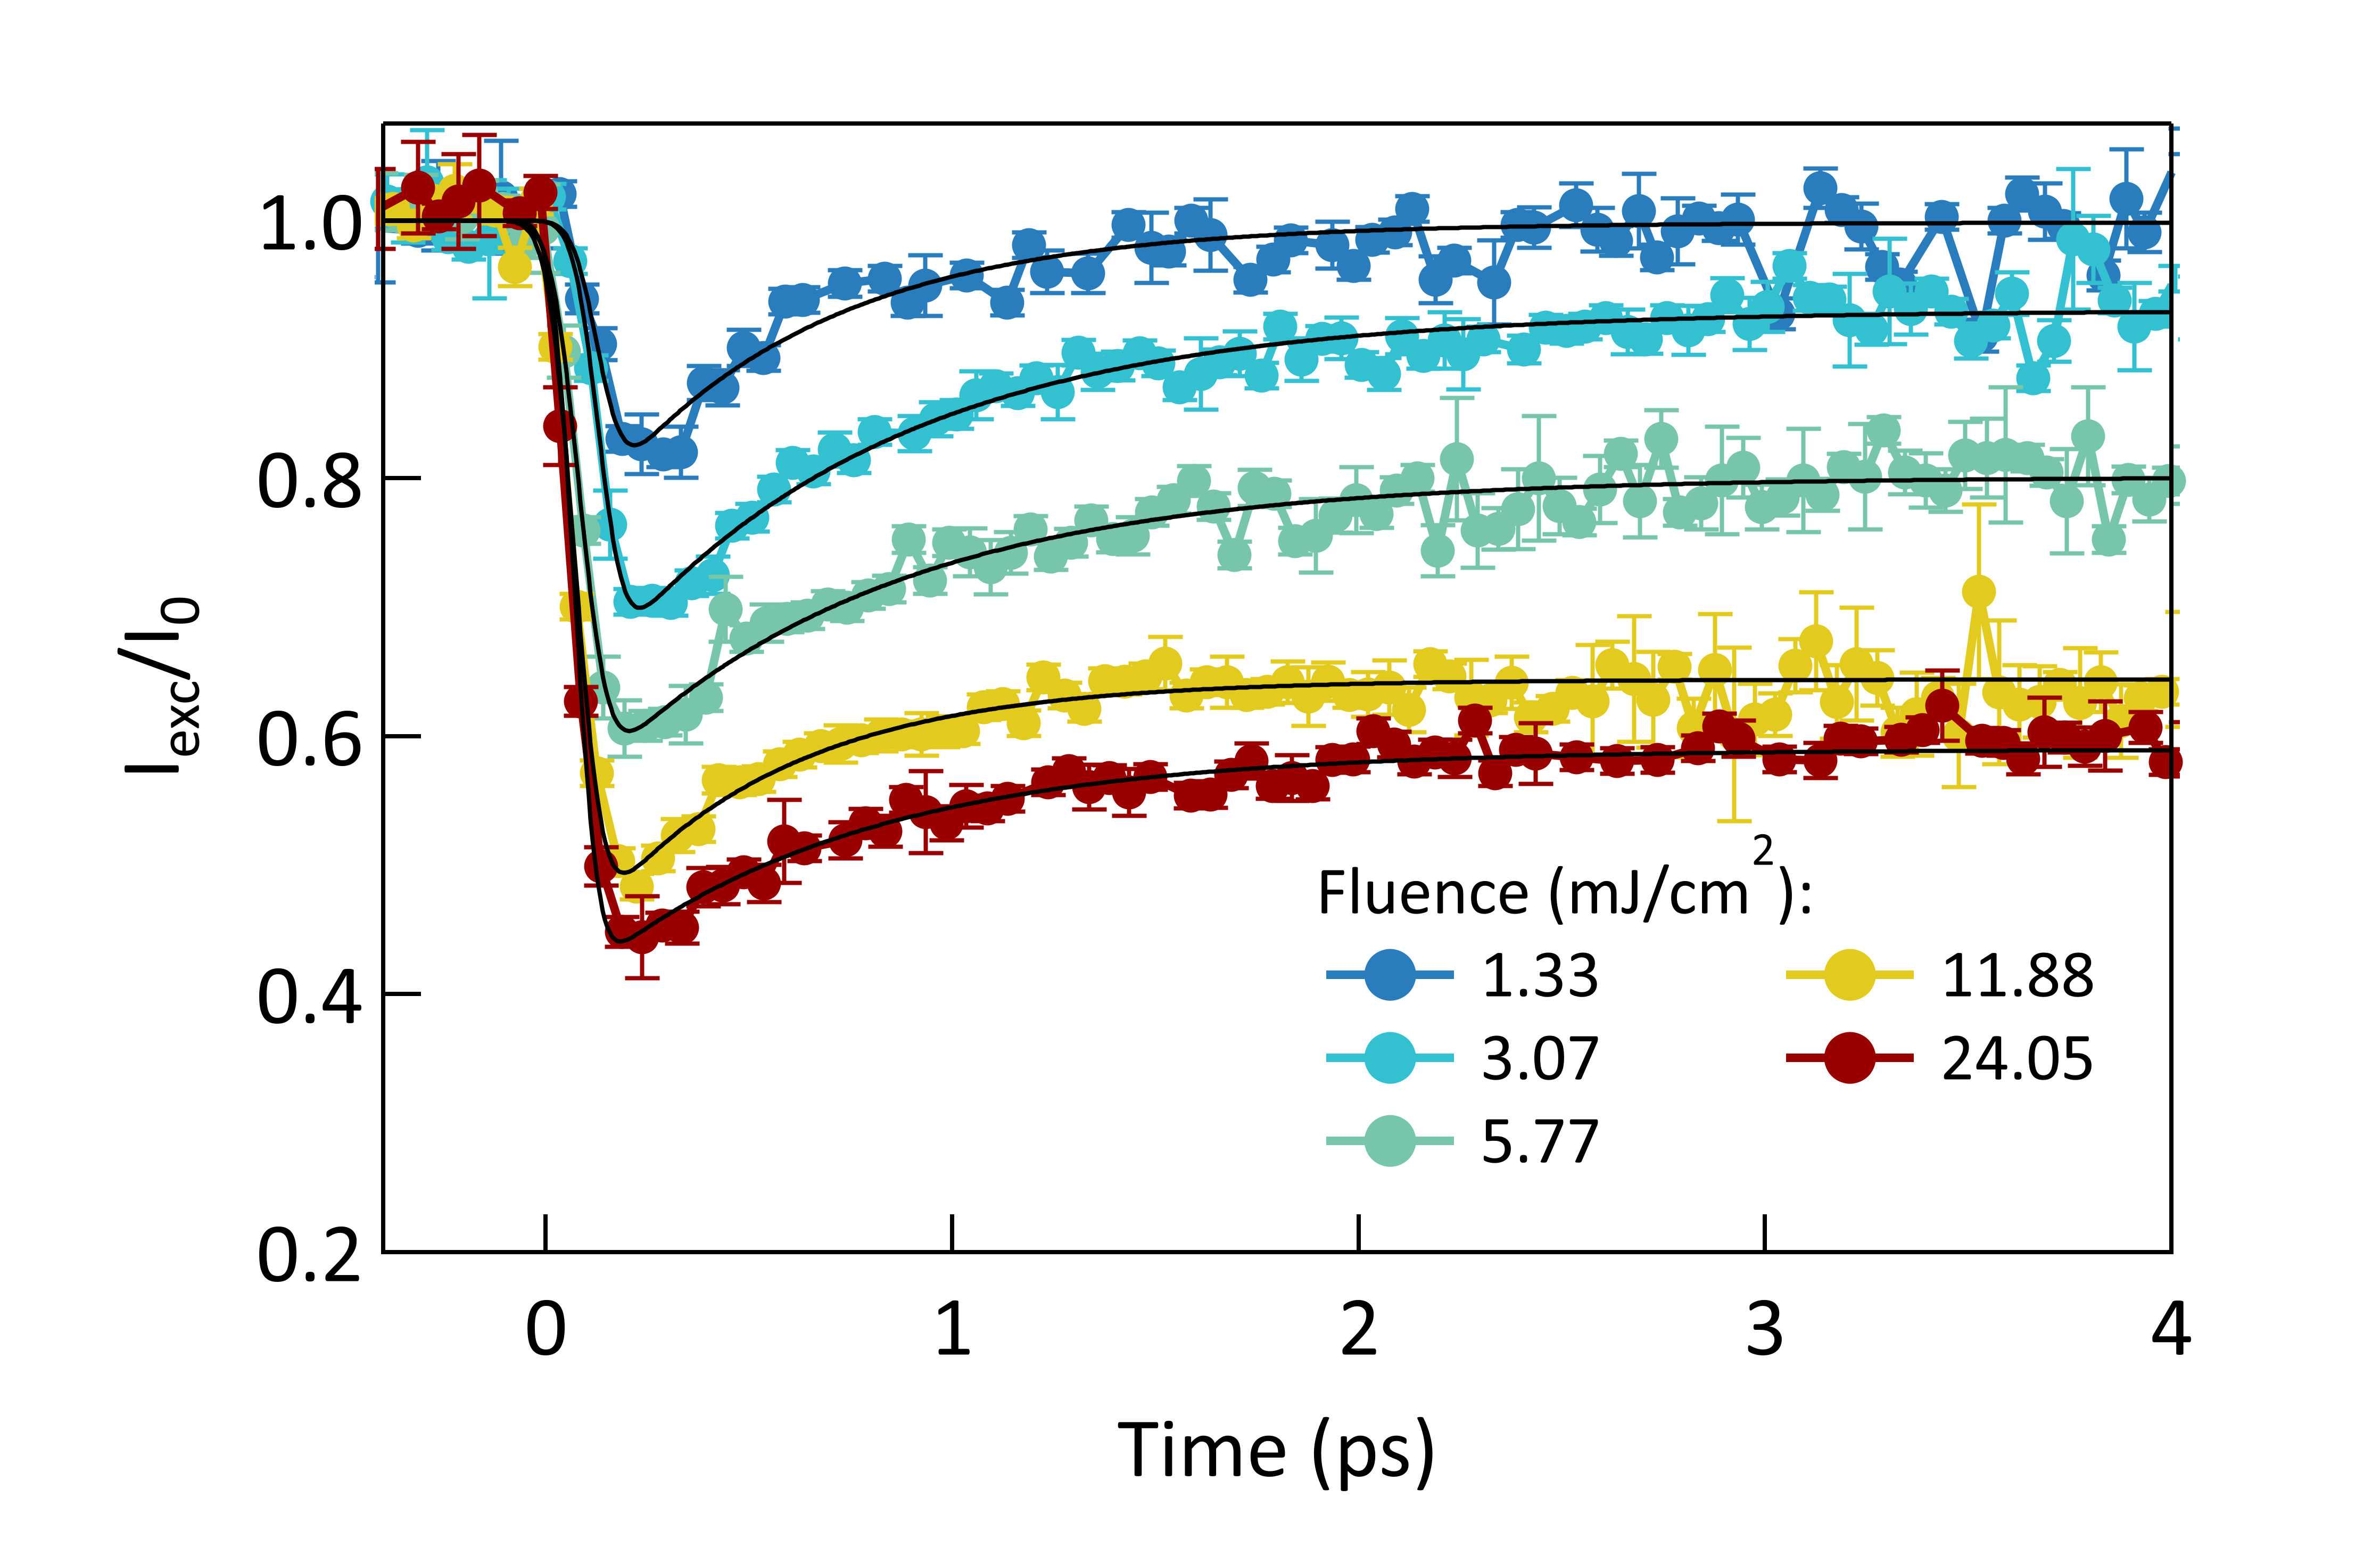
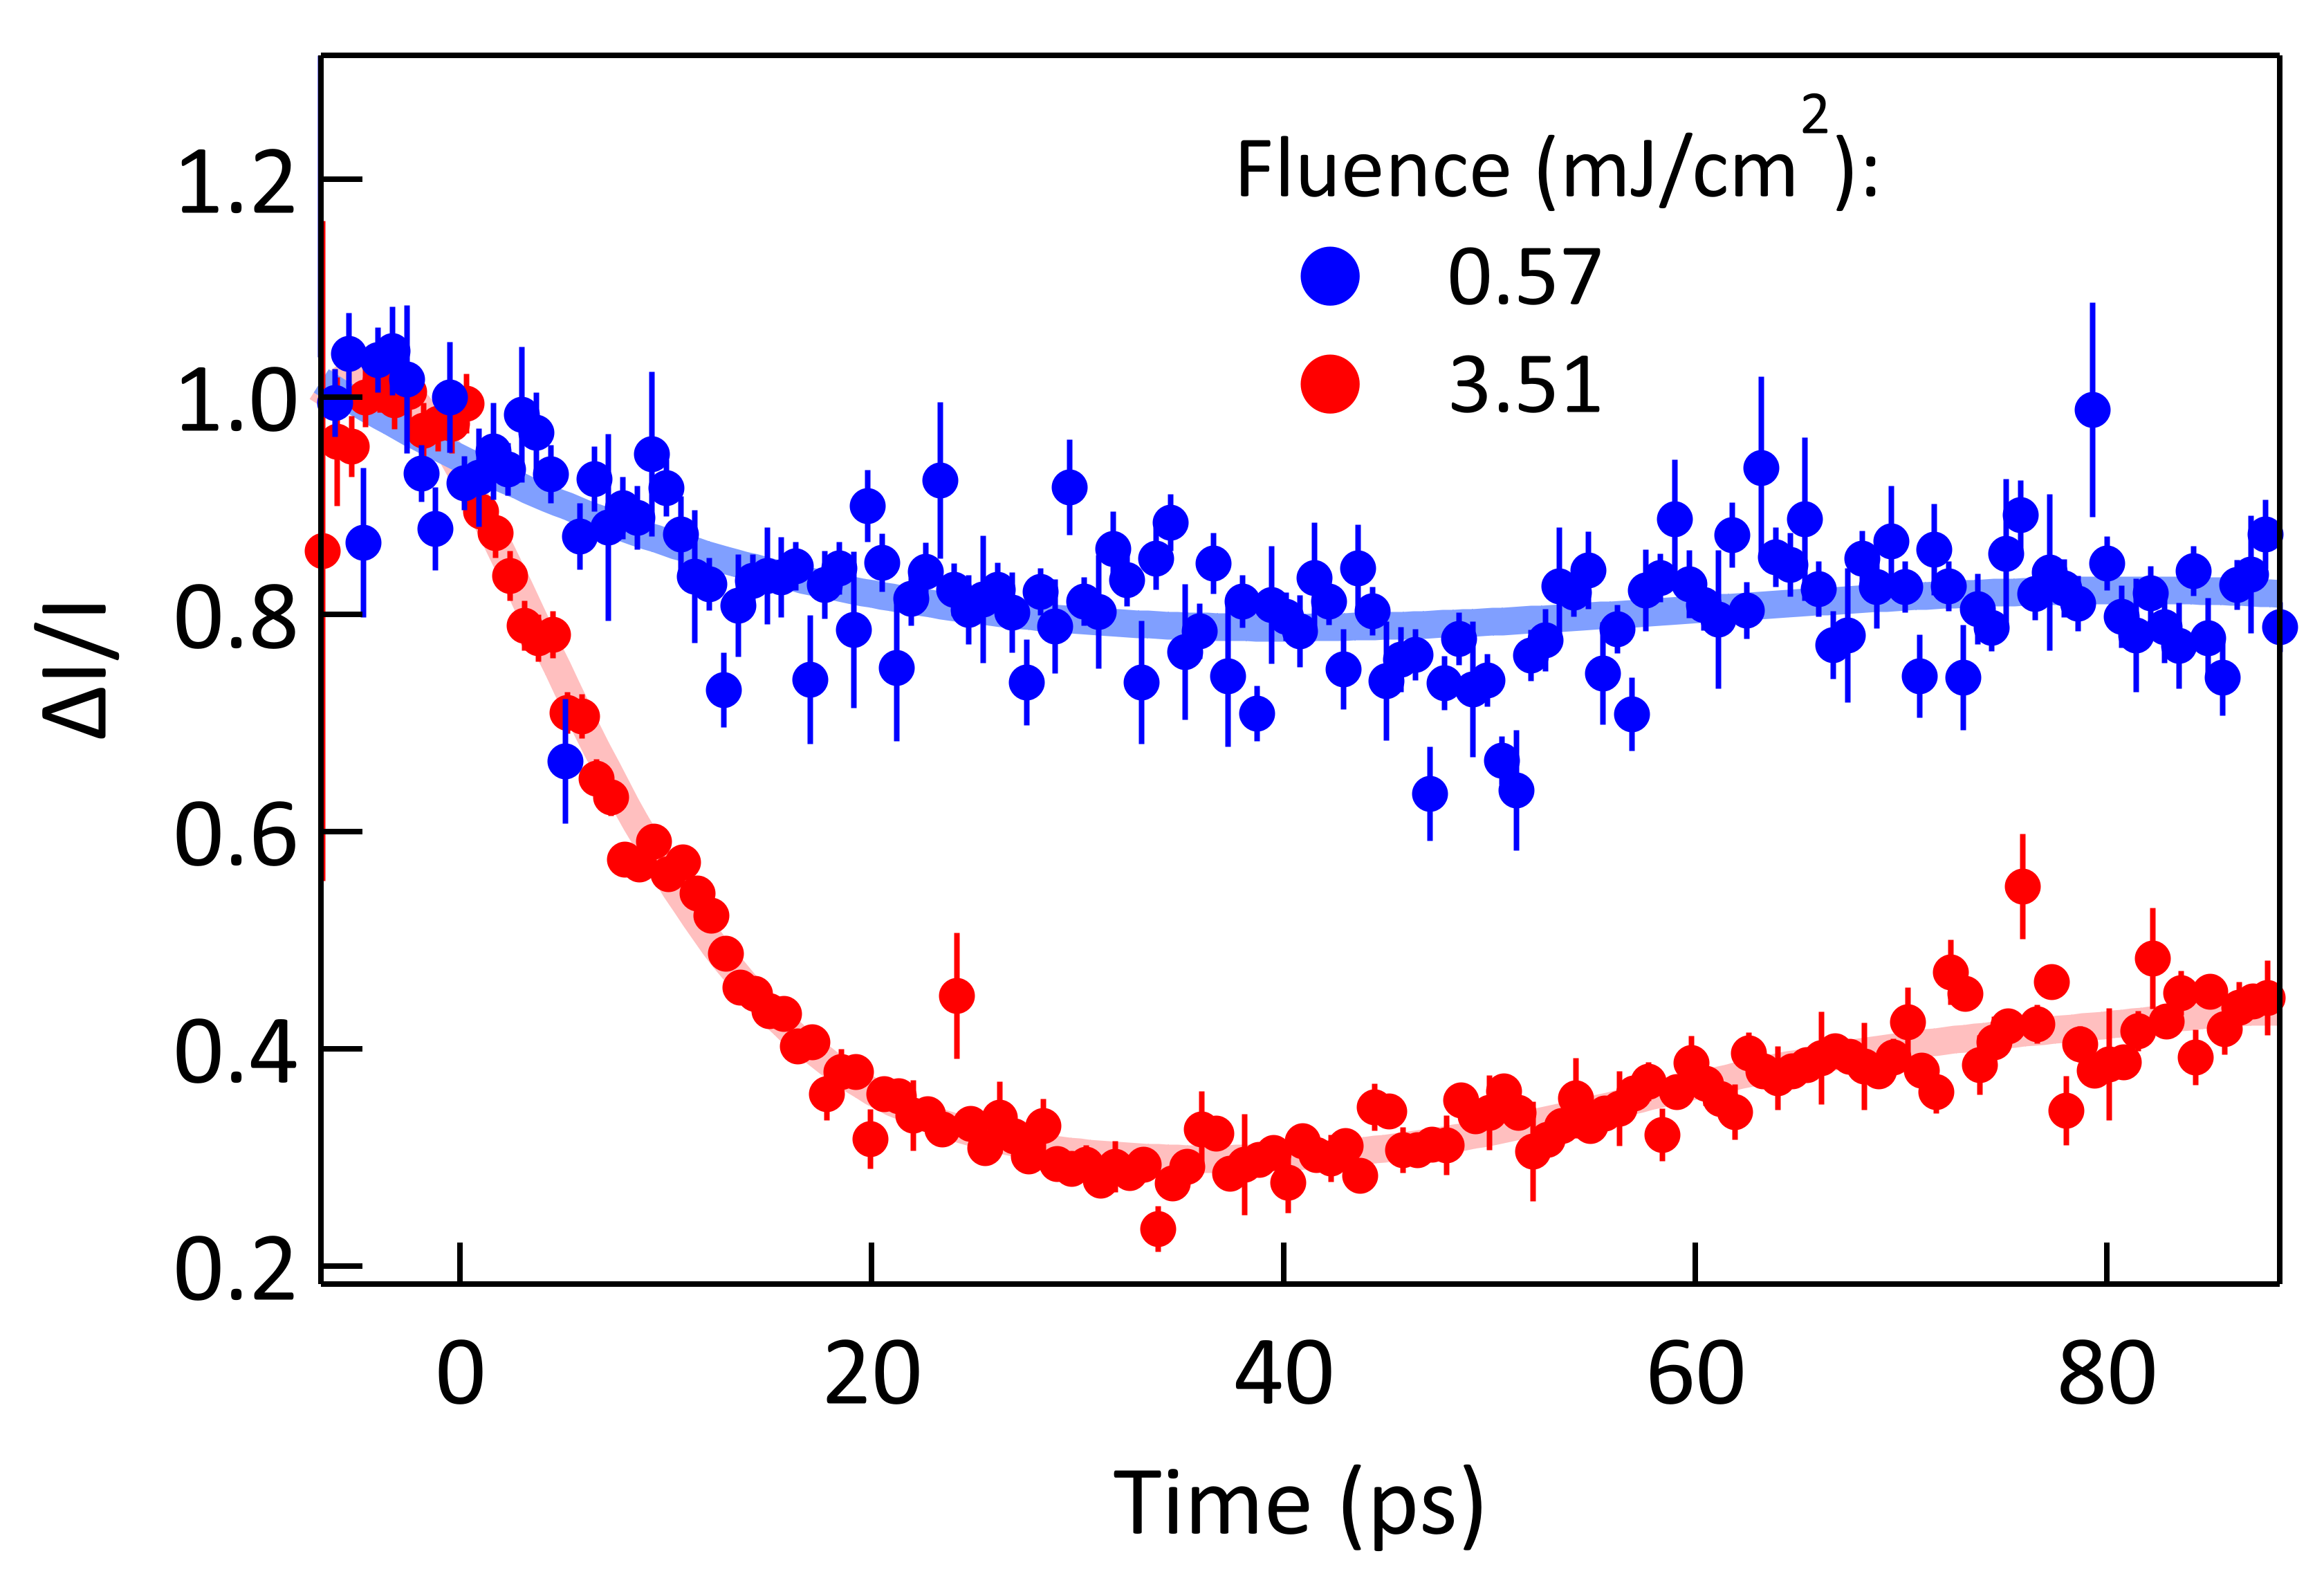
The time evolution of the (1 0) peak maximum intensity upon optical laser excitation is illustrated in Fig. 2 for several laser excitation fluences. In all of the time traces a sudden decrease of intensity is observed within 100 fs after the optical laser excitation. Angular -scans (rocking curves) at fixed time delay (see Fig. 5) confirm that the magnetic peak position in reciprocal space does not change within the first 10 ps after excitation. Therefore, we observe a reduction of the diffracted intensity related to the reduction of the sublattice magnetization up to 60% on a sub ps timescale, followed by a recovery of the intensity on a several ps timescale. The persistence of a sizable part of the magnetic diffraction intensity is likely due to the imperfect matching of the laser and the X-ray penetration depths in a crystal as observed, for example, in similar experiments Caviezel et al. (2012); Windsor et al. (2020); Mazzone et al. (2021).
In order to extract an upper bound for the relevant timescales from these time traces and to readily compare such values with other experimental results Afanasiev et al. (2019); Mazzone et al. (2021); Caviglia et al. (2013); Stoica et al. (2020), we have fit the data using an error function, which captures the fast decay time (), multiplied by an exponential term that captures the recovery time (). This model is appropriate when the response of the material to the excitation is linear and significantly faster than the time resolution of the experiment, which in this case is determined by the pump and probe pulse duration as well as their relative timing stability. The fitting function has the following analytical form:
| (1) |
where , and are fit parameters that represent respectively the amplitudes of the intensity reduction and the long-lived transient, which lasts well beyond the 4 ps time window. Here, represents the time where the X-rays and the optical laser impinge concomitantly on the sample. In order to reproduce accurately the time traces, we have found that must be treated as a fit parameter. The shift in we observe as a function of the excitation laser fluence is possibly due to an uncontrolled drift of during the experiment or to saturation effects. The latter would lead also to a change in as a function of fluence, that we do not observe outside experimental uncertainties.
| (mJ/cm2) | (fs) | (fs) | (ps) | ||
|---|---|---|---|---|---|
| 1.33 | 132(8) | 69(9) | -0.11(6) | 0.54(5) | -0.001(3) |
| 3.07 | 133(4) | 69(7) | -0.13(3) | 0.71(6) | -0.034(4) |
| 5.77 | 85(3) | 78(11) | -0.12(5) | 0.71(7) | -0.099(4) |
| 11.88 | 74(3) | 75(4) | -0.10(5) | 0.47(5) | -0.180(5) |
| 24.05 | 72(2) | 63(5) | -0.09(5) | 0.66(4) | -0.207(3) |
Taking into account the caveats above, we observe that the fit of a time trace returns a value of on the order of 65-75 fs for the fast decay constant (see Table 1). Therefore, our experiments reveal the presence of a sub-100 fs drop of the magnetic peak intensity, for all the laser fluences, with an average decay time = 71 6 fs. In addition, we observe two distinct behaviours as a function of the laser fluence. For fluences below 5 mJ/cm2 the antiferromagnetic ordering recovers almost completely to the initial intensity with the first 2-3 ps, while for higher laser fluences the intensity remains suppressed over the time window of our measurements. A similar behaviour has been observed in other transition metal based oxide materials Cavalleri et al. (2001); Beaud et al. (2009); de Jong et al. (2013); Esposito et al. (2018a); Porer et al. (2020); Afanasiev et al. (2019) and is often assumed to herald the occurrence of a phase transition in the probed sample volume. In order to obtain a more quantitative description of our measurements we apply a modified version of the model presented in Refs. Beaud et al., 2014; Esposito et al., 2018b; Burian et al., 2021 based on an effective time-dependent order-parameter , which in our case represents the staggered magnetization associated with the antiferromagnetic ordering.
Within this model, there exists a threshold value of the absorbed local energy density per volume above which the system undergoes a phase transition where the order parameter vanishes. In our case this will correspond to the melting of the long range antiferromagnetic order when the ratio , i.e. when the sublattice magnetization vanishes. The time-dependent order-parameter model can take into account the effective time resolution of the experiment and the fact that the optical laser pulses are absorbed as they propagate through the sample.
Specifically, we account for the depth-dependent excitation profile by splitting the sample into N = 400 layers of thickness of 1 nm. The electronic excitation density of a layer at a depth is then , where is the effective laser penetration depth. For a given laser fluence , . As explained in detail in Appendix A, we express the diffracted intensity as
| (2) |
where is the time-dependent order parameter normalized to unity at time before excitation and for times during and after the excitation given by
| (3) |
where is a critical excitation density and is the absorbed local energy density per volume, which depends on the incoming pump fluence and is analogous to a critical exponent of the initial excitation. If the phase transition to the paramagnetic state occurs and . In order to account for the recovery of the order parameter, an energy dissipation term is introduced in the expression for Beaud et al. (2014).
| (4) |
In using this form for we approximate the relaxation of the electronic energy density as a two-step process. The time constant characterizes a fast relaxation via electron-phonon interactions, which is followed by a much slower relaxation characterized by a time constant much larger than the measurement time window. Here Beaud et al. (2014); Porer et al. (2020)
| (5) |
where is an effective critical exponent of the quasi-thermalized system after the initial relaxation process.
The quantity is a function of and , which can be regarded as the critical exponents with respect to the initial excitation () and after equilibration ( ). If , and the variation in the observed intensity will be the same at short and large time after the laser excitation. If , the change in the measured intensity will be larger at the shorter time scales, signalling the presence of a mechanism leading to a partial recovery of the order parameter with a time constant . For , one could anticipate an almost complete recovery of the order parameter, at least for the lowest excitation fluences.
We assume for the initial electron energy density
| (6) |
which describes the energy deposited by the pump laser pulse of duration at a given depth .
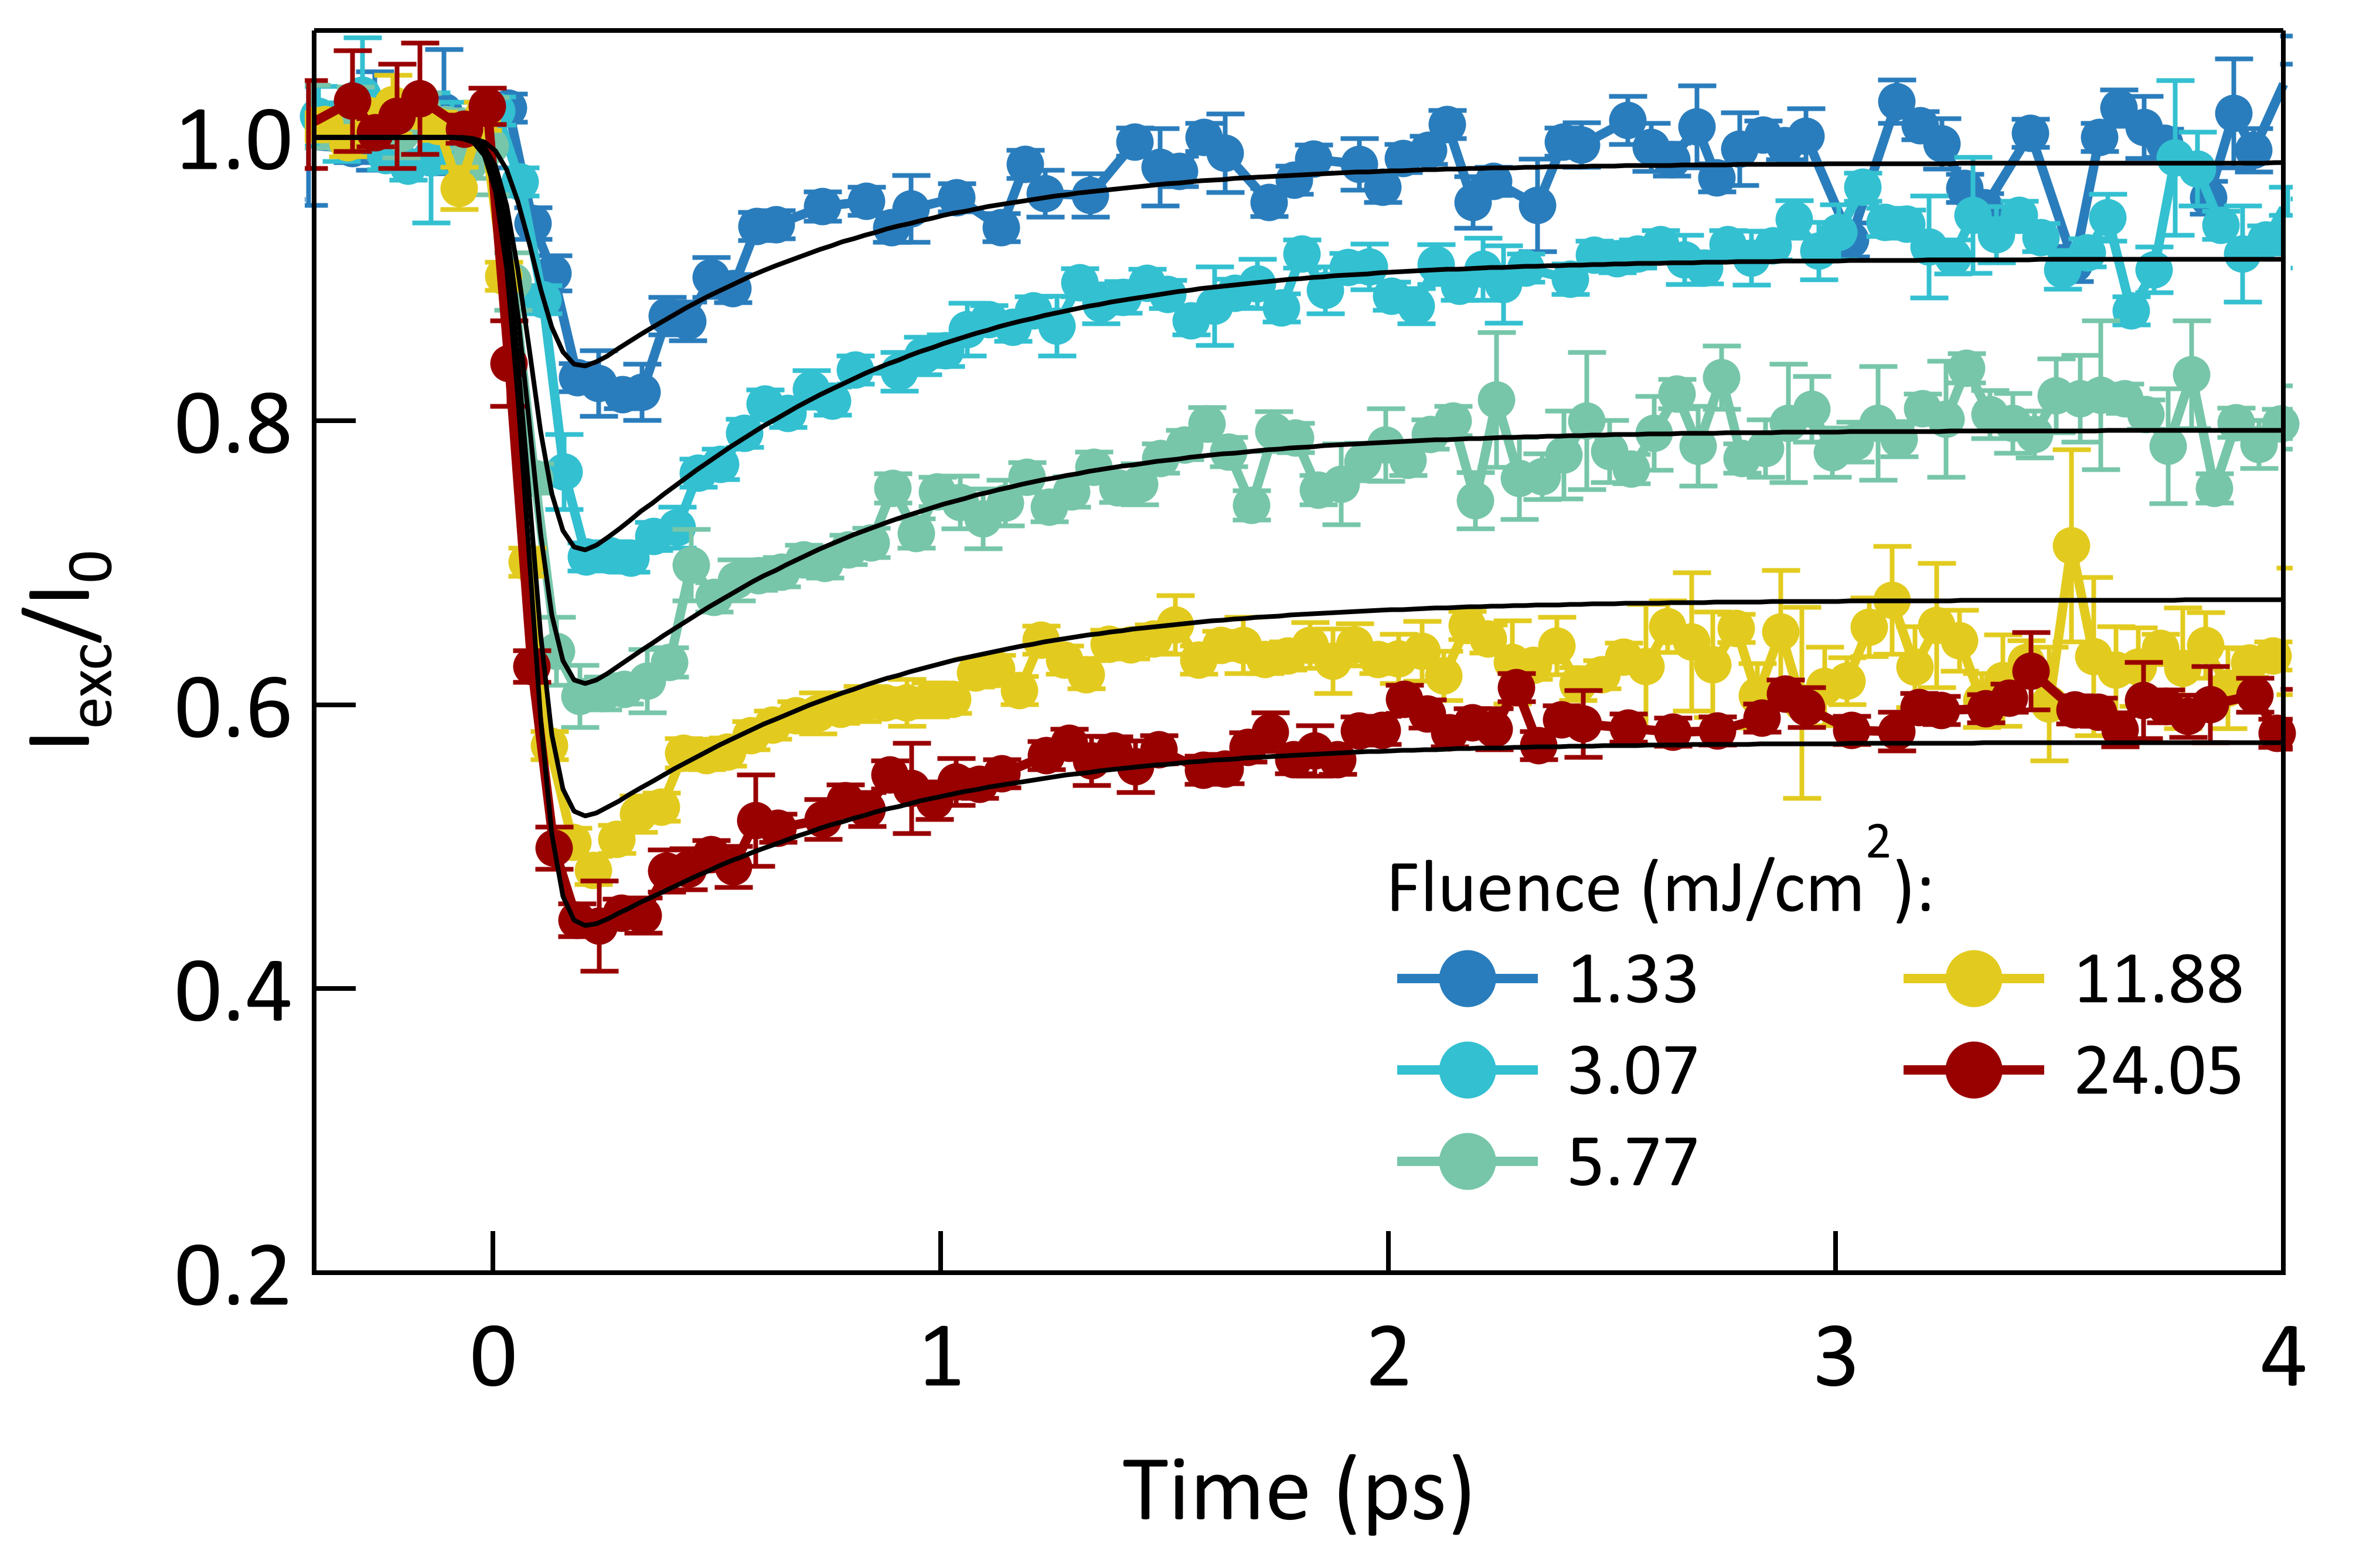
With such a model we are able to describe reasonably well all the observed time traces, as shown in Fig. 3. From the simultaneous fit of all the time traces, we find the following values (and associated uncertainties) for the fit parameters: the effective optical penetration depth nm, which is reasonable if we consider that the effective optical penetration depth is reduced in our geometry when compared to the 50 nm value estimated for a powder sample in normal incidence conditions Vecchio et al. (2013). The critical excitation density is J/cm3 and the critical exponent is , which is considerably higher than the values 0.5 and 0.69(3) reported for PrCaMnO3 Beaud et al. (2014) and for PrCaMnO4 Porer et al. (2020), respectively. The estimated value for the exponent in this experiment suggests an approximately quadratic relation between the scattering intensity and the excitation energy density. The value of is smaller than that reported for PrCaMnO3 Beaud et al. (2014) and PrCaMnO4 Porer et al. (2020), where it was found and , respectively. The differences between the fitted values of both and for the present experiment and these previous studies may be partially due to the fact that the previous studies were on thin films, whereas the current study is on a bulk sample where the laser excitation depth is smaller than the x-ray penetration depth. Since the model does not explicitly treat energy transport effects, the fitted values of the parameters may be influenced by these effects. Nevertheless, the ratio of / is significantly smaller for NaOsO3, making plausible to conclude that the electronic energy dissipation term is more effective in NaOsO3 as it is characterized by a relaxation constant ps, whereas in PrCaMnO3 it was ps. Such results could possibly reflect the difference in the phase transition occurring it those two classes of materials, with the manganites undergoing a change in the structure of the material, while this should not be the case for NaOsO3 Calder et al. (2012). In such a scenario, one would expect a recovery requiring a lattice rearrangement to occur on a longer timescale than a reordering of spins to their antiferromagnetic ground state ordering. The observed recovery time-scale points to the presence of an efficient thermalization process of the transient free carrier population induced by the pump pulse, consistent with the small gap and the partially delocalized nature of the magnetism in NaOsO3.
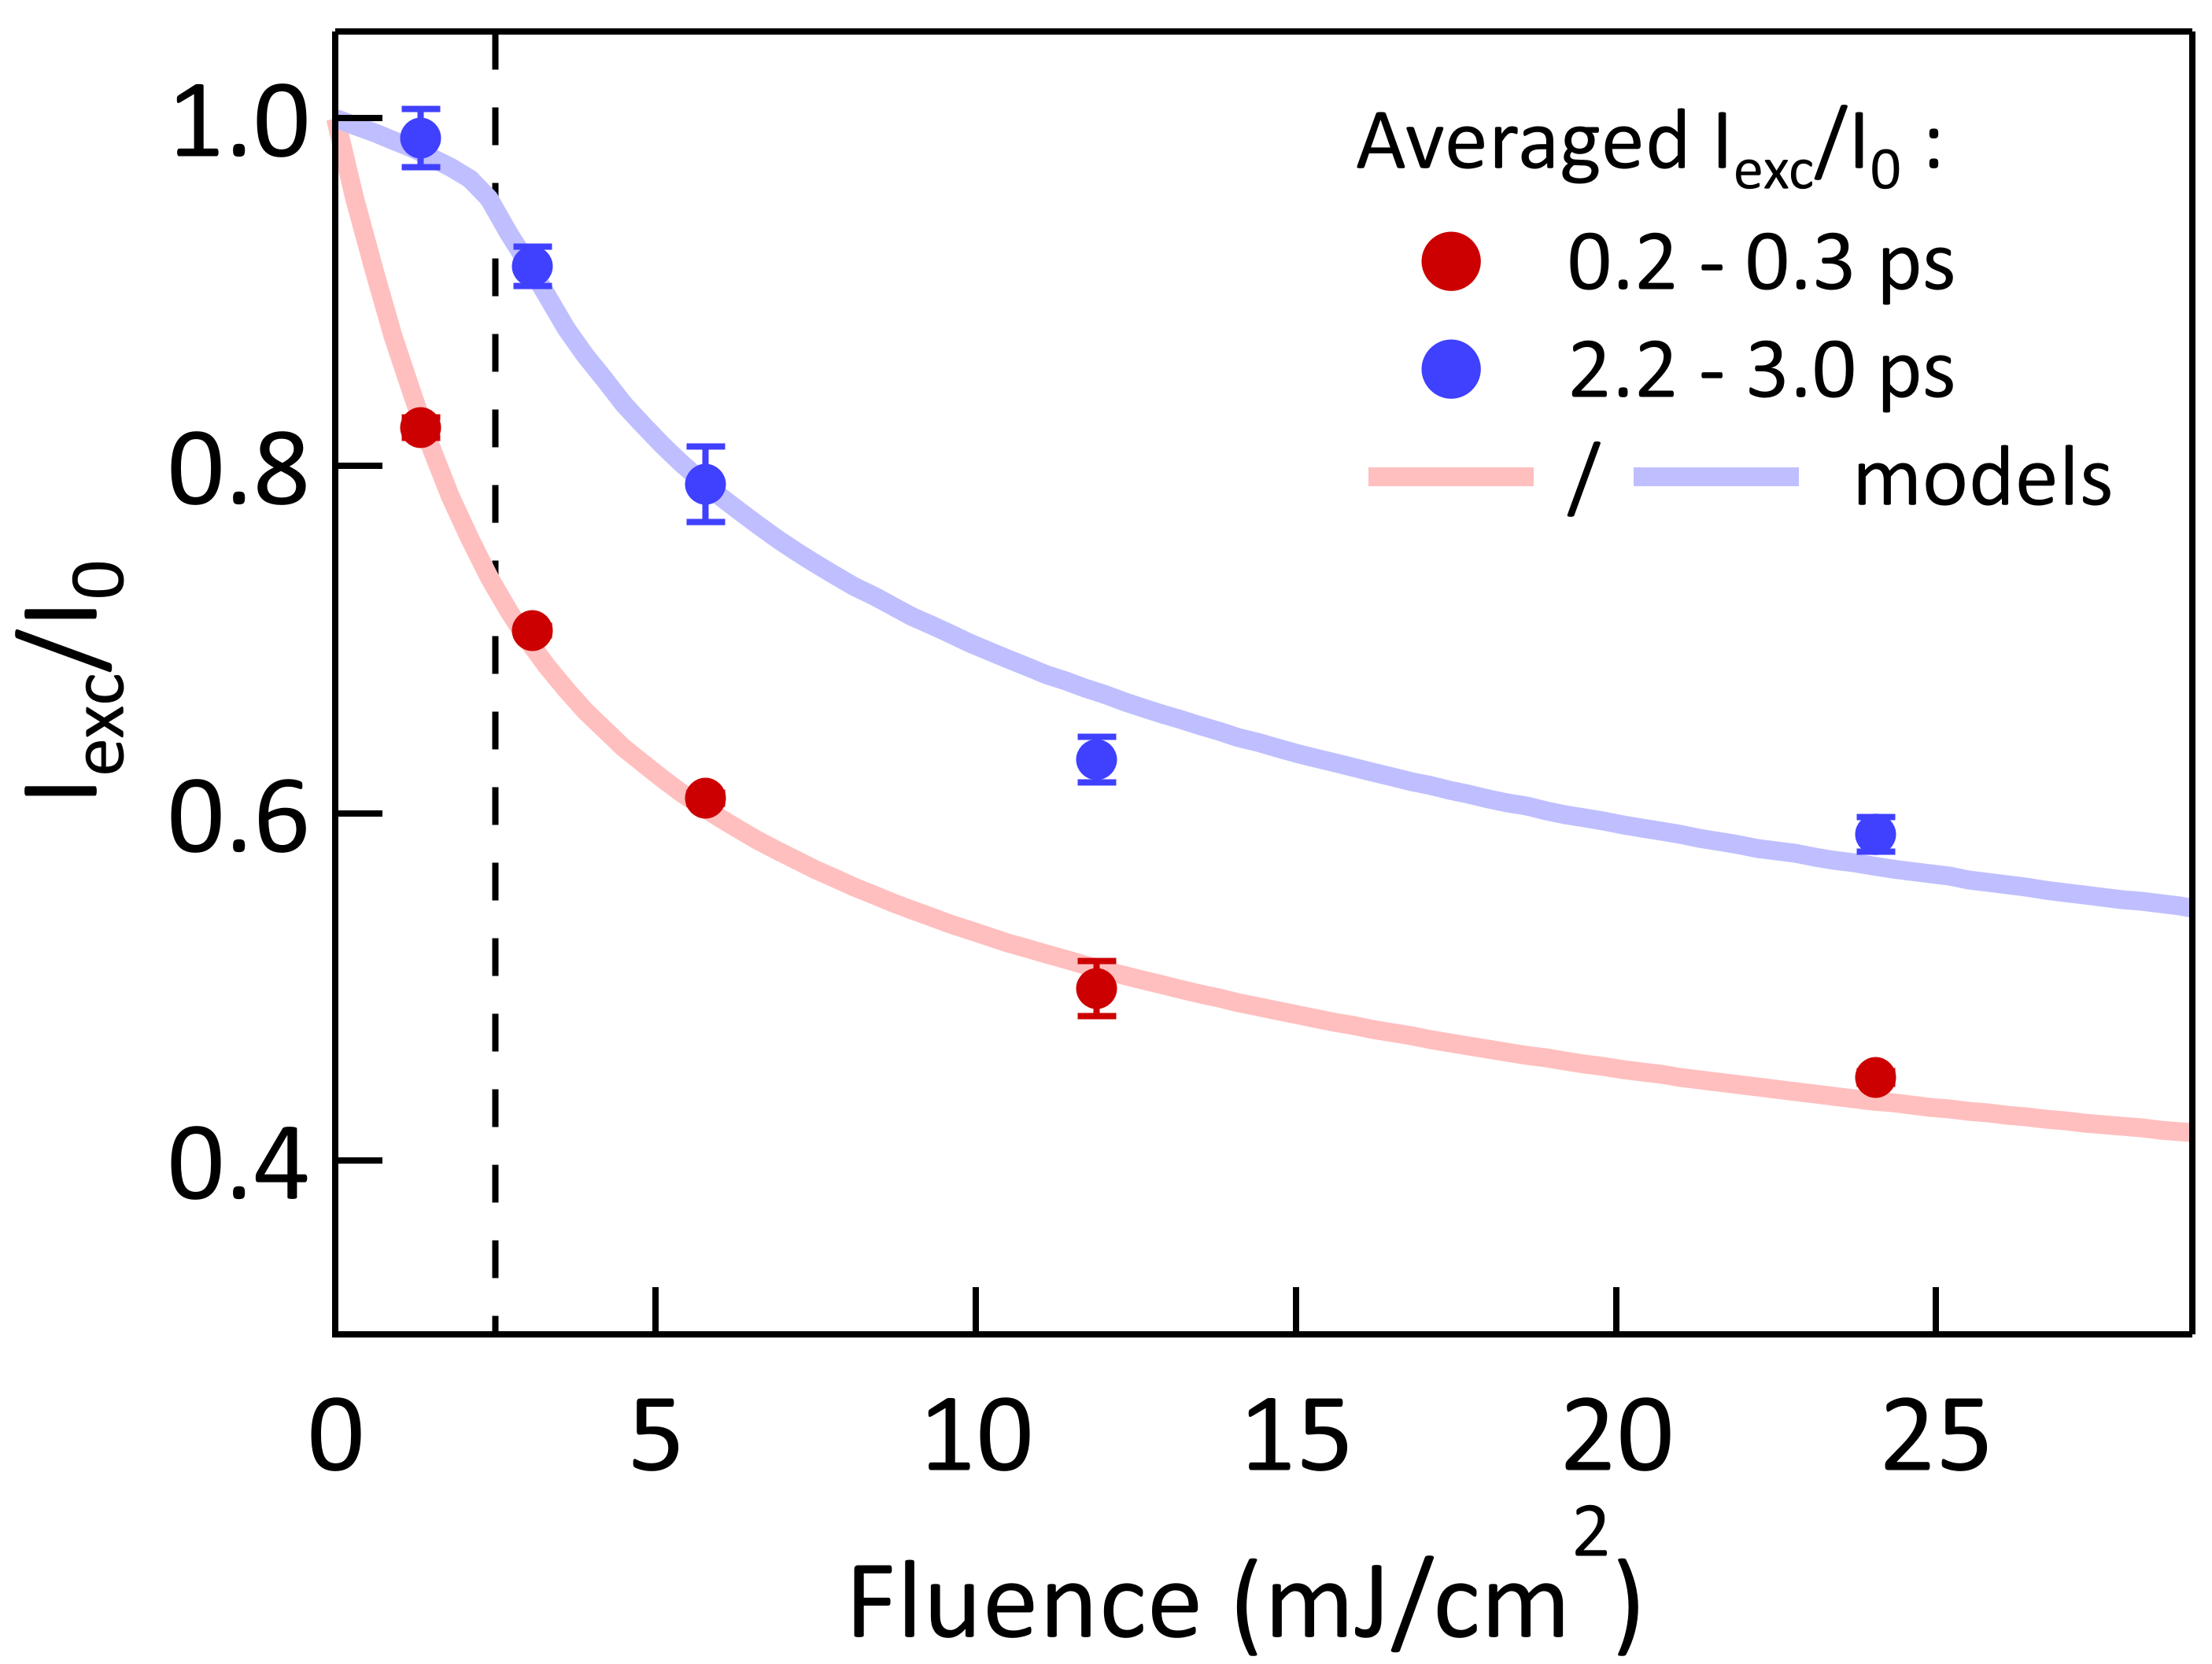
Finally, the model, taking into account the experimental resolution, enables us to extract the melting timescale of the antiferromagnetic order, estimated in fs. The resulting timescale of the melting of the antiferromagnetic order following a fs laser excitation is faster compared to other 5 oxide materials Dean et al. (2016); Afanasiev et al. (2019); Mazzone et al. (2021) (see Table 2) and, in agreement with the estimate based on Eq. (1), and it is comparable with the experimental resolution. The critical behaviour of the squared order parameter as a function of the excitation fluence is illustrated in Fig. 4, which compares the measured relative changes of the scattering intensity at 0.2-0.3 ps and 2.2-3 ps after later laser excitation. The fluence =2.5(2) mJ/cm2 corresponding to the critical value of the energy density at the surface has a value similar to that observed in the manganites Beaud et al. (2014); Porer et al. (2020) and for the melting of the charge ordering in NdNiO3 Esposito et al. (2018b), which has also an insulator-to-metal transition coinciding with antiferromagnetic ordering. The photoinduced magnetic response in the nickelate shows as for NaOsO3 a prompt recovery of the magnetic ordering for low laser fluences (1mJ/cm2), suggesting that the critical fluence for this nickelate is lower than for NaOsO3. However, one should exercise caution in comparing fluence values from different experiments as they strongly rely on values of laser power and beam size measurements that can be affected by significant uncertainties.
IV Discussion
There is a consistent body of evidence that impulsive laser excitations above the band gap are able to drive an insulator-to-metal transition Fiebig et al. (2000); Ogasawara et al. (2001, 2002); Ruello et al. (2007) and, for samples which concomitantly order antiferromagnetically, destroy the antiferromagnetic long range ordering Caviglia et al. (2013); Dean et al. (2016); Afanasiev et al. (2019); Mazzone et al. (2021); Stoica et al. (2020). In these materials, one expects to be able to use time-resolved experiments to draw conclusions on the hierarchy of interactions leading to the development of the insulator-to-metal transition. Specifically, it is interesting to see if the insulator-to-metal transition in oxides based on transition metal atoms could be categorized following the observed changes in physical properties in response to impulsive laser excitation. For example, NaOsO3 originally attracted interest as it was thought to be a rare example of a Slater insulator Calder et al. (2012); Gurung et al. (2018), namely showing a magnetically driven insulator-to-metal transition. While alternative explanations of the nature of the insulator-to-metal transition have been proposed Kim et al. (2016a); Vale et al. (2018b, a), it is clear that there is a strong coupling between the magnetism and electronic structure. Calder et al. (2012); Middey et al. (2014); Gurung et al. (2018); Kim et al. (2016a).
It would therefore be interesting to compare the sub-100 fs dynamics in NaOsO3 with those of NdNiO3 in which there is a large consensus on the fact that the appearance of the antiferromagnetic phase is a byproduct of the concurrent insulator-to-metal transition. NdNiO3 is a charge transfer insulator (a Mott insulator has a gap between two bands of the same character, e.g. both 3d, whereas for a charge transfer insulator the gap has a mixed character, e.g. between the oxygen 2p and the transition metal 3d bands) and one would expect the electronic response time to be faster than , the magnetic one. Vice versa, for NaOsO3 one would expect to be comparable with . In this respect, neither our data nor those presented in Ref. Caviglia et al., 2013; Stoica et al., 2020 are conclusive as they are limited by time resolution available in the time-resolved X-ray measurements. Our experiments on NaOsO3 have shown that the magnetic response to a fs optical excitation occurs within few tenths of fs after the fs laser excitation. Modelling the time trace with Eq. (1) gives 71(6) fs, while the model described in Sec. III, which takes into account the experimental time resolution gives 62(12) fs. These value are comparable with those of in NaOsO3 and NdNiO3, which are also limited by the time resolution of the optical experiments (see Table 2). While from our measurements at room temperature it would be tempting to conclude that , it must be noted that the magnetization time response in antiferromagnetic Sr2IrO4 can be halved when experiments are conducted at low temperatures Tm sufficiently far from TN Afanasiev et al. (2019).
Regrettably, drawing conclusions on the microscopic parameters governing the timescale of the disappearance of the antiferromagnetic order parameter upon impulsive laser excitation is difficult, due to the scarcity of experiments reporting true timescales of the antiferromagnetic response. The fact that this timescale seems to be faster in NaOsO3 than other Ir based oxides could possibly point to the role played by the presence of itinerant magnetism facilitating the electron mobility and therefore the further delocalization of the magnetic moments after the fs laser excitation. However, recent experiments on FeRh, a metallic antiferromagnetic at room temperature, suggest that changes in the band structure occur only on the order of few hundreds of fs Pressacco et al. (2021). So it is clear that the full details of the band structure should be taken into account in order to obtain a quantitative description of the temporal evolution of the antiferromagnetic order parameter. In this respect, it must be also mentioned that non-equilibrium dynamic mean field theory predicts for timescales on the order of a few fs. Afanasiev et al. (2019) Accordingly, in order to gain a deeper understanding of the interplay between the electronic structure and magnetism in oxide materials upon laser excitation more experiments with better time resolution are required.
| Sample | T(K) | Tm/TN | Reference | ||
|---|---|---|---|---|---|
| Sr3Ir2O7 | 120111Limited by experimental time resolution. | 9511footnotemark: 1 | 110 | 0.39 | [Mazzone et al., 2021, Chu et al., 2017] |
| Sr2IrO4 | 330 | 250 | 75 | 0.39222For the thin film sample used in Ref. [Afanasiev et al., 2019] T 195 K. | [Afanasiev et al., 2019] |
| Sr2IrO4 | 560 | 250 | 190 | 0.9722footnotemark: 2 | [Afanasiev et al., 2019] |
| NdNiO3 | 12511footnotemark: 1 | 6011footnotemark: 1 | 40 | 0.27 | [Stoica et al., 2020, Liang et al., 2018] |
| NaOsO3 | 71(6) | 9011footnotemark: 1 | 300 | 0.73 | this work |
V Conclusions
In summary, we have presented the results of time-resolved X-ray experiments on NaOsO3, which aimed to ascertain the time scales of the melting of the antiferromagnetic structure. We have found that the magnetic order is quenched on a timescale fs, which is faster than in other perovskite compounds. These results may indicate the strong coupling between the electronic and magnetic degrees of freedom in this material. Our measurements of changes in the structural Bragg reflections show evidence of subsequent lattice dynamics extending over times of several picoseconds.
The raw data files that support this study are available via the Zenodo repository zen .
Acknowledgments
We thank D. Hsieh and D. Mazzone for sharing their data, which were used to extract some of the timescales reported in Table 2. We thank I. Lo Vecchio for sharing the NaOsO3 data from Ref. Vecchio et al., 2013. We are also indebted with J. Mentink and M. Eckstein for stimulating discussion. This research work was supported from funding provided by the Swiss National Science Foundation, SNF Project No. 200021162863. Work in Japan was partly supported by JSPS KAKENHI Grant Number JP20H05276, and Innovative Science and Technology Initiative for Security (Grant Number JPJ004596) from Acquisition, Technology, and Logistics Agency (ATLA), Japan. The experiment at SACLA was performed with the approval of the Japan Synchrotron Radiation Research Institute (JASRI; Proposal No. 2017A8021). S.S. acknowledges ETH Zurich Post-Doctoral fellowship and Marie Curie actions for People COFUND program and the Carl Tryggers foundation with project number (113705531).
Appendix
V.1 Modelling of the antiferromagnetic X-ray diffracted intensity
In a static diffraction experiment the measured intensity of a selected diffraction peak is proportional to the square of the unit cell structure factor , with being the momentum transfer. If the sample is excited by an ultrashort laser pulse, the expression of the structure factor needs to be modified to take into account the depth-dependent excitation profile. Namely, close to the surface of the sample, the laser excitation would suppress or modify the scattering cross section, while layers further away from the surface could be unaffected, at least on very short time scales. It is customary to account for this depth dependence by splitting the sample into layers, each at a given depth zi. Each layer will scatter X-rays differently and will contribute to the total diffracted intensity. To calculate the total diffracted intensity two limiting cases are typically considered. In the first case, the in-plane coherence length is much larger than the X-ray effective penetration depth (the X-ray penetration depth must be corrected by a geometrical factor that takes into account the scattering geometry, in our case). In this case the contributions from each layer are summed in amplitude and the diffracted intensity is given by
| (7) |
In the opposite case, where the penetration depth is much larger than the in-plane coherence length , the contributions of the different layers should be added incoherently such that the diffracted intensity is expressed as
| (8) |
In our experiment we are in an intermediate situation, where and are of the same order of magnitude, so it is not evident which would be the best approximation to describe the diffracted intensity. In order to model the experimental results, we have accordingly empirically fitted the data first with Eq. (7) and subsequently with Eq. (8). As shown by Fig. 3, the model based on the expression of the intensity given in Eq. (8) reproduces well the fluence dependence of the antiferromagnetic diffracted intensity. Conversely, the model based on Eq. (7) does not provide a reasonable description of the measured diffraction intensities. We have therefore concluded that, for our specific experimental conditions, the model based on Eq. (8) is best suited to describe the data we have gathered on the antiferromagnetic peak.
V.2 Lattice dynamics
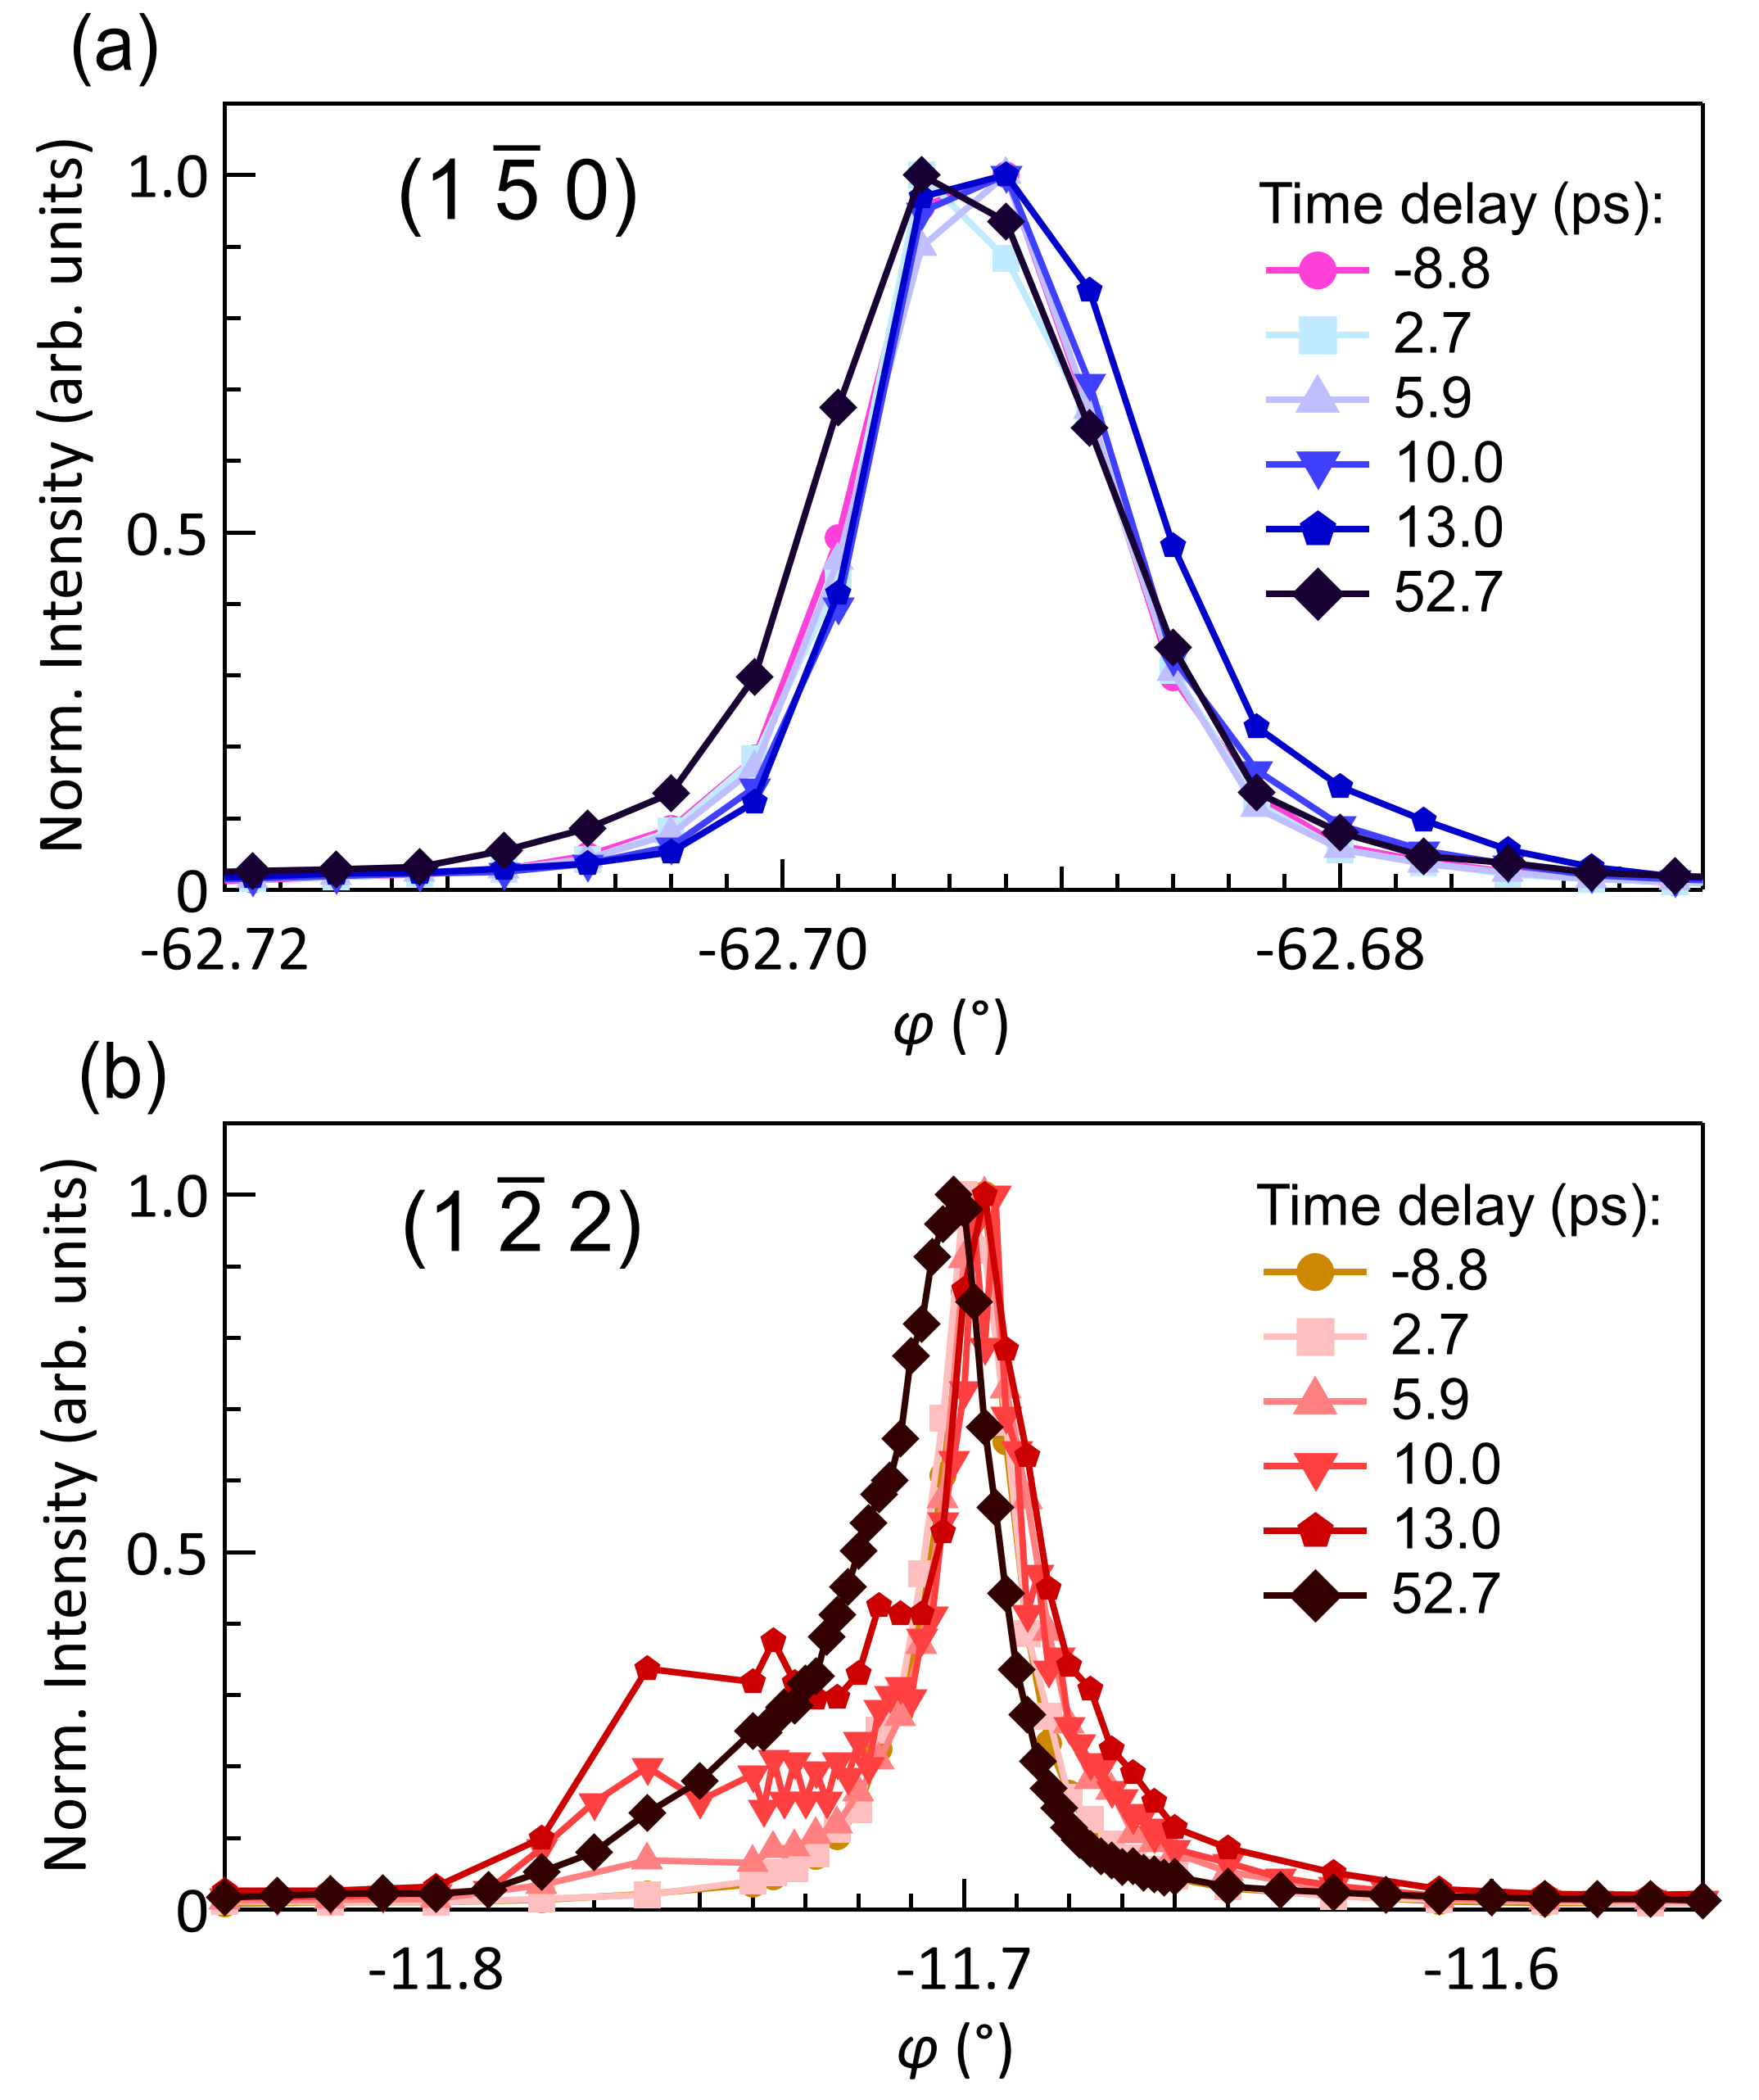
To ascertain the presence of lattice deformation due to laser induced heating or strain waves we have performed angular scans at selected time delays on a magnetic and lattice peak. In order to maintain the X-ray grazing incident angle fixed during the scan, we have scanned the diffractometer angle . The results, gathered with the laser fluence of 24.05 mJ/cm2 and normalized to 1 for the ease of comparison, are illustrated in Fig. 5a for the magnetic peak (1 0) and in Fig. 5b for the structural peak (1 2). The magnetic peak does not show an appreciable change of the peak position for time delays up to 10 ps. Also at time delay of several tenths of ps, where heat diffusion has occurred, the change in the peak position is tiny. Such a behaviour is not observed for the structural peak. As shown in Fig. 5b, the position and the shape of the (1 2) Bragg peak changes significantly for time delays larger than 2.7 ps. Specifically, for time delay of 6 ps a second peak appears at , indicating the presence of a laser induced heating effect. At 10 ps time delay the presence of the second peak is more prominent and it is clearly visible as a distribution of intensity between the two peaks, which we ascribe to the presence of a thermal gradient in the sample. Finally at larger time delays, the heat has diffused from the lattice planes close to the sample surface to all of the X-ray probed volume, resulting in a sizable shift of the structural Bragg peak. A thermal gradient is still present, as indicated by the larger full width at half maximum (FWHM) and the asymmetric shape of the Bragg peak. The fact that the angular scans of the two peaks show such a marked difference for time delays larger than 2.7 ps can be understood as follows. The antiferromagnetic peak intensity decreases strongly as the sample temperature approaches TN. Therefore, in the case of the magnetic peak no second peak nor a distribution of intensity is to be expected.
As a next step, in order to determine the laser induced lattice dynamics, two structural lattice peaks (1 2) (with no scattering contribution from the Os ion) and (2 0) (with a scattering contribution from the Os ion) were measured, using X-rays with an incident photon energy of 10.787 keV (0.115 nm), the same used for the antiferromagnetic peak. Typically, phonon modes involving heavy ions are lower in frequency, and the laser excitation energy is transferred from electronic systems first to high energetic phonon modes. So one could expect a different time evolution for the two reflections, subsequent to the laser stimulus. The timescales of the drop in lattice peak intensities were found to be 11 ps (1 2) and 20 ps (see Fig. 6), so significantly slower than the observed antiferromagnetic order parameter and in a time window where coherent lattice expansion is expected to occur due to the laser heating effect in the excited sample volume. We tentatively ascribe the different dynamics observed to the different momentum transfer projection of the two reflections along the surface normal direction. Unfortunately, due to the limited amount of available measurement time, it was not possible to obtain more detailed information on the lattice deformation and a complete fluence dependence for such reflections. The observed dynamics is therefore ascribed to the expansion of the crystal lattice due to the heat deposited by the excitation laser pulses.
References
- Beaurepaire et al. (1996) E. Beaurepaire, J.-C. Merle, A. Daunois, and J.-Y. Bigot, Phys. Rev. Lett. 76, 4250 (1996).
- Battiato et al. (2010) M. Battiato, K. Carva, and P. M. Oppeneer, Phys. Rev. Lett. 105, 027203 (2010).
- Mueller et al. (2013) B. Y. Mueller, A. Baral, S. Vollmar, M. Cinchetti, M. Aeschlimann, H. C. Schneider, and B. Rethfeld, Phys. Rev. Lett. 111, 167204 (2013).
- Turgut et al. (2016) E. Turgut, D. Zusin, D. Legut, K. Carva, R. Knut, J. M. Shaw, C. Chen, Z. Tao, H. T. Nembach, T. J. Silva, S. Mathias, M. Aeschlimann, P. M. Oppeneer, H. C. Kapteyn, M. M. Murnane, and P. Grychtol, Phys. Rev. B 94, 220408 (2016).
- Hofherr et al. (2017) M. Hofherr, P. Maldonado, O. Schmitt, M. Berritta, U. Bierbrauer, S. Sadashivaiah, A. J. Schellekens, B. Koopmans, D. Steil, M. Cinchetti, B. Stadtmüller, P. M. Oppeneer, S. Mathias, and M. Aeschlimann, Phys. Rev. B 96, 100403 (2017).
- Ritzmann et al. (2020) U. Ritzmann, P. Baláž, P. Maldonado, K. Carva, and P. M. Oppeneer, Phys. Rev. B 101, 174427 (2020).
- Dornes et al. (2019) C. Dornes, Y. Acremann, M. Savoini, M. Kubli, M. J. Neugebauer, E. Abreu, L. Huber, G. Lantz, C. A. F. Vaz, H. Lemke, E. M. Bothschafter, M. Porer, V. Esposito, L. Rettig, M. Buzzi, A. Alberca, Y. W. Windsor, P. Beaud, U. Staub, D. Zhu, S. Song, J. M. Glownia, and S. L. Johnson, Nature 565, 209 (2019).
- Stanciu et al. (2007) C. D. Stanciu, F. Hansteen, A. V. Kimel, A. Kirilyuk, A. Tsukamoto, A. Itoh, and T. Rasing, Phys. Rev. Lett. 99, 047601 (2007).
- Lambert et al. (2014) C.-H. Lambert, S. Mangin, B. S. D. C. S. Varaprasad, Y. K. Takahashi, M. Hehn, M. Cinchetti, G. Malinowski, K. Hono, Y. Fainman, M. Aeschlimann, and E. E. Fullerton, Science 345, 1337 (2014), https://science.sciencemag.org/content/345/6202/1337.full.pdf .
- Schubert et al. (2014a) C. Schubert, A. Hassdenteufel, P. Matthes, J. Schmidt, M. Helm, R. Bratschitsch, and M. Albrecht, Applied Physics Letters 104, 082406 (2014a), https://doi.org/10.1063/1.4866803 .
- Hadri et al. (2017) M. S. E. Hadri, M. Hehn, G. Malinowski, and S. Mangin, Journal of Physics D: Applied Physics 50, 133002 (2017).
- Beens et al. (2019) M. Beens, M. L. M. Lalieu, A. J. M. Deenen, R. A. Duine, and B. Koopmans, Phys. Rev. B 100, 220409 (2019).
- Ciuciulkaite et al. (2020) A. Ciuciulkaite, K. Mishra, M. V. Moro, I.-A. Chioar, R. M. Rowan-Robinson, S. Parchenko, A. Kleibert, B. Lindgren, G. Andersson, C. S. Davies, A. Kimel, M. Berritta, P. M. Oppeneer, A. Kirilyuk, and V. Kapaklis, Phys. Rev. Materials 4, 104418 (2020).
- Wadley et al. (2016) P. Wadley, B. Howells, J. Železný, C. Andrews, V. Hills, R. P. Campion, V. Novák, K. Olejník, F. Maccherozzi, S. S. Dhesi, S. Y. Martin, T. Wagner, J. Wunderlich, F. Freimuth, Y. Mokrousov, J. Kuneš, J. S. Chauhan, M. J. Grzybowski, A. W. Rushforth, K. W. Edmonds, B. L. Gallagher, and T. Jungwirth, Science 351, 587 (2016).
- Bodnar et al. (2018) S. Y. Bodnar, L. Šmejkal, I. Turek, T. Jungwirth, O. Gomonay, J. Sinova, A. A. Sapozhnik, H.-J. Elmers, M. Kläui, and M. Jourdan, Nature Communications 9, 348 (2018).
- Meinert et al. (2018) M. Meinert, D. Graulich, and T. Matalla-Wagner, Phys. Rev. Applied 9, 064040 (2018).
- Meer et al. (2021) H. Meer, F. Schreiber, C. Schmitt, R. Ramos, E. Saitoh, O. Gomonay, J. Sinova, L. Baldrati, and M. Kläui, Nano Letters 21, 114 (2021).
- Chen et al. (2019) X. Chen, X. Zhou, R. Cheng, C. Song, J. Zhang, Y. Wu, Y. Ba, H. Li, Y. Sun, Y. You, Y. Zhao, and F. Pan, Nature Materials 18, 931 (2019).
- Němec et al. (2018) P. Němec, M. Fiebig, T. Kampfrath, and A. V. Kimel, Nature Physics 14, 229 (2018).
- Werner et al. (2012) P. Werner, N. Tsuji, and M. Eckstein, Phys. Rev. B 86, 205101 (2012).
- Mentink and Eckstein (2014) J. H. Mentink and M. Eckstein, Phys. Rev. Lett. 113, 057201 (2014).
- Eckstein and Werner (2016) M. Eckstein and P. Werner, Scientific Reports 6, 21235 (2016).
- Kimel et al. (2004) A. V. Kimel, A. Kirilyuk, A. Tsvetkov, R. V. Pisarev, and T. Rasing, Nature 429, 850 (2004).
- Kimel et al. (2009) A. V. Kimel, B. A. Ivanov, R. V. Pisarev, P. A. Usachev, A. Kirilyuk, and T. Rasing, Nature Physics 5, 727 (2009).
- Kanda et al. (2011) N. Kanda, T. Higuchi, H. Shimizu, K. Konishi, K. Yoshioka, and M. Kuwata-Gonokami, Nature Communications 2, 362 (2011).
- Satoh et al. (2015) T. Satoh, R. Iida, T. Higuchi, M. Fiebig, and T. Shimura, Nature Photonics 9, 25 (2015).
- Kimel et al. (2002) A. V. Kimel, R. V. Pisarev, J. Hohlfeld, and T. Rasing, Phys. Rev. Lett. 89, 287401 (2002).
- Kampfrath et al. (2011) T. Kampfrath, A. Sell, G. Klatt, A. Pashkin, S. Mährlein, T. Dekorsy, M. Wolf, M. Fiebig, A. Leitenstorfer, and R. Huber, Nature Photonics 5, 31 (2011).
- Yamaguchi et al. (2010) K. Yamaguchi, M. Nakajima, and T. Suemoto, Phys. Rev. Lett. 105, 237201 (2010).
- Baierl et al. (2016) S. Baierl, M. Hohenleutner, T. Kampfrath, A. K. Zvezdin, A. V. Kimel, R. Huber, and R. V. Mikhaylovskiy, Nature Photonics 10, 715 (2016).
- Caviglia et al. (2013) A. D. Caviglia, M. Först, R. Scherwitzl, V. Khanna, H. Bromberger, R. Mankowsky, R. Singla, Y.-D. Chuang, W. S. Lee, O. Krupin, W. F. Schlotter, J. J. Turner, G. L. Dakovski, M. P. Minitti, J. Robinson, V. Scagnoli, S. B. Wilkins, S. A. Cavill, M. Gibert, S. Gariglio, P. Zubko, J.-M. Triscone, J. P. Hill, S. S. Dhesi, and A. Cavalleri, Phys. Rev. B 88, 220401 (2013).
- Afanasiev et al. (2019) D. Afanasiev, A. Gatilova, D. J. Groenendijk, B. A. Ivanov, M. Gibert, S. Gariglio, J. Mentink, J. Li, N. Dasari, M. Eckstein, T. Rasing, A. D. Caviglia, and A. V. Kimel, Phys. Rev. X 9, 021020 (2019).
- Mazzone et al. (2021) D. G. Mazzone, D. Meyers, Y. Cao, J. G. Vale, C. D. Dashwood, Y. Shi, A. J. A. James, N. J. Robinson, J. Lin, V. Thampy, Y. Tanaka, A. S. Johnson, H. Miao, R. Wang, T. A. Assefa, J. Kim, D. Casa, R. Mankowsky, D. Zhu, R. Alonso-Mori, S. Song, H. Yavas, T. Katayama, M. Yabashi, Y. Kubota, S. Owada, J. Liu, J. Yang, R. M. Konik, I. K. Robinson, J. P. Hill, D. F. McMorrow, M. Först, S. Wall, X. Liu, and M. P. M. Dean, Proceedings of the National Academy of Sciences 118, e2103696118 (2021).
- Stoica et al. (2020) V. Stoica, D. Puggioni, J. Zhang, R. Singla, G. Dakovski, G. Coslovich, M. Seaberg, M. Kareev, S. Middey, P. Kissin, R. Averitt, J. Chakhalian, H. Wen, J. Rondinelli, and J. W. Freeland, arXiv , 2004.03694 (2020).
- Hohlfeld et al. (1997) J. Hohlfeld, E. Matthias, R. Knorren, and K. H. Bennemann, Phys. Rev. Lett. 78, 4861 (1997).
- Scholl et al. (1997) A. Scholl, L. Baumgarten, R. Jacquemin, and W. Eberhardt, Phys. Rev. Lett. 79, 5146 (1997).
- Stamm et al. (2007) C. Stamm, T. Kachel, N. Pontius, R. Mitzner, T. Quast, K. Holldack, S. Khan, C. Lupulescu, E. F. Aziz, M. Wietstruk, H. A. Dürr, and W. Eberhardt, Nature Materials 6, 740 (2007).
- Kirilyuk et al. (2010) A. Kirilyuk, A. V. Kimel, and T. Rasing, Rev. Mod. Phys. 82, 2731 (2010).
- Rudolf et al. (2012) D. Rudolf, C. La-O-Vorakiat, M. Battiato, R. Adam, J. M. Shaw, E. Turgut, P. Maldonado, S. Mathias, P. Grychtol, H. T. Nembach, T. J. Silva, M. Aeschlimann, H. C. Kapteyn, M. M. Murnane, C. M. Schneider, and P. M. Oppeneer, Nature Communications 3, 1037 (2012).
- Shi et al. (2009) Y. G. Shi, Y. F. Guo, S. Yu, M. Arai, A. A. Belik, A. Sato, K. Yamaura, E. Takayama-Muromachi, H. F. Tian, H. X. Yang, J. Q. Li, T. Varga, J. F. Mitchell, and S. Okamoto, Phys. Rev. B 80, 161104 (2009).
- Calder et al. (2012) S. Calder, V. O. Garlea, D. F. McMorrow, M. D. Lumsden, M. B. Stone, J. C. Lang, J.-W. Kim, J. A. Schlueter, Y. G. Shi, K. Yamaura, Y. S. Sun, Y. Tsujimoto, and A. D. Christianson, Phys. Rev. Lett. 108, 257209 (2012).
- Gurung et al. (2018) N. Gurung, N. Leo, S. P. Collins, G. Nisbet, G. Smolentsev, M. García-Fernández, K. Yamaura, L. J. Heyderman, U. Staub, Y. Joly, D. D. Khalyavin, S. W. Lovesey, and V. Scagnoli, Phys. Rev. B 98, 115116 (2018).
- Middey et al. (2014) S. Middey, S. Debnath, P. Mahadevan, and D. D. Sarma, Phys. Rev. B 89, 134416 (2014).
- Kim et al. (2016a) B. Kim, P. Liu, Z. Ergönenc, A. Toschi, S. Khmelevskyi, and C. Franchini, Phys. Rev. B 94, 241113 (2016a).
- Vale et al. (2018a) J. G. Vale, S. Calder, C. Donnerer, D. Pincini, Y. G. Shi, Y. Tsujimoto, K. Yamaura, M. M. Sala, J. van den Brink, A. D. Christianson, and D. F. McMorrow, Phys. Rev. Lett. 120, 227203 (2018a).
- Vale et al. (2018b) J. G. Vale, S. Calder, C. Donnerer, D. Pincini, Y. G. Shi, Y. Tsujimoto, K. Yamaura, M. Moretti Sala, J. van den Brink, A. D. Christianson, and D. F. McMorrow, Phys. Rev. B 97, 184429 (2018b).
- Vecchio et al. (2013) I. L. Vecchio, A. Perucchi, P. Di Pietro, O. Limaj, U. Schade, Y. Sun, M. Arai, K. Yamaura, and S. Lupi, Scientific Reports 3, 2990 (2013).
- Beaud et al. (2014) P. Beaud, A. Caviezel, S. O. Mariager, L. Rettig, G. Ingold, C. Dornes, S.-W. Huang, J. A. Johnson, M. Radovic, T. Huber, T. Kubacka, A. Ferrer, H. T. Lemke, M. Chollet, D. Zhu, J. M. Glownia, M. Sikorski, A. Robert, H. Wadati, M. Nakamura, M. Kawasaki, Y. Tokura, S. L. Johnson, and U. Staub, Nature Materials 13, 923 (2014).
- Ishikawa et al. (2012) T. Ishikawa, H. Aoyagi, T. Asaka, Y. Asano, N. Azumi, T. Bizen, H. Ego, K. Fukami, T. Fukui, Y. Furukawa, S. Goto, H. Hanaki, T. Hara, T. Hasegawa, T. Hatsui, A. Higashiya, T. Hirono, N. Hosoda, M. Ishii, T. Inagaki, Y. Inubushi, T. Itoga, Y. Joti, M. Kago, T. Kameshima, H. Kimura, Y. Kirihara, A. Kiyomichi, T. Kobayashi, C. Kondo, T. Kudo, H. Maesaka, X. M. Maréchal, T. Masuda, S. Matsubara, T. Matsumoto, T. Matsushita, S. Matsui, M. Nagasono, N. Nariyama, H. Ohashi, T. Ohata, T. Ohshima, S. Ono, Y. Otake, C. Saji, T. Sakurai, T. Sato, K. Sawada, T. Seike, K. Shirasawa, T. Sugimoto, S. Suzuki, S. Takahashi, H. Takebe, K. Takeshita, K. Tamasaku, H. Tanaka, R. Tanaka, T. Tanaka, T. Togashi, K. Togawa, A. Tokuhisa, H. Tomizawa, K. Tono, S. Wu, M. Yabashi, M. Yamaga, A. Yamashita, K. Yanagida, C. Zhang, T. Shintake, H. Kitamura, and N. Kumagai, Nature Photon 6, 540 (2012).
- Kameshima et al. (2014) T. Kameshima, S. Ono, T. Kudo, K. Ozaki, Y. Kirihara, K. Kobayashi, Y. Inubushi, M. Yabashi, T. Horigome, A. Holland, K. Holland, D. Burt, H. Murao, and T. Hatsui, Review of Scientific Instruments 85, 033110 (2014), https://doi.org/10.1063/1.4867668 .
- Katayama et al. (2016) T. Katayama, S. Owada, T. Togashi, K. Ogawa, P. Karvinen, I. Vartiainen, A. Eronen, C. David, T. Sato, K. Nakajima, Y. Joti, H. Yumoto, H. Ohashi, and M. Yabashi, Structural Dynamics 3, 034301 (2016).
- Nakajima et al. (2018) K. Nakajima, Y. Joti, T. Katayama, S. Owada, T. Togashi, T. Abe, T. Kameshima, K. Okada, T. Sugimoto, M. Yamaga, T. Hatsui, and M. Yabashi, Journal of Synchrotron Radiation 25, 592 (2018).
- Glownia et al. (2010) J. M. Glownia, J. Cryan, J. Andreasson, A. Belkacem, N. Berrah, C. I. Blaga, C. Bostedt, J. Bozek, L. F. DiMauro, L. Fang, J. Frisch, O. Gessner, M. Gühr, J. Hajdu, M. P. Hertlein, M. Hoener, G. Huang, O. Kornilov, J. P. Marangos, A. M. March, B. K. McFarland, H. Merdji, V. S. Petrovic, C. Raman, D. Ray, D. A. Reis, M. Trigo, J. L. White, W. White, R. Wilcox, L. Young, R. N. Coffee, and P. H. Bucksbaum, Opt. Express 18, 17620 (2010).
- Gierz et al. (2015) I. Gierz, M. Mitrano, H. Bromberger, C. Cacho, R. Chapman, E. Springate, S. Link, U. Starke, B. Sachs, M. Eckstein, T. O. Wehling, M. I. Katsnelson, A. Lichtenstein, and A. Cavalleri, Phys. Rev. Lett. 114, 125503 (2015).
- Caviezel et al. (2012) A. Caviezel, U. Staub, S. L. Johnson, S. O. Mariager, E. Möhr-Vorobeva, G. Ingold, C. J. Milne, M. Garganourakis, V. Scagnoli, S. W. Huang, Q. X. Jia, S.-W. Cheong, and P. Beaud, Phys. Rev. B 86, 174105 (2012).
- Windsor et al. (2020) Y. W. Windsor, A. Ernst, K. Kummer, K. Kliemt, C. Schüßler-Langeheine, N. Pontius, U. Staub, E. V. Chulkov, C. Krellner, D. V. Vyalikh, and L. Rettig, Communications Physics 3, 139 (2020).
- Cavalleri et al. (2001) A. Cavalleri, C. Tóth, C. W. Siders, J. A. Squier, F. Ráksi, P. Forget, and J. C. Kieffer, Phys. Rev. Lett. 87, 237401 (2001).
- Beaud et al. (2009) P. Beaud, S. L. Johnson, E. Vorobeva, U. Staub, R. A. D. Souza, C. J. Milne, Q. X. Jia, and G. Ingold, Phys. Rev. Lett. 103, 155702 (2009).
- de Jong et al. (2013) S. de Jong, R. Kukreja, C. Trabant, N. Pontius, C. F. Chang, T. Kachel, M. Beye, F. Sorgenfrei, C. H. Back, B. Bräuer, W. F. Schlotter, J. J. Turner, O. Krupin, M. Doehler, D. Zhu, M. A. Hossain, A. O. Scherz, D. Fausti, F. Novelli, M. Esposito, W. S. Lee, Y. D. Chuang, D. H. Lu, R. G. Moore, M. Yi, M. Trigo, P. Kirchmann, L. Pathey, M. S. Golden, M. Buchholz, P. Metcalf, F. Parmigiani, W. Wurth, A. Föhlisch, C. Schüßler-Langeheine, and H. A. Dürr, Nature Materials 12, 882 (2013).
- Esposito et al. (2018a) V. Esposito, L. Rettig, E. Abreu, E. M. Bothschafter, G. Ingold, M. Kawasaki, M. Kubli, G. Lantz, M. Nakamura, J. Rittman, M. Savoini, Y. Tokura, U. Staub, S. L. Johnson, and P. Beaud, Phys. Rev. B 97, 014312 (2018a).
- Porer et al. (2020) M. Porer, L. Rettig, E. M. Bothschafter, V. Esposito, R. B. Versteeg, P. H. M. van Loosdrecht, M. Savoini, J. Rittmann, M. Kubli, G. Lantz, O. J. Schumann, A. A. Nugroho, M. Braden, G. Ingold, S. L. Johnson, P. Beaud, and U. Staub, Phys. Rev. B 101, 075119 (2020).
- Esposito et al. (2018b) V. Esposito, L. Rettig, E. M. Bothschafter, Y. Deng, C. Dornes, L. Huber, T. Huber, G. Ingold, Y. Inubushi, T. Katayama, T. Kawaguchi, H. Lemke, K. Ogawa, S. Owada, M. Radovic, M. Ramakrishnan, Z. Ristic, V. Scagnoli, Y. Tanaka, T. Togashi, K. Tono, I. Usov, Y. W. Windsor, M. Yabashi, S. L. Johnson, P. Beaud, and U. Staub, Structural Dynamics 5, 064501 (2018b), https://doi.org/10.1063/1.5063530 .
- Burian et al. (2021) M. Burian, M. Porer, J. R. L. Mardegan, V. Esposito, S. Parchenko, B. Burganov, N. Gurung, M. Ramakrishnan, V. Scagnoli, H. Ueda, S. Francoual, F. Fabrizi, Y. Tanaka, T. Togashi, Y. Kubota, M. Yabashi, K. Rossnagel, S. L. Johnson, and U. Staub, Phys. Rev. Research 3, 013128 (2021).
- Dean et al. (2016) M. P. M. Dean, Y. Cao, X. Liu, S. Wall, D. Zhu, R. Mankowsky, V. Thampy, X. M. Chen, J. G. Vale, D. Casa, J. Kim, A. H. Said, P. Juhas, R. Alonso-Mori, J. M. Glownia, A. Robert, J. Robinson, M. Sikorski, S. Song, M. Kozina, H. Lemke, L. Patthey, S. Owada, T. Katayama, M. Yabashi, Y. Tanaka, T. Togashi, J. Liu, C. Rayan Serrao, B. J. Kim, L. Huber, C.-L. Chang, D. F. McMorrow, M. Först, and J. P. Hill, Nature Materials 15, 601 (2016).
- Fiebig et al. (2000) M. Fiebig, K. Miyano, Y. Tomioka, and Y. Tokura, Applied Physics B 71, 211 (2000).
- Ogasawara et al. (2001) T. Ogasawara, T. Kimura, T. Ishikawa, M. Kuwata-Gonokami, and Y. Tokura, Phys. Rev. B 63, 113105 (2001).
- Ogasawara et al. (2002) T. Ogasawara, K. Tobe, T. Kimura, H. Okamoto, and Y. Tokura, Journal of the Physical Society of Japan 71, 2380 (2002).
- Ruello et al. (2007) P. Ruello, S. Zhang, P. Laffez, B. Perrin, and V. Gusev, Phys. Rev. B 76, 165107 (2007).
- Pressacco et al. (2021) F. Pressacco, D. Sangalli, V. Uhlíř, D. Kutnyakhov, J. A. Arregi, S. Y. Agustsson, G. Brenner, H. Redlin, M. Heber, D. Vasilyev, J. Demsar, G. Schönhense, M. Gatti, A. Marini, W. Wurth, and F. Sirotti, Nature Communications 12, 5088 (2021).
- Chu et al. (2017) H. Chu, L. Zhao, A. de la Torre, T. Hogan, S. D. Wilson, and D. Hsieh, Nature Materials 16, 200 (2017).
- Liang et al. (2018) W. Liang, H. Hou, Y. Lin, and S.-N. Luo, Journal of Physics D: Applied Physics 52, 075303 (2018).
- (72) Https://zenodo.org/record/4452113.
- (73) A more involved expression as used for PrCa0.5MnO3 is not needed here.
- Gray et al. (2018) A. X. Gray, M. C. Hoffmann, J. Jeong, N. P. Aetukuri, D. Zhu, H. Y. Hwang, N. C. Brandt, H. Wen, A. J. Sternbach, S. Bonetti, A. H. Reid, R. Kukreja, C. Graves, T. Wang, P. Granitzka, Z. Chen, D. J. Higley, T. Chase, E. Jal, E. Abreu, M. K. Liu, T.-C. Weng, D. Sokaras, D. Nordlund, M. Chollet, R. Alonso-Mori, H. Lemke, J. M. Glownia, M. Trigo, Y. Zhu, H. Ohldag, J. W. Freeland, M. G. Samant, J. Berakdar, R. D. Averitt, K. A. Nelson, S. S. P. Parkin, and H. A. Dürr, Phys. Rev. B 98, 045104 (2018).
- Liu et al. (2012) M. Liu, H. Y. Hwang, H. Tao, A. C. Strikwerda, K. Fan, G. R. Keiser, A. J. Sternbach, K. G. West, S. Kittiwatanakul, J. Lu, S. A. Wolf, F. G. Omenetto, X. Zhang, K. A. Nelson, and R. D. Averitt, Nature 487, 345 (2012).
- Mayer et al. (2015) B. Mayer, C. Schmidt, A. Grupp, J. Bühler, J. Oelmann, R. E. Marvel, R. F. Haglund, T. Oka, D. Brida, A. Leitenstorfer, and A. Pashkin, Phys. Rev. B 91, 235113 (2015).
- Yamakawa et al. (2017) H. Yamakawa, T. Miyamoto, T. Morimoto, T. Terashige, H. Yada, N. Kida, M. Suda, H. M. Yamamoto, R. Kato, K. Miyagawa, K. Kanoda, and H. Okamoto, Nature Materials 16, 1100 (2017).
- Giorgianni et al. (2019) F. Giorgianni, J. Sakai, and S. Lupi, Nature Communications 10, 1159 (2019).
- Lange et al. (2014) C. Lange, T. Maag, M. Hohenleutner, S. Baierl, O. Schubert, E. R. J. Edwards, D. Bougeard, G. Woltersdorf, and R. Huber, Phys. Rev. Lett. 113, 227401 (2014).
- Schubert et al. (2014b) O. Schubert, M. Hohenleutner, F. Langer, B. Urbanek, C. Lange, U. Huttner, D. Golde, T. Meier, M. Kira, S. W. Koch, and R. Huber, Nature Photonics 8, 119 (2014b).
- Tarekegne et al. (2017) A. T. Tarekegne, H. Hirori, K. Tanaka, K. Iwaszczuk, and P. U. Jepsen, New Journal of Physics 19, 123018 (2017).
- Hubmann et al. (2020) S. Hubmann, G. V. Budkin, M. Urban, V. V. Bel’kov, A. P. Dmitriev, J. Ziegler, D. A. Kozlov, N. N. Mikhailov, S. A. Dvoretsky, Z. D. Kvon, D. Weiss, and S. D. Ganichev, Journal of Infrared, Millimeter, and Terahertz Waves 41, 1155 (2020).
- Houver et al. (2019) S. Houver, L. Huber, M. Savoini, E. Abreu, and S. L. Johnson, Opt. Express 27, 10854 (2019).
- Verwey (1939) E. J. W. Verwey, Nature 144, 327 (1939).
- Birell and Davies (1982) N. D. Birell and P. C. W. Davies, Quantum Fields in Curved Space (Cambridge University Press, 1982).
- (86) W. K. C. (2004), The Electrical Engineering Handbook (Elsevier, 2004).
- Slater (1951) J. C. Slater, Phys. Rev. 82, 538 (1951).
- Salén et al. (2019) P. Salén, M. Basini, S. Bonetti, J. Hebling, M. Krasilnikov, A. Y. Nikitin, G. Shamuilov, Z. Tibai, V. Zhaunerchyk, and V. Goryashko, Physics Reports 836-837, 1 (2019), matter manipulation with extreme terahertz light: Progress in the enabling THz technology.
- Calder et al. (2015) S. Calder, J. H. Lee, M. B. Stone, M. D. Lumsden, J. C. Lang, M. Feygenson, Z. Zhao, J.-Q. Yan, Y. G. Shi, Y. S. Sun, Y. Tsujimoto, K. Yamaura, and A. D. Christianson, Nature Communications 6, 8916 (2015).
- Kim et al. (2016b) B. Kim, P. Liu, Z. Ergönenc, A. Toschi, S. Khmelevskyi, and C. Franchini, Phys. Rev. B 94, 241113 (2016b).
- Kim et al. (2008) B. J. Kim, H. Jin, S. J. Moon, J.-Y. Kim, B.-G. Park, C. S. Leem, J. Yu, T. W. Noh, C. Kim, S.-J. Oh, J.-H. Park, V. Durairaj, G. Cao, and E. Rotenberg, Phys. Rev. Lett. 101, 076402 (2008).
- Moretti Sala et al. (2014) M. Moretti Sala, S. Boseggia, D. F. McMorrow, and G. Monaco, Phys. Rev. Lett. 112, 026403 (2014).
- Chapon and Lovesey (2011) L. Chapon and S. Lovesey, Journal of Physics: Condensed Matter 23, 252201 (2011).
- Roskos et al. (2007) H. Roskos, M. Thomson, M. Kreß, and T. Löffler, Laser & Photonics Reviews 1, 349 (2007).