We investigate the dynamics of soft sphere liquids through computer simulations for spatial dimensions from to , over a wide range of temperatures and densities. Employing a scaling of density-temperature dependent relaxation times, we precisely identify the density which marks the ideal glass transition in the hard sphere limit, and a crossover from sub- to super-Arrhenius temperature dependence. The difference between and the athermal jamming density , small in 3 and 4 dimensions, increases with dimension, with for . We compare our results with recent theoretical calculations.
Dependence of the glass transition and jamming densities on spatial dimension
Introduction: Fluid states of matter can transform to rigid, amorphous solids through the glass transition or the jamming transition. The glass transition describes the transition to disordered solid states typically in molecular systems upon a decrease in temperature, whose nature has been intensely investigated over several decades Debenedetti and Stillinger (2001); Binder and Kob (2011); Berthier and Biroli (2011); Karmakar et al. (2014); Royall et al. (2018). The jamming transition has likewise been widely investigated in athermal systems, typified by granular matter Liu and Nagel (2010); Torquato and Stillinger (2010); Behringer and Chakraborty (2018). Their relationship has also been the subject of considerable research Charbonneau et al. (2017). Whereas molecular glass formers and granular matter represent cases which exhibit one or the other of these phenomena, several systems, such as colloidal suspensions, in principle exhibit both phenomena, and their interplay is important, e.g. in their rheolgoy Ikeda et al. (2012). An idealised system in which both phenomena have been investigated in detail is the hard sphere system. Theoretical investigations over the last decade, extending the framework of the random first order transition (RFOT) theory Kirkpatrick and Thirumalai (1987, 1988); Kirkpatrick et al. (1989), have focused on the hard sphere system, and a unified mean field description of both these phenomena have been developed in the limit of infinite dimensions Charbonneau et al. (2017); Parisi et al. (2020); Mangeat and Zamponi (2016). These developments have naturally led to investigations of how the infinite dimensional results relate to behaviour in finite dimensions. An appealing and systematic approach to addressing questions in this regard is to study the effect of spatial dimensionality on the glass transition and jamming phenomenology, which have been pursued for hard particle systems extensively Charbonneau et al. (2011, 2012, 2013, 2017); Mangeat and Zamponi (2016); Berthier et al. (2020); Charbonneau and Morse (2021, 2022). In particular, the relationship between the glass transition and jamming transition has been investigated Charbonneau et al. (2011); Mangeat and Zamponi (2016). In addition to systems of hard spheres, a small number of other studies have investigated the role of dimensionality in determining aspects of glassy dynamics Eaves and Reichman (2009); Sengupta et al. (2012, 2013); Xu et al. (2016); Adhikari et al. (2021), such as dynamical heterogeneity in a binary mixture of the Lennard-Jones particles as a function of temperature. A more extensive investigation of the dependence on spatial dimensionality in systems where both thermal and density effects play a role are thus of great interest. In the present work, we study soft sphere assemblies interacting with a harmonic potential by investigating the dynamics at different densities and temperatures.
In the zero-temperature limit, the behavior of this system approaches the density-controlled hard sphere model, while it is similar to thermally driven fluids at high density and finite temperature. In the hard sphere limit, the system jams, losing the ability to flow, at a critical density, , via the non-equilibrium jamming transition O’Hern et al. (2003); Chaudhuri et al. (2010). Several works Speedy (1998); Speedy and Debenedetti (1996); Krzakala and Kurchan (2007); Mari et al. (2009); Chaudhuri et al. (2010); Hermes and Dijkstra (2010); Ciamarra et al. (2010a); Ozawa et al. (2012) have considered and demonstrated the scenario that the jamming density is not unique, but can occur over a range of densities. In turn, the range of jamming densities is associated with a line of glass transition densities (kinetically determined or otherwise, as in mean field results Charbonneau et al. (2017); Parisi et al. (2020)) ending with a Kauzmann density , which may be expected to be the relevant density for the divergence of relaxation times. The relationship between the jamming and Kauzmann densities have been investigated, with varying conclusions regarding the relative values of and Berthier and Witten (2009a, b); Charbonneau et al. (2011); Coniglio et al. (2017); Berthier et al. (2016). Several studies Mari et al. (2009); Ciamarra et al. (2010b); Kurchan et al. (2013); Coniglio et al. (2017); Charbonneau et al. (2017); Mangeat and Zamponi (2016) also indicate that the relationship between these two transition densities depends on dimensionality.
In Berthier and Witten (2009a, b), the relaxation times were studied for the same model we consider, in three dimensions. With increasing density, relaxation times exhibit a cross over from sub-Arrhenius to super-Arrhenius temperature dependence. Relaxation times were analysed through a scaling function that assumes a divergence for the hard sphere systems at a density , and by defining an effective hard sphere diameter at finite temperatures Cohen and Turnbull (1959), to obtain two distinct scaling collapses across . The estimate of thus obtained is found to be very close to , the jamming point, although the meaning of the two densities was clearly distinguished.
In the present work, we perform extensive molecular dynamics simulations for a wide range of values in different spatial dimensions ranging from to . We perform a scaling analysis similar to Berthier and Witten (2009a, b) but with a newly proposed scaling function, to obtain as a function of . We obtain jamming densities following the analysis in O’Hern et al. (2003); Chaudhuri et al. (2010). Our results clearly demonstrate that for , with increasing with , as may be expected from mean field results Charbonneau et al. (2017); Parisi et al. (2020); Mangeat and Zamponi (2016).
Simulations details: We study a binary mixture of spheres of size ratio , interacting with a harmonic potential as a model glass former Durian (1995):
| (1) |
and for , where (A,B), indicates the type of particle. The system size varies from to depending on the spatial dimensions, with the linear extent of the simulated volume, in all dimensions. We investigate the dynamics at densities (with 1 - 2 independent samples each) around the jamming density. The volume fraction, or density, where , , is the average volume per sphere in dimensions, is the number density, is the number of particles, and is the volume. Molecular dynamics (MD) simulations are performed in a cubic box with the periodic boundary conditions, employing the constant temperature integration in Brown and Clarke (1984), with time step . Each independent run is of length where relaxation time is computed from the overlap function (for particles) as , with
| (2) |
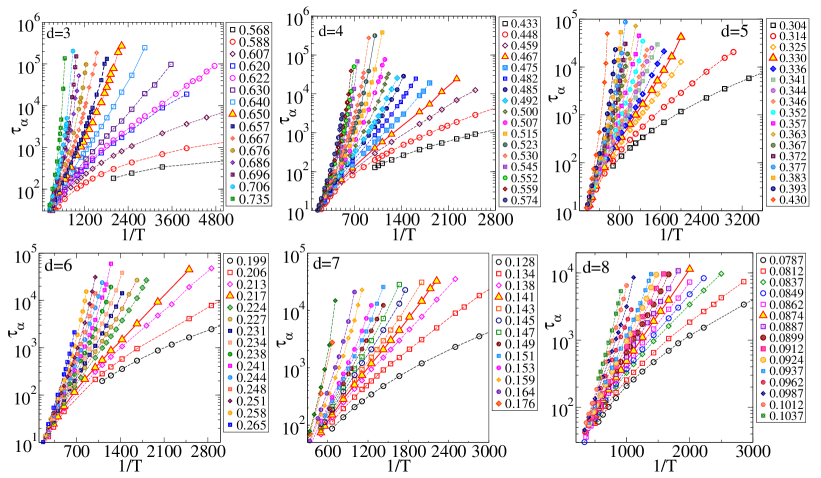
where if and otherwise. In Fig. 1, the relaxation time is plotted as a function of temperature for various densities for dimensions. Additional details are provided in the Supplemental Material (SM) 111see Supplemental Material at <URL> which contains a description of the procedure used to define the overlap function, the scaling analysis using the scaling function defined by Berthier and Witten, the new effective diameter definition we employ in this work and the corresponding scaling function, comparison of results from the Berthier-Witten scaling function and the one proposed in this work, error analysis for different data collapse procedures employed, details of the procedure used for obtaining jamming densities, comparison of jamming densities obtain with previous work, the density-temperature phase diagram for all the dimensions investigated, and the statistics of rattlers, which contains the additional reference lavcevic2003spatially.
Results: Considering an expression for relaxation times for hard sphere fluids of the form , Berthier and Witten Berthier and Witten (2009a) analysed relaxation times for soft spheres by defining a temperature dependent effective volume fraction of the form , which leads to the scaling form
| (3) |
where refers to the scaling function for the super-Arrhenius and the sub-Arrhenius branch of the scaling function and , and are adjustable parameters. Plotting against , with suitable choices of the parameters, a data collapse on to two branches above and below is obtained. The values of and were determined from such a procedure, with the value being in close agreement with experimental and simulation results for colloidal hard spheres and theoretical results Hall and Wolynes (1987); Brambilla et al. (2009); Baranau and Tallarek (2020). The estimated is close to but distinct from the jamming density of estimated for the binary mixture studied in O’Hern et al. (2003); Chaudhuri et al. (2010); Berthier and Witten (2009a) and here.
Recently, the same scaling analysis has been revisited in Maiti and Schmiedeberg (2019), with the conclusion that if one considers , and as free parameters, a good scaling collapse of comparable quality to Berthier and Witten (2009a) could be obtained for significantly different sets of parameter values. Further, the scaling form in Eq. 3 requires in order to obtain the expected Arrhenius form at density , but imposing such a constraint does not lead to the best data collapse Berthier and Witten (2009a), as we independently verify. It is thus desirable to explore alternate scaling functions, which we do in this work based on the evaluation of an effective diameter following the prescription in Barker and Henderson (1967). We compare our results to analysis employing Eq. 3, and obtain consistent estimates of .
Following Barker and Henderson (1967), the expression for the effective diameter with only temperature dependent corrections can be written as , leading to . In turn, the effective volume fraction in dimension can be approximated as
| (4) |
where , and the term approximates terms of and higher. Employing the effective in the expression for the hard sphere relaxation times, we write
| (5) |
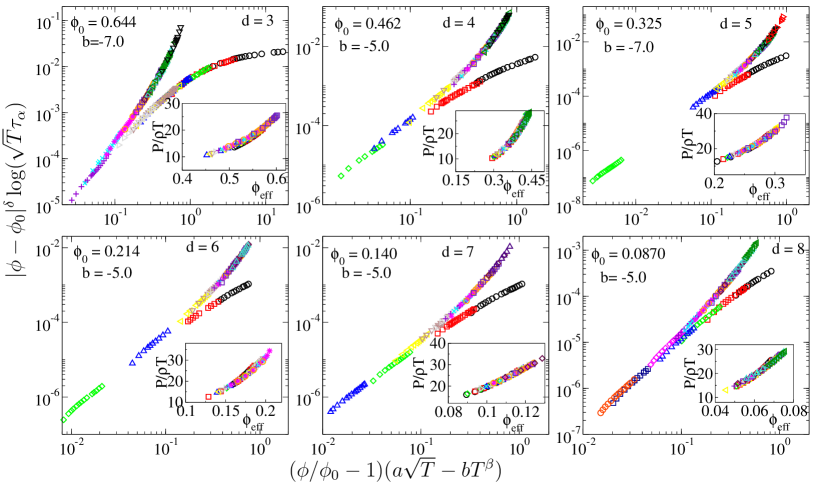
An Arrhenius form of the relaxation times at finite and requires to be , which we employ. Rather than estimate , and through a scaling analysis of , we first require that where is the pressure is a unique function of and estimate and from the data collapse of (shown in the insets of Fig. 2). Scaling collapse of through Eq. 5, shown in Fig. 2, is used to estimate the remaining parameter . Additional details regarding the data collapse procedure including error analysis and justification of the choice , are provided in the SM.
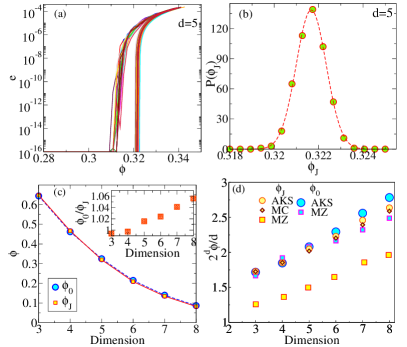
We next estimate the jamming densities following the protocol employed in Chaudhuri et al. (2010), wherein initially random configurations are compressed till the energy reaches , and decompressed till the energy decreases below , at the jamming density (see SM for additional details). Fig. 3(a) illustrates the protocol for (corresponding data for all dimensions are shown in the SM). Based on the initial configuration used, the we estimate corresponds to the low density limit of the range over which jamming can take place O’Hern et al. (2003); Chaudhuri et al. (2010). The procedure is applied to independent initial configurations, and the histogram of jamming densities obtained is shown in Fig. 3(b). The average jamming density is shown in Fig. 3(c) (also tabulated in Table I), along with estimates of obtained above. The ratio , shown in the inset, increases with , with for , whereas for , , with the two values being very close. The jamming densities we obtain are very similar to, but slightly larger than, those obtained for monodisperse spheres in Morse and Corwin (2014); Charbonneau and Morse (2021). In Fig. 3(d), we compare the scaled jamming densities we obtain with those in Morse and Corwin (2014). We also show the recent theoretical calculations in Mangeat and Zamponi (2016) for the corresponding quantity , which shows the same trend as our data, but are smaller (reasons why this may be expected are discussed in Manacorda and Zamponi (2022)). We further show the values we obtain, along with the corresponding calculated values (Kauzmann density ) in Mangeat and Zamponi (2016). As discussed in Parisi et al. (2020); Mangeat and Zamponi (2016), is expected to increase as , whereas as . We are not able to quantitatively comment on either prediction, but we note that the values of calculated in Mangeat and Zamponi (2016) are in near quantitative agreement with our results, whereas the values in Mangeat and Zamponi (2016) underestimate our results as well as those in Morse and Corwin (2014); Charbonneau and Morse (2021).
| d | ||
|---|---|---|
| 3 | ||
| 4 | ||
| 5 | ||
| 6 | ||
| 7 | ||
| 8 |
.
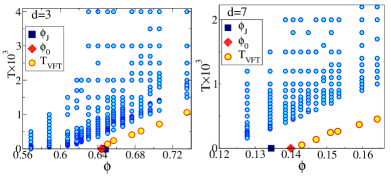
Finally, we compute the temperature at which the relaxation times show an apparent divergence by fitting the data at each density above , for each dimension, to the Vogel-Fulcher-Tammann (VFT) form, . In Fig. 4, we show the density-temperature diagram for and (results for other dimensions are shown in the SM) which shows and , along with the density dependent . The results shown illustrate the manner in which the relationship between and changes with spatial dimension. The values shown extrapolate to zero at , illustrating that is the relevant limit density for the density dependent glass transition.
Conclusion: To summarize, we have studied the dynamics of model glass forming liquids consisting of soft (harmonic) spheres by measuring relaxation times as a function of temperature for several densities for spatial dimensions . The temperature dependence exhibits a crossover from sub-Arrhenius to super-Arrhenius behavior as density increases. We perform a new scaling analysis of the relaxation times to identify a density which corresponds to the ideal glass transition density for the hard sphere (or zero temperature) limit. We also estimate the (lowest) jamming density , and show that for , . Comparing with theoretical calculations in Mangeat and Zamponi (2016), we find near quantitative agreement with our estimated values (albeit with a steeper dependence for the we obtain), whereas the values we obtain are underestimated in Mangeat and Zamponi (2016). Our results thus provide a useful benchmark for future efforts in developing quantitative theories of the glass and jamming transitions.
Acknowledgements.
Acknowledgements.
We thank Francesco Zamponi, Patrick Charbonneau and Peter Morse for useful discussions, sharing results, and comments on the manuscript. We gratefully acknowledge Anshul Parmar for significant help in setting up the numerical investigations presented in this manuscript. We acknowledge the Thematic Unit of Excellence on Computational Materials Science, and the National Supercomputing Mission facility (Param Yukti) at the Jawaharlal Nehru Center for Advanced Scientific Research for computational resources. SK acknowledges support from Swarna Jayanti Fellowship grants DST/SJF/PSA-01/2018-19 and SB/SFJ/2019-20/05. SS acknowledges support through the JC Bose Fellowship (JBR/2020/000015) SERB, DST (India).
References
- Debenedetti and Stillinger (2001) P. G. Debenedetti and F. H. Stillinger, Nature 410, 259 (2001).
- Binder and Kob (2011) K. Binder and W. Kob, Glassy materials and disordered solids: An introduction to their statistical mechanics (World scientific, 2011).
- Berthier and Biroli (2011) L. Berthier and G. Biroli, Reviews of Modern Physics 83, 587 (2011).
- Karmakar et al. (2014) S. Karmakar, C. Dasgupta, and S. Sastry, Annu. Rev. Condens. Matter Phys. 5, 255 (2014).
- Royall et al. (2018) C. P. Royall, F. Turci, S. Tatsumi, J. Russo, and J. Robinson, Journal of Physics: Condensed Matter 30, 363001 (2018).
- Liu and Nagel (2010) A. J. Liu and S. R. Nagel, Annu. Rev. Condens. Matter Phys. 1, 347 (2010).
- Torquato and Stillinger (2010) S. Torquato and F. H. Stillinger, Rev. Mod. Phys. 82, 3197 (2010).
- Behringer and Chakraborty (2018) R. P. Behringer and B. Chakraborty, Reports on Progress in Physics 82, 012601 (2018).
- Charbonneau et al. (2017) P. Charbonneau, J. Kurchan, G. Parisi, P. Urbani, and F. Zamponi, Annual Review of Condensed Matter Physics 8, 265 (2017).
- Ikeda et al. (2012) A. Ikeda, L. Berthier, and P. Sollich, Physical review letters 109, 018301 (2012).
- Kirkpatrick and Thirumalai (1987) T. R. Kirkpatrick and D. Thirumalai, Physical review letters 58, 2091 (1987).
- Kirkpatrick and Thirumalai (1988) T. Kirkpatrick and D. Thirumalai, Physical Review A 37, 4439 (1988).
- Kirkpatrick et al. (1989) T. R. Kirkpatrick, D. Thirumalai, and P. G. Wolynes, Physical Review A 40, 1045 (1989).
- Parisi et al. (2020) G. Parisi, P. Urbani, and F. Zamponi, Theory of Simple Glasses: Exact Solutions in Infinite Dimensions (Cambridge University Press, 2020).
- Mangeat and Zamponi (2016) M. Mangeat and F. Zamponi, Physical Review E 93, 012609 (2016).
- Charbonneau et al. (2011) P. Charbonneau, A. Ikeda, G. Parisi, and F. Zamponi, Physical review letters 107, 185702 (2011).
- Charbonneau et al. (2012) P. Charbonneau, A. Ikeda, G. Parisi, and F. Zamponi, Proceedings of the National Academy of Sciences 109, 13939 (2012).
- Charbonneau et al. (2013) B. Charbonneau, P. Charbonneau, Y. Jin, G. Parisi, and F. Zamponi, The Journal of chemical physics 139, 164502 (2013).
- Berthier et al. (2020) L. Berthier, P. Charbonneau, and J. Kundu, Phys. Rev. Lett. 125, 108001 (2020).
- Charbonneau and Morse (2021) P. Charbonneau and P. K. Morse, Physical review letters 126, 088001 (2021).
- Charbonneau and Morse (2022) P. Charbonneau and P. K. Morse, arXiv preprint arXiv:2201.07629 (2022).
- Eaves and Reichman (2009) J. D. Eaves and D. R. Reichman, Proceedings of the National Academy of Sciences 106, 15171 (2009).
- Sengupta et al. (2012) S. Sengupta, S. Karmakar, C. Dasgupta, and S. Sastry, Physical review letters 109, 095705 (2012).
- Sengupta et al. (2013) S. Sengupta, S. Karmakar, C. Dasgupta, and S. Sastry, The Journal of chemical physics 138, 12A548 (2013).
- Xu et al. (2016) W.-S. Xu, J. F. Douglas, and K. F. Freed, Adv. Chem. Phys 161, 443 (2016).
- Adhikari et al. (2021) M. Adhikari, S. Karmakar, and S. Sastry, The Journal of Physical Chemistry B 125, 10232 (2021), pMID: 34494429, https://doi.org/10.1021/acs.jpcb.1c03887 .
- O’Hern et al. (2003) C. S. O’Hern, L. E. Silbert, A. J. Liu, and S. R. Nagel, Phys. Rev. E 68, 011306 (2003).
- Chaudhuri et al. (2010) P. Chaudhuri, L. Berthier, and S. Sastry, Physical review letters 104, 165701 (2010).
- Speedy (1998) R. J. Speedy, Journal of Physics: Condensed Matter 10, 4185 (1998).
- Speedy and Debenedetti (1996) R. J. Speedy and P. G. Debenedetti, Molecular Physics 88, 1293 (1996).
- Krzakala and Kurchan (2007) F. Krzakala and J. Kurchan, Physical Review E 76, 021122 (2007).
- Mari et al. (2009) R. Mari, F. Krzakala, and J. Kurchan, Physical review letters 103, 025701 (2009).
- Hermes and Dijkstra (2010) M. Hermes and M. Dijkstra, EPL 89, 38005 (2010).
- Ciamarra et al. (2010a) M. Ciamarra, A. Coniglio, and A. D. Candia, Soft Matter 6, 2975 (2010a).
- Ozawa et al. (2012) M. Ozawa, T. Kuroiwa, A. Ikeda, and K. Miyazaki, Physical review letters 109, 205701 (2012).
- Berthier and Witten (2009a) L. Berthier and T. A. Witten, EPL (Europhysics Letters) 86, 10001 (2009a).
- Berthier and Witten (2009b) L. Berthier and T. A. Witten, Physical Review E 80, 021502 (2009b).
- Coniglio et al. (2017) A. Coniglio, M. P. Ciamarra, and T. Aste, Soft matter 13, 8766 (2017).
- Berthier et al. (2016) L. Berthier, D. Coslovich, A. Ninarello, and M. Ozawa, Physical review letters 116, 238002 (2016).
- Ciamarra et al. (2010b) M. P. Ciamarra, M. Nicodemi, and A. Coniglio, Soft Matter 6, 2871 (2010b).
- Kurchan et al. (2013) J. Kurchan, G. Parisi, P. Urbani, and F. Zamponi, The Journal of Physical Chemistry B 117, 12979 (2013).
- Cohen and Turnbull (1959) M. H. Cohen and D. Turnbull, The Journal of Chemical Physics 31, 1164 (1959).
- Durian (1995) D. J. Durian, Physical review letters 75, 4780 (1995).
- Brown and Clarke (1984) D. Brown and J. Clarke, Molecular Physics 51, 1243 (1984).
- Note (1) See Supplemental Material at <URL> which contains a description of the procedure used to define the overlap function, the scaling analysis using the scaling function defined by Berthier and Witten, the new effective diameter definition we employ in this work and the corresponding scaling function, comparison of results from the Berthier-Witten scaling function and the one proposed in this work, error analysis for different data collapse procedures employed, details of the procedure used for obtaining jamming densities, comparison of jamming densities obtain with previous work, the density-temperature phase diagram for all the dimensions investigated, and the statistics of rattlers, which contains the additional reference lavcevic2003spatially.
- Hall and Wolynes (1987) R. W. Hall and P. G. Wolynes, The Journal of chemical physics 86, 2943 (1987).
- Brambilla et al. (2009) G. Brambilla, D. El Masri, M. Pierno, L. Berthier, L. Cipelletti, G. Petekidis, and A. B. Schofield, Physical review letters 102, 085703 (2009).
- Baranau and Tallarek (2020) V. Baranau and U. Tallarek, AIP Advances 10, 035212 (2020).
- Maiti and Schmiedeberg (2019) M. Maiti and M. Schmiedeberg, Journal of Physics: Condensed Matter 31, 165101 (2019).
- Barker and Henderson (1967) J. A. Barker and D. Henderson, The Journal of chemical physics 47, 4714 (1967).
- Morse and Corwin (2014) P. K. Morse and E. I. Corwin, Phys. Rev. Lett. 112, 115701 (2014).
- Manacorda and Zamponi (2022) A. Manacorda and F. Zamponi, arXiv preprint arXiv:2201.01161 (2022).