Systematic investigation of critical charge limits in Thick GEMs
Abstract
We present discharge probability studies performed with a single Thick Gas Electron Multiplier (THGEM) irradiated with alpha particles in Ar-CO2 and Ne-CO2 mixtures. We observe a clear dependency of the discharge stability on the noble gas and quencher content pointing to lighter gases being more stable against the development of streamer discharges. A detailed comparison of the measurements with Geant4 simulations allowed us to extract the critical charge value leading to the formation of a spark in a THGEM hole, which is found to be within the range of electrons, depending on the gas mixture.
Our experimental findings are compared to previous GEM results. We show that the discharge probability of THGEMs exceeds the one measured with GEMs by orders of magnitude. This can be explained with simple geometrical considerations, where primary ionization is collected by a lower number of holes available in a THGEM structure, reaching higher primary charge densities and thus increasing the probability of a spark occurrence. However, we show that the critical charge limits are similar for both amplification structures.
keywords:
MPGD, GEM, THGEM, discharge, streamer1 Introduction
A Thick Gas Electron Multiplier (THGEM) [1, 2] is a robust gaseous ionization detector. Its design is derived from a thinner GEM [3] structure, with its dimensions expanded by a factor of , and shares the same working principle of avalanche multiplication within small holes. The larger (sub-)millimeter structures make THGEMs more robust and it allows for higher achievable gains than in GEMs, for a mitigation of the damages caused by discharges, and for the construction of very large detector areas without mechanical support. The larger dimensions make THGEMs also easier to manufacture. The holes are produced by mechanical drilling into a metal-clad insulator for which a variety of PCB materials, like FR-4, Kevlar or Teflon, can be used [4]. Some THGEM variants have the metal around the holes chemically etched, which creates metal-free rims surrounding the holes. Large rims with a width of () allow for an order of magnitude higher gains, thus improving stability against electrical discharges [4, 5], at the cost of long-term gain dependence on time and radiation rate [6]. The latter is marginal when employing THGEMs with a small ( ) or no rim [6].
The breakdown voltage of a no-rim THGEM structure is given by Paschen’s law and reaches for a -thick structure in air. Experience shows, however, that large-area THGEMs rarely reach this value due to irregular hole borders and defects related to the production procedure [7]. Therefore, a dedicated post-production treatment is necessary in order to smooth out the hole edges and remove defects or other imperfections coming from the drilling of the holes. An effective polishing and cleaning procedure has been proposed in [7] and implemented successfully in the COMPASS RICH-1 upgrade project [8, 9].
It has been shown, that the breakdown voltage measured with THGEMs in the air could indeed reach Paschen’s limits after the special surface treatment [10]. The maximum absolute gain which can be achieved with such a structure shall therefore depend only on the fundamental critical charge limits, following the well established streamer theory of a spark discharge [11, 12, 13, 14] and a simple relation
| (1) |
where is the critical charge at which the avalanche transforms into a streamer and is the primary charge (electrons) entering an amplification structure (here a THGEM hole). The critical charge values reported for various types of Micro Pattern Gaseous Detectors (MPGDs) vary between 106 and 107 [15, 16, 17]. It should be noted, however, that no universal value can be associated with a given amplification structure. The critical charge limit depends on the exact geometry of a structure, the value of or the gas mixture [15, 16, 17, 18, 19]. For the latter, in particular, a clear correlation between discharge probability and of the gas is observed [15, 18, 20, 19] pointing towards intrinsic properties of the working gas (e.g. transport, amplification) on the streamer development. It also suggests that the number of primary charges entering an amplification structure (charge density) is the most relevant parameter limiting the stability of an MPGD structure. This is well in line with the measurements of the discharge rate dependency on the particle inclination angle [21] or the longitudinal magnetic field [22]. The charge density hypothesis has been also successfully employed in the numerical models describing the discharge probability measured with Micromegas and GEM detectors (incl. hybrid stacks, employing both structures) fairly well [23, 24, 19].
In the following study, we investigate the intrinsic stability limits of a single-THGEM detector upon irradiation with alpha particles. The measurements are performed in Ar- and Ne-based mixtures with different CO2 content to study the influence of the gas mixture on the discharge probability and critical charge limits. The latter are obtained by comparing the data to results obtained within a Geant4 simulation framework developed for our previous studies with GEMs [19]. The measurements also provide a direct comparison between GEMs and THGEMs and allow us to evaluate the influence of geometrical parameters, such as the hole size, the pitch, and the (TH)GEM thickness, on the stability of a structure and the resulting value.
2 Experimental setup
2.1 Detector
The experimental setup consists of a single THGEM mounted between a drift cathode and a readout plane. Figure 1 shows a photo of the THGEM structure used in the measurements and a schematic picture of the setup. The THGEM is produced by Eltos S.p.A. and is divided into three segments. Each segment measures and is separated by a 600 gap from one another. A 4.6 diameter mounting hole is located in the center of the middle segment. Altogether this translates into a copper-coated area of 123.9 . All three segments, on each side of the THGEM, are connected and act as single, top and bottom, electrodes.
The THGEM structure follows the design parameters and production procedure of the COMPASS RICH-1 Upgrade THGEMs [25]. The THGEM is 470 thick including a 35 thick copper layer on each side. The diameter of the holes is 400 except for the holes along the outer border of the active area, which have a diameter of 500 . There is no rim around the holes and the pitch between the holes is 800 . After production, the THGEM undergoes a dedicated polishing and cleaning treatment in order to minimize the number of instabilities caused by the imperfections developed in the production process.
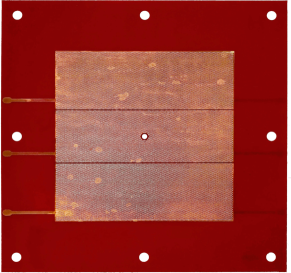
Following the schematics shown in Fig. 1, the distance between the THGEM and the readout plane (induction gap) is set to 2 mm throughout all measurements. The distance between the drift cathode and the THGEM (drift gap) is varied between 13.0 and 58 . The corresponding distance between the source and the THGEM (), taking into account the 1.5 -thick drift cathode PCB, is adjusted between 14.5 and 59.5 .
The detector is operated with a constant drift field (), defined by the potentials at the cathode and the THGEM top electrode, of 400 . However, no field cage is employed to allow for flexibility in choosing the drift gap size. The detector is operated with a grounded THGEM bottom electrode and readout plane resulting in zero induction field . A potential difference VTHGEM across the THGEM is defined by a potential applied to the top electrode. An additional protection resistor is connected in series between the top and the power supply to limit the current flow in case of a discharge.
Discharge signals are induced on the readout plane connected to the oscilloscope, which records and counts waveforms. Currents induced on the THGEM electrodes and the drift cathode are measured with a multi-channel picoamperemeter (pA-meter) [26], with a 1 kHz sampling frequency and a 1 Hz readout rate and are used to determine the absolute gain of the THGEM (see more details in Section 2.4). The pA-meter channels used to measure currents induced on THGEM electrodes are equipped with resistors connected in series with the input, which can be neglected due to the large value of the protection resistor. The THGEM, drift cathode, and readout plane are mounted inside a gas-tight vessel, which is flushed with one of the three gas mixtures used in the measurements, as discussed in the next section.
2.2 Gas mixtures
The different gas mixtures used in the measurements are Ar-CO2 (70-30), Ar-CO2 (90-10) and Ne-CO2 (90-10). The gas properties, electron drift velocity (), longitudinal and transverse diffusion coefficients ( and , respectively), and effective ionization potentials () are calculated using Magboltz [27] and Garfield [28] and summarized in Table 1. During all measurements the oxygen concentration is kept below 25 ppm and absolute humidity below 200 ppmV H2O. Both are constantly monitored with a dedicated sensor.
| Gas | ||||
|---|---|---|---|---|
| [] | [] | [] | [eV] | |
| Ar-CO2 (70-30) | 0.932 | 0.0138 | 0.0145 | 30.2 |
| Ar-CO2 (90-10) | 3.25 | 0.0244 | 0.0268 | 28.8 |
| Ne-CO2 (90-10) | 2.66 | 0.0219 | 0.0223 | 38.1 |
2.3 Radioactive source
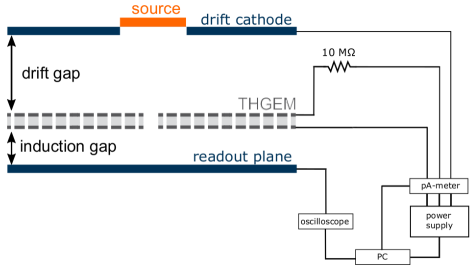
A mixed alpha source containing 239Pu, 241Am and 244Cm [30] is placed on top of the cathode to irradiate the drift volume. The source has an active area of ⌀7 matching the ⌀7 hole in the 1.5 thick drift cathode PCB. The source emits alpha particles of several energies and intensities, with their weighted mean of 5.15 MeV, 5.45 MeV and 5.80 MeV for 239Pu, 241Am and 244Cm, respectively. The source rate measured by the detector is (358 3) Hz. Figure 2 shows the specific energy loss of the alpha particles as a function of their track length (), evaluated in different gas mixtures using the Geant4 simulation framework [31]. The approximate value of the maximum range of an alpha particle from the source in a given gas mixture is 42 mm in Ar-CO2 (70-30), 48 mm in Ar-CO2 (90-10), and 70 mm in Ne-CO2 (90-10).
2.4 Absolute gain determination
2.4.1 Definition
All measurements of the discharge probability are performed as a function of the absolute gain () given by the ratio of the amplification current measured at the bottom electrode of the THGEM () and the primary ionization current. With all electrons coming from the amplification region are collected at the bottom side of the THGEM. Thus, the current induced at this electrode corresponds to the total amplification current.
The primary ionization current stems from the electrons created in the drift volume by the radiation source and reaching the THGEM. It is measured at the top THGEM electrode with the bottom electrode and readout plane grounded, = 0, and . The measured values range between 3 pA and 15 pA, depending on the drift gap size.
2.4.2 Collection efficiency
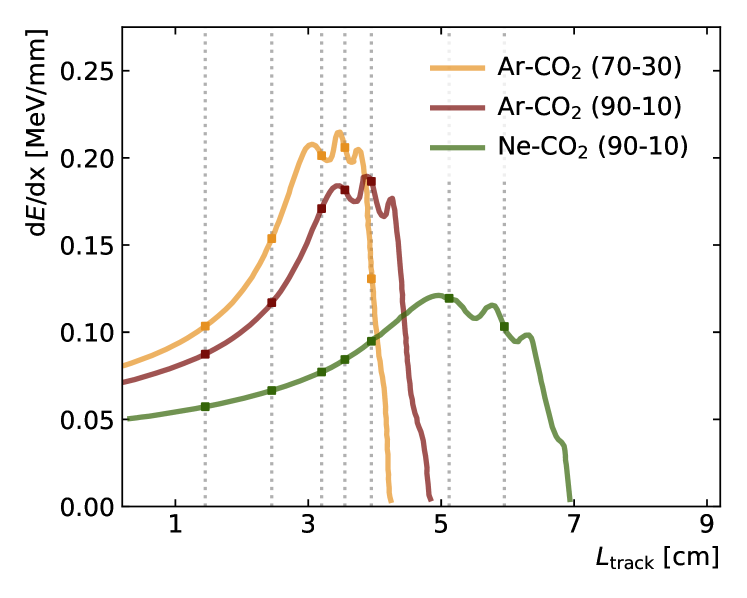
For the absolute gain determination, a collection efficiency of 100% is assumed for the primary electrons from the drift region entering the THGEM holes. In order to validate this assumption, the electron collection efficiency of the THGEM is measured as a function of a drift field and is shown in Fig. 3.
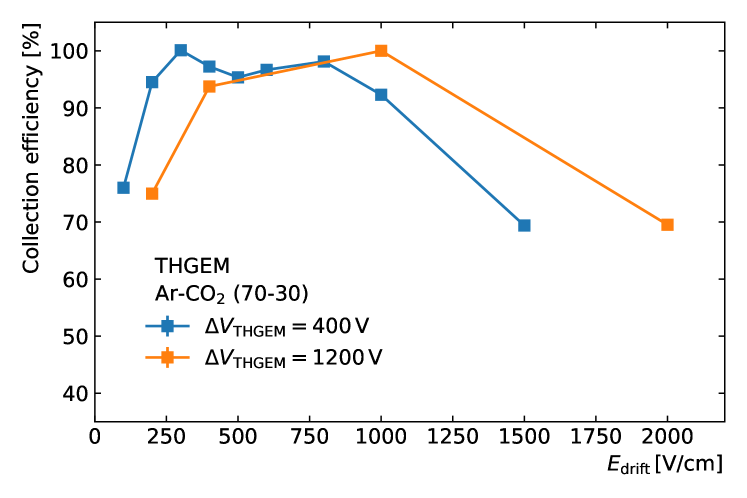
The collection efficiency is evaluated by measuring while keeping constant and normalizing to the maximum measured value, where a collection efficiency of 100% can be reliably assumed [33]. The plateau region spans for values between and . In this region, all electric field lines from the cathode enter the THGEM holes. A drop for the lowest fields can be associated with electron attachment to the residual traces of water and oxygen present in the gas mixture (see Section 2.2). Also, a slight gain dependency on the drift field is expected, as the latter influences the field inside a hole. For higher values the collection efficiency drops as more electric field lines originating from the drift cathode end on the top electrode of the THGEM. Thus, in the first-order approximation, a 100% collection efficiency of primary charges can be considered at . This is in line with the well established transparency measurements of GEMs [33, 34].
2.4.3 Charging-up effects
In THGEMs the charge-up of dielectric material introduces a time-dependent gain variation which can be split into a short-term and a long-term component [6]. The measurement times in this study, between several minutes and maximum three hours, are too short to see an impact of the long-term part, related to the movement of charges within the PCB fibreglass plates [6], which usually takes many hours up to a full day. The short-term effects, taking place in the first minutes of operation, are, on the other hand, caused by charges accumulating on the insulator surface due to the lateral diffusion of the avalanche charge. These charges create an electric field opposite to the external field and thus reduce the gain [35, 36]. This effect increases with the thickness of the PCB material. Charge collection on the rims, resulting in the long-term gain increase [35], is not considered as a no-rim THGEM is used in the presented study (see Section 2.1). In addition, experimental conditions unrelated to the THGEM, e.g. humidity or impurities in the gas, may influence the stabilization time.
The short-term charging-up effects are taken into account in the absolute gain measurements performed in this study. Since the time necessary to reach equilibrium () depends on the radiation intensity and the total charge that passes through a THGEM hole, an inverse proportionality to the detector gain can be observed [35]. The values measured with the THGEM used in this study reach for the lowest gains . However, already at a gain of 20, the drops to . For absolute gains in the region of interest () the evaluation of gain and corresponding discharge probability measurement starts always after ramping up voltages to the appropriate and values.
It was also observed that the primary current value, measured prior to each measurement session (defined by the gas mixture and ), reaches its asymptotic value within . The effect, related to the initial charge-up of the insulating THGEM surfaces, is accounted for by measuring the primary current value at least after applying the nominal drift field.
2.4.4 Gain measurement
Figure 4 shows the absolute gain as a function of for different gas mixtures and distances between the source and THGEM surface. Gains obtained in Ne-CO2 (90-10) are the highest due to the larger Townsend coefficients for neon- than argon-based mixtures. The scaling of gain between two argon-based mixtures follows the amount of quencher.
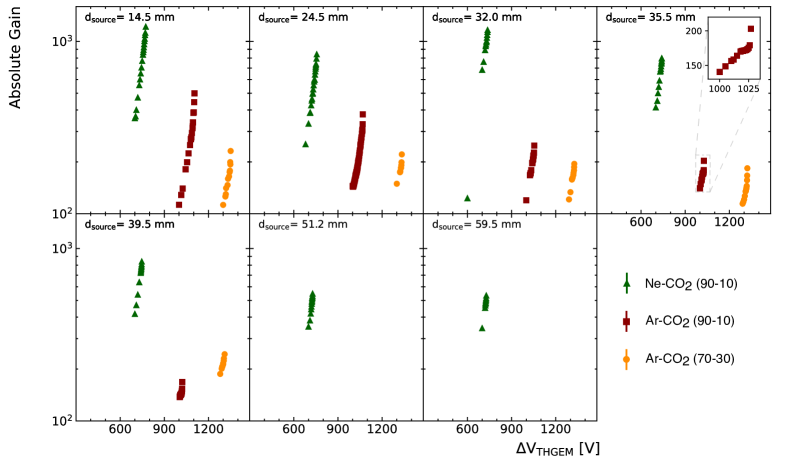
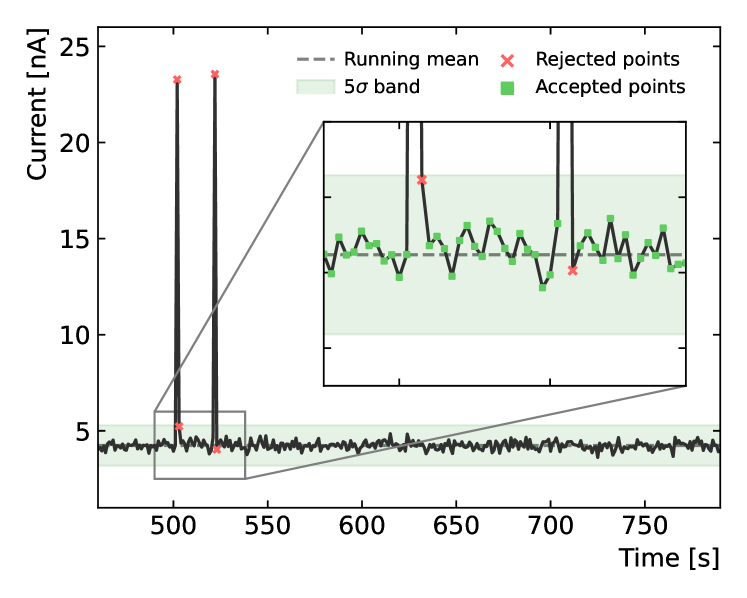
The gain is evaluated for each discharge probability measurement, averaging the over the full measurement time. For above the discharge onset, current spikes associated with sparks need to be accounted for. Discharges in the THGEM lead to temporarily higher currents on both electrodes which may introduce a bias towards higher absolute gains. To exclude such bias, the averaging algorithm does not include amplification current values measured during the spark-associated current spike defined as a variance of over the moving mean value, where is the standard deviation of the latter. One measurement point after a current spike is excluded from the average, in addition. Figure 5 shows an example of the amplification current measurement together with two spikes identified and excluded from the average. In order to make the gain evaluation feasible, the average discharge rates do not exceed 0.25 Hz throughout all measurements.
For moderate gain values an exponential dependency on the applied voltage is observed, as expected. However, a deviation from the exponential behaviour for the highest gains can be noticed as shown in the inset of Fig. 4. The onset of this deviation coincides with the first occurrence of discharges in a measurement. This could be possibly explained by a change in the electrostatic configuration of the charged PCB material, or a similar effect, which influences the electric field configuration inside the holes. It should be noted, that the absolute gain, influenced by the occurrence of first discharges, does not reach the value expected from the extrapolation of the exponential function fitted in the undisturbed range even several minutes after a discharge. This observation was confirmed with low discharge rate measurements, where the time between subsequent discharges exceeded the characteristic time of charging-up effects. The influence of the spark-related current spikes on the amplification current can also be ruled out as they are excluded from the measurement, as explained in the previous paragraph. Thus, it is ensured that the value measured in this region is the actual absolute gain value. Due to this behaviour, an extrapolation of the absolute gain is not possible and it is necessary to measure the absolute gain for each point the discharge probability is evaluated.
The maximum gain values shown in Fig. 4 correspond to the highest discharge probabilities measured in a given gas (see Fig. 7 and discussion in Section 3). In particular, at = 39.5 mm, the maximum gain in Ar-CO2 (90-10) is lower than the corresponding value in Ar-CO2 (70-30) due to the observed inversion of the THGEM stability in these mixtures. For mm the discharge probability in Ar-CO2 mixtures is not measured, due to the substantial drop of discharge rate, therefore the corresponding gain curves are not shown.
2.5 Discharge probability measurement
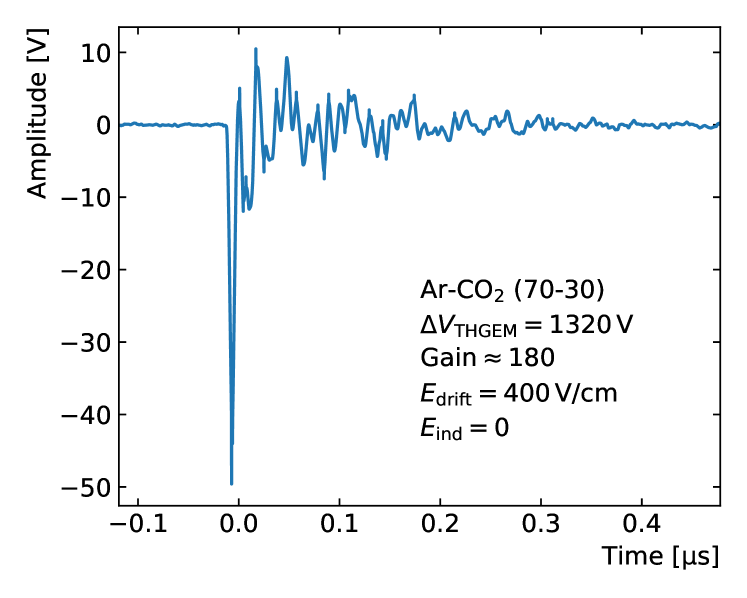
A typical discharge signal is shown in Fig. 6. The discharge probability is defined as the number of recorded discharge signals normalized to the total number of alpha particles emitted from the alpha source towards the THGEM structure, given by the alpha particle rate (see Section 2.3) and the measurement time , following the ratio
| (2) |
All discharge signals are recorded by a high-performance oscilloscope able to record waveforms with 100% efficiency, which are then counted and analyzed to resolve possible ambiguities. Depending on the gain settings, between a few and several hundred discharge signals are recorded in a single discharge probability measurement. Thus, the statistical uncertainty of the discharge probability, calculated assuming spark occurrence undergoing a Poisson distribution, exceeds 3% for all measurements. With the maximum discharge rate of (see Section 2.4.4) the average time between discharges is considerably longer than the system dead-time of needed to re-establish the nominal value in the THGEM after a spark. This time depends on the capacitance of the THGEM structure and HV cables (), and the protection resistor used in the setup (see Fig. 1). The occurrence probability of a discharge within the detector dead-time, given by the Poisson distribution, is therefore for the highest discharge rates. As the statistical uncertainties of discharge probability measurements largely exceed this value, the latter can be considered negligible in the evaluation of .
3 Results
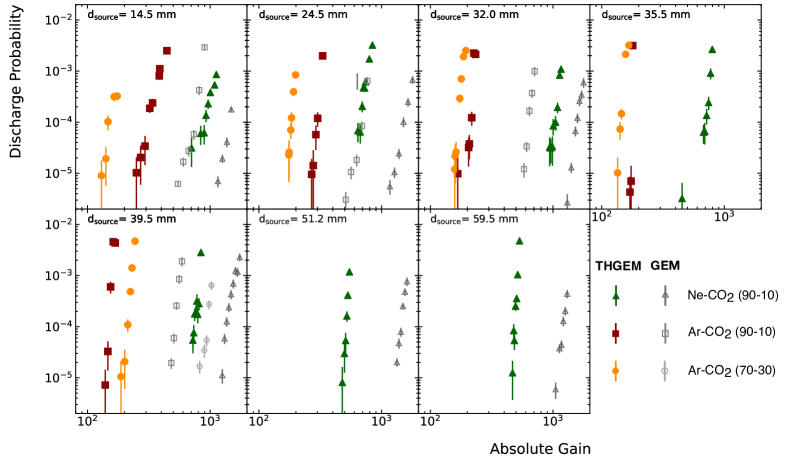
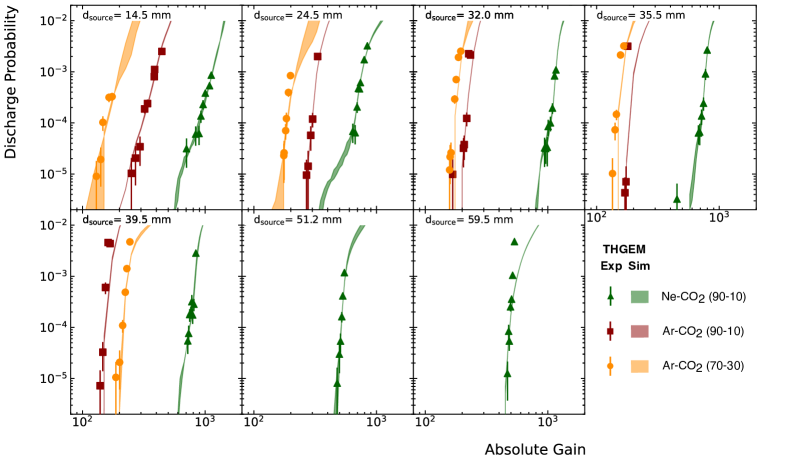
Figure 7 shows the discharge probability measured as a function of the absolute gain of an amplification structure at different values. The results for the THGEM are presented with full points for all gases used in this study. In addition, results obtained with a GEM structure [19] are plotted with hollow points, for comparison. It should be noted that GEM results in the Ar-CO2 (70-30) mixture are available only for = 39.5 mm.
3.1 dependence
It can be clearly seen that the discharge probability strongly depends on the gas mixture. The differences are especially pronounced between argon and neon mixtures. For a given gain, the discharge probability in Ar-CO2 (90-10) and Ar-CO2 (70-30) is several orders of magnitude larger than in Ne-CO2 (90-10). It is clear that the corresponding potential difference in neon is lower than in argon-based mixtures (see gain curves in Fig. 4) which may limit the effect of spurious discharges developing around electrode defects and further increase the difference between the discharge probability values obtained in different gases. The occurrence of such imperfections, however, is minimized by the dedicated polishing and cleaning procedure (see Section 2.1). In addition, the discharge rate without the source is measured in Ar-CO2 (90-10) at V V, corresponding to the maximum potential difference applied to the THGEM structure in this gas mixture. The background discharge rate is at the level of 4 mHz, which is 1% of the discharge rate measured with the alpha source at the corresponding settings. We, therefore, conclude that the effect of spurious discharges at high potential values can be neglected.
The observed dependency can be explained by considering the basic properties of the corresponding noble gas (see Table 1). The effective ionization potential Wi is lower in argon-based mixtures than in neon, thus the number of primary electrons liberated by an incident particle is higher. In addition, as discussed in Section 2.2, the range of alpha particles in the Ar-based mixtures is up to 40% shorter than in Ne-CO2 (90-10). As a result, higher charge densities are obtained in argon, therefore it is more likely to exceed the critical charge limits and develop a streamer in this gas. The same -dependency was observed in studies with GEMs [19] indicated in Fig. 7 with hollow points.
3.2 dependence
The THGEM results provide further arguments towards the primary charge density hypothesis being the driving factor for discharge formation in GEM-like structures. The measured discharge probability increases significantly with values close to the maximum range of an alpha particle in a given gas mixture. At such distances it is more likely that the Bragg peak produced by an alpha particle track is located in close vicinity of a THGEM hole, depositing a large amount of energy, which leads to high values of charge density. In addition, the discharge probability drops abruptly for values of larger than the alpha range, when no primary electrons are liberated within the THGEM holes (or close to them). The charges, drifting towards the THGEM plane, undergo diffusion which reduces charge densities at the hole level thus reducing the discharge probability. This effect was already shown in our studies with GEMs [19]. For THGEMs, with an order of magnitude larger dimensions of the structure, the effect is expected to play a less significant role. However, the upper limit of discharge probability measured in Ar-CO2 (90-10) at at the gain of (the range reflects gain variations during measurement) is orders of magnitude lower than the corresponding value measured at in a similar gain range.
3.3 Quencher content dependence
An interesting observation can be made by looking at the results obtained with Ar-based mixtures with different CO2 content. Even though higher quencher content is usually associated with increased stability, discharge probability values measured in Ar-CO2 (90-10) are lower than in Ar-CO2 (70-30) until inversion at . The same order of discharge curves at this distance is observed with GEMs [19], however, no comparison for lower distances can be made as no GEM results for Ar-CO2 (70-30) are available for other values. This observation could be again explained with primary charge densities and larger values of the diffusion coefficient in the less quenched mixture (see Section 2.2 and 2.3). As shown in Fig. 2, the average energy loss of alpha particles in Ar-CO2 (90-10) exceeds values obtained in Ar-CO2 (70-30) for track lengths larger than 40 mm, which corresponds to the value at which the inversion is observed.
3.4 Comparison between THGEM and GEM
The discharge probability values obtained with a THGEM substantially exceed those measured at the same absolute gain with a GEM of standard design [19]. The latter features a thick polyimide foil covered on both sides with layers of copper, with () inner (outer) hole diameter and a pitch of .
For the same value of discharge probability measured in a given gas mixture, the absolute gain value differs between GEMs and THGEMs by a factor of . With 100% collection efficiency and almost six times larger pitch between THGEM holes, it is clear that when fewer holes are available more primary charges can be collected in a single amplification cell. Thus, the number of primary charges entering a THGEM hole is larger than the corresponding number for GEMs. As primary charges are liberated along the straight alpha tracks, the portion of primary charges entering each hole should approximately scale with the hole pitch. This would explain the observed differences between obtained with both structures. With this argumentation, following Eq. (1), it can be concluded that a similar value of critical charge can be assumed for both structures.
The exact number of primary charges to be considered, however, depends on the position of the alpha track relative to the holes and its inclination. In order to study all possible geometrical effects and the influence of the basic parameters of the used gas mixture, dedicated Monte Carlo simulations are performed aiming at reproducing the experimental data, as described in the following Section 4.
4 Simulation
4.1 Detector model
In order to study the energy deposition of the alpha particles in the detector medium, a Geant4 (4.10.2.p02) [31] simulation is used. The simulation framework is based on previous work on discharge studies with GEMs, and is described in detail in [19].
In a realistic model of the detector geometry, the exact position and energy deposit of each individual Geant hit is registered. The number of primary ionization electrons is then obtained by dividing the energy deposit of each hit by the effective ionization energy. The electrons drift towards the THGEM plane according to the gas transport parameters listed in Table 1. Electrons located within a distance above the THGEM plane, with charge integration time being a free parameter, are then sorted in the honeycomb-like grid of the THGEM holes assuming 100% collection efficiency. In this way, distributions of electrons collected inside individual THGEM holes, specific to the gas mixture, , and , are obtained.
The total charge inside a hole is calculated by multiplying the collected primary electrons by the absolute gain value. The formation process of the discharge and its dependence on the charge density within the THGEM hole is not implemented in the simulation framework. Instead, a fixed threshold of accumulated charges is introduced as a free parameter. A discharge is then defined as an event in which this critical charge limit is exceeded in one of the THGEM holes. The final discharge probability is given by the number of events in which this threshold is exceeded, normalized to the total number of simulated alpha events. Only one discharge per event may occur following the experimental conditions where, after a spark, the potential across the THGEM holes breaks down and prevents the creation of further discharges. To enable fitting to experimental data, simulations are performed for a range of values for , and .
Due to the lack of drift field defining elements present in the detector the electric field within the active volume is distorted, in particular for larger values. Distortions of the drift field are reflected in modifications of the drift velocity and would demand a more sophisticated treatment of . However, following our previous studies, for the integration time of interest the variations of the drift field are well below 1%, and can be neglected [19, 32].
Finite element calculations using Comsol® Multiphysics [37] specific to the present THGEM setup show that additional field distortions are introduced by the THGEM through the central mounting hole. The drift field around it is distorted in a radius of , therefore charges entering this region do not contribute to the amplification and are disregarded in the simulation.
4.2 Comparison to experimental data
Simulated discharge curves, obtained for given parameter pairs (, ), are fitted to the experimental data by means of function minimization for each and gas mixture configuration. is constrained to values between 2 and 350 , whereas is varied between 5105 and 15106. For a step size of 5105 is used, while is varied in steps of 2 within the range of , in steps of 5 in the range of and in steps of 10 in the range of . The amplification factor has been varied in steps of 25 within the range of , in steps of 50 in the range of , and in steps of 250 in the range of . Simulation fits to the experimental data are shown in Fig. 8. The model describes the results fairly well.
The distribution of the primary electrons for a given gas is strongly dependent on and . Thus has to be extracted individually for each value. From the summed values the best parameter pair is extracted for each fit. As the distribution of primary charges collected within the THGEM structure is different for each and gas mixture, one cannot extract a single value describing all measurements for a given gas. However, following the simulation steps described in Section 4.1, it is meaningful to extract a single value associated to the probability of a discharge development in a given gas, independently of the distance . Therefore, the values obtained for all fits, for a given gas mixture, are averaged using a weighted mean method. Weights of parameters are given by extracted from each fit. The results, including the range of the values from the individual fits, are summarized in Table LABEL:tab:Qcrit.
The standard deviation is calculated with an unbiased estimator of weighted sample variance [38]
| (3) |
where indicates a fit for a given and is the resulting weighted mean average of critical charge parameter obtained from all fits, for a given gas mixture. Standard deviation values indicate the spread of extracted from individual fits. Although the uncertainties are relatively large, a clear gas dependence can be observed, similar to the results obtained with GEMs111note, the values for GEMs were extracted in a two-step minimization process [19], confirming the hypothesis that no universal value can be associated with a given amplification structure.
| Gas | THGEM | GEM | ||
|---|---|---|---|---|
| [ns] | [ns] | |||
| Ne-CO2 (90-10) | 7.1 2.2 | 7.3 0.9 | ||
| Ar-CO2 (90-10) | 4.3 1.5 | 4.7 0.6 | ||
| Ar-CO2 (70-30) | 2.5 0.9 | – | – | |
The numerical results for both amplification structures nicely agree with each other, in spite of the geometrical differences. Both measurements support the conclusion that the primary charge density, arriving at the single amplification cell, is a key factor influencing the stability of a (TH)GEM-like structure against a spark discharge.
The interpretation of the parameter fits is not straightforward. Following the model description in Section 4.1 and [19], it defines charge collection into the holes taking into account the primary charge distribution and gas transport properties. It is, therefore -dependent, and cannot be interpreted purely as a development time of a discharge. However, the order of magnitude of resembles this of streamer development in a GEM hole [39]. Thus, larger values of extracted for THGEMs than for GEMs (see Table LABEL:tab:Qcrit) may partially be related to the thickness of the former.
5 Conclusions
We have performed systematic measurements of the discharge probability in a single THGEM structure irradiated with highly ionizing alpha particles and compared them with geometrical model calculations. Both measurements and simulations are performed in the same fashion and using the same tools as in our previous work on GEM discharge stability [19]. This allows for a direct comparison of these two structures.
The atomic number dependency was observed in both GEM and THGEM studies pointing to Ne-based mixtures as less prone to electrical discharges than the argon ones. In addition, it was shown that increased quencher content does not necessarily improve detector stability against a spark discharge. Discharge probabilities measured in Ar-CO2 (70-30) are, in most of cases, higher than in Ar-CO2 (90-10), which can be explained by higher charge densities obtained in the former. For distances between the radiation source and the THGEM surface close to the maximum alpha range in Ar-CO2 (70-30), a drop in discharge probability can be observed, causing an inversion of discharge curves. In this case, the stability in Ar-CO2 (70-30) surpasses the one in Ar-CO2 (90-10). Increasing the distance further to the values exceeding the alpha range, the discharge probability drops by several orders of magnitude, close to the background level, as even the highest primary charge densities obtained around the Bragg peak will be reduced during the electron drift towards the amplification structure.
The THGEM, with its large dimensions, provides also a great opportunity to study whether the discharge probability scales with the number of holes available for amplification. Indeed, it has been observed that for the same value of discharge probability, the absolute gain value differs between GEMs and THGEMs up to a factor of five and it can be concluded that the number of primary charges entering a THGEM hole is higher than for GEMs. This is not surprising, given the almost six times larger pitch between THGEM holes. Simulation results have been fitted to the experimental data and the value of the parameter has been extracted for all the gas mixtures used in the measurement (see Table LABEL:tab:Qcrit). They confirm the observation of gas-dependency of the value. Both measurements support the conclusion that the primary charge density, arriving at the single amplification cell, is a key factor influencing the stability of a GEM-like structure against a spark discharge. Moreover, the results for both amplification structures nicely agree with each other, in spite of the geometrical differences and different electric field configurations inside GEM and THGEM holes. The primary charge limits shall be therefore considered per single holes and not normalized to the hole volume. This would support the hypothesis that the effective volume of streamer formation is similar in both cases, however, for a final conclusion detailed simulations of streamer formation are necessary.
Given the results described above, one can also derive several possible mitigation methods to be considered while designing any kind of (TH)GEM-like structures:
-
1.
optimization of the (TH)GEM geometry by reducing the pitch between holes; this needs to be balanced with the production capabilities and quality of small-pitch GEMs;
-
2.
choice of the gas mixture: light gases preferable; care should be taken while choosing the quencher content to optimize primary charge density and electron transport properties;
-
3.
optimization of fields above the (TH)GEM structure: if allowed by the measurement requirements, the minimum diffusion coefficient and maximum drift velocity regions shall be avoided. Electron collection and extraction efficiencies shall be also considered as they directly influence the total number of charges entering single (TH)GEM holes.
The outcome of these studies can be of particular interest for the development of THGEM-based hadron blind and photon detectors, operated at high gains, or cryogenic applications, such as dual-phase liquid argon detectors, where resistance against discharges is of the highest importance. Although the operational conditions may differ, the stability limits of THGEM structures evaluated in this study can serve as a reference for the optimization of such detectors. Stability at higher gains can be studied with point-like radiation (e.g. x-rays) and compared to the critical charge limits obtained with an alpha source. It should be noted, however, that other effects, such as sharp electrode edges or defects, may influence detector stability at high operational voltages. Measurements of critical charge dependence on the gas mixture should also include quenchers other than CO2 as well as the operation in pure noble gases. Detailed studies on the fundamental stability limits of MPGD structures continue and their results will be presented in the forthcoming publications.
Acknowledgements
The studies have been performed in the framework of the RD51 Collaboration. The authors wish to thank INFN Trieste group, in particular S. Dalla Torre, F. Tessarotto and S. Levorato, for providing THGEM structures for these studies. We warmly thank C. Garabatos and E. Hellbär for providing Magboltz and Garfield calculations, and many fruitful discussions.
This work was supported by the Deutsche Forschungsgemeinschaft - Sachbeihilfe [grant number DFG FA 898/5-1]. Lukas Lautner acknowledges support from the Wolfgang Gentner Programme of the German Federal Ministry of Education and Research (grant no. 13E18CHA).
References
- [1] R. Chechik, A. Breskin, C. Shalem, D. Mörmann, Thick GEM-like hole multipliers: properties and possible applications, NIM A 535 (2004) 303.
- [2] R. Chechik, A. Breskin, C. Shalem, Thick GEM-like multipliers - a simple solution for large area UV-RICH detectors, NIM A 553 (2005) 35.
- [3] F. Sauli, GEM: A new concept for electron amplification in gas detectors, NIM A 386 (1997) 531.
- [4] A. Breskin, et al., A concise review on THGEM detectors, NIM A 598 (2009) 107.
- [5] A. Breskin, et al., The THGEM: A thick robust gaseous electron multiplier for radiation detectors, NIM A 623 (2010) 132.
- [6] M. Alexeev, et al., The gain in thick GEM multipliers and its time-evolution, JINST 10 (2015) P03026.
- [7] M. Alexeev, et al., Status and progress of the novel photon detectors based on THGEM and hybrid MPGD architectures, NIM A 766 (2014) 133.
- [8] J. Agarwala, et al., Novel MPGD based detectors of single photons in COMPASS RICH-1, NIM A 912 (2018) 158.
- [9] J. Agarwala, et al., The Hybrid MPGD-based photon detectors of COMPASS RICH-1, NIM A 952 (2020) 161832.
- [10] F. Tessarotto, Stability of THGEMs, Presentation at the RD51 Collaboration Meeting and the ”MPGD Stability” workshop, Munich 18-22 June 2018.
- [11] L. Loeb, Fundamental Processes of Electrical Discharge in Gases, J. Wiley & Sons, Incorporated, 1939.
- [12] L. B. Loeb, A. F. Kip, Electrical Discharges in Air at Atmospheric Pressure The Nature of the Positive and Negative Point‐to‐Plane Coronas and the Mechanism of Spark Propagation, Journal of Applied Physics 10 (1939) 142.
- [13] H. Raether, Die entwicklung der elektronenlawine in den funkenkanal, Zeitschrift für Physik 112 (1939) 464.
- [14] J. M. Meek, A theory of spark discharge, Phys. Rev. 57 (1940) 722.
- [15] A. Bressan, et al., High rate behavior and discharge limits in micro-pattern detectors, NIM A 424 (1999) 321.
- [16] V. Peskov, et al., The study and optimization of new micropattern gaseous detectors for high-rate applications, IEEE Transactions on Nuclear Science 48 (4) (2001) 1070–1074.
- [17] P. Fonte, V. Peskov, On the physics and technology of gaseous particle detectors, Plasma Sources Sci. Technol. 19 (2010) 034021.
- [18] A. Delbart, J. Derré, Y. Giomataris, F. Jeanneau, I. Papadopoulos, Performance of MICROMEGAS with preamplification at high intensity hadron beams, NIM A 478 (2002) 205.
- [19] P. Gasik, A. Mathis, L. Fabbietti, J. Margutti, Charge density as a driving factor of discharge formation in GEM-based detectors, NIM A 870 (2017) 116.
- [20] D. Thers, et al., Micromegas as a large microstrip detector for the COMPASS experiment, NIM A 469 (2001) 133.
- [21] S. Bachmann, et al., Discharge studies and prevention in the gas electron multiplier (GEM), NIM A 479 (2002) 294.
- [22] B. Moreno, et al., Discharge rate measurements for Micromegas detectors in the presence of a longitudinal magnetic field, NIM A 654 (2011) 135.
- [23] S. Procureur, et al., A Geant4-based study on the origin of the sparks in a micromegas detector and estimate of the spark probability with hadron beams, NIM A 621 (2010) 177.
- [24] S. Procureur, et al., Origin and simulation of sparks in MPGD, JINST 7 (2012) C06009.
- [25] C. Chatterjee, The novel photon detectors based on MPGD technologies for the upgrade of COMPASS RICH-1, Il Nuovo Cimento 41 C (2018) 74.
- [26] A. Utrobicic, M. Kovacic, F. Erhardt, N. Poljak, M. Planinic, A floating multi-channel picoammeter for micropattern gaseous detector current monitoring, NIM A 801 (2015) 21.
- [27] S. Biagi, Magboltz 2, http://cds.cern.ch/record/1018382 (2000).
- [28] R. Veenhof, Garfield - simulation of gaseous detectors, http://garfield.web.cern.ch (1984 - 2010).
-
[29]
Ernst Hellbär,
Ion Movement
and Space-Charge Distortions in the ALICE TPC, Master’s thesis,
Goethe-Universität Frankfurt am Main (Oct. 2015).
URL https://www.uni-frankfurt.de/98121718/MA_Hellbaer.pdf - [30] Eckert & Ziegler Nuclitec GmbH, Composite alpha source, https://www.ezag.com/?id=183.
- [31] S. Agostinelli, et al., Geant4 - a simulation toolkit, NIM A 506 (2003) 250.
-
[32]
Andreas Mathis,
First
Measurement of the Proton- Interaction via the Femtoscopy Method,
Ph.D. thesis, Technische Universität München (Dec. 2020).
URL https://www.das.ktas.ph.tum.de/DasDocs/Public/PhD_Theses/Mathis_PhD.pdf - [33] S. Bachmann, et al., Charge amplification and transfer processes in the gas electron multiplier, NIM A 438 (1999) 376.
-
[34]
Viktor Ratza, Multi-stage
micropattern gaseous detectors for the alice tpc upgrade - studying and
modelling charge transfer and energy resolution, Ph.D. thesis, Rheinische
Friedrich-Wilhelms-Universität Bonn (Jun. 2020).
URL http://hdl.handle.net/20.500.11811/8421 - [35] M. Pitt, et al., Measurements of charging-up processes in THGEM-based particle detectors, JINST 13 (2018) P03009.
- [36] P. Correia, et al., Simulation of gain stability of THGEM gas-avalanche particle detectors, JINST 13 (01) (2018) P01015–P01015.
- [37] COMSOL, Comsol multiphysics®, http://www.comsol.com (1984 - 2010).
- [38] The GSL Team, GNU Scientific Library Reference Manual, https://www.gnu.org/software/gsl/doc/html/index.html (1996-2021).
- [39] S. Franchino, et al., Effects of high charge densities in multi-GEM detectors, 2015 IEEE Nuclear Science Symposium and Medical Imaging Conference (2015) 1.