First principles and Monte Carlo studies of adsorption and desorption properties from Pd1-xAgx surface alloy
Abstract
The FCC structure of Pd1-xAgx ( 0.25, 0.50, 0.75) alloys is considered as a fuel cell component in this study. We have looked into its qualities as a component of a fuel cell to see whether it could be potentially used as an alternative replacement of the Pt catalyst. We used Density Functional Theory (DFT) to study H and CO interaction with the surface, and Kinetic Monte Carlo (KMC) to study H and CO desorption from the surface. The bulk modulus and equilibrium crystal structures of Pd1-xAgx alloys were computed using the GPAW code within plane wave basis set a PBE exchange correlation functional treatment. The best values of a lattice constant for the system are obtained by total energy calculations versus lattice cell volumes as fitted to the stabilized jellium model. Surface energies, cohesive energies, and binding energy of Pd1-xAgx alloys were computed to analyze the stability properties of structures. Band structure calculations reveal the electronic and optical properties of these alloys. The density of states (DOS) and projected density of states (PDOS) show the availability of the eigenstates for occupation. The desorption process is studied within the Arrhenius type desorption rate a temperature programming. The effects of lateral interactions between adsorbed molecules on first order desorption (molecular adsorption) second order desorption were taken into account. Adsorption energies of H and CO on Pd3Ag (111) as calculated using DFT is used in the process. The outcomes show good qualitative agreement with literature.
keywords:
PEMFC, Density functional theory , Monte carlo, desorption rate , hydrogen, carbon monoxide, adsorption.1 Introduction
Understanding the microscopic structure of matter, how daily goods are formed, and how they might be developed is always beneficial. Low-temperature polymer electrolyte membrane fuel cells (PEMFCs), also known as proton exchange membrane fuel cells, have stimulated interest in recent years as a feasible power source, particularly in automotive applications [1]. PEM fuel cells generate electricity by combining hydrogen (or hydrogen-rich fuel) and oxygen (from the air), resulting in low pollution and high fuel economy [2]. The development of highly active and low-cost catalysts is a major challenge before proton exchange membrane fuel cells (PEMFCs) can find large-scale practical applications [3, 4, 5, 6, 7, 8, 9, 10].
Platinum has been widely chosen for a catalytic role in PEMFC since a decades ago [11]. However, there is a need to find replacement materials because Pt has been used as a catalyst for fuel cells for a long time and might face being a short supply in the future. Even currently, one of the major barriers for a cheap commercialization of fuel cell engines is the electrodes’ high cost, which is mostly due to the use of expensive platinum (Pt)-containing electro-catalysts. Furthermore, the oxygen reduction reaction (ORR) at the cathode is the PEM fuel cell’s rate-limiting phase, in which molecular oxygen is destroyed and mixed with protons and electrons supplied by the anode through the membrane and external circuit to form water as by-product. As a result, platinum-based catalysts can be poisoned by carbon monoxide (CO) and other pollutants [12]. Because of these characteristics, pursuing for alternative catalyst materials have gotten a lot of research attention. A recent study within our research group [13] has investigated palladium as a possible candidate for replacement. This corresponds to , in the alloy composition. However, still because of the rare availability of Pd, consideration of further other alloys as a replacement candidate is of interest in this work. As a result, one of our primary motives is to investigate the properties of the Pd1-xAgx () alloy as components of fuel cell, as electrode. This could also represent a study on a part of a grand alloy matrix Pt1-xAgxPd1-xAgx, making the fuel cell electrode, where investigating how certain region of the alloy dominated by Pd1-xAgx behaves is the central interest point of this work. Studying efficiency of candidate replacement catalysts goes through investigating interactions of molecules of fuel with components of the fuel cell as well as also transport of the molecules of fuel within the fuel cell.
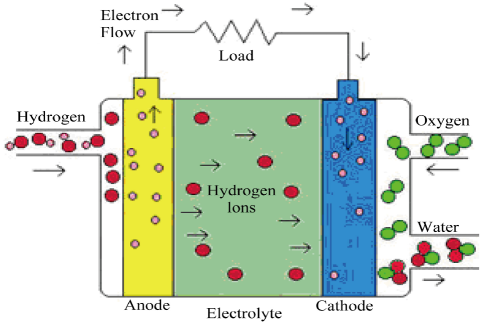
The interaction of molecules of fuel with the fuel cell electrode is studied by Density Functional Theory (DFT), while desorption of molecules of the fuel from the fuel cell electrode is studied by Kinetic Monte Carlo (KMC) simulation. A Simplified diagram of the PEM fuel cell operating principles is shown in Fig. 1.
In this paper, we present the results adsorption properties based on first principles DFT calculation, as well as a monte carlo study of desorption process from Pd1-xAgx ( 0.25, 0.50, 0.75) surface alloy where the DFT outputs are used as empirical parameters. Our presentation focuses on Pd3Ag (111), specifically due to its stability compared to PdAg and PdAg3 surfaces. The paper is organized as follows. In the next section (sec. 2), a detail account of the computational method is presented. Results and discussion are presented in section 3, with the conclusion being presented in section 4.
2 Computational Methods
2.1 Density Functional Theory (DFT)
An ab-initio simulations within gpaw code [15] is used to examine the electronic structure properties of the Palladium-Silver alloy. The electron wavefunction is approximated in gpaw using a projector augmented wave (PAW) modality expanded over a planewave basis set [16, 17]. The PAW technique is designed to successfully deal with the so-called pseudopotential idea, which is used in other DFT codes. The exchange-correlation energies are treated using PBE [18]. The PAW data set takes care of the electron-ion interactions. The k-points of the Brillouin zone (BZ) are generated from the input -mesh using the Monkhorst-Pack scheme [19]. The number of valence electrons considered for each element within the paw data sets is Pd:16, Ag:17, H:1, C:4, and O:6. Geometry relaxations are carried out using BFGS minimizer [20], where optimizations of the atomic coordinates and the unit cell degrees of freedom is done within the concept of the Hellmann-Feynman forces and stresses [21, 22] as calculated on the Born-Oppenheimer (BO) surface [23]. The convergence criteria for the forces were set at 0.05 eV/Å.
Surfaces are modelled by a slab containing four atomic layers of the desired indices. The top two atomic layers are allowed to relax upon geometry optimizations while the bottom two layers are frozen to a bulk geometry. A vacuum layer of 10 Å is added to the slabs making a supercell which avoids lateral interaction between slabs, while also mimicks a three dimensional cell. Free adsorbate molecules/atoms prior to adsorption are relaxed in a cubic unit cell of side length 10 Å. Adsorptions are done by putting adsorbate molecules / atoms on the top most atomic layers of the slabs then allowing geometry relaxations to take place. Adsorption energies are calculated according to:
| (1) |
Here, denotes total energy of a clean surface, denotes total energy of an isolated molecule, and denotes total energy of a relaxed geometry containing both substrate and molecule. All energies are per supercell. Accordingly to Eq. (1), thus, positive values in energies indicate exothermic reactions while negative values denote endothermic. A cubic unit cell with 3 Pd and 1 Ag atoms has been considered for Pd3Ag bulk structure. For PdAg structure, the cubic unit cell with 2 Pd and 2 Ag atoms has been used. For PdAg3 structure, the cubic unit cell with 1 Pd and 3 Ag atoms has been used. Since plane wave basis set is used for the expansion of electron wavefunctions, the k-points cut-off energies chosen would impact on total energy of the systems. Our calculations show that k-mesh of 888 can be optimum in the bulk calculations. With a fixed k-mesh of , a convergence test of the total energy with respect to energy cutoff is performed. As a result, we have chosen a cut-off energy (ecut) of 600 eV as an optimum in the rest of our calculations. With surface calculations, correspondingly, a k-mesh of 881 and an ecut of 600 eV is used.
2.2 Kinetic Monte Carlo (kMC)
In experiments, thermodynamic and kinetic parameters of desorption processes or decomposition reactions can be determined using temperature programmed desorption (TPD). In simulations, there are numerous approaches for simulating TPD spectra, with Monte Carlo simulation being one of the most useful and crucial. This approach has the distinct advantage of requiring as fewest assumptions as possible. The probability for a particle at site to desorb in the interval between , ( + t) may be calculated directly using Eq. (2),
| (2) |
Where , is the vibrational pre-factor or pre-exponential factor. R and T are universal gas constant and absolute temperature, respectively. The temperature in the simulation is updated by Eq. (3).
| (3) |
where is time for a desorption event and is the heating rate. The probability for a particle at site to desorb in the interval between , ( + t) when lateral interaction is considered is given by Eq. (4),
| (4) |
is the so-called pre-exponential factor, is the reaction order or kinetic desorption order (with values 0, 1, and 2), is the activation energy for desorption (for this work taken from DFT), is the interaction energies between the adsorbate molecules, and and T are the universal gas constant and sample surface temperature, respectively. The interaction term of Eq. (4) is approximated according to
| (5) |
with (pair-interaction energy) values are taken from literature [24]. denotes number of nearest neighbor. For the Markovian process, the metropolis algorithm within the concept of Meng and Weinberg [25] is applied.
3 Results and discussion
3.1 Equation of state (EOS) and cohesive energy
We determine the equilibrium lattice constant and bulk modulus (material’s resistance to external pressure), using the equation of state curve-fitting approach for different palladium-silver bulk structures. The EOS is obtained by a curve fits within Stabilized Jellium model (sjeos) [26] to an energy versus volume calculation data, which also additionally outputs other important bulk structural quantities, such as minimum volume and minimum energy. This fit approach seems to yield a bulk modulus values which is more closer to experiments than with using other fit methods such as Birch-Murnaghan [27, 28] approach. However, the predicted values of the optimum lattice constants by using all the fit methods have appeared to be identical. The output parameters obtained within the sjeos fit approach, along with comparison with experiment results, is presented in Table 1. The experimental results are taken from literatures [29, 30, 31, 32].
The cohesive energy [eV/atom] is defined as the energy required to dissociate the alloy compound into free (neutral) atoms. It is calculated according to
| (6) |
where is the cohesive energy, is the number of atoms in the unit cell of the palladium-silver alloy. is the atomic energy of a free palladium and silver atoms. Accordingly, as also shown in Table 1, the cohesive energy of Pd3Ag PdAg PdAg3. That means Pd3Ag is more stable.
| Quantity | Source | System | ||||
|---|---|---|---|---|---|---|
| Pd | Pd3Ag | PdAg | PdAg3 | Ag | ||
| This work | 3.94 | 3.98 | 4.02 | 4.07 | 4.07 | |
| Exp. | 3.88 | 3.92 | 3.97 | 4.02 | 4.07 | |
| B | This work | 188 | 139.5 | 127 | 103.7 | 109 |
| Exp. | 180.8 | 139.4 | 116 | 103.1 | 100 | |
| This work | - | 3.08 | 3.31 | 3.61 | - | |
| Exp. | - | - | - | - | - | |
| This work | - | 3.31 | 2.89 | 2.60 | - | |
| Exp. | - | 3.60 | 3.37 | 3.16 | - | |
The energy necessary to form the alloy compound from its separate elemental bulk structures is represented by formation energy, [eV/atom], which is given by
| (7) |
where is number of atoms in the unit cell of the alloy compound, is total energy of the bulk alloy compound, is total energy of bulk of element , is number of atoms in the unit cell of the elemental bulk forms. In terms of formation energy, thus, of Pd3Ag PdAg PdAg3 (see Table 1). This means Pd3Ag alloy is relatively a more favorable to be formed. From the EOS output, it is investigated that the total energy per atom values are about -3.6 eV, -3.4 eV, -3.1 eV, respectively, for Pd3Ag, PdAg, PdAg3 structures. Furthermore, the bulk modulus (B) value for Pd3Ag PdAg PdAg3 means that Pd3Ag has relatively better operating endurance capacity under extreme pressures. The fact that the optimal geometry structure properties presented in Table 1 compare reasonably well with experiments also gives the authors a full confidence on the validity of the chosen model alloy compound surfaces of this study.
3.2 Surface energy
Surface energy is used to characterize the surface of a substrate. Its values range from high to low. Adhesion between unlike materials is determined by the molecular force of attraction between them. The strength of the attraction is determined by the substrate’s surface energy. A strong molecule attraction is indicated by a high surface energy, whereas a weak molecular attraction is indicated by a low surface energy. A high surface energy would also indicate increased reactivity with adsorbates, while low surface energy would indicate increased stability. Surface characteristics are extremely important, especially in catalysis. Generally, the surface energy ( [eV/Å2]) is defined as
| (8) |
where denotes the total energy of a slab unit cell, means number of atoms in the slab unit cell, means number of atoms in the bulk unit cell, and is the total energy of a bulk unit cell. is the surface area of a slab unit cell, and the factor half accounts for the top and bottom surfaces.
| System | Surface energy () [eV/Å2] | ||
|---|---|---|---|
| 100 | 110 | 111 | |
| Pd3Ag | 0.085 | 0.089 | 0.072 |
| PdAg | 0.076 | 0.078 | 0.062 |
| PdAg3 | 0.056 | 0.060 | 0.049 |
As shown in Table 2, the surface energies for the surface facets increase according to for all the structures. This means (111) surfaces offer a relatively more stable geometries, while (110) facets would likely be expected to be more reactive to impurities / adsorbates. However, the surface energies values, when compared across the different structures, are closely related, albeit the small differences can be taken as being a marginal errors. Studies of interactions of these surfaces with adsorbates: hydrogen (H), and carbon monoxide (CO) are discussed in the next subsections. The adsorption site terminologies of top (T), bridge (B), and hollow (H) refer to the placement of adsorbates at the geometries depicted in Fig. 2. The corresponding adsorption results are shown in Tables 3 4.
(a)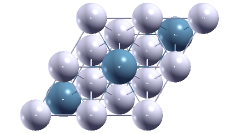 (b)
(b) 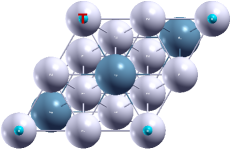 (c)
(c) (d)
(d) 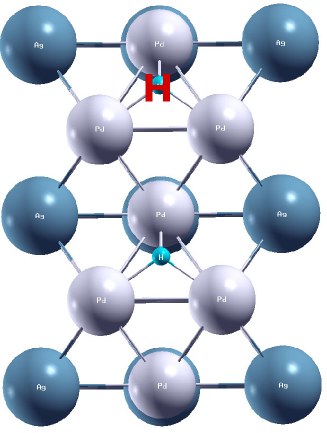
3.3 Adsorption energy of Hydrogen (H) and Carbon monoxide (CO)
Upon the adsorptions, a CO molecule or H is placed on the surfaces on one side of the slab at either the on-top (T) site, on bridge (B), or fcc hollow (H) site. The adsorption energies are calculated as
| (9) | |||||
| (10) |
where is the energy of an isolated (free) molecule, and is the energy of an isolated H2 molecule. The results are given in Tables 3 4.
| System | Surface | Site | Eads [eV] | |
|---|---|---|---|---|
| Pd3Ag | 100 | T | -0.81 | - |
| B | 0.15 | -0.06 | ||
| H | 0.32 | - | ||
| 110 | T | -0.34 | - | |
| B | -0.15 | -0.06 | ||
| H | -0.52 | - | ||
| 111 | T | -0.34 | - | |
| B | 0.34 | -0.16 | ||
| H | 0.59 | -0.10 | ||
| PdAg | 100 | T | -0.84 | - |
| B | -0.34 | -0.11 | ||
| H | -0.29 | - | ||
| 110 | T | -0.40 | - | |
| B | 0.14 | -0.14 | ||
| H | -0.27 | |||
| 111 | T | -0.40 | -0.09 | |
| B | 0.02 | -0.14 | ||
| H | 0.34 | -0.06 | ||
| PdAg3 | 100 | T | -0.88 | - |
| B | -0.39 | -0.09 | ||
| H | -0.57 | |||
| 110 | T | -0.97 | - | |
| B | -0.37 | - | ||
| H | -0.31 | - | ||
| 111 | T | -0.34 | -0.09 | |
| B | 0.04 | -0.16 | ||
| H | 0.08 | -0.19 |
| System | Surface | Site | Eads [eV] | |
|---|---|---|---|---|
| Pd3Ag | 100 | T | 0.09 | |
| B | 0.67 | +0.16 | ||
| H | -1.62 | - | ||
| 110 | T | 1.66 | - | |
| B | 1.68 | +0.15 | ||
| H | -0.95 | - | ||
| 111 | T | 1.35 | +0.16 | |
| B | 1.26 | +0.15 | ||
| H | 0.83 | |||
| PdAg | 100 | T | 0.06 | - |
| B | -0.78 | +0.26 | ||
| H | -2.89 | - | ||
| 110 | T | 1.54 | - | |
| B | 0.55 | +0.18 | ||
| H | -2.18 | |||
| 111 | T | 1.37 | +0.18 | |
| B | 0.15 | +0.25 | ||
| H | -0.01 | - | ||
| PdAg3 | 100 | T | -0.20 | - |
| B | -0.80 | +0.15 | ||
| H | -3.06 | |||
| 110 | T | -0.12 | - | |
| B | -1.07 | - | ||
| H | -4.25 | - | ||
| 111 | T | 1.33 | +0.19 | |
| B | 0.10 | +0.30 | ||
| H | -0.92 | - |
The results in the tables show that Pd3Ag (111) shows modest reactivity towards both adsorbates, while Pd3Ag (110) looks to be more reactive with CO (albeit it may result in a poisoning effect). However, Pd3Ag (111) is also a more favored surface for consideration, since it shows a relatively more stability. The charge differences are computed according to
| (11) |
where is electron density differences obtained from the ground state calculations. The charge differences are calculated according to the concept in Eq. (11) using Bader charge formulation [33] as implemented by literature [34]. Hydrogen seems to release charges to the surfaces, while CO gains. These values (see Table 3) show a donation of 0.16 per one hydrogen atom to the system. CO gains nearly about the same from the system (see Table 4).
3.3.1 Adsorption energies on Pd3Ag surfaces
On (100) surface, an adsorption energy of up to 0.32 eV is investigated upon a dissociated adsorption as hydrogen atoms at the H site. At such a higher adsorbate coverages as 1 ML, the energetically favorable adsorption sites are H B, with a relative favorability order being H B. In the case of CO adsorption, the adsorption energy is up to 0.67 eV, the favored sites are T B, with the order being B T.
On (110) surface, adsorption of hydrogen atoms seems to be endothermic at all sites, while adsorption of CO can have adsorption energy of up to 1.68 eV, with favorable sites being T B, and the order of favorability being B T. On (111) surface, a dissociated adsorption as hydrogen atoms is preferred with adsorption energies of up to 0.59 eV, as shown in the Table 3. The favorable sites are H B, with the order of relative favorability being H B. With adsorption of CO, all sites are favorable with the adsorption energy of up to 1.35 eV, the relative favorability order of the sites seems as T B H. The desorption energy values on Pd3Ag (111) is comparable to but slightly smaller than a counterpart on Pt (111) [35], means an improved performance of the model for the desired application. Smaller adsorption energy of hydrogen would be good to a fuel cell operation at lower temperatures, while smaller adsorption energy of CO means good chance for reducing CO poisoning.
3.3.2 Adsorption energies on PdAg surfaces
With adsorption of hydrogen at a coverage of 1 ML, the B site of (110) and the B H sites of (111) surface are favorable adsorption sites. The adsorption energies of up to 0.34 eV, which occurs at H site of (111) is investigated (Table 3).
With adsorption of CO, T site of (100), T B sites of (110), and T B sites of (111) are the favored adsorption sites, with adsorption energies of up to 1.54 eV, which occurs at T site of (110) surface.
3.3.3 Adsorption energies on PdAg3 surfaces
At such a higher adsorbate coverage of 1 ML, hydrogen adsorbs on (111) surface at a favorable sites of B H, with adsorption energy of up to 0.1 eV. Adsorption of CO happens at a favorable sites of T B, with adsorption energies of up to 1.3 eV at the T site.
3.4 Electronic Properties
3.4.1 Density of States (DOS) and Band structures
The DOS PDOS curves are presented in Fig. 3.
(a) 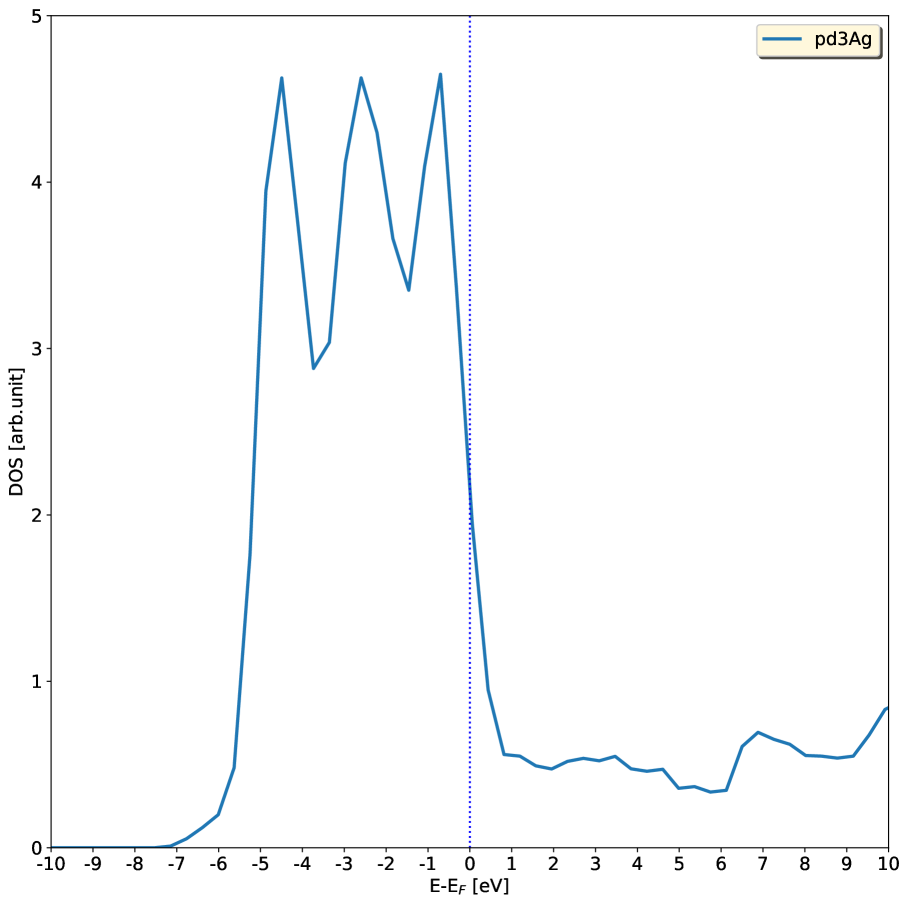 (b)
(b) 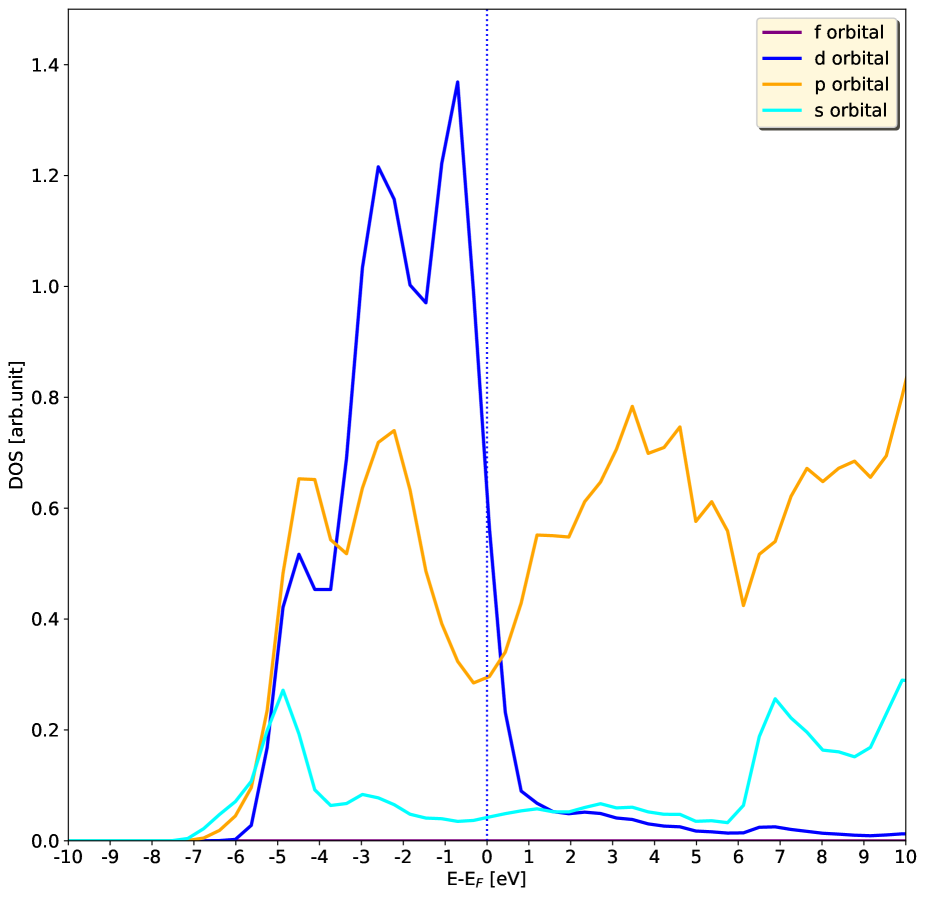
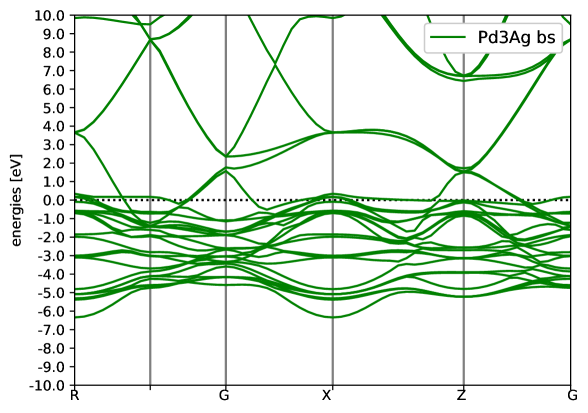
The dos peaks of the valence states show-up with significant amount in the energy region of E-EF [-6,0] eV, see Fig. 3. The , , orbitals (Fig 3) contribute to the occupation states of dos. The -orbital has most states for occupation followed by -orbital, which in turn is followed by -orbital. The states dominate states near the Fermi level, while the states contribute in the middle energy level, and the -states contribute in the deeper energy levels. The band structure (Fig. 4) shows no energy gap, that the system has a typical metallic character.The dos plots of hydrogen, CO adsorbed on Pd3Ag (111) is presented in Fig. 5.
(a) 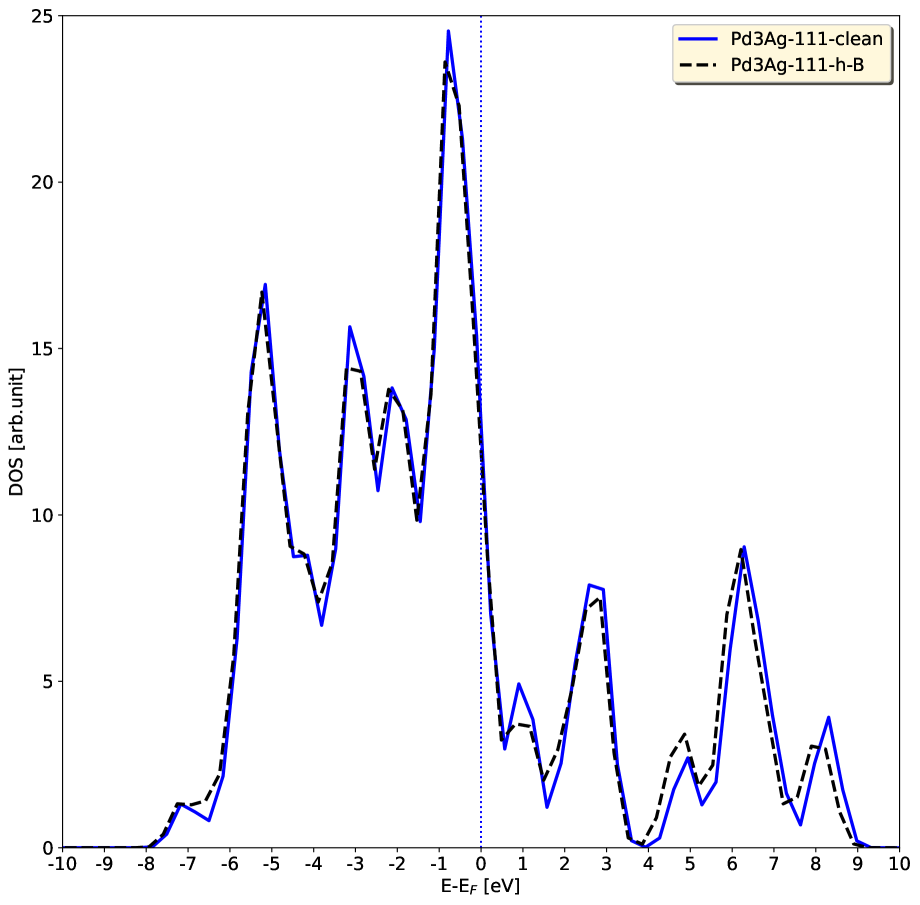 (b)
(b) 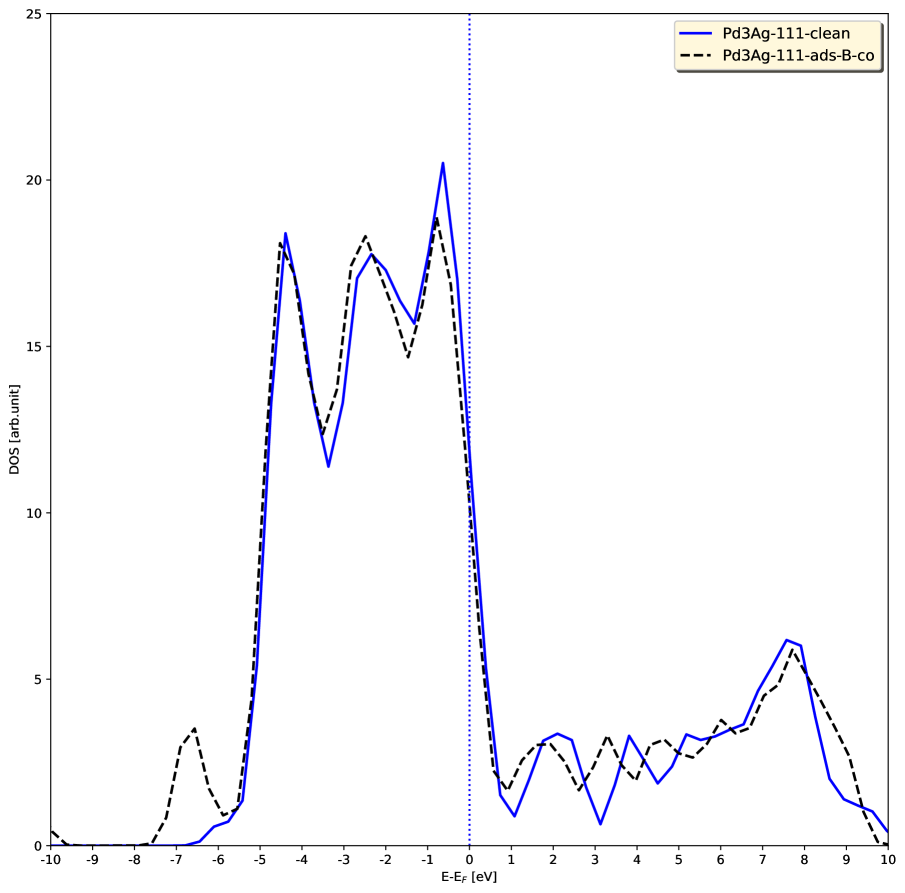
A slightly decreased states is seen upon adsorption, as shown in the figures, due to partial occupation of the empty orbital states by the adsorptions. No major energy level shift is seen between dos curves of before after adsorptions. However, the nature of curves at energy levels E-EF of -5 eV -1 eV (see Fig. 5 left side) means a sign of - hybridization between states of surface atoms states of the adsorbate hydrogen. Similarly, from Fig. 5 (right side), we can see a - hybridization with the adsorption of CO.
(a) 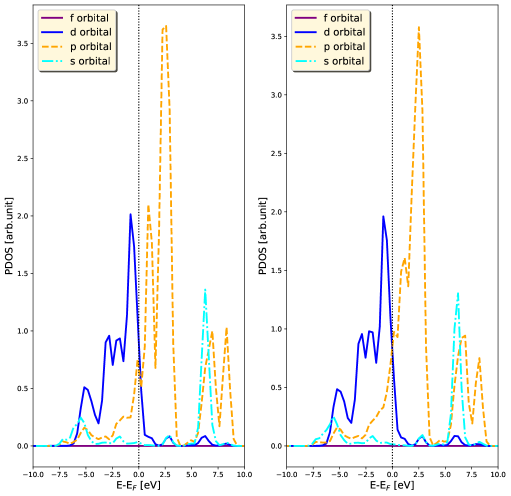 (b)
(b) 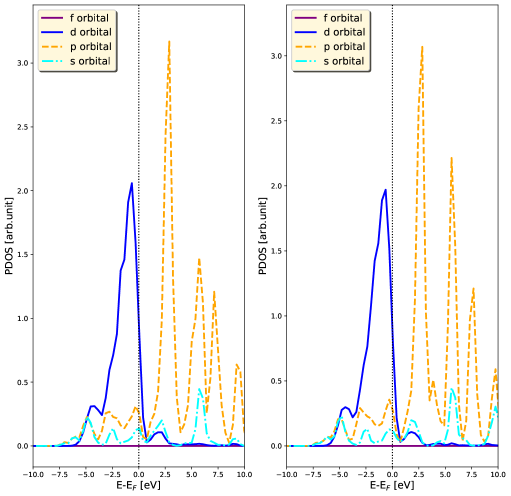
From Fig. 6, the -, - orbitals hybridization can be seen from the coinciding curve peaks (see the figure on left, right side, respectively).
By the adsorptions, the band structure plots (Fig. 7) show that no typical difference to the electrical properties of the surfaces happens, except that the energy curves at the special k-points become more dense due to an added energy eigenvalues from the adsorbate states.
(a) 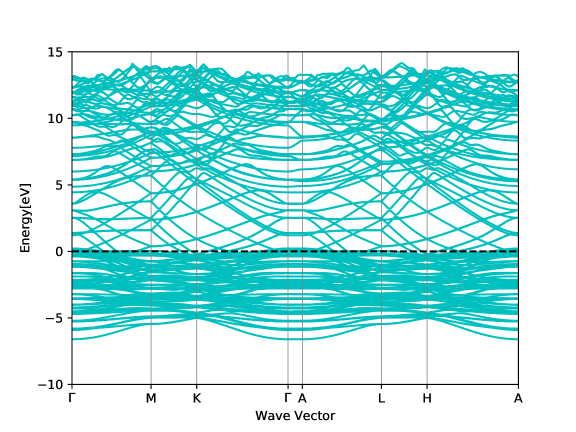 (b)
(b) 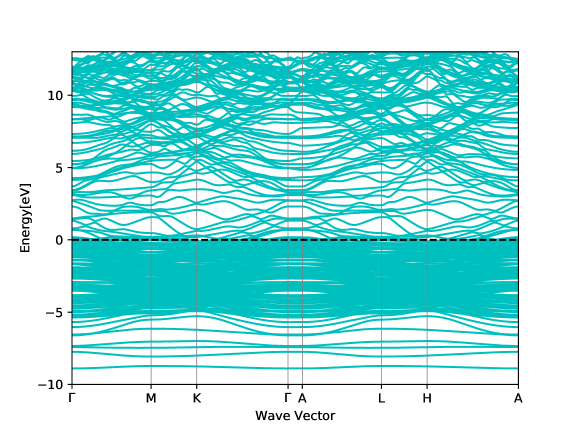
3.5 KMC output of desorption process
In this section, a Monte Carlo simulation of the desorption process of adsorbates from the alloy surfaces is presented. In the simulation, two cases are considered, with adsorbate coverage being = 1 ML (i.e., 1 molecule/atom of adsorbate per a (1) surface unit cell). The first case is by considering a lateral interaction on the adsorbate which is given by eV, and the second case is by neglecting lateral interaction.
3.5.1 Simulation of desorption with a lateral interaction
First, we present the desorption process of hydrogen adsorbate as follows. The adsorption energy of hydrogen at bridge site of Pd3Ag (111) is 0.34 eV (Table 3). Figure 8 shows the simulation output of first order desorption process by including the effect of lateral interaction for different heating rates of = 2 K/s, = 5 K/s and = 10 K/s.
The desorption peaks occur at temperatures of = 280 K for = 2 K/s, = 335 K for = 5 K/s, and = 390 K for = 10 K/s. The peaks shift to the right (higher temperature) as the heating rate increases. For a simulation within second order, the output is presented in Fig. 9.
From the graph, the desorption peaks occur at temperatures of = 287 K for = 2 K/s), = 345 K for = 5 K/s, and = 400 K for = 10 K/s. The peaks shift to the right (higher temperature) as the heating rate increases. The peaks occur at a relatively higher temperature, by up to 10 K, compared to the case of first order.
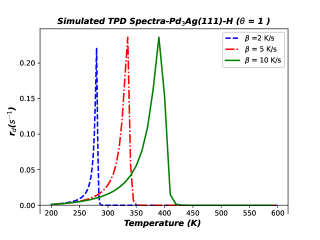
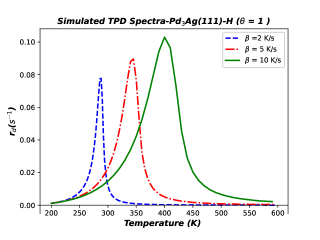
Secondly, the simulation of desorption rate for the adsorbate CO is given as follows. The adsorption energy of CO at bridge site of Pd3Ag (111) is 1.26 eV (Table 4). The outcomes of simulation within first second order rates is presented in Figs. 10 11.
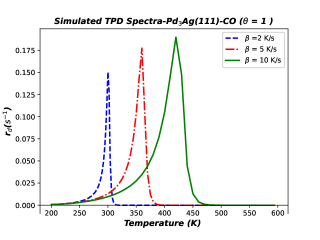
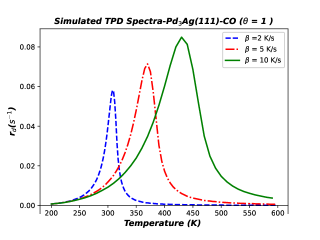
With lateral interaction included, within first order rate concept, the desorption peaks occur at temperatures of = 300 K for = 2 K/s), = 360 K for = 5 K/s, and = 420 K for = 10 K/s (see Fig. 10). The peaks shift to the right (higher temperature) as the heating rate increases. Within the second order rate concept, the lateral interaction included, the desorption peaks occur at temperatures of = 308 K for = 2 K/s, = 370 K for = 5 K/s, and = 430 K for = 10 K/s (see Fig. 11). The peaks shift to the right (higher temperature) as the heating rate increases. Compared to the peaks from first order rate concept, the peaks within the second order rate concept occur at a relatively higher temperatures, by up to 10 K. The width of desorption curves increases for second order process rate compared to that of the first order. The area under the curves is related the amount of desorbed particles.
3.5.2 Simulation of desorption without a lateral interaction
Wherever it applies, 1st 2nd order rate concepts is described in Eq. (4), while the concept of lateral interaction is given in Eq. (5). In this case, the same adsorption energy of hydrogen on Pd3Ag (111), 0.34 eV, is used, but no lateral interaction is used. The output of the corresponding simulation is given in Figs. 12 13.
For a first order desorption rate concept, the desorption peaks occur at temperatures of = 21 K for = 2 K/s, = 26 K for = 5 K/s, and = 31 K for = 10 K/s (see Fig. 12). The peaks shift to the right (higher temperature) as the heating rate increases. With the second order rate concept, the desorption peaks occur temperatures of = 23 K for = 2 K/s = 31 K for = 5 K/s, and = 41 K for = 10 K/s (see Fig. 13). The peaks and temperature of the maximum desorption rate shift to the right (higher temperature) as the heating rate increases. Similar phenomena of such shifts with increased heating rate is also investigated for CO desorption from Cu [36].
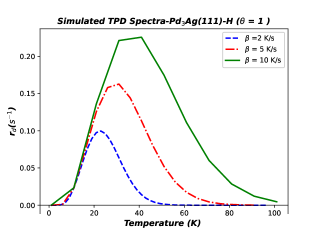
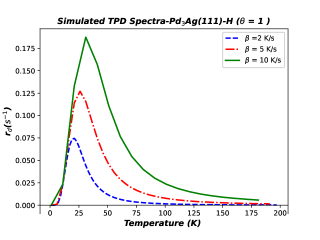
Furthermore, the width of desorption curves increases for second order process rate compared to that of the first order.
3.5.3 Coverage dependence of desorption with a lateral interaction
In the this section, we discuss how the peak temperature depends on adsorbate coverage in the presence of the lateral interaction compare it with literature. With hydrogen adsorbate, the adsorption energy on Pd3Ag (111) is 0.34 eV at adsorbate coverage of 1 ML (1 molecule of adsorbate per a (1) surface unit cell). At adsorbate coverage of 0.5 ML (i.e., corresponding to 1 molecule of adsorbate per a (1) surface unit cell), a lateral interaction of -0.14 eV (taken from paper [24], similar work (adsorption of CO on Pt(111))) is used. The outcome of the simulation is presented in Fig. 14.
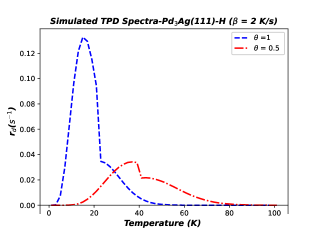
From the Fig. 14, it can be seen that the desorption peak occurs at a temperatures of
= 37 K for = 0.5 ML, and = 15 K for = 1 ML. The temperature of the peak of the desorption rate increases when the coverage change from 1 ML to 0.5 ML.
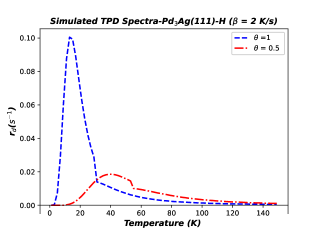
For a second order desorption rate concept, the outcome is presented in Fig. 15. It looks that the desorption peak occurs at temperature of = 40 K for = 0.5 ML, and = 13 K for = 1 ML. The temperature of the desorption peak increases when the coverage changes from 1 ML to 0.5 ML.
With CO adsorbate, the adsorption energy of CO from Pd3Ag (111) at 1 ML is 1.26 eV. Within first order desorption rate, using a lateral interaction of -0.14 eV gives a simulation output presented in Fig. 16.
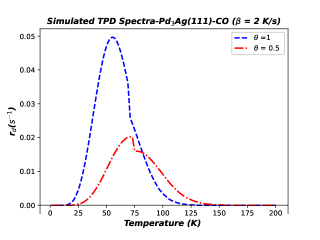
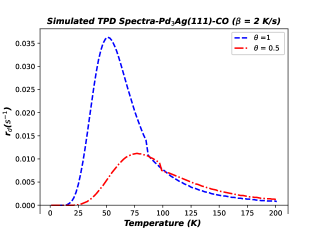
The desorption peak occurs at a temperature of = 72 K for = 0.5 ML, and = 55 K for = 1 ML. The temperature of the desorption peak increases when the coverage changes from 1 ML to 0.5 ML. Within second order desorption rate, the simulation output is presented in Fig. 17. The desorption peak occurs at a temperature of = 77 K for = 0.5 ML, and = 67 K for = 1 ML. The temperature of the maximum desorption peak increases when the coverage change from 1 ML to 0.5 ML. There is a confidence in such shifts of desorption peaks as coverage decreases, since TPD experiments report similar pattern, albeit on different system [24]. However, the temperature values could be possibly improved further by computing for exact value of adsorption energies at coverage of 0.5 ML. It’s value would be expected to be an increased one compared to the 1.26 eV value used in this work.
4 Conclusion
The most favorable adsorptions have adsorption energies in the range [0.02, 0.59] eV for a hydrogen adsorbate at 1 ML adsorbate coverage. With the adsorption of carbonmonoxide, these values are in the range of [0.10, 1.68] eV. The relatively lower adsorption energies of hydrogen
compared to CO could indicate that the
respective ions have better mobility
within the electrolyte. Furthermore, the adsorption energies investigated for CO on Pd3Ag surfaces are desorbable within the PEMFC operating temperature without causing a poisoning effect. Pd3Ag seems to be a preferred structure, compared to PdAg, PdAg3. Furthermore, Pd3Ag (111) is a more favorable as well as reactive surface with the adsorbates at higher fuel supplies, thus, it better represents a typical surface of Pd3Ag alloy. A charge of about 0.16 per hydrogen atom appears to be released to the system for electricity contribution.
The only possible draw back of the model is its having a slightly reduced opportunity of resisting extreme external conditions due to pressure fluctuations, as compared to the Pt-only or Pd-only electrode. The adsorbate species considered in this study can be seen to be part of hydrogen fuel in which case 100 of the hydrogen fuel contains hydrogen species or other fuels such as kerosene, diesel oil, gasoline, benzene, etc, which can contain up to 10-20 carbon and hydrogen components. These realities justify the importance of dealing with hydrogen and CO adsorption, and desorption processes.
The montecarlo simulation of desorption process suggests that desorption peak of carbonmonoxide occurs at relatively higher temperature (ca. 400 K) compared to desorption peak of hydrogen which occurs at 207 K. This indicates a relatively better operation efficiency at low temperatures for a hydrogen fuel as compared to hydrocarbon containing fuels. With the 2nd order rate concept, the peak of the desorption rates shifts to a higher temperature compared to that of the 1st order rate. Furthermore, within a given rate concept, the temperature of the desorption peak shifts to a higher temperature as the adsorbate coverage decreases from = 1 ML to = 0.5 ML. The temperature of the desorption peaks does also seem to increase when heating rate is increased. Such phenomena of increases in desorption temperatures when a heating rate is increased is also investigated for CO desorption from Cu [36].
Furthermore, while assuming 2nd order rate concept, the width of the desorption curves seem to be broadened compared to the width within the 1st order rate concept. The width of the curves is in turn directly proportional to the amount of desorbed particles.
In recommendation for a need area of further studies, the authors commend for a continuous study on this subject which focuses on dealing with transport processes of desorbed ions within the electrolyte of the PEMFC.
Disclosure statement
The authors declare that there is no conflict of interest.
Acknowledgments
We are grateful to the Ministry of Education of Ethiopia for financial support. The authors also acknowledge the Department of Physics at Addis Ababa University and Haramaya University.
References
References
-
[1]
H. C. Ham, J. A. Stephens, G. S. Hwang, J. Han, S. W. Nam, T. H. Lim,
Pd ensemble effects on
oxygen hydrogenation in AuPd alloys: A combined density functional theory
and monte carlo study, Catalysis today 165 (1) (2011) 138.
URL https://doi.org/10.1016/j.cattod.2011.02.006 -
[2]
W. Vielstich, H. A. Gasteiger, H. Yokokawa,
Handbook of fuel cells: advances
in electrocatalysis, materials, diagnostics and durability, Vol. 5, John
Wiley & Sons, 2009.
URL https://doi.org/10.1002/9780470974001 -
[3]
A. Wieckowski, E. R. Savinova, C. G. Vayenas,
Catalysis and electrocatalysis
at nanoparticle surfaces, CRC Press, 2003.
URL https://doi.org/10.1201/9780203912713 -
[4]
P. Weber, D. J. Weber, M. Janssen, M. Werheid, M. Oezaslan,
Carbon supported Pt-Co
Alloy Nanoparticles as HOR and ORR catalyst for PEM fuel cells, in:
ECS Meeting Abstracts, no. 44, IOP Publishing, 2018, p. 1483.
URL https://doi.org/10.1149/ma2018-02/44/1483 -
[5]
E. Antolini, Formation of
carbon-supported PtM alloys for low temperature fuel cells: a review,
Materials chemistry and physics 78 (3) (2003) 563–573.
URL https://doi.org/10.1016/S0254-0584(02)00389-9 -
[6]
Y. Shao, G. Yin, Y. Gao,
Understanding and
approaches for the durability issues of Pt-based catalysts for PEM fuel
cell, Journal of Power Sources 171 (2) (2007) 558–566.
URL https://doi.org/10.1016/j.jpowsour.2007.07.004 -
[7]
X. Yu, S. Ye, Recent
advances in activity and durability enhancement of Pt/C catalytic cathode
in PEMFC: Part I. Physico-chemical and electronic interaction between
Pt and carbon support, and activity enhancement of Pt/C catalyst,
Journal of power sources 172 (1) (2007) 133–144.
URL https://doi.org/10.1016/j.jpowsour.2007.07.049 -
[8]
J. Chen, B. Lim, E. P. Lee, Y. Xia,
Shape-controlled
synthesis of platinum nanocrystals for catalytic and electrocatalytic
applications, Nano Today 4 (1) (2009) 81–95.
URL https://doi.org/10.1016/j.nantod.2008.09.002 -
[9]
Z. Peng, H. Yang, Designer
platinum nanoparticles: control of shape, composition in alloy, nanostructure
and electrocatalytic property, Nano today 4 (2) (2009) 143–164.
URL https://doi.org/10.1016/j.nantod.2008.10.010 -
[10]
Z. Liu, G. S. Jackson, B. W. Eichhorn,
Tuning the CO-tolerance of
Pt-Fe bimetallic nanoparticle electrocatalysts through architectural
control, Energy & Environmental Science 4 (5) (2011) 1900–1903.
URL https://doi.org/10.1039/C1EE01125A - [11] L. Hunt, F. Lever, Availability of the Platinum Metals, Platinum Metals Rev. 13 (4) (1969) 126.
-
[12]
M. Shao, T. Huang, P. Liu, J. Zhang, K. Sasaki, M. Vukmirovic, R. Adzic,
Palladium monolayer and
palladium alloy electrocatalysts for oxygen reduction, Langmuir 22 (25)
(2006) 10409–10415.
URL https://pubs.acs.org/doi/10.1021/la0610553 -
[13]
K. N. Nigussa, A study of
properties of palladium metal as a component of fuel cells, Materials
Research Express 6 (10) (2019) 105540.
URL https://doi.org/10.1088/2053-1591/ab3fd4 -
[14]
Z. M. Salameh, Dynamic
analysis of a stand alone operation of PEM fuel cell system, Journal of
Power and Energy Engineering 2014.
URL http://dx.doi.org/10.4236/jpee.2014.21001 -
[15]
J. Enkovaara, C. Rostgaard, J. J. Mortensen, J. Chen, M. Dułak, L. Ferrighi,
J. Gavnholt, C. Glinsvad, V. Haikola, H. Hansen, et al.,
Electronic structure
calculations with GPAW: a real-space implementation of the projector
augmented-wave method, Journal of Physics: Condensed Matter 22 (25) (2010)
253202.
URL https://doi.org/10.1088/0953-8984/22/25/253202 -
[16]
J. J. Mortensen, L. B. Hansen, K. W. Jacobsen,
Real-space grid
implementation of the projector augmented wave method, Physical Review B
71 (3) (2005) 035109.
URL https://doi.org/10.1103/physrevb.71.035109 -
[17]
P. E. Blöchl, O. Jepsen, O. K. Andersen,
Improved tetrahedron method
for Brillouin-zone integrations, Physical Review B 49 (23) (1994) 16223.
URL https://doi.org/10.1103/physrevb.49.16223 -
[18]
J. P. Perdew, K. Burke, M. Ernzerhof,
Generalized gradient
approximation made simple, Physical review letters 77 (18) (1996) 3865.
URL https://doi.org/10.1103/PhysRevLett.77.3865 -
[19]
H. J. Monkhorst, J. D. Pack,
Special points for
Brillouin-zone integrations, Physical review B 13 (12) (1976) 5188.
URL https://doi.org/10.1103/physrevb.13.5188 -
[20]
H. Schlegel, Optimization of
equilibrium geometries and transition structures, J. Comp. Chem. 3 (1982)
214.
URL https://doi.org/10.1002/jcc.540030212 -
[21]
P. Feynman, Forces in
Molecules, Phys. Rev. 56 (1939) 340.
URL https://doi.org/10.1103/PhysRev.56.340 -
[22]
O. Nielsen, R. Martin,
Quantum-mechanical theory of
stress and force, Phys. Rev. B. 32 (1985) 3780.
URL https://doi.org/10.1103/PhysRevB.32.3780 -
[23]
R. Wentzcovitch, J. Martins,
First principles
molecular dynamics of Li: Test of a new algorithm, Solid State Commun. 78 (1991) 831.
URL https://doi.org/10.1016/0038-1098(91)90629-A -
[24]
S. Raaen, A. Ramstad,
Monte-carlo simulations
of thermal desorption of adsorbed molecules from metal surfaces, Energy 30
(2005) 821.
URL https://doi.org/10.1016/j.energy.2004.03.101 -
[25]
W. W. Meng B, Monte carlo simulations
of temperature programmed desorption spectra, J Chem Phys 100 (7) (1994)
5280.
URL https://doi.org/10.1063/1.467192 -
[26]
A. Alchagirov, J. Perdew, J. Boettger, R. Albers, C. Fiolhais,
Reply to comment on
Energy and pressure versus volume: Equations of state motivated by the
stabilized jellium model, Phys. Rev. B 67 (2003) 026103.
URL https://doi.org/10.1103/PhysRevB.67.026103 -
[27]
F. Murnaghan, The compressibility
of media under extreme pressures, Proc. Natl. Acad. Sci. 30 (1944) 244.
URL https://doi.org/10.1073/pnas.30.9.244 -
[28]
F. Birch, Finite strain isotherm
and velocities for single-crystal and polycrystalline NaCl at high
pressures and 300∘K, J. Geophys. Res. 83 (B3) (1978) 1257.
URL https://doi.org/10.1029/jb083ib03p01257 -
[29]
O. Løvvik, R. Olsen,
Density functional
calculations on hydrogen in palladium-silver alloys, Journal of alloys and
compounds 330 (2002) 332–337.
URL https://doi.org/10.1016/s0925-8388(01)01491-8 -
[30]
B. Coles, The lattice
spacings of nickel-copper and palladium-silver alloys, J Inst Met 84 (1956)
346–348.
URL https://doi.org/10.1016/0022-5088(65)90038-x - [31] C. Kittel, P. McEuen, P. McEuen, Introduction to solid state physics, Vol. 8, Wiley New York, 1996.
-
[32]
J. Chan, R. Hultgren, The
thermodynamic properties of silver + palladium alloys, The Journal of
Chemical Thermodynamics 1 (1) (1969) 45–50.
URL https://doi.org/10.1126/science.155.3765.991-b -
[33]
R. Bader, Atoms in
Molecules: A Quantum Theory, Oxford University Press, New York,
1990.
URL https://doi.org/10.1126/science.252.5012.1566.b -
[34]
W. Tang, E. Sanville, G. Henkelman,
A grid-based Bader
analysis algorithm without lattice bias, J. Phys.: Condens. Matter 21
(2009) 084204.
URL https://doi.org/10.1088/0953-8984/21/8/084204 -
[35]
K. Nigussa,
Application of the
training of density functional theory potentials within machine learning to
adsorptions and reaction paths on platinum surfaces, Materials Chemistry and
Physics 253 (2020) 123407.
URL https://doi.org/10.1016/j.matchemphys.2020.123407 -
[36]
K. Zakeri, A. Dashti, Monte
Carlo Simulation of Temperature-Programmed Desorption CO/Cu (110) and
CO2/Cu (100) systems, Surface Review and Letters 11 (02) (2004)
137–143.
URL https://doi.org/10.1142/S0218625X04006037