The specific angular momentum of disc galaxies and its connection with galaxy morphology, bar structure and disc gravitational instability
Abstract
The specific angular momenta () of stars (), gas (), baryons as a whole () and dark matter haloes () contain clues of vital importance about how galaxies form and evolve. Using one of the largest samples of disc galaxies (S0–BCD) with high-quality rotation curves and near-infrared surface photometry, we perform a detailed comparative analysis of that stretches across a variety of galaxy properties. Our analysis imposes tight constraints on the ‘retained’ fractions of specific angular momentum (, and ), as well as on their systematic trends with mass fraction and galaxy morphology, thus on how well specific angular momentum is conserved in the process of disc galaxy formation and evolution. In particular, one of the most innovative results of our analysis is the finding that galaxies with larger baryon fractions have also retained larger fractions of their specific angular momentum. Furthermore, our analysis demonstrates how challenging it is to characterize barred galaxies from a gravitational instability point of view. This is true not only for the popular Efstathiou, Lake & Negroponte bar instability criterion, which fails to separate barred from non-barred galaxies in about 55% of the cases, but also for the mass-weighted Toomre parameter of atomic gas, , which succeeds in separating barred from non-barred galaxies, but only in a statistical sense.
keywords:
instabilities – galaxies: fundamental parameters – galaxies: haloes – galaxies: ISM – galaxies: kinematics and dynamics – galaxies: stellar content.1 INTRODUCTION
Specific angular momentum, , is one of the most fundamental galaxy properties (see, e.g., Combes 2020; Obreschkow 2020). Today, four decades after the pioneering work of Fall (1983), the scaling relation between stellar specific angular momentum () and stellar mass (), with , has been confirmed and refined in a wide variety of contexts, not only for nearby galaxies (e.g., Romanowsky & Fall 2012; Fall & Romanowsky 2013, 2018; Lapi et al. 2018; Posti et al. 2018) but also for distant galaxies at redshift (e.g., Burkert et al. 2016; Marasco et al. 2019; Sweet et al. 2019; Gillman et al. 2020; Bouché et al. 2021). A similar scaling relation has been found for atomic gas, as well as for stars and atomic gas as a whole: the ‘baryons’ (e.g., Obreschkow & Glazebrook 2014; Murugeshan et al. 2020; Kurapati et al. 2021; Mancera Piña et al. 2021a, b). Indeed, all such relations are remarkably similar to the scaling law predicted by tidal torque theory (e.g., Peebles 1969; Efstathiou & Jones 1979), which is one of the most fundamental relations for dark matter haloes (see, e.g., Cimatti et al. 2020).
The stellar-to-halo and baryonic-to-halo ratios, and , are of great theoretical importance because they measure the fractions of specific angular momentum retained by stars and baryons, i.e. how well specific angular momentum is conserved in the process of galaxy formation and evolution (see, e.g., Cimatti et al. 2020). To get this information, one needs to know , which is not a truly observable galaxy property. Soon after the seminal paper by Romanowsky & Fall (2012), it has become common practice to ‘measure’ via the relation, where can be inferred using a number of different methods (see, e.g., Wechsler & Tinker 2018). Investigations based on this or similar approaches have placed a basic constraint on and : these ratios are typically below unity, the value assumed by classic disc formation models (e.g., Dutton & van den Bosch 2012; Romanowsky & Fall 2012; Kauffmann et al. 2015; Lapi et al. 2018; Mancera Piña et al. 2021a). ‘Biased-collapse’ or ‘inside-out’ models of galaxy formation assume instead that there is a power-law relation between retained fraction of specific angular momentum and mass fraction, but they do not predict the actual slopes of the stellar and baryonic relations (e.g., Dutton & van den Bosch 2012; Romanowsky & Fall 2012). Clearly, and are less constrained than the and relations.
Cosmological simulations have struggled to explain the origins of and . Early work found a catastrophic loss of angular momentum during galaxy assembly, with values of and far below those predicted by classic disc formation models (Navarro & White 1994; Navarro & Steinmetz 2000). This problem has since been alleviated, thanks to a better understanding of feedback from massive stars and active galactic nuclei (see, e.g., Naab & Ostriker 2017). Feedback promotes disc formation by preferentially removing low angular momentum gas from galaxies via outflows (Brook et al. 2011; Übler et al. 2014), as well as by suppressing star formation in the early Universe, when accreting gas was poor in angular momentum (Agertz & Kravtsov 2016; Garrison-Kimmel et al. 2018). Simulations have highlighted that many mechanisms (e.g. inflows, mergers and disc gravitational instabilities) are responsible for shaping the net angular momentum content of galaxies, with no consensus on their respective importance (see, e.g., Lagos et al. 2020).
What makes a quantity of great astrophysical importance is not only its relation to the baryonic and dark matter content of galaxies, but also its connection with galaxy morphology. This was beautifully illustrated by Fall (1983). His fig. 1 shows that ellipticals and spirals form two parallel tracks, and that ellipticals contain less on average than spirals of equal . More recent investigations have generalized these findings to galaxies of various morphological types, and analysed their trend as a function of bulge mass fraction, B/T, or as a function of other morphological proxies, not only in the case of the relation (e.g., Romanowsky & Fall 2012; Cortese et al. 2016; Fall & Romanowsky 2018; Sweet et al. 2018) but also for vs (e.g., Obreschkow & Glazebrook 2014; Kurapati et al. 2021; Mancera Piña et al. 2021a, b). A few investigations also found that early-type galaxies have retained less specific angular momentum than late-type ones (e.g., Romanowsky & Fall 2012; Kauffmann et al. 2015), which places another basic constraint on and .
spreads its ‘tentacles’ even deeper, into one of the engines behind the dynamics of disc galaxies: gravitational instability. Such a connection was discovered in the context of bar instability (Christodoulou et al. 1995; Mo et al. 1998; van den Bosch 1998), hence it also involves an important aspect of galaxy morphology: bar structure. The connection between and disc gravitational instability emerges even in the case of local instabilities, when one explores their disc-averaged impact on galaxy scaling relations and/or galaxy evolution (e.g., Obreschkow & Glazebrook 2014; Obreschkow et al. 2016; Zasov & Zaitseva 2017; Kurapati et al. 2018; Romeo & Mogotsi 2018; Romeo 2020; Romeo et al. 2020). Our work, besides providing fresh insights into popular scaling relations and discovering new ones, has imposed tight constraints on the values of Toomre’s (1964) stability parameter into which disc galaxies evolve (Romeo & Mogotsi 2018; Romeo 2020; Romeo et al. 2020). The most basic result is that is on average well above unity, regardless of which disc component one considers: stars, atomic gas or molecular gas (see fig. 1 of Romeo 2020).
In this paper, we explore and its connection with galaxy morphology, bar structure and disc gravitational instability for disc galaxies of all morphological types, from lenticulars to blue compact dwarfs, thus spanning several orders of magnitude in stellar mass (), atomic gas mass (), baryonic mass () and halo mass (). The rest of the paper is organized as follows. In Sect. 2, we describe the galaxy sample, data and statistics. In Sect. 3, we explore the conservation of specific angular momentum from a phenomenological point of view. We analyse this problem in detail by comparing not only stars and baryons (Sect. 3.1), but also atomic gas and stars (Sect. 3.2), and discuss what physical mechanisms are behind the observed correlations (Sect. 3.3). In Sect. 4, we explore whether barred galaxies are characterized by values of that are systematically different from those of non-barred galaxies, as predicted for instance by popular bar instability criteria. We discuss this issue not only in the context of bar instability (Sect. 4.1), but also in the context of another important galaxy evolution process: the self-regulation of galaxy discs driven by local gravitational instabilities (Sect. 4.2). Finally, in Sect. 5, we draw the conclusions of our work and point out their importance for semi-analytic modelling of galaxy formation and evolution.
2 METHODS
2.1 Galaxy sample
We use a sample of 91 disc galaxies that stretch across all morphological types, from lenticulars to blue compact dwarfs, and span a range of five orders of magnitude in stellar mass () and four orders of magnitude in atomic gas mass (), baryonic mass () and halo mass (). Our sample contains 77 galaxies of type S0–BCD from the ‘Spitzer Photometry and Accurate Rotation Curves’ sample (SPARC; Lelli et al. 2016), and 14 galaxies of type Im from the ‘Local Irregulars That Trace Luminosity Extremes, The H i Nearby Galaxy Survey’ (LITTLE THINGS; Hunter et al. 2012). Like the two parent samples, our galaxy sample is neither statistically complete nor volume-limited, but it is nevertheless representative of the full population of (regularly rotating) nearby late-type galaxies (SPARC), with an emphasis on the faint end of the luminosity function (LITTLE THINGS).
As a data set, our galaxy sample is the intersection of the samples analysed by Romeo et al. (2020) and Mancera Piña et al. (2021a). As such, it is one of the largest samples of galaxies with reliable and quality-assessed measurements of the following quantities, which are of key importance for our analysis: the halo mass, , the stellar mass, , the stellar specific angular momentum, , the mass of atomic hydrogen + helium gas, , and the specific angular momentum of atomic hydrogen + helium gas, .
2.2 Data
and are taken from Posti et al. (2019) for SPARC galaxies, and from Read et al. (2017) for LITTLE THINGS galaxies. In both cases, and were measured via rotation curve decomposition, albeit adopting different halo models and different Bayesian approaches to fit the observed rotation curves. Such measurements compare well with other recent determinations of made using different rotation curve decomposition methods, both in the case of SPARC galaxies (e.g., Li et al. 2020) and in the case of LITTLE THINGS galaxies (e.g., Mancera Piña et al. 2022).
is taken from Posti et al. (2018) for SPARC galaxies, and from Romeo et al. (2020) for LITTLE THINGS galaxies. In the case of SPARC galaxies, was measured via radial integration, imposing a convergence criterion on the cumulative profile and including asymmetric drift corrections (see, e.g., Binney & Tremaine 2008, chap. 4.8.2). In the case of LITTLE THINGS galaxies, was measured adopting a commonly used approximation, , where is the exponential disc scale length and is the velocity along the flat part of the rotation curve (e.g., Romanowsky & Fall 2012). and were taken from Hunter & Elmegreen (2006) and Iorio et al. (2017), respectively. In either case, does not explicitly take into account the specific angular momentum of bars or other non-axisymmetric structures; it only takes into account their azimuthally averaged effect, consistent with all the gravitational instability diagnostics used in this paper.
and are taken from Mancera Piña et al. (2021a) for both SPARC and LITTLE THINGS galaxies. was measured by integrating each H i surface density profile out to the last observed radius, and by including the contribution of helium to the atomic gas mass through a correction factor (1.33). was also measured via radial integration, imposing a convergence criterion on the cumulative profile. By construction, (like ) includes the contribution of bars and other non-axisymmetric structures only in an azimuthally averaged sense, consistent with the assumptions behind the analysis carried out in this paper.
Note that all such measurements are based on high-quality rotation curves that were derived from the same type of data (H i interferometric observations) using consistent techniques (tilted ring models). Therefore we do not expect any significant bias. Using such measurements, we compute the baryonic mass, , and the baryonic specific angular momentum, , as
| (1) |
| (2) |
We neglect the contribution of molecular gas because it is relatively small (e.g., Mancera Piña et al. 2021b), and because CO data are not available for most galaxies of our sample (e.g., Hunter et al. 2012; Lelli et al. 2016).
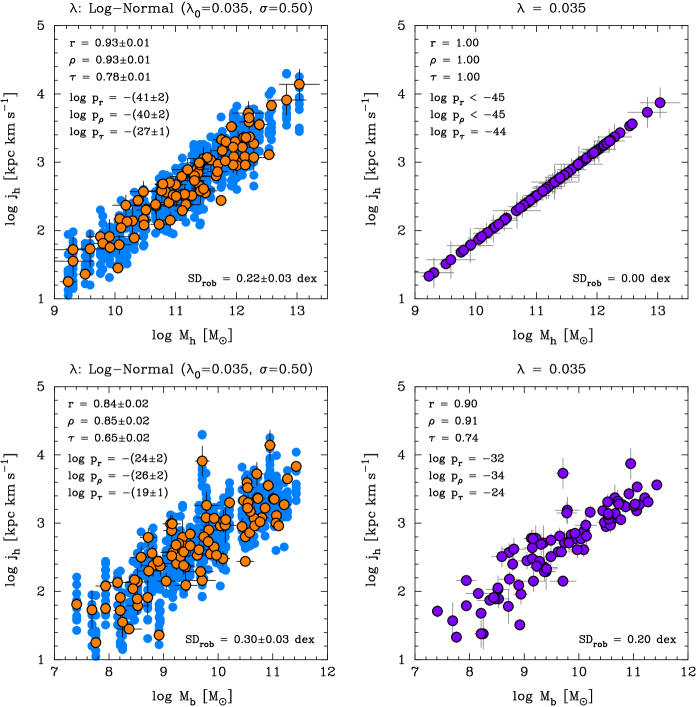
Another quantity that is of key importance for our analysis is the halo specific angular momentum, . Since this is not a truly observable galaxy property, it is common practice to ‘measure’ via the relation , where is the halo spin parameter (e.g., Romanowsky & Fall 2012; Obreschkow & Glazebrook 2014; Lapi et al. 2018; Okamura et al. 2018). This is motivated by the fact that, in contrast to itself, has been tightly constrained by CDM simulations. In fact, is well characterized by a log-normal probability distribution,
| (3) |
whose median and width (0.22 dex) do not depend significantly on halo mass, redshift, environment or cosmology (e.g., Bullock et al. 2001; Macciò et al. 2007, 2008; Rodríguez-Puebla et al. 2016; Zjupa & Springel 2017). In view of this fact, we too measure via the relation, which is fully specified by Eq. (3) and the following equations:
| (4) |
| (5) |
| (6) |
Here is the halo spin parameter redefined by Bullock et al. (2001) that we have discussed above, and are the halo virial radius and velocity (see, e.g., Cimatti et al. 2020), is the critical overdensity for virialization, is the Hubble constant, and is the gravitational constant. More specifically, we set (Planck Collaboration VI 2020) and in Eq. (5), and (0.22 dex) in Eq. (3), and make use of this equation to randomly generate one value of for each galaxy of our sample. We then compute from Eq. (4).
Our approach departs from the common practice of using the same value of for all the galaxies of the sample (), so we have tested it in Appendix B. Our test demonstrates that varying the random realization of has a weak () effect on the results, whereas suppressing the natural variance of artificially constrains the correlations between and other fundamental galaxy properties like and (see Fig. B1).
In addition to the key quantities specified above, we need to quantify the morphological type of each galaxy, and to know whether a galaxy is barred or non-barred. The morphological type is taken from Lelli et al. (2016) for SPARC galaxies and from Hunter et al. (2012) for LITTLE THINGS galaxies. Information about the presence/absence of a bar is missing from the two references above. Therefore we extract it from HyperLeda (Makarov et al. 2014), and classify the galaxies of our sample as ‘barred’ (43%) or ‘non-barred’ (47%) on the basis of works referenced in that database, most notably: (i) the ‘Third Reference Catalogue of Bright Galaxies’ (RC3; de Vaucouleurs et al. 1991), which is the primary frame of reference for morphological classification of galaxies; and (ii) the ‘Galaxy Zoo 2’ (GZ2; Willett et al. 2013), which is a citizen science project with morphological classifications of more than 300 000 galaxies drawn from the Sloan Digital Sky Survey (SDSS). For some galaxies no consensus has been reached, so we classify them as ‘uncertain’ (10%). The fractions of barred and non-barred galaxies that characterize our sample are consistent with those found by Géron et al. (2021) using the newest version of Galaxy Zoo, and with their finding that there is a continuum of bar types, which varies from ‘weakest’ to ‘strongest’.111It is worth mentioning that all current methods of bar detection are subject to several observational effects difficult to quantify (bandpass, spatial resolution, imaging depth, etc.), and that there is an ongoing effort to evaluate and minimize such effects (e.g., Willett et al. 2013; Consolandi 2016; Abraham et al. 2018; Géron et al. 2021).
2.3 Statistics
To extract reliable information from our data, we use a variety of statistical diagnostics, in particular several robust statistics. These are especially useful when the data are few or contain a significant fraction of outliers, or even when the data deviate significantly from a normal distribution (see, e.g., Rousseeuw 1991; Press et al. 1992, chap. 15.7). Two eloquent examples of robust statistics are the median and the median absolute deviation (MAD), which provide reliable estimates of the ‘central value’ and the ‘width’ of a data set even when almost 50% of the data are outliers, contrary to the mean and the standard deviation. Another example of robust statistical methods is fitting a line to a set of data points by minimizing their average absolute deviation from the line, a problem that is solved by computing the median of the deviations (see pp. 698–700 of Press et al. 1992). If the data contain outliers, which is almost always the case, then such ‘robust median-based’ fitting provides more reliable results than linear least-squares fitting (see fig. 15.7.1 of Press et al. 1992, and figs 3–7 of Rousseeuw 1991). Robust statistics are used not only in the statistical description and modelling of scientific data (see, e.g., Feigelson & Babu 2012) but also in data processing, where they are an integral part of widespread techniques like Kalman filtering, median filtering and wavelet-based denoising (see, e.g., Romeo 2021).
In this paper, we model the data using robust median-based fits (subroutine medfit.f from Press et al. 1992), and measure the dispersion of the data points around the model using a robust estimator of the scatter:
| (7) |
where is the robust counterpart of the standard deviation (see, e.g., Müller 2000). Values of that are much less than the dynamic range of the data mean a tight relation. When it is needed, we decompose the robust standard deviation from the model into ‘bias’ (median offset from the model) and ‘variance’ (robust standard deviation from the median trend), and estimate the uncertainty in the median as follows:
| (8) |
where is the robust counterpart of the standard error and is the number of data points (see again Müller 2000).
When median-based descriptors are not available, we present the results of several statistical measures and associated tests. In particular, we measure the correlation strength and significance of galaxy properties using Pearson’s , Spearman’s and Kendall’s correlation coefficients, together with their significance levels , and (subroutines pearsn.f, spear.f and kendl1.f from Press et al. 1992). Values of and mean a strong and significant (anti)correlation.
Note that the statistics described above do not take measurement uncertainties into account. This has nothing to do with the code used to compute such statistics. It is a characteristic of all sample statistics, robust or not (see, e.g., Feigelson & Babu 2012). Note also that while robust median-based fitting provides reliable estimates of the slope and the intercept of the best-fitting line, , it does not provide their uncertainties. We supplement such information with reliable results from linear least-squares fitting, although this is not as easy as it may seem. Our first attempt was to use the popular subroutine fitexy.f from Press et al. (1992), which takes measurement uncertainties into account and returns uncertainties in and . Using the data described in Sect. 2.2 as input, fitexy.f produces fits with output values of , the number of degrees of freedom (), and output values of the goodness-of-fit probability . Such values mean that those fits are poor and, in particular, that the uncertainties in and are unreliable (see chaps 15.1–15.3 of Press et al. 1992). In view of that, we decided to use another subroutine from Press et al. (1992), fit.f with on input, which redefines the uncertainties in and so that and returns reliable uncertainties in and .
In Sects 3 and 4, we will provide all such statistical information mainly in summary form and simplified notation. In particular, we will report the correlation strength of any two galaxy properties as , where and are the values of the smallest and largest correlation coefficients (, and ). In addition, we will report their correlation significance as , where is the order of magnitude of the significance levels (, and ).
3 CONSERVED, OR NOT CONSERVED, THAT IS THE QUESTION
As discussed in Sect. 1, is one of the most fundamental galaxy properties. Furthermore, and are of great theoretical importance because they measure the fractions of specific angular momentum retained by stars and baryons, i.e. how well specific angular momentum is conserved in the process of galaxy formation and evolution. The galaxy sample described in Sect. 2 is especially appropriate for exploring this problem, thanks to the high quality and wide dynamic range of the data. In this section, we explore the conservation of specific angular momentum from such a phenomenological point of view, and highlight the novelty of our results. In particular, we show that there are important differences between stars and baryons (Sect. 3.1), and even more between atomic gas and stars (Sect. 3.2). Finally, we discuss what physical mechanisms are behind the observed correlations (Sect. 3.3).
3.1 Stars versus baryons
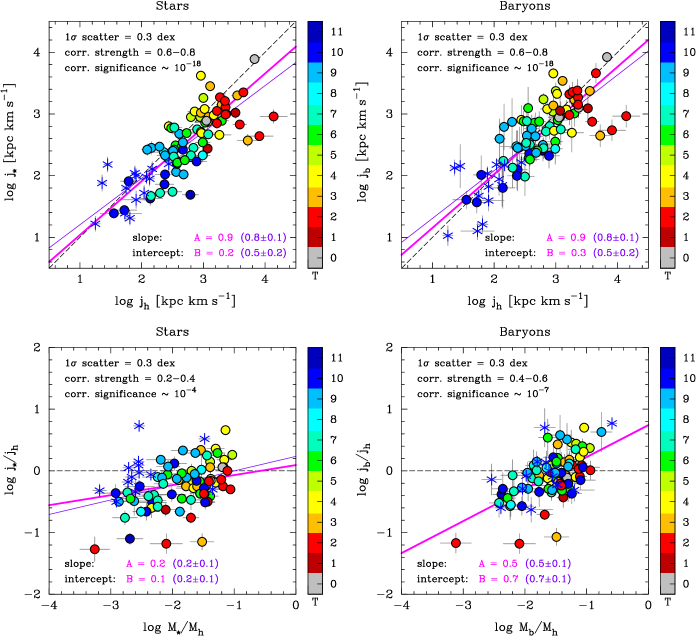
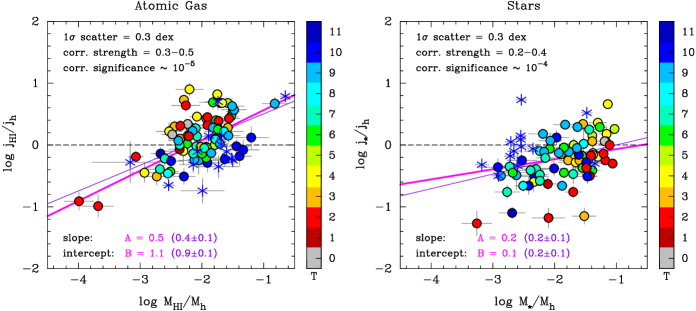
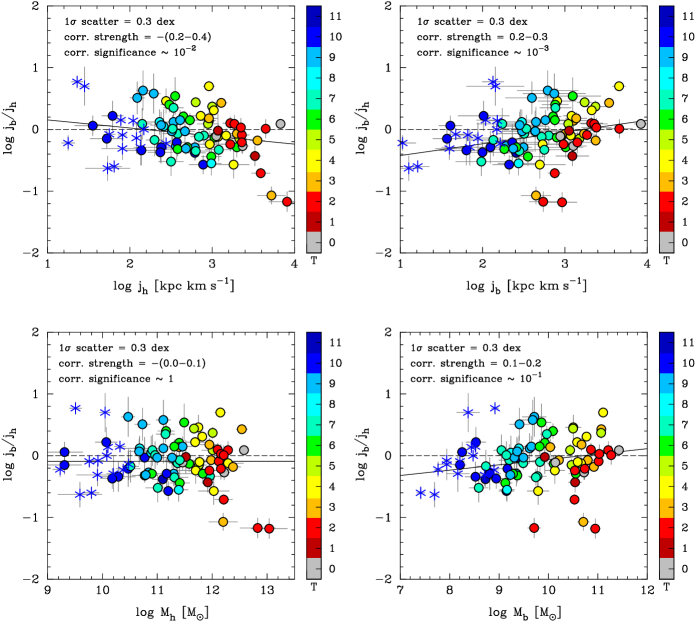
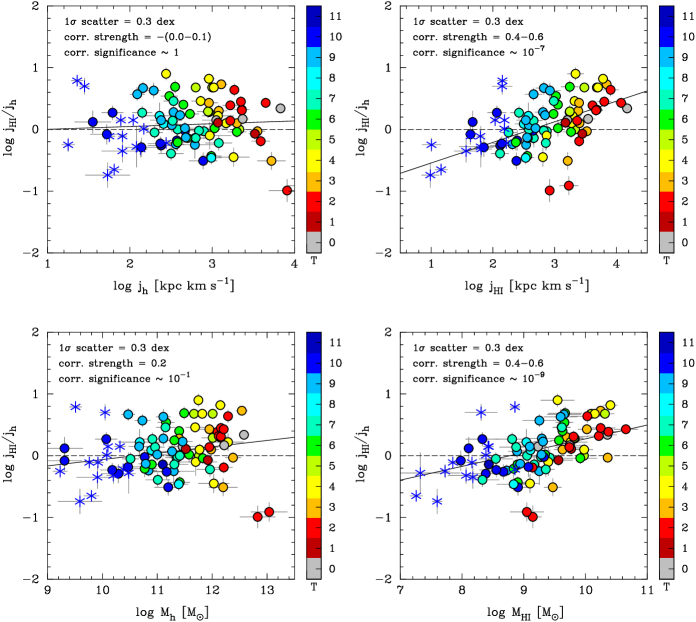
Fig. 1 shows basic scaling relations between , and (top panels), as well as the strongest and most significant correlations between , and other galaxy properties (bottom panels). Each panel also shows a robust median-based fit to the data points (thick solid line), a linear least-squares fit (thin solid line), the locus of points where specific angular momentum is conserved (dashed line), as well as the results of various statistical diagnostics (see Sect. 2.3 for more information about the statistics and, in particular, about the fitting methods). The top panels of Fig. 1 illustrate that and are tightly related to , and that the two relations have similar logarithmic slopes, , and intercepts, . So specific angular momentum is approximately conserved in a statistical sense. But how good is this approximation? And are the retained fractions of specific angular momentum subject to systematic effects? The bottom panels of Fig. 1 provide explicit answers to these questions, as pointed out below.
-
1.
How well is specific angular momentum conserved in a statistical sense? It depends on whether we consider the baryons or only the stars. In fact, while in both cases the distribution of data points is offset towards negative logarithmic values, the median of () is well above the median of (). Hence, on average, specific angular momentum is conserved to better than 20% for baryons and to within 40% for stars. Note that such estimates are fully meaningful, regardless of how strongly or significantly the retained fractions of specific angular momentum correlate with other galaxy properties. This is because the probability distributions of and are clearly unimodal and more peaked than a Gaussian (see Fig. A1 for detailed statistical information), and because the median is a robust estimator of the central value of a distribution if this has a strong central tendency (see chap. 14.1 of Press et al. 1992).
-
2.
Are the retained fractions of specific angular momentum subject to systematic effects? Yes, they are, especially the baryonic one. There is in fact a moderately strong (e.g. ) but very significant () correlation between and . The stellar counterpart of this correlation, vs , is also significant () although weaker (). Thus the retained fractions of specific angular momentum do depend systematically on the galaxy formation and star formation efficiencies, and vary on average as and . Both robust median-based fitting and linear least-squares fitting yield the same systematic dependence on mass fraction, at least within the parameter uncertainties.
Previous investigations focused on either (e.g., Romanowsky & Fall 2012; Lapi et al. 2018) or (e.g., Dutton & van den Bosch 2012; Mancera Piña et al. 2021a), and found similar results: , nearly independent of or ; , nearly independent of or .
Our comparative analysis has instead revealed noteworthy and previously undetected differences between and . Note, in particular, that it is highly non-trivial to detect and differentiate the systematic effects pointed out above (item ii). It requires not only high-quality data with a wide dynamic range, but also a detailed comparative analysis that stretches across a variety of galaxy properties. In fact, and do not show any particularly significant () correlation with basic properties like , or their baryonic/stellar counterparts (see Figs A2 and A3). Note also that the baryonic and stellar scaling relations pointed out above (item ii) are basically consistent with ‘inside-out’ or ‘biased-collapse’ models of galaxy formation (e.g., Dutton & van den Bosch 2012; Romanowsky & Fall 2012). In other words, those models assume that there is a power-law relation between retained fraction of specific angular momentum and mass fraction, but they do not predict the actual slopes of the baryonic and stellar relations, which most likely result from the galaxy evolution processes involved in the gas-star cycle.
3.2 Atomic gas versus stars
To further understand how well specific angular momentum is conserved in the process of galaxy formation and evolution, let us finally turn our attention to atomic gas and analyse .
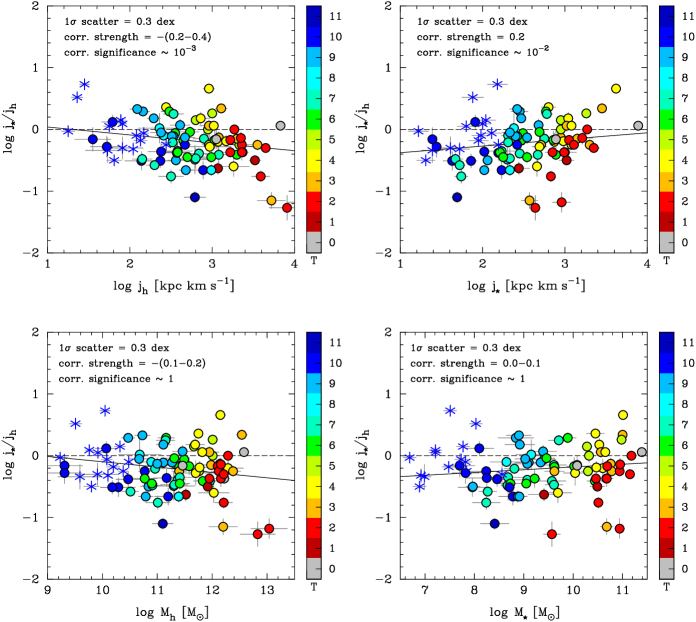
Fig. 2 shows vs face to face with its stellar counterpart. The main results of our comparative analysis are pointed out below.
-
1.
Basic constraints. The most striking result is that atomic gas has actually gained more specific angular momentum than the host dark matter halo. The median of () is in fact well above unity, and indeed twice as large as the median of . Such estimates are meaningful because the probability distribution of has a strong central tendency, although not as strong as the one shown by stars (see Fig. A1 for detailed statistical information).
-
2.
Systematic trends. Concerning the relation between ‘retained’ fraction of specific angular momentum and mass fraction, atomic gas shows a steeper scaling than stars, , and a slightly higher degree of correlation (e.g. and ). Note also that the two relations show opposite residual trends with galaxy morphology. For instance, early-type galaxies tend to cluster above (below) the best-fitting relation found for atomic gas (stars), hence they tend to have higher (lower ) than predicted. This tendency is reversed for late-type galaxies. It is most likely because of such opposite residual trends that baryons show a higher degree of correlation than stars and atomic gas. In fact, is the mass-weighted average of and (see Eq. 2), which tends to cancel out opposite trends.
Our result (i) is consistent with two results from cosmological simulations of galaxy formation, namely that accreting gas has higher specific angular momentum than the dark matter halo (Kimm et al. 2011; Stewart et al. 2013), and that gas in galaxy discs tends to have higher specific angular momentum than stars (Teklu et al. 2015; Agertz & Kravtsov 2016; El-Badry et al. 2018). Our finding that is also consistent with a result previously found by Mancera Piña et al. (2021b), namely that . Those authors showed that is in fact independent of , and that its value regulates the slopes of the relations between , and gas fraction.
As regards the relations between retained fraction of specific angular momentum and basic galaxy properties, atomic gas and stars show similarities as well as significant differences (cf. Figs A4 and A3, respectively). On the one hand, does not correlate with or , like . On the other hand, has a moderately high degree of correlation with and , while is uncorrelated with or .
3.3 What physical mechanisms are behind the observed correlations?
One of the most innovative results of our analysis is the finding that galaxies with larger baryon fractions have also retained larger fractions of their specific angular momentum (see Sects 3.1 and 3.2). In this section, we discuss what physical mechanisms are behind the observed correlations (bottom panels of Fig. 1, and Fig. 2).
Indeed, such correlations impose important constraints on the physics governing the galactic outflow-accretion cycle across galaxy masses. Dutton & van den Bosch (2012) argued that the empirical scaling relations between , and require three ingredients: (i) galactic outflows, driven by stellar and/or AGN feedback; (ii) angular momentum transfer from accreting gas to the dark matter halo, driven by dynamical friction; and, most importantly, (iii) that the efficiency of angular momentum loss decreases with increasing halo mass. State-of-the-art cosmological simulations of galaxy formation are providing valuable insights into the angular momentum of accreting gas. Hafen et al. (2022) show that the circumgalactic medium (CGM) inside massive haloes () tends to be virialized, as the cooling time is longer than the dynamical time. This causes gas to accrete via hot rotating flows, which feed the outer regions of disc galaxies by transferring angular momentum that is often aligned with the angular momentum of the disc (see also Trapp et al. 2022). Hafen et al. (2022) also show that the CGM inside lower-mass haloes () is less, or not at all, virialized. This causes the angular momentum of accreting gas to be often misaligned with that of the disc. Since accreting gas transfers angular momentum to both the disc and the dark matter halo, the two findings above suggest that the efficiency with which angular momentum is transferred to the halo decreases with increasing halo mass, and so does the efficiency of angular momentum loss. The two findings above are therefore in qualitative agreement with the theoretical arguments of Dutton & van den Bosch (2012), as well as with our observed correlations.
4 BARRED VERSUS NON-BARRED GALAXIES
In this section, we explore the connection between the specific angular momentum of disc galaxies, bar structure and disc gravitational instability. The core of the problem is whether barred galaxies are characterized by values of that are systematically different from those of non-barred galaxies, as predicted for instance by popular bar instability criteria. Below we discuss this issue not only in the context of bar instability (Sects 4.1.1–4.1.3), but also in the context of another important galaxy evolution process: the self-regulation of galaxy discs driven by local gravitational instabilities (Sects 4.2.1–4.2.2).
4.1 Observational test of the Efstathiou, Lake & Negroponte (1982) bar instability criterion
4.1.1 Overview
A decade after the pioneering work of Ostriker & Peebles (1973), Efstathiou et al. (1982) formulated a simple bar instability criterion in terms of observable galaxy properties (hereafter ELN criterion):
| (9) |
where is the maximum rotation velocity, is the mass of the disc, and is the exponential disc scale length. The instability threshold is for stellar discs (Efstathiou et al. 1982) and for gas discs (Christodoulou et al. 1995), but it is common to approximate these thresholds more simply as . Mo et al. (1998) and van den Bosch (1998) did so, and used a detailed disc formation model to reformulate the ELN criterion in terms of more fundamental galaxy properties: the disc mass fraction, , and the disc spin parameter, , i.e. the halo spin parameter () times the fraction of specific angular momentum retained by the disc (). The resulting bar instability condition is more elaborate than Eq. (9), but Mo et al. (1998) showed that such a condition depends weakly on the disc-halo model and is well approximated by a simple formula:
| (10) |
here expressed in explicit form using our notation.222Deriving Eq. (10) from Eq. (9) is a complex procedure, which involves several steps of the disc-halo modelling and several approximations of the model parameters. The interested reader is referred to sects 2.2, 2.3 and 3.2 of Mo et al. (1998) for detailed information. Such a criterion predicts that a disc galaxy is bar unstable if and only if the disc spin parameter is lower than the disc mass fraction. This means that if one disregards the galaxy evolution processes that follow the formation of a bar, as is commonly done when comparing the predictions of bar instability criteria with observations, then barred galaxies should all be gravitationally unstable and characterized by values of that are systematically lower than those of non-barred galaxies (for a given and a given ).
Athanassoula (2008) pointed out two major limitations of the ELN criterion, and illustrated them with eloquent simulation tests. First of all, the ELN criterion is based on 2D simulations so it does not take into account the interaction between disc and halo, which has a strong destabilizing impact. Secondly, the ELN criterion does not properly take into account the disc velocity dispersion or the central concentration of the halo, either of which has a stabilizing effect. Indeed, the disc velocity dispersion, , is one of the quantities that most radically affect the onset of gravitational instabilities in galaxy discs, and the quantity that was most drastically modelled in early (2D) simulations. This concerns not only , which gives vertical structure to the disc and plays an important stabilizing role (Vandervoort 1970; Romeo 1992, 1994), but also , whose stabilizing role can be critically impacted by low force resolution (Romeo 1994, 1997, 1998a,b). Note also that is an important parameter for the evolution of a bar: values of cause the bending instability (buckling of the bar), which also causes the formation of boxy/peanut structures (see Rodionov & Sotnikova 2013 for a recent overview and detailed analysis). All that is not (properly) taken into account by the ELN criterion.
Athanassoula (2008) also mentioned another limitation of the ELN criterion, namely that it does not take into account the multi-component nature of galaxy discs. In other words, the fact that Eqs (9) and (10) are valid for discs made of either stars or gas does not mean that they can be applied to discs made of both stars and gas, as is commonly done.333This is one of the lessons learned in the context of local disc gravitational instabilities. Look for instance at fig. 5 of Romeo & Wiegert (2011), and see how dramatically the gas parameter misrepresents the actual stability level of nearby star-forming spirals. In fact, zoom-in cosmological simulations show that high gas fractions tend to dissolve bars (Kraljic et al. 2012).
Sellwood (2016) carried out further simulation tests that illustrated, once again, the importance of disc-halo interaction for bar instability, thus the inadequacy of the ELN criterion (see also Berrier & Sellwood 2016).
In spite of such criticisms, the ELN criterion is used by all current semi-analytic models of galaxy formation and evolution to ‘create’ bulges in disc galaxies that are predicted to be bar unstable (see sect. 1 of Devergne et al. 2020 for an overview). Indeed, the popularity of the ELN criterion originates not only from its simplicity, but also from the belief that its inaccuracy is ‘likely to be’ negligible in comparison with other uncertainties of the modelling, for example the mass of the bulge formed by bar instability (see again sect. 1 of Devergne et al. 2020).
4.1.2 How accurate is the ELN criterion from a statistical point of view?
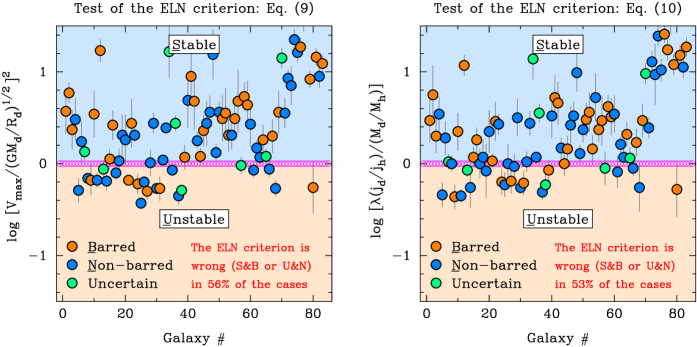
This is a crucial question that naturally arises from the discussion above. To answer this question, we test the ELN criterion observationally making use of Eq. (10). To the best of our knowledge, this is the first observational test performed on the ELN criterion; and it is statistically unbiased, given that the fractions of barred and non-barred galaxies that characterize our sample are consistent with those found by Géron et al. (2021) using the newest version of Galaxy Zoo (see Sect. 2.2 for more information). We make use of Eq. (10), rather than Eq. (9), because it naturally connects with the analysis carried out in Sect. 3. To perform such a test, we disregard the galaxy evolution processes that follow the formation of a bar, as is commonly done when comparing the predictions of bar instability criteria with observations (e.g., Efstathiou et al. 1982; Mo et al. 1998; van den Bosch 1998; Okamura et al. 2018; Kataria et al. 2020).
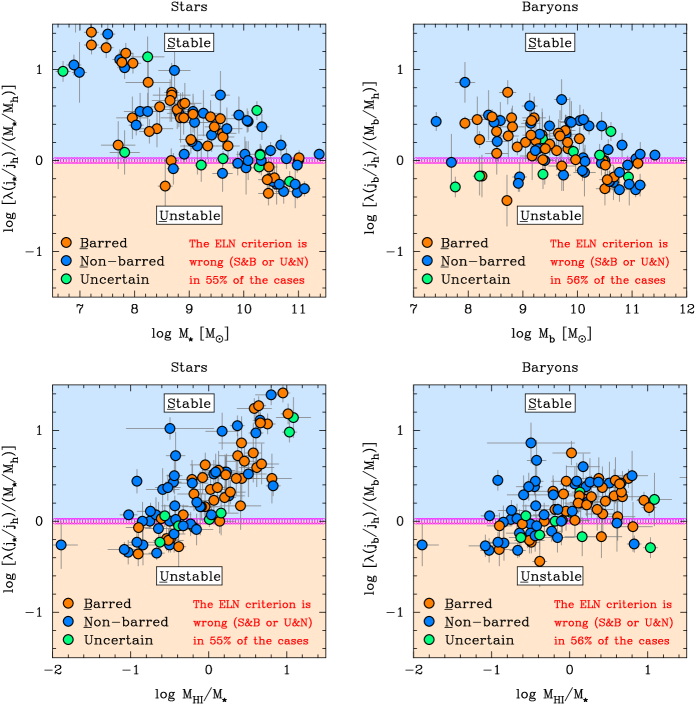
Fig. 3 illustrates our test for two popular implementations of the ELN criterion: one focusing on the stellar disc (left panels), and the other including the whole baryonic disc (right panels).444Remember from Sect. 2.2 that CO data are not available for most galaxies of our sample, so what we call ‘baryons’ are stars and atomic gas. To neglect molecular gas may seem an oversimplification because bars can host large amounts of such gas (e.g., Renaud et al. 2015). But remember also that the ELN criterion is a global bar instability condition, which concerns the disc as a whole, and that the contribution of molecular gas to and is relatively small (e.g., Mancera Piña et al. 2021b). In each case, the ELN parameter is shown as a function of mass (top) and gas mass fraction (bottom). The main results of our comparative analysis are pointed out below.
-
1.
Overall accuracy. If the ELN criterion was reliable, then the light orange/azure region would be almost entirely populated by the orange/azure data points. Clearly, this is not the case in any of the panels. Indeed, barred and non-barred galaxies are mixed across the entire range of values spanned by . This is a fundamental limitation of the ELN criterion, which one cannot overcome by shifting the instability threshold up or down. To measure how inaccurate the ELN criterion is, we count how many galaxies fall within the ‘wrong’ regime: ‘stable and barred’, or ‘unstable and non-barred’. This happens in about 55% of the cases, regardless of the implementation. In simple words, the ELN criterion has a fifty-fifty chance of being right or wrong. This is not an artefact of using the ELN criterion reformulated by Mo et al. (1998), rather than the original ELN criterion itself: Eqs (9) and (10) are almost indistinguishable from a statistical point of view (see Fig. B2). A further additional test shows that applying the ELN criterion to the atomic gas disc does not improve its accuracy with respect to the popular stellar-disc implementation (see Fig. B3). Thus the overall inaccuracy of the ELN criterion is a robust result demonstrated by a detailed comparative analysis.
-
2.
Systematic trends. When the ELN criterion is applied to the stellar disc (see the left panels of Fig. 3), there are clear systematic trends with stellar mass and gas mass fraction across the entire ranges of values spanned by and . As a result of such trends, the ELN parameter is typically above unity for or , and can be as high as 10 or more for or . When instead the ELN criterion is applied to the baryonic disc (see now the right panels of Fig. 3), the trends are more moderate than in the previous case, but the ELN parameter is still typically above unity for or . Thus the ELN criterion tends to overpredict how bar stable disc galaxies are, especially in the case of low-mass gas-rich spirals and dwarfs. Such a tendency is exacerbated when one uses the popular stellar-disc implementation of the ELN criterion.
Our result (i) seems to be at odds with a recent result found by Izquierdo-Villalba et al. (2022) using the IllustrisTNG simulations, namely that the ELN criterion successfully identifies of the strongly barred galaxies and of the non-barred ones. Note, however, that their result concerns Milky Way–type galaxies of stellar mass , and that the ELN criterion is less inaccurate for than at lower stellar masses (see the top-left panel of Fig. 3, and item ii). The inaccuracy of the ELN criterion at low stellar masses was already suspected by Irodotou et al. (2019) and Izquierdo-Villalba et al. (2019) in the context of semi-analytic modelling (‘L-Galaxies’ model), and it was one of the motivations for introducing improved versions of the ELN criterion (Irodotou et al. 2019).
Our result (ii) not only demonstrates the inaccuracy of the ELN criterion at low () or high and shows that it is caused by the systematic trends of the ELN parameter, but also suggests how one could improve the accuracy of the ELN criterion: by fitting such trends and subtracting the best-fitting relations from the ELN parameter. We will not do that because there would still be residual mixing of barred and non-barred galaxies, as is clear from Fig. 3, and because we do not believe that the complex phenomenology of bars in disc galaxies can be encapsulated into a simple analytical criterion.
4.1.3 A final comment on the complexity of the problem
Now that we have highlighted the strength of our results, let us finally remember their weakness. As mentioned in Sect. 4.1.2, we have disregarded the galaxy evolution processes that follow the formation of a bar, as is commonly done when comparing the predictions of bar instability criteria with observations (e.g., Efstathiou et al. 1982; Mo et al. 1998; van den Bosch 1998; Okamura et al. 2018; Kataria et al. 2020). This could lead to incorrect results. For example, a galaxy could be unstable to bar formation according to the ELN criterion but become stable after the bar has formed, as a result of complex galaxy evolution processes such as the redistribution of mass driven by the transfer of angular momentum from the bar to the outer disc and the halo (see, e.g., Gadotti 2009; Combes 2011; Athanassoula 2013; Kormendy 2013). The influence of such processes on bar instability is a highly non-trivial aspect of the problem, whose solution will demand painstaking comparative analyses of observed and simulated galaxies, considering that there is still tension between observations and simulations as regards the evolution of basic bar properties (e.g., Kim et al. 2021; Roshan et al. 2021; Lee et al. 2022).
4.2 Self-regulation of galaxy discs driven by local gravitational instabilities
4.2.1 Overview
Pioneering simulation work on spiral structure in galaxies predicted that galaxy discs self-regulate to stability levels that are not far from the critical threshold predicted by Toomre (1964), , and that such a process is driven by local gravitational instabilities, gas dissipation and other sources of dynamical heating/cooling (e.g., Miller et al. 1970; Hohl 1971; Sellwood & Carlberg 1984; Carlberg & Sellwood 1985). Today, several decades after such work, the self-regulation of galaxy discs is still a hot topic. On the one hand, there have been significant advances in our understanding of the complex interplay between the heating and cooling processes that lead to self-regulation (e.g., Bertin & Romeo 1988; Romeo 1990; Cacciato et al. 2012; Forbes et al. 2012, 2014; Goldbaum et al. 2015; Krumholz et al. 2018). On the other hand, there is not yet a broad understanding of how self-regulated galaxy discs are. For instance, several star formation models postulate the existence of a self-regulation process that keeps gas close to marginal stability, i.e. they assume that (see sect. 1 of Krumholz et al. 2018 for an overview). This is in sharp contrast to the observed radial distribution of in galaxy discs, which is remarkably unconstrained (Leroy et al. 2008; Romeo & Wiegert 2011).
To assess how self-regulated galaxy discs are, one must take into account their multi-component nature and their vertical structure. This can be done, easily and accurately, by making use of the Romeo & Falstad (2013) stability parameter. Romeo & Mogotsi (2017, 2018) did so and, in spite of using different galaxy samples and different statistical methods, they found a similar result: , with a scatter of 0.2 dex. This means that galaxy discs are well self-regulated. Indeed, the radial distribution of is remarkably flat up to galactocentric distances as large as the optical radius, and its median value ( 2) is consistent with the destabilizing effects of non-axisymmetric perturbations and gas dissipation (see fig. 3 and sect. 3 of Romeo & Mogotsi 2017). Similar results have been found using state-of-the-art simulations of disc galaxy evolution (Renaud et al. 2021; Ejdetjärn et al. 2022).
To further understand how self-regulated galaxy discs are, one should analyse in detail the building blocks of , i.e. the parameters of stars, atomic gas and molecular gas: . Romeo (2020) did so and showed that the radial distribution of changes dramatically not only from stars to gas, but also between the atomic and molecular gas phases (see his fig. 1). He also analysed the mass-weighted average of over the disc, , and found that the median of over the galaxy sample is 2–3 for stars and 10 for atomic/molecular gas, while the scatter is 0.2 dex for all the components. This means that, despite the diverse phenomenology of , galaxy discs are so well self-regulated that each disc component has its own characteristic value of . Indeed, this is true for disc galaxies of all morphological types, from lenticulars to blue compact dwarfs, at least if one considers their stellar and atomic gas components (see fig. 2 of Romeo et al. 2020 and fig. 4 of Romeo 2020, respectively).
Finally, note that there is a relation between and the ELN parameter: (Romeo & Mogotsi 2018). Hence can be regarded as an improved version of that takes into account the disc velocity dispersion, which is an important ingredient missing from (Athanassoula 2008). Note also that can easily be corrected so as to take into account the vertical structure of the disc (Romeo & Mogotsi 2018), but that correction cancels out in the final results (Romeo 2020).
4.2.2 Do bars have any impact on or ?
An aspect of the angular momentum problem that connects bar structure in galaxies with the self-regulation of galaxy discs concerns the impact that bars may have on the characteristic values of discussed above. This clearly deserves to be explored, since bars are well-known drivers of secular evolution in disc galaxies (see, e.g., Gadotti 2009; Combes 2011; Athanassoula 2013; Kormendy 2013). In fact, bars are not rigid structures that possess a fixed amount of energy and angular momentum. Bars are complex adaptive systems that grow and sustain themselves at the expense of the gravitational potential energy of the galaxy, and that transfer angular momentum to the outer disc and to the halo during the whole process of bar formation and evolution. Spiral arms also transfer angular momentum to the outer disc, but they do it less efficiently than bars (see references above).
Our analysis is based on Romeo’s (2020) key equation, which naturally connects with the analysis carried out in previous sections:
| (11) |
This a tight statistical relation between mass (), specific angular momentum () and velocity dispersion () for each baryonic component in the disc plus bulge: stars (), atomic hydrogen + helium gas () and molecular hydrogen + helium gas (). To make good use of Eq. (11), one needs to understand two key points:
-
•
is a normalized proxy for , which itself is more difficult to evaluate accurately and approximate analytically. The normalization is such that corresponds to , and . These values are parameter-free theoretical predictions that have an expected accuracy of about 0.2 dex (see sect. 2 of Romeo 2020). We will make use of such predictions when presenting the results of our analysis, so as to translate from into .
-
•
is the radial velocity dispersion of component , , properly averaged and rescaled. This quantity can be evaluated using two alternative equations, depending on whether there are reliable measurements available or not. Unfortunately, such measurements are highly non-trivial (e.g., Ianjamasimanana et al. 2017; Marchuk & Sotnikova 2017), hence very sparse (e.g., Romeo & Mogotsi 2017; Mogotsi & Romeo 2019). Therefore, if one wants to analyse a large galaxy sample, then the appropriate equation to use is
(12) Note that these are not observationally motivated values of the stellar and gas velocity dispersions, but rigorously derived values of the velocity dispersion–based quantity (see sect. 2 of Romeo 2020). Our analysis is based on both Eq. (11) and Eq. (12).
Eq. (11), when combined with Eq. (12), shows a statistical scatter of about 0.2 dex (Romeo 2020; Romeo et al. 2020), which hides a slight systematic trend with gas mass fraction (see fig. 3 of Romeo et al. 2020), also detected by another careful analysis (Mancera Piña et al. 2021b). That trend does not affect the usefulness of Eqs (11) and (12), which has been highlighted by Romeo (2020) and Romeo et al. (2020), and confirmed by independent investigations (e.g., Kurapati et al. 2021; Bouché et al. 2022). Hereafter we will make use of such equations without considering molecular gas, since CO data are not available for most galaxies of our sample, as already mentioned in Sect. 2.2.
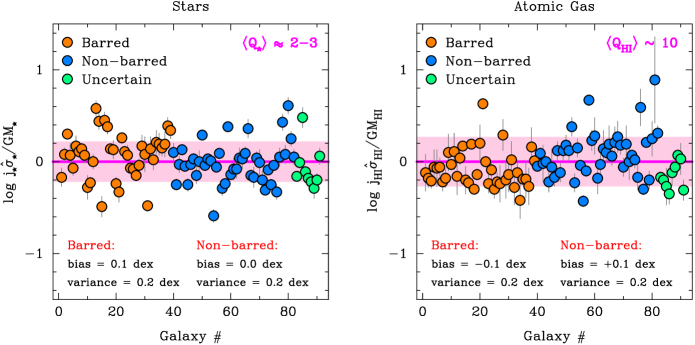
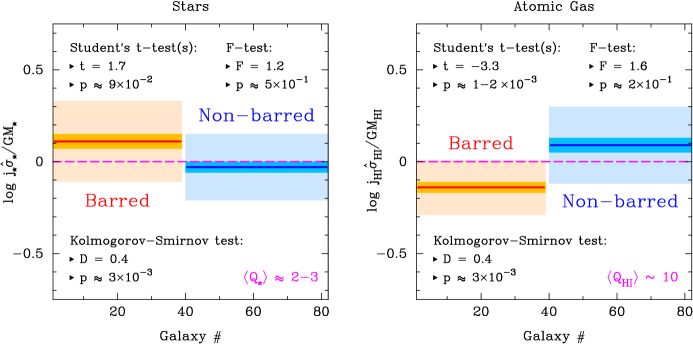
Let us now analyse in detail how barred/non-barred disc galaxies self-regulate their stellar and atomic gas components via local gravitational instabilities. The first part of our analysis is illustrated in Fig. 4, where each panel shows the predicted value of (magenta line), the corresponding approximate value of , the observed scatter (pink region), as well as statistical information about the barred and non-barred data sets: their ‘bias’ (median offset from the prediction), and their ‘variance’ (robust standard deviation from the median trend). Such statistical diagnostics disclose a weak systematic effect, which is also visually detectable as a small vertical offset between the orange and azure data points: barred galaxies self-regulate to values of (values of ) that are typically 0.2 dex smaller ( 0.1 dex larger) than those of non-barred galaxies. In contrast, both types of galaxies exhibit the same cosmic variance in : 0.2 dex, a universal value for both stars and atomic gas.
The results presented above are reliable because they are based on robust statistics, and because the barred/non-barred data sets are statistically unbiased (see Sect. 2.2 for more information). Furthermore, such results are new and unexpected. Indeed, we expected to find a clearer separation between barred and non-barred galaxies than that shown in Fig. 4, given that bars are expected to enrich the outer disc with a significant amount of angular momentum (see the opening paragraph of this section), and given that the outskirts of the disc contribute most to and . Below we verify such results carefully.
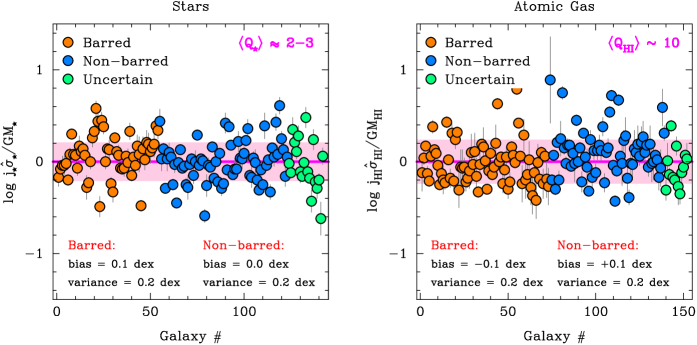
-
1.
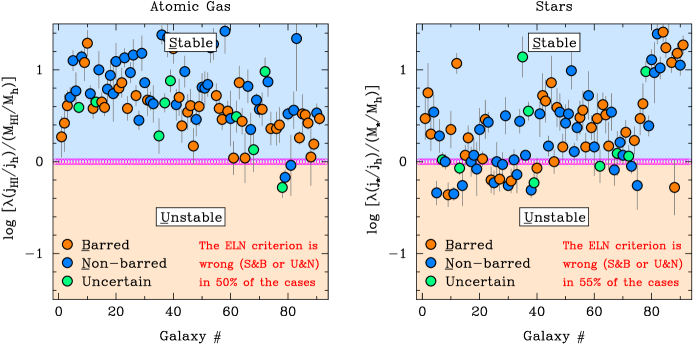
Robustness of the results. Let us re-analyse the effect of bars on and using two larger data sets: from a sample of 142 galaxies selected by Romeo et al. (2020), and from a sample of 152 galaxies selected by Mancera Piña et al. (2021a). These are two of the largest galaxy samples with quality-assessed measurements of such quantities. Remember that their intersection is the galaxy sample described in Sect. 2. This second part of our analysis is illustrated in Fig. 5. The larger sample size makes the distribution of data points denser inside the pink regions, hence statistically closer to the magenta lines, thus highlighting how well self-regulated disc galaxies are. The larger sample size also makes it clearer that barred galaxies are characterized by median values of and that are different from those of non-barred galaxies, while both types of galaxies have the same cosmic variance in .
-
2.
Statistical validity and significance of the results. Let us finally re-consider the galaxy sample described in Sect. 2 and analyse the barred/non-barred data sets in detail using a variety of statistical diagnostics (‘uncertain’ galaxies are not considered). This third part of our analysis is illustrated in Fig. 6, where each panel shows the median values (solid lines), robust standard errors (thin rectangles) and robust standard deviations (thick rectangles) of for the two data sets, as well as several comparative tests. These general statistical tests are described in chaps 14.2 and 14.3 of Press et al. (1992), for example, and quantify how significantly different two distributions are as regards their means (Student’s t-test), variances (F-test) and cumulative behaviours, most sensitively around the median values (Kolmogorov-Smirnov test). All such diagnostics speak clearly: bars have a weak but significant impact on and an opposite feeble effect on , which is at the limit of statistical significance (see Fig. 6 for detailed information).
5 CONCLUSIONS
In this paper, we have used publicly available measurements of mass () and specific angular momentum () of various galaxy components, which result from the work of several teams (Read et al. 2017; Posti et al. 2018, 2019; Mancera Piña et al. 2021a). Using such high-quality data with a wide dynamic range from the SPARC and the LITTLE THINGS galaxy samples, we have performed a detailed comparative analysis that stretches across a variety of galaxy properties, for disc galaxies of all morphological types: from lenticulars to blue compact dwarfs. Our analysis solves important aspects of the angular momentum problem, and imposes tight constraints not only on itself but also on its connection with galaxy morphology, bar structure and disc gravitational instability. Our major results are pointed out below.
-
•
The ‘baryons’ (stars and atomic gas) contained in the discs and bulges of nearby star-forming galaxies have retained, globally, slightly more than 80% of the specific angular momentum possessed by their host dark matter haloes. Thus is conserved to better than 20% in the process of disc galaxy formation and evolution (see Fig. A1 for detailed statistical information). There is however a clear systematic trend: the retained fraction of specific angular momentum, , depends on the galaxy formation efficiency, , and varies on average as . This correlation is moderately strong but very significant (e.g. Spearman’s and ). In contrast, does not show any particularly significant () correlation with basic galaxy properties like , or their baryonic counterparts.
-
•
Stars have about 40% less specific angular momentum than the halo, whereas atomic gas has about 20% more (see Fig. A1 for detailed statistical information). This implies that , which confirms a result previously found by Mancera Piña et al. (2021b). There is a clear systematic trend even for these two baryonic components: . Stars show a gentler logarithmic slope () than atomic gas (), but a comparable degree of correlation ( and ). The two scaling relations vs show opposite residual trends with galaxy morphology. Early-type disc galaxies tend to cluster below (above) the best-fitting relation found for stars (atomic gas), hence they tend to have lower (higher ) than predicted. This tendency is reversed for late-type disc galaxies. As in the case of baryons, we have also analysed the relations between and basic galaxy properties, and found that stars and atomic gas show similarities as well as significant differences (see Appendix A for more information).
-
•
The fraction of specific angular momentum retained by the disc, , is one of the building blocks of the ELN bar instability criterion. This simple criterion, which is used by all current semi-analytic models of galaxy formation and evolution, is believed to be less inaccurate than other uncertainties of the modelling, although careful simulation tests suggest otherwise (see Sect. 4.1.1 for an overview). Our observational test, which is the first of its kind and is based on a statistically unbiased sample of barred/non-barred galaxies, demonstrates that the ELN criterion is highly inaccurate: it fails in about 55% of the cases. A more fundamental limitation is that barred and non-barred galaxies are mixed across the entire range of values spanned by the ELN parameter, , and cannot thus be separated by shifting the instability threshold () up or down, regardless of whether the ELN criterion is applied to the whole baryonic disc or to its stellar component. Our test further demonstrates that the ELN criterion tends to overpredict how bar stable disc galaxies are, especially in the case of low-mass gas-rich spirals and dwarfs. Such a tendency is exacerbated when one uses the popular stellar-disc implementation of the ELN criterion.
-
•
and enter another important galaxy evolution process, which takes place in disc galaxies of all morphological types: the self-regulation of galaxy discs driven by local gravitational instabilities (see Sect. 4.2.1 for an overview). Using a variety of statistical diagnostics, we have shown that bars have a weak but significant impact on such a process: barred galaxies self-regulate to values of that are typically 0.2 dex smaller than those of non-barred galaxies, where is the mass-weighted average of Toomre’s (1964) stability parameter. We have also detected an opposite, 0.1 dex effect on , but the signal is so faint that this effect is at the limit of statistical significance. Despite these systematic trends, both barred and non-barred galaxies exhibit the same cosmic variance in : 0.2 dex, a universal value for both stars and atomic gas.
Our results on barred galaxies are of particular interest for semi-analytic modelling of galaxy formation and evolution. Thus we want to clarify them further, and highlight the differences between and .
First of all, it is amazingly challenging to characterize barred galaxies from a gravitational instability point of view. In the best of the cases, the signal is faint and appropriate statistical methods are required to separate it from the noise. This is an important point to keep in mind!
Secondly, it is unexpected but not totally surprising that shows no signal at all, while shows a faint signal. On the one hand, no parameter can represent the complex phenomenology of bars in disc galaxies or the disc-halo interaction, which is vital for bars (Athanassoula 2008; Sellwood 2016). On the other hand, takes into account the disc velocity dispersion, (Romeo & Mogotsi 2018), which is an important ingredient missing from (Athanassoula 2008). It may still seem strange that a quantity derived from the local stability parameter ‘feels’ the presence of bars, which are classically associated with global gravitational instability. But bars produce redistribution of matter in the disc, which alters the radial profile of (Romeo & Fathi 2015, 2016), hence .
Last but not least, neither nor is a bar instability parameter, and neither of them should be used as such! Use instead , and especially , to test whether modelled/simulated barred galaxies behave like the observed ones. is potentially a more useful diagnostic than . This is suggested by the fact that bars can host large amounts of molecular gas (Renaud et al. 2015), and by the fact that molecular gas does not extend so far out in the disc as atomic gas, hence it is a more sensitive tracer of the bar gravitational potential. Unfortunately, there are no CO data available for most galaxies of our sample, so we have not tested the ability of to distinguish barred from non-barred galaxies. We leave that for future work.
ACKNOWLEDGEMENTS
ABR dedicates this paper to his wife Åsa: for your immense love and support. We are very grateful to Martin Fröst for musical inspiration, to Pavel Mancera Piña for help with the data, and to Dimitrios Irodotou, David Izquierdo-Villalba, Pavel Mancera Piña and Robert Nau for useful discussions. We are also very grateful to an anonymous referee for insightful comments and suggestions, and for encouraging future work on the topic. OA and FR acknowledge support from the Knut and Alice Wallenberg Foundation. OA acknowledges support from the Swedish Research Council (grant 2019-04659).
DATA AVAILABILITY
The data underlying this article will be shared on reasonable request to the corresponding author.
References
- [1] Abraham S., Aniyan A. K., Kembhavi A. K., Philip N. S., Vaghmare K., 2018, MNRAS, 477, 894
- [2] Agertz O., Kravtsov A. V., 2016, ApJ, 824, 79
- [3] Athanassoula E., 2008, MNRAS, 390, L69
- [4] Athanassoula E., 2013, in Falcón-Barroso J., Knapen J. H., eds, Secular Evolution of Galaxies. Cambridge University Press, Cambridge, p. 305
- [5] Berrier J. C., Sellwood J. A., 2016, ApJ, 831, 65
- [6] Bertin G., Romeo A. B., 1988, A&A, 195, 105
- [7] Binney J., Tremaine S., 2008, Galactic Dynamics. Princeton University Press, Princeton
- [8] Bouché N. F. et al., 2021, A&A, 654, A49
- [9] Bouché N. F. et al., 2022, A&A, 658, A76
- [10] Brook C. B. et al., 2011, MNRAS, 415, 1051
- [11] Bullock J. S., Dekel A., Kolatt T. S., Kravtsov A. V., Klypin A. A., Porciani C., Primack J. R., 2001, ApJ, 555, 240
- [12] Burkert A. et al., 2016, ApJ, 826, 214
- [13] Cacciato M., Dekel A., Genel S., 2012, MNRAS, 421, 818
- [14] Carlberg R. G., Sellwood J. A., 1985, ApJ, 292, 79
- [15] Christodoulou D. M., Shlosman I., Tohline J. E., 1995, ApJ, 443, 551
- [16] Cimatti A., Fraternali F., Nipoti C., 2020, Introduction to Galaxy Formation and Evolution: From Primordial Gas to Present-Day Galaxies. Cambridge University Press, Cambridge
- [17] Combes F., 2011, in Brummell N., Brun A. S., Miesch M. S., Ponty Y., eds, Proc. IAU Symp. 271, Astrophysical Dynamics: From Stars to Galaxies. Cambridge Univ. Press, Cambridge, p. 119
- [18] Combes F., 2020, in Lago M. T., ed., Proc. IAU Symp. XXX, Astronomy in Focus XXX, Galactic Angular Momentum. Cambridge University Press, p. 197
- [19] Consolandi G., 2016, A&A, 595, A67
- [20] Cortese L. et al., 2016, MNRAS, 463, 170
- [21] de Vaucouleurs G., de Vaucouleurs A., Corwin H. G. Jr., Buta R. J., Paturel G., Fouqué P., 1991, Third Reference Catalogue of Bright Galaxies. Springer, New York
- [22] Devergne T. et al., 2020, A&A, 644, A56
- [23] Dutton A. A., van den Bosch F. C., 2012, MNRAS, 421, 608
- [24] Efstathiou G., Jones B. J. T., 1979, MNRAS, 186, 133
- [25] Efstathiou G., Lake G., Negroponte J., 1982, MNRAS, 199, 1069
- [26] Ejdetjärn T., Agertz O., Östlin G., Renaud F., Romeo A. B., 2022, MNRAS, 514, 480
- [27] El-Badry et al., 2018, MNRAS, 473, 1930
- [28] Fall S. M., 1983, in Athanassoula E., ed., Proc. IAU Symp. 100, Internal Kinematics and Dynamics of Galaxies. Reidel, Dordrecht, p. 391
- [29] Fall S. M., Romanowsky A. J., 2013, ApJ, 769, L26
- [30] Fall S. M., Romanowsky A. J., 2018, ApJ, 868, 133
- [31] Feigelson E. D., Babu G. J., 2012, Modern Statistical Methods for Astronomy with R Applications. Cambridge University Press, Cambridge
- [32] Forbes J., Krumholz M., Burkert A., 2012, ApJ, 754, 48
- [33] Forbes J. C., Krumholz M. R., Burkert A., Dekel A., 2014, MNRAS, 438, 1552
- [34] Gadotti D. A., 2009, in Contopoulos G., Patsis P. A., eds, Chaos in Astronomy. Springer-Verlag, Berlin, p. 159
- [35] Garrison-Kimmel S. et al., 2018, MNRAS, 481, 4133
- [36] Géron T., Smethurst R. J., Lintott C., Kruk S., Masters K. L., Simmons B., Stark D. V., 2021, MNRAS, 507, 4389
- [37] Gillman S. et al., 2020, MNRAS, 492, 1492
- [38] Goldbaum N. J., Krumholz M. R., Forbes J. C., 2015, ApJ, 814, 131
- [39] Hafen Z. et al., 2022, MNRAS, 514, 5056
- [40] Hohl F., 1971, ApJ, 168, 343
- [41] Hunter D. A., Elmegreen B. G., 2006, ApJS, 162, 49
- [42] Hunter D. A. et al., 2012, AJ, 144, 134
- [43] Ianjamasimanana R., de Blok W. J. G., Heald G. H., 2017, AJ, 153, 213
- [44] Iorio G., Fraternali F., Nipoti C., Di Teodoro E., Read J. I., Battaglia G., 2017, MNRAS, 466, 4159
- [45] Irodotou D., Thomas P. A., Henriques B. M., Sargent M. T., Hislop J. M., 2019, MNRAS, 489, 3609
- [46] Izquierdo-Villalba D., Bonoli S., Spinoso D., Rosas-Guevara Y., Henriques B. M. B., Hernández-Monteagudo C., 2019, MNRAS, 488, 609
- [47] Izquierdo-Villalba D. et al., 2022, MNRAS, 514, 1006
- [48] Kataria S. K., Das M., Barway S., 2020, A&A, 640, A14
- [49] Kauffmann G., Huang M.-L., Moran S., Heckman T. M., 2015, MNRAS, 451, 878
- [50] Kim T., Athanassoula E., Sheth K., Bosma A., Park M.-G., Lee Y. H., Ann H. B., 2021, ApJ, 922, 196
- [51] Kimm T., Devriendt J., Slyz A., Pichon C., Kassin S. A., Dubois Y., 2011, preprint (arXiv:1106.0538)
- [52] Kormendy J., 2013, in Falcón-Barroso J., Knapen J. H., eds, Secular Evolution of Galaxies. Cambridge University Press, Cambridge, p. 1
- [53] Kraljic K., Bournaud F., Martig M., 2012, ApJ, 757, 60
- [54] Krumholz M. R., Burkhart B., Forbes J. C., Crocker R. M., 2018, MNRAS, 477, 2716
- [55] Kurapati S., Chengalur J. N., Pustilnik S., Kamphuis P., 2018, MNRAS, 479, 228
- [56] Kurapati S., Chengalur J. N., Verheijen M. A. W., 2021, MNRAS, 507, 565
- [57] Lagos C. d. P., 2020, in Lago M. T., ed., Proc. IAU Symp. XXX, Astronomy in Focus XXX, Galactic Angular Momentum. Cambridge University Press, p. 208
- [58] Lapi A., Salucci P., Danese L., 2018, ApJ, 859, 2
- [59] Lee Y. H., Park M.-G., Hwang H. S., Ann H. B., Chung H., Kim T., 2022, ApJ, 926, 58
- [60] Lelli F., McGaugh S. S., Schombert J. M., 2016, AJ, 152, 157
- [61] Leroy A. K., Walter F., Brinks E., Bigiel F., de Blok W. J. G., Madore B., Thornley M. D., 2008, AJ, 136, 2782
- [62] Li P., Lelli F., McGaugh S., Schombert J., 2020, ApJS, 247, 31
- [63] Macciò A. V., Dutton A. A., van den Bosch F. C., Moore B., Potter D., Stadel J., 2007, MNRAS, 378, 55
- [64] Macciò A. V., Dutton A. A., van den Bosch F. C., 2008, MNRAS, 391, 1940
- [65] Makarov D., Prugniel P., Terekhova N., Courtois H., Vauglin I., 2014, A&A, 570, A13
- [66] Mancera Piña P. E., Posti L., Fraternali F., Adams E. A. K., Oosterloo T., 2021a, A&A, 647, A76
- [67] Mancera Piña P. E., Posti L., Pezzulli G., Fraternali F., Fall S. M., Oosterloo T., Adams E. A. K., 2021b, A&A, 651, L15
- [68] Mancera Piña P. E., Fraternali F., Oosterloo T., Adams E. A. K., di Teodoro E., Bacchini C., Iorio G., 2022, MNRAS, 514, 3329
- [69] Marasco A., Fraternali F., Posti L., Ijtsma M., Di Teodoro E. M., Oosterloo T., 2019, A&A, 621, L6
- [70] Marchuk A. A., Sotnikova N. Y., 2017, MNRAS, 465, 4956
- [71] Miller R. H., Prendergast K. H., Quirk W. J., 1970, ApJ, 161, 903
- [72] Mo H. J., Mao S., White S. D. M., 1998, MNRAS, 295, 319
- [73] Mogotsi K. M., Romeo A. B., 2019, MNRAS, 489, 3797
- [74] Müller J. W., 2000, J. Res. Natl. Inst. Stand. Technol., 105, 551
- [75] Murugeshan C., Kilborn V., Jarrett T., Wong O. I., Obreschkow D., Glazebrook K., Cluver M. E., Fluke C. J., 2020, MNRAS, 496, 2516
- [76] Naab T., Ostriker J. P., 2017, ARA&A, 55, 59
- [77] Navarro J. F., Steinmetz M., 2000, ApJ, 538, 477
- [78] Navarro J. F., White S. D. M., 1994, MNRAS, 267, 401
- [79] Obreschkow D., 2020, in Lago M. T., ed., Proc. IAU Symp. XXX, Astronomy in Focus XXX, Galactic Angular Momentum. Cambridge University Press, p. 191
- [80] Obreschkow D., Glazebrook K., 2014, ApJ, 784, 26
- [81] Obreschkow D., Glazebrook K., Kilborn V., Lutz K., 2016, ApJ, 824, L26
- [82] Okamura T., Shimasaku K., Kawamata R., 2018, ApJ, 854, 22
- [83] Ostriker J. P., Peebles P. J. E., 1973, ApJ, 186, 467
- [84] Peebles P. J. E., 1969, ApJ, 155, 393
- [85] Planck Collaboration VI, 2020, A&A, 641, A6
- [86] Posti L., Fraternali F., Di Teodoro E. M., Pezzulli G., 2018, A&A, 612, L6
- [87] Posti L., Fraternali F., Marasco A., 2019, A&A, 626, A56
- [88] Press W. H., Teukolsky S. A., Vetterling W. T., Flannery B. P., 1992, Numerical Recipes in Fortran: The Art of Scientific Computing. Cambridge University Press, Cambridge
- [89] Read J. I., Iorio G., Agertz O., Fraternali F., 2017, MNRAS, 467, 2019
- [90] Renaud F. et al., 2015, MNRAS, 454, 3299
- [91] Renaud F., Romeo A. B., Agertz O., 2021, MNRAS, 508, 352
- [92] Rodionov S. A., Sotnikova N. Ya., 2013, MNRAS, 434, 2373
- [93] Rodríguez-Puebla A., Behroozi P., Primack J., Klypin A., Lee C., Hellinger D., 2016, MNRAS, 462, 893
- [94] Romanowsky A. J., Fall S. M., 2012, ApJS, 203, 17
- [95] Romeo A. B., 1990, Stability and Secular Heating of Galactic Discs. PhD thesis, SISSA, Trieste, Italy
- [96] Romeo A. B., 1992, MNRAS, 256, 307
- [97] Romeo A. B., 1994, A&A, 286, 799
- [98] Romeo A. B., 1997, A&A, 324, 523
- [99] Romeo A. B., 1998a, A&A, 335, 922
- [100] Romeo A. B., 1998b, in Salucci P., ed., Dark Matter. Studio Editoriale Fiorentino, Firenze, p. 177
- [101] Romeo A. B., 2020, MNRAS, 491, 4843
- [102] Romeo A. B., 2021, Image Processing. Online MSc and PhD course at http://fy.chalmers.se/ romeo/RRY025/
- [103] Romeo A. B., Falstad N., 2013, MNRAS, 433, 1389
- [104] Romeo A. B., Fathi K., 2015, MNRAS, 451, 3107
- [105] Romeo A. B., Fathi K., 2016, MNRAS, 460, 2360
- [106] Romeo A. B., Mogotsi K. M., 2017, MNRAS, 469, 286
- [107] Romeo A. B., Mogotsi K. M., 2018, MNRAS, 480, L23
- [108] Romeo A. B., Wiegert J., 2011, MNRAS, 416, 1191
- [109] Romeo A. B., Agertz O., Renaud F., 2020, MNRAS, 499, 5656
- [110] Roshan M., Ghafourian N., Kashfi T., Banik I., Haslbauer M., Cuomo V., Famaey B., Kroupa P., 2021, MNRAS, 508, 926
- [111] Rousseeuw P. J., 1991, J. Chemometrics, 5, 1
- [112] Sellwood J. A., 2016, ApJ, 819, 92
- [113] Sellwood J. A., Carlberg R. G., 1984, ApJ, 282, 61
- [114] Stewart K. R., Brooks A. M., Bullock J. S., Maller A. H., Diemand J., Wadsley J., Moustakas L. A., 2013, ApJ, 769, 74
- [115] Sweet S. M., Fisher D., Glazebrook K., Obreschkow D., Lagos C., Wang L., 2018, ApJ, 860, 37
- [116] Sweet S. M. et al., 2019, MNRAS, 485, 5700
- [117] Teklu A. F., Remus R.-S., Dolag K., Beck A. M., Burkert A., Schmidt A. S., Schulze F., Steinborn L. K., 2015, ApJ, 812, 29
- [118] Toomre A., 1964, ApJ, 139, 1217
- [119] Trapp C. W. et al., 2022, MNRAS, 509, 4149
- [120] Übler H., Naab T., Oser L., Aumer M., Sales L. V., White S. D. M., 2014, MNRAS, 443, 2092
- [121] van den Bosch F. C., 1998, ApJ, 507, 601
- [122] Vandervoort P. O., 1970, ApJ, 161, 87
- [123] Wechsler R. H., Tinker J. L., 2018, ARA&A, 56, 435
- [124] Willett K. W. et al., 2013, MNRAS, 435, 2835
- [125] Zasov A. V., Zaitseva N. A., 2017, Astron. Lett., 43, 439
- [126] Zjupa J., Springel V., 2017, MNRAS, 466, 1625
Appendix A ADDITIONAL FIGURES
This appendix contains four additional figures.
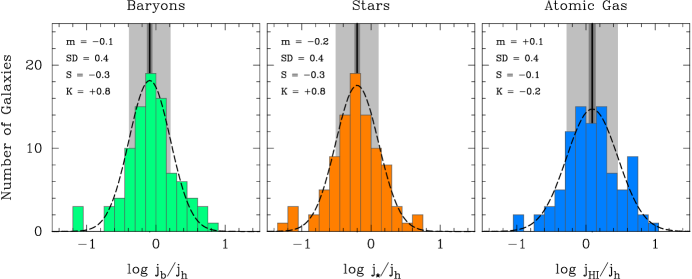
Fig. A1, mentioned in Sects 3.1 and 3.2, provides detailed statistical information concerning , and . The most important point illustrated by this figure is that the probability distributions of such fractions have a strong central tendency. This is especially true for baryons and stars, whose distributions are clearly unimodal and more peaked than a Gaussian. In such cases, the median is a robust estimator of the central value of the distribution (see chap. 14.1 of Press et al. 1992). Thus the median values robust standard errors of , and provide fully meaningful estimates of how well specific angular momentum is conserved in a statistical sense, regardless of how strongly or significantly the retained fractions of correlate with other galaxy properties.
Figs A2–A4, also mentioned in Sects 3.1 and 3.2, supplement the information provided by Figs 1 and 2 with additional correlation plots. Figs A2 and A3 show that and do not have any particularly significant () correlation with basic galaxy properties like , or their baryonic/stellar counterparts. Fig. A4 shows that does not correlate with or , while it has a moderately high degree of correlation with and .
Appendix B ADDITIONAL TESTS
This appendix describes three additional tests.
The first test, mentioned in Sect. 2.2, probes two numerical aspects of the problem: (i) the effect of varying the random realization of on the correlations between , and ; and (ii) the impact of suppressing the natural variance of on such correlations. To probe (i), we run 10 Monte Carlo simulations of for our galaxy sample, i.e. we randomly generate 10 sets of 91 values of from Eq. (3), setting and (0.22 dex) as in Sect. 2.2, and compute from Eq. (4). For each simulation, we analyse vs and vs using the statistics described in Sect. 2.3. We then evaluate the mean and the standard deviation of each statistic over the ensemble of simulations. To probe (ii), we set in Eq. (4), and analyse the and relations using our statistical toolkit. Fig. B1 illustrates all such information, including the fiducial random realization set used in this paper, which is highlighted in orange over a ‘sea’ of azure data points. Our test demonstrates that varying the random realization of has a weak () effect on the results, whereas suppressing the natural variance of artificially constrains the correlations between and other fundamental galaxy properties like and .
The second test, mentioned in Sect. 4.1.2, checks whether the low accuracy found for the ELN criterion is an artefact of using the reformulation made by Mo et al. (1998) [Eq. (10)], rather than the original criterion (Efstathiou et al. 1982) [Eq. (9)]. To check this, we need to evaluate two additional quantities: the exponential disc scale length, , and the maximum rotation velocity, . Since there are no publicly available measurements of for most galaxies of our sample, we use as a proxy for , where is the velocity along the flat part of the rotation curve. and are taken from Lelli et al. (2016) for SPARC galaxies, and from Hunter & Elmegreen (2006) and Iorio et al. (2017) for LITTLE THINGS galaxies, respectively. More precisely, for 8 of the 77 SPARC galaxies, is undefined because the rotation curve does not reach a flat part. Hence the galaxy sample used for this test contains 83 galaxies in total. Fig. B2 shows that the low accuracy found in Sect. 4.1.2 is not an artefact of using the ELN criterion reformulated by Mo et al. (1998), rather than the original ELN criterion itself: Eqs (9) and (10) are almost indistinguishable from a statistical point of view.
The third test, also mentioned in Sect. 4.1.2, checks whether it is possible to improve the accuracy of the ELN criterion by applying it to the atomic gas disc, rather than to the stellar disc. Fig. B3 shows that the accuracy of the ELN criterion is low even in that case.