LADUMA: Discovery of a luminous OH megamaser at
Abstract
In the local Universe, OH megamasers (OHMs) are detected almost exclusively in infrared-luminous galaxies, with a prevalence that increases with IR luminosity, suggesting that they trace gas-rich galaxy mergers. Given the proximity of the rest frequencies of OH and the hyperfine transition of neutral atomic hydrogen (H i), radio surveys to probe the cosmic evolution of H i in galaxies also offer exciting prospects for exploiting OHMs to probe the cosmic history of gas-rich mergers. Using observations for the Looking At the Distant Universe with the MeerKAT Array (LADUMA) deep H i survey, we report the first untargeted detection of an OHM at , LADUMA J033046.20275518.1 (nicknamed “Nkalakatha”). The host system, WISEA J033046.26275518.3, is an infrared-luminous radio galaxy whose optical redshift confirms the MeerKAT emission line detection as OH at a redshift rather than H i at lower redshift. The detected spectral line has 18.4 peak significance, a width of , and an integrated luminosity of , placing it among the most luminous OHMs known. The galaxy’s far-infrared luminosity marks it as an ultra-luminous infrared galaxy; its ratio of OH and infrared luminosities is similar to those for lower-redshift OHMs. A comparison between optical and OH redshifts offers a slight indication of an OH outflow. This detection represents the first step towards a systematic exploitation of OHMs as a tracer of galaxy growth at high redshifts.
1 Introduction
OH megamasers (OHMs) are luminous 18 cm wavelength masers, produced in the centers of luminous and ultra-luminous infrared galaxies (LIRGs and ULIRGs) that have undergone merger-induced starburst activity (Lo, 2005), are rich in dense gas (Darling, 2007), and in some cases host luminous active galactic nuclei (AGN; Klöckner et al., 2003). Four 18 cm lines connect the four hyperfine levels within the ground state of the OH molecule: two main lines at 1665 and 1667 MHz, and two satellite lines at 1612 and 1720 MHz. In contrast to Galactic OH masers, extragalactic OHMs have large line widths and main line flux ratios . These attributes, along with the weakness of their satellite lines (McBride et al., 2013), can be naturally explained by a model in which OHMs are powered by radiative pumping through lines that overlap in velocity, and in which different projected distributions of masing clumps can account for observations of both diffuse and compact emitting structures (Lockett & Elitzur, 2008).
The most extensive OHM survey in the local Universe has been conducted with Arecibo, with a focus on the detection of systems (Darling & Giovanelli, 2002a). In total, 53 OHMs were detected, spanning the redshift range . Although Combes et al. (2021) report a tentative detection of the 1720 MHz satellite line in emission in a targeted MeerKAT observation of the quasar PKS 1830211, the main lines of OH have not been detected in emission at up to now.
The local demographics of OHMs have been used to predict their occurrence at higher redshifts, where they are likely to represent a significant source of contamination for H i surveys (Briggs, 1998; Darling & Giovanelli, 2002b; Suess et al., 2016; Roberts et al., 2021). Such surveys will be conducted by the interferometers that include the Square Kilometre Array (SKA) and its pathfinder facilities, such as MeerKAT (Jonas & MeerKAT Team, 2016) and the Australian SKA Pathfinder (ASKAP; DeBoer et al., 2009). Although ULIRGs are more prevalent at higher redshifts (Takeuchi et al., 2005) in part because normal star-forming galaxies at earlier epochs are likely to have even in the absence of recent merging (e.g., Reddy et al., 2008), OHMs have the potential to provide new constraints on the cosmic history of gas-rich mergers.
We report the first untargeted detection of an OHM at from early observations for the Looking At the Distant Universe with the MeerKAT Array (LADUMA; Blyth et al., 2016) deep H i survey. Section 2 describes the acquisition and processing of the MeerKAT data in which the OH line was detected, and Section 3 presents our measurements and interpretation of the line parameters. In Section 4, we discuss the implications of this OHM in the context of previous knowledge of OHM hosts at lower redshifts and future observations probing to higher redshifts; §5 summarizes our conclusions. The paper assumes a flat CDM cosmology with , , and (Wong et al., 2020).
2 Observations
2.1 MeerKAT
MeerKAT is a fixed-configuration array of 64 antennas equipped with receivers spanning the L (900–1670 MHz) and UHF (580–1015 MHz) bands. These overlapping frequency ranges access redshift ranges of and for the H i line, and and , adopting the stronger of the two main OH lines (at a rest frequency of 1667.359 MHz) to define . The LADUMA deep H i survey is using both L and UHF bands to probe the evolution of gas in galaxies over cosmic time. LADUMA is targeting a single pointing on the sky (03:32:30.4 28:07:57 J2000) that encompasses the extended Chandra Deep Field South (ECDFS) and lies roughly at the center of near-IR imaging coverage from the VISTA Deep Extragalactic Observations (VIDEO) survey (Jarvis et al., 2013). Because the solid angle of MeerKAT’s primary beam is inversely proportional to the square of the observing frequency, the cosmic volume LADUMA probes for any single spectral line expands with redshift like a trumpet (e.g., a South African vuvuzela). Across the L band in particular, MeerKAT’s circular field of view increases (at the half-power level) from at 1667 MHz to at 1420.4 MHz to at 900 MHz.
The first official L-band survey observation for LADUMA that used the 32k mode of the MeerKAT correlator (featuring 32,768 channels, each of width 26.1 kHz) was taken on 2019 December 12 with 58 of the 64 antennas in operation. The bright radio galaxy PKS 1934–63 was used as a flux and bandpass calibrator (observed for 10 minutes); the nearby quasar PKS 0237–233 was observed as a gain calibrator for 3.5 minutes after each 20-minute observation of the LADUMA field. The total on-source integration time was 7.3 hours.
We reduced the data across the full L band, excluding regions affected by radio frequency interference (RFI), after splitting into 25 MHz spectral windows (SPWs). For the source discussed in this paper, the relevant SPW spans 1086–1111 MHz. Bandpass, flux, and phase calibration were performed using the processMeerKAT pipeline111https://idia-pipelines.github.io/docs/processMeerKAT, which is written in Python, uses a purpose-built CASA (McMullin et al., 2007) Singularity container, and employs MPICASA (a parallelized form of CASA). Flux calibration used the Reynolds (1994) model for the spectrum of PKS 193463, which is ultimately tied to northern hemisphere calibrators with flux uncertainties of at (e.g., Perley & Butler, 2017). The CASA task tclean was used with robust = 0 to create an initial continuum model as a basis for phase and amplitude self-calibration, after which model continuum visibility data were subtracted from the corrected visibility data using the CASA task uvsub. A third-order polynomial fit to the continuum was then calculated and subtracted using the CASA task uvcontsub for all channels in each SPW to remove residual continuum emission from the spectral line data. Finally, spectral line cubes were created using tclean with robust = 0.5 and no cleaning; all channels in the resulting (dirty) cubes were convolved to a common synthesized beam of at a position angle of 15.8∘. The RMS per 26.1 kHz channel was found to increase with frequency across the 1086–1111 MHz SPW, with a value of 0.40 mJy beam-1 near 1095 MHz. All data were reduced on the ilifu cloud computing facility222https://docs.ilifu.ac.za/#/about/what_is.
Visual inspection of the continuum-subtracted 26.1 kHz channel data cube with the Cube Analysis and Rendering Tool for Astronomy (CARTA; Comrie et al., 2020) revealed a bright spectral line at an observed frequency of 1095 MHz, which we designate as LADUMA J033046.20275518.1 and describe in detail in §3.1.
| Observed | Flux | ||
|---|---|---|---|
| Source | wavelength | density | Reference |
| WISE | Wright et al. (2010) | ||
| WISE | Wright et al. (2010) | ||
| WISE | Wright et al. (2010) | ||
| Spitzer/MIPS | Hanish et al. (2015) | ||
| Spitzer/MIPS | Hanish et al. (2015) | ||
| Herschel/SPIRE | Shirley et al. (2021) | ||
| Herschel/SPIRE | Shirley et al. (2021) | ||
| Herschel/SPIRE | Shirley et al. (2021) | ||
| ATCA | 20 cm | Franzen et al. (2015) |
Note. — a flux density extracted from a point spread function (PSF) fit
2.2 Archival data
LADUMA J033046.20275518.1 has a clear galaxy counterpart in WISE imaging (WISEA J033046.26–275518.3) and in previous radio continuum mapping by the Australia Telescope Large Area Survey (Mao et al., 2012; Franzen et al., 2015). The galaxy has a bent-tail radio morphology (Dehghan et al., 2014), and has been classified as a narrow-angle (or head-tail) radio galaxy (that is, the bent radio structure lies on one side of the optical host galaxy). The source has also been detected in dust emission by the Multiband Imaging Photometer for Spitzer (MIPS; Rieke et al., 2004) on the Spitzer Space Telescope (Hanish et al., 2015) and by the Spectral and Photometric Imaging Receiver (SPIRE; Griffin et al., 2010) on the Herschel Space Observatory (Oliver et al., 2012; Shirley et al., 2021). Table 1 lists selected photometry for the source in the infrared and radio. Optical spectroscopy has yielded two independent redshift measurements of (Eales et al., 2009) and (Mao et al., 2012), neither with a quoted uncertainty; in this paper, we average these two measurements and adopt the uncertainty that is typical for AAT redshifts of similar vintage (see, e.g., §1 of Baldry et al., 2014), yielding .
We can determine the host galaxy’s infrared luminosity using the source redshift and far-infrared photometry. By fitting emissivity-weighted blackbody functions to 1000 realizations of the Spitzer/MIPS and Herschel/SPIRE flux densities between 70–350 m (sampling their respective uncertainties), we derive a rest-frame dust temperature , a dust emissivity index (for ), and a far-IR (rest-frame 42.5–122.5 ) flux erg s-1 cm-2. Using the cosmology adopted for this paper and the redshift measured in §3.1 below, we then arrive at , confirming the source as a ULIRG as previously noted by Moncelsi et al. (2011).
where the 1667 MHz line would have appeared for = ; that suggests a possible OH outflow.
3 Results
3.1 OH emission properties
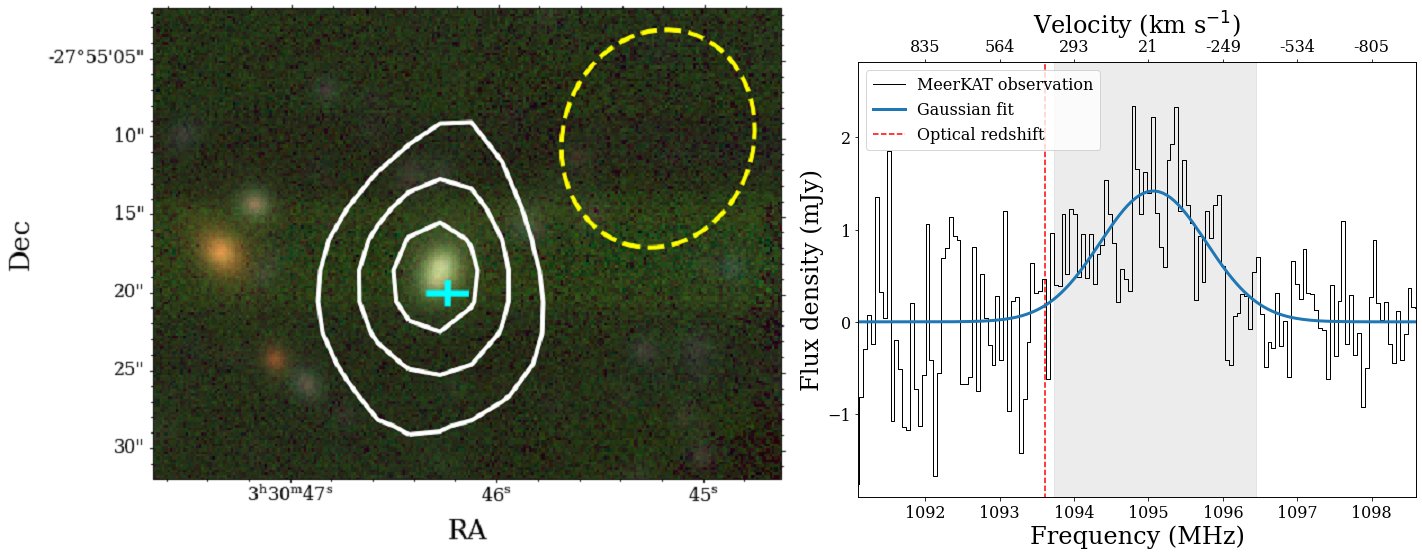
The spatial centroid of LADUMA J033046.20–275518.1 lies at right ascension 03:30:46.20 and declination 27:55:18.17 (J2000) with uncertainties of (calculated as beam size divided by S/N) — consistent with the centroids determined for its counterparts at other wavelengths, within their own uncertainties of or greater. At this position and the observed line frequency, the primary beam correction was a factor , which we applied using CASA before measuring line parameters.
In the right panel of Figure 1, we show the spectrum integrated over a aperture, with frequency Doppler-corrected to the heliocentric reference frame and rebinned by a factor of 2. At the observed frequency, each rebinned (52.2 kHz) channel corresponds to in rest-frame velocity. A single-Gaussian fit to the line spectrum yields (with fit uncertainties noted as errors) a central frequency of , a rest-frame line width (full-width at half-maximum, which corresponds to an observed frequency width of 1.68 MHz), a peak flux density of mJy,333Errors in brackets represent 5% flux scale uncertainties. and a total spectral line flux that agrees well with a direct integral of the spectrum ().
We note that the 1665 MHz OH line may contribute to the measured line flux and width, although this fainter feature is not yet detected in this single-track observation, nor currently preferred over a single Gaussian fit. Given the presence of a multiwavelength counterpart with a previously measured optical redshift , it is clear that our detection is hydroxyl emission at (identified as the 1667.359 MHz transition) rather than H i emission at . From the integrated line flux, we use the general relation for spectral line luminosity
| (1) |
in terms of observed frequency and luminosity distance for our adopted cosmology, obtaining an equivalent isotropic luminosity of .
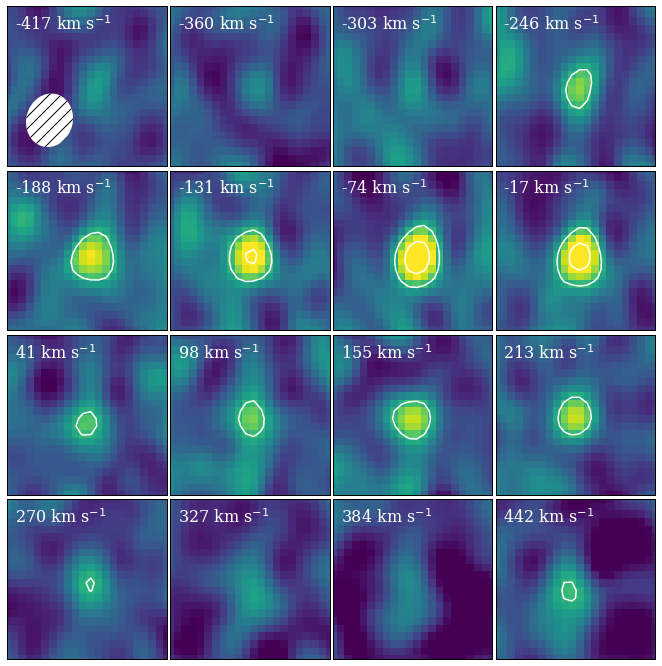
The left panel of Figure 1 shows contours from the zeroth moment map for the source, integrated over and overlaid on a composite image made from the filters of archival Hyper Suprime-Cam (HSC; Miyazaki et al., 2018) data. The cyan cross indicates the ATCA position and its uncertainties from Franzen et al. (2015), and the yellow ellipse shows the MeerKAT synthesized beam. The OH emission is spatially unresolved, with S/N relative to the RMS in the zeroth moment map away from the source. Figure 2 shows the velocity channel maps of the source after rebinning by an additional factor of 4 to a rest-frame velocity resolution of .
3.2 Confirmation of the 1667 MHz identification
Notwithstanding the good agreement with a previously measured optical redshift, we have considered whether the detected emission could correspond to a weaker OH line (e.g., the 1612 or 1720 MHz satellite line, which can exhibit conjugate behavior: Darling, 2004) rather than the main 1667 MHz transition. In this scenario, we would expect an additional detection of the (brighter) 1667 MHz main line at a different frequency (1132.5 or 1061.2 MHz) in our spectrum. No such emission feature is seen at the radio position. We also looked for emission in the satellite lines assuming our detection is indeed the 1667 MHz main line at 1058.9 or 1130.0 MHz, with no such features seen. This result is not surprising given the weakness of satellite lines in OHMs (McBride et al., 2013), although as the LADUMA survey proceeds and reaches greater depths, we may be able to detect them in some systems. We also found no evidence of Hi emission or absorption at this redshift, although such features may become evident from the upcoming deeper LADUMA observations.
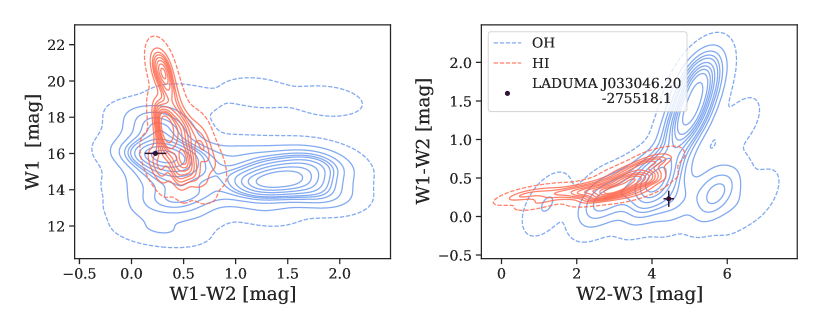
In Figure 3, we consider the implications of WISE magnitudes and colors for our identification of the detected emission line. We employ the algorithms presented in Roberts et al. (2021), who use machine learning to determine the redshift evolution in WISE magnitude and color space for an OHM host and a typical Hi source. The predicted distributions in WISE properties expected for gas-rich disk galaxies emitting H i at redshift (red) and a galaxy merger traced through OH at redshift (blue) show that an OH identification for our source is plausible for all diagnostics, while an H i identification is not always supported (see right panel). Therefore, we are confident that the emission detected corresponds to the main OH transition at 1667 MHz.
4 Discussion
4.1 OH and FIR luminosities
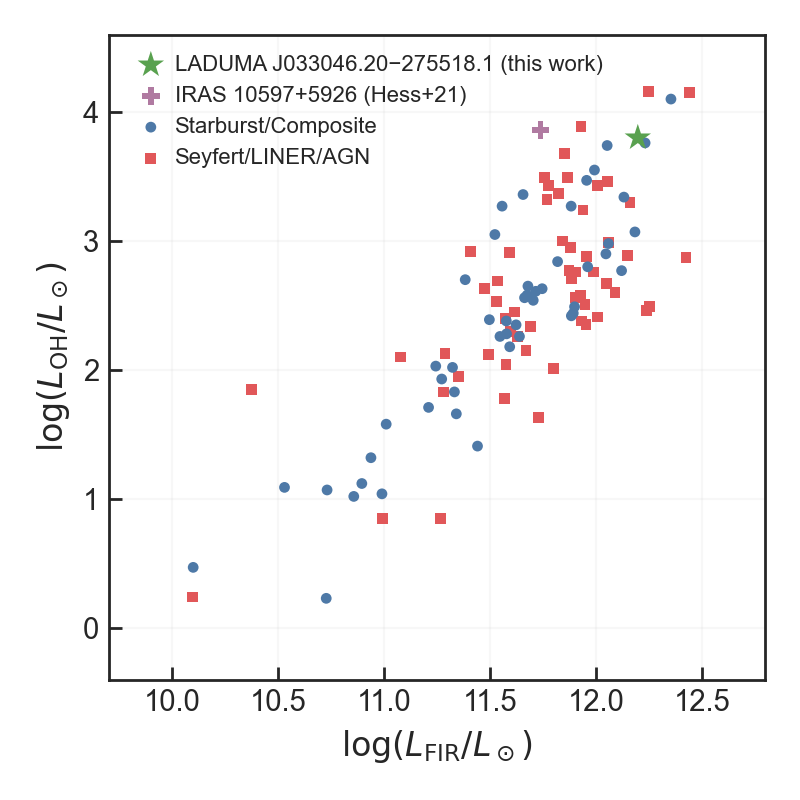
LADUMA J033046.20275518.1 is one of the most luminous OHMs known at any redshift; only three sources within the sample of 53 OHMs presented in Darling & Giovanelli (2002a) and Darling & Giovanelli (2002b) have higher values, and it is only marginally less luminous than the OHM recently detected by Apertif (Hess et al., 2021), which would have for our cosmology. In recognition of this power and its unprecedentedly high redshift, we have given it the nickname “Nkalakatha,” an isiZulu word that means “big boss.” It is not overly surprising that a detection reached in a single LADUMA track will be among the most luminous OHMs when compared to sources from the local Universe at . Using the relationship between OH and far-IR luminosities derived by Darling & Giovanelli (2002a) for an Arecibo survey + literature sample of OHMs, i.e., , we find that the predicted OH luminosity for LADUMA J033046.20275518.1 is . This is roughly a factor of 2.6 smaller than what we observe, but well within the large scatter observed for the local relation (Fig. 4). The dust temperature recovered from the fit to the system’s FIR photometry () is roughly consistent with theoretical expectations and observational results that is required for OH masing to occur (Lockett & Elitzur, 2008; Willett et al., 2011), particularly if cooler dust outside the masing region contributes to , and is at the lower end of the distribution of global dust temperatures for OHM hosts.
We have also considered the FIR–radio flux ratio parameter , defined by Helou et al. (1985) as
| (2) |
For LADUMA J033046.20275518.1, we correct the observed radio continuum flux density444This value is comparable to the value measured from MeerKAT continuum imaging of the LADUMA field, which will be published in a forthcoming paper analogous to Heywood et al. (2022). (Table 1) to 1.4 GHz in the rest frame assuming a spectrum , and arrive at an estimated . This value is consistent with the infrared-radio correlation for star-forming galaxies with no evidence of AGN (see, e.g., Fig. 16 of Delhaize et al., 2017), higher than the median recently measured for 89 star-forming galaxies in the COSMOS field (An et al., 2021), and much higher than the threshold at which galaxies are three times more radio-loud than the mean for star-forming systems (Condon et al., 2002). Spitzer/IRAC photometry for this source (Lonsdale et al., 2003) also disfavor an AGN identification according to well-established criteria (Stern et al., 2005; Donley et al., 2012), as does a classification of its optical spectrum (Mao et al., 2012). As a result, we view the far-IR emission from LADUMA J033046.20275518.1 as more likely due to starburst activity than to a bolometrically significant AGN. Such a conclusion is also not surprising given evidence from the local Universe that ULIRGs hosting OHMs are less likely to show evidence of AGN at infrared wavelengths than non-masing ULIRGs (Willett et al., 2011).
4.2 A possible molecular outflow
Large-scale outflows emanating from the central regions of galaxies and powered by both starbursts and AGN have been known for decades to play an important role in the evolution of galaxies and the intergalactic medium (e.g., Heckman et al., 1990). Such outflows have been detected through OH observations in a number of systems. Baan et al. (1989) detect three distinct outflows in emission in a sample of five OHMs, with one galaxy showing a maximum outflow velocity of 800 km s-1. González-Alfonso et al. (2014) meanwhile find far-IR OH features blueshifted by over 1000 km s-1 in Mrk 231, with the central AGN likely responsible for the high mass outflow rate and outflow velocities detected.
The OH emission in LADUMA J033046.20275518.1 is blueshifted by relative to the redshift measured from optical spectroscopy. The simplest explanation for a one-sided velocity offset is a starburst-driven outflow, given the high value of noted above. However, the situation could be more complex, involving multiple nuclei or a disk close to an (obscured) AGN, possibly interacting with outflows. As our MeerKAT observation of this galaxy and its OH emission is unresolved, higher spatial resolution observations would be required to further characterize the outflow’s extent and energetics. The study of Gowardhan et al. (2018), investigating molecular gas outflows in two starburst ULIRGs in mid- CO and 18 cm OH lines, is instructive in this regard. CO outflow velocities are seen to exceed 1600 km s-1, with corresponding mass outflow rates of 300–700 yr-1; meanwhile, OH outflow velocities are seen to extend to 1000 km s-1, with velocity wings for one source agreeing “remarkably well” with previous detections of outflowing molecular gas. A higher-resolution study of other molecular species (e.g., CO) in LADUMA J033046.20275518.1 may thus be a productive strategy for confirming the existence of an outflow in OH.
5 Conclusions
We present the first detection of an OHM in the LADUMA field, LADUMA J033046.20275518.1 “Nkalakatha,” which is also the highest redshift detection of such a system to date in the main 1667 MHz OH emission line. OH emission is found to be redshifted to , which agrees well with an optical redshift of for a host galaxy already known to be a ULIRG. The system’s total OH luminosity of makes it one of the most luminous OHMs known (all other 1667 MHz detections have redshifts ), and is consistent with its large far-IR luminosity. The 400 km s-1 offset between the OH and optical redshifts is most simply explained by a starburst-driven outflow.
This detection highlights the potential of upcoming spectral line surveys, whose wide frequency coverage will enable further high-redshift measurements. Roberts et al. (2021) predict that OHMs will be detected in LADUMA alone, which will nearly double the number of known OHMs. Greater numbers are expected in lower redshift but wider area surveys, such as the Widefield ASKAP L-band Legacy All-sky Blind surveY (WALLABY; Koribalski et al., 2020), the Apertif Wide-area Extragalactic Survey (AWES; Hess et al., in prep), and the H i component (MIGHTEE-H i; Maddox et al., 2021) of the MeerKAT International GigaHertz Tiered Extragalactic Exploration (MIGHTEE) survey (Jarvis et al., 2016). As LADUMA reaches greater depths, we expect to set further OHM redshift records, which will enable studies of the cosmic rate of gas-rich galaxy mergers and further constrain galaxy evolution models.
References
- An et al. (2021) An, F., Vaccari, M., Smail, I., et al. 2021, MNRAS, 507, 2643, doi: 10.1093/mnras/stab2290
- Baan et al. (1989) Baan, W. A., Haschick, A. D., & Henkel, C. 1989, ApJ, 346, 680, doi: 10.1086/168050
- Baldry et al. (2014) Baldry, I. K., Alpaslan, M., Bauer, A. E., et al. 2014, MNRAS, 441, 2440, doi: 10.1093/mnras/stu727
- Blyth et al. (2016) Blyth, S., Baker, A. J., Holwerda, B., et al. 2016, in MeerKAT Science: On the Pathway to the SKA, 4
- Briggs (1998) Briggs, F. H. 1998, A&A, 336, 815
- Combes et al. (2021) Combes, F., Gupta, N., Muller, S., et al. 2021, A&A, 648, A116, doi: 10.1051/0004-6361/202040167
- Comrie et al. (2020) Comrie, A., Wang, K.-S., Ford, P., et al. 2020, CARTA: The Cube Analysis and Rendering Tool for Astronomy, 1.3.0, Zenodo, doi: 10.5281/zenodo.3746095
- Condon et al. (2002) Condon, J. J., Cotton, W. D., & Broderick, J. J. 2002, AJ, 124, 675, doi: 10.1086/341650
- Darling (2004) Darling, J. 2004, ApJ, 612, 58, doi: 10.1086/422450
- Darling (2007) —. 2007, ApJ, 669, L9, doi: 10.1086/523756
- Darling & Giovanelli (2002a) Darling, J., & Giovanelli, R. 2002a, AJ, 124, 100, doi: 10.1086/341166
- Darling & Giovanelli (2002b) —. 2002b, ApJ, 572, 810, doi: 10.1086/340372
- DeBoer et al. (2009) DeBoer, D. R., Gough, R. G., Bunton, J. D., et al. 2009, IEEE Proceedings, 97, 1507, doi: 10.1109/JPROC.2009.2016516
- Dehghan et al. (2014) Dehghan, S., Johnston-Hollitt, M., Franzen, T. M. O., Norris, R. P., & Miller, N. A. 2014, AJ, 148, 75, doi: 10.1088/0004-6256/148/5/75
- Delhaize et al. (2017) Delhaize, J., Smolčić, V., Delvecchio, I., et al. 2017, A&A, 602, A4, doi: 10.1051/0004-6361/201629430
- Donley et al. (2012) Donley, J. L., Koekemoer, A. M., Brusa, M., et al. 2012, ApJ, 748, 142, doi: 10.1088/0004-637X/748/2/142
- Eales et al. (2009) Eales, S., Chapin, E. L., Devlin, M. J., et al. 2009, ApJ, 707, 1779, doi: 10.1088/0004-637X/707/2/1779
- Franzen et al. (2015) Franzen, T. M. O., Banfield, J. K., Hales, C. A., et al. 2015, MNRAS, 453, 4020, doi: 10.1093/mnras/stv1866
- González-Alfonso et al. (2014) González-Alfonso, E., Fischer, J., Graciá-Carpio, J., et al. 2014, A&A, 561, A27, doi: 10.1051/0004-6361/201321709
- Gowardhan et al. (2018) Gowardhan, A., Spoon, H., Riechers, D. A., et al. 2018, ApJ, 859, 35, doi: 10.3847/1538-4357/aabccc
- Griffin et al. (2010) Griffin, M. J., Abergel, A., Abreu, A., et al. 2010, A&A, 518, L3, doi: 10.1051/0004-6361/201014519
- Hanish et al. (2015) Hanish, D. J., Capak, P., Teplitz, H. I., et al. 2015, ApJS, 217, 17, doi: 10.1088/0067-0049/217/1/17
- Heckman et al. (1990) Heckman, T. M., Armus, L., & Miley, G. K. 1990, ApJS, 74, 833, doi: 10.1086/191522
- Helou et al. (1985) Helou, G., Soifer, B. T., & Rowan-Robinson, M. 1985, ApJ, 298, L7, doi: 10.1086/184556
- Hess et al. (2021) Hess, K. M., Roberts, H., Dénes, H., et al. 2021, A&A, 647, A193, doi: 10.1051/0004-6361/202040019
- Heywood et al. (2022) Heywood, I., Jarvis, M. J., Hale, C. L., et al. 2022, MNRAS, 509, 2150, doi: 10.1093/mnras/stab3021
- Jarvis et al. (2016) Jarvis, M., Taylor, R., Agudo, I., et al. 2016, in MeerKAT Science: On the Pathway to the SKA, 6. https://arxiv.org/abs/1709.01901
- Jarvis et al. (2013) Jarvis, M. J., Bonfield, D. G., Bruce, V. A., et al. 2013, MNRAS, 428, 1281, doi: 10.1093/mnras/sts118
- Jonas & MeerKAT Team (2016) Jonas, J., & MeerKAT Team. 2016, in MeerKAT Science: On the Pathway to the SKA, 1
- Klöckner et al. (2003) Klöckner, H.-R., Baan, W. A., & Garrett, M. A. 2003, Nature, 421, 821, doi: 10.1038/nature01381
- Koribalski et al. (2020) Koribalski, B. S., Staveley-Smith, L., Westmeier, T., et al. 2020, Ap&SS, 365, 118, doi: 10.1007/s10509-020-03831-4
- Lo (2005) Lo, K. Y. 2005, ARA&A, 43, 625, doi: 10.1146/annurev.astro.41.011802.094927
- Lockett & Elitzur (2008) Lockett, P., & Elitzur, M. 2008, ApJ, 677, 985, doi: 10.1086/533429
- Lonsdale et al. (2003) Lonsdale, C. J., Smith, H. E., Rowan-Robinson, M., et al. 2003, PASP, 115, 897, doi: 10.1086/376850
- Maddox et al. (2021) Maddox, N., Frank, B. S., Ponomareva, A. A., et al. 2021, A&A, 646, A35, doi: 10.1051/0004-6361/202039655
- Mao et al. (2012) Mao, M. Y., Sharp, R., Norris, R. P., et al. 2012, MNRAS, 426, 3334, doi: 10.1111/j.1365-2966.2012.21913.x
- McBride et al. (2013) McBride, J., Heiles, C., & Elitzur, M. 2013, ApJ, 774, 35, doi: 10.1088/0004-637X/774/1/35
- McMullin et al. (2007) McMullin, J. P., Waters, B., Schiebel, D., Young, W., & Golap, K. 2007, in Astronomical Society of the Pacific Conference Series, Vol. 376, Astronomical Data Analysis Software and Systems XVI, ed. R. A. Shaw, F. Hill, & D. J. Bell, 127
- Miyazaki et al. (2018) Miyazaki, S., Komiyama, Y., Kawanomoto, S., et al. 2018, PASJ, 70, S1, doi: 10.1093/pasj/psx063
- Moncelsi et al. (2011) Moncelsi, L., Ade, P. A. R., Chapin, E. L., et al. 2011, ApJ, 727, 83, doi: 10.1088/0004-637X/727/2/83
- Oliver et al. (2012) Oliver, S. J., Bock, J., Altieri, B., et al. 2012, MNRAS, 424, 1614, doi: 10.1111/j.1365-2966.2012.20912.x
- Perley & Butler (2017) Perley, R. A., & Butler, B. J. 2017, ApJS, 230, 7, doi: 10.3847/1538-4365/aa6df9
- Reddy et al. (2008) Reddy, N. A., Steidel, C. C., Pettini, M., et al. 2008, ApJS, 175, 48, doi: 10.1086/521105
- Reynolds (1994) Reynolds, J. 1994, ATNF Technical Memos, 39.3/040
- Rieke et al. (2004) Rieke, G. H., Young, E. T., Engelbracht, C. W., et al. 2004, ApJS, 154, 25, doi: 10.1086/422717
- Roberts et al. (2021) Roberts, H., Darling, J., & Baker, A. J. 2021, ApJ, 911, 38, doi: 10.3847/1538-4357/abe944
- Shirley et al. (2021) Shirley, R., Duncan, K., Campos Varillas, M. C., et al. 2021, MNRAS, 507, 129, doi: 10.1093/mnras/stab1526
- Stern et al. (2005) Stern, D., Eisenhardt, P., Gorjian, V., et al. 2005, ApJ, 631, 163, doi: 10.1086/432523
- Suess et al. (2016) Suess, K. A., Darling, J., Haynes, M. P., & Giovanelli, R. 2016, MNRAS, 459, 220, doi: 10.1093/mnras/stw666
- Takeuchi et al. (2005) Takeuchi, T. T., Buat, V., & Burgarella, D. 2005, A&A, 440, L17, doi: 10.1051/0004-6361:200500158
- Willett et al. (2011) Willett, K. W., Darling, J., Spoon, H. W. W., Charmandaris, V., & Armus, L. 2011, ApJ, 730, 56, doi: 10.1088/0004-637X/730/1/56
- Wong et al. (2020) Wong, K. C., Suyu, S. H., Chen, G. C. F., et al. 2020, MNRAS, 498, 1420, doi: 10.1093/mnras/stz3094
- Wright et al. (2010) Wright, E. L., Eisenhardt, P. R. M., Mainzer, A. K., et al. 2010, AJ, 140, 1868, doi: 10.1088/0004-6256/140/6/1868