Nonlinear chirped Doppler interferometry for spectroscopy
Abstract
Four-wave mixing processes are ubiquitous in ultrafast optics and the determination of the coefficients of the tensor is thus essential. We introduce a novel time-resolved ultrafast spectroscopic method to characterize the third-order nonlinearity on the femtosecond time-scale. This approach, coined as ”nonlinear chirped Doppler interferometry”, makes use of the variation of the optical group delay of a transmitted probe under the effect of an intense pump pulse in the nonlinear medium of interest. The observable is the spectral interference between the probe and a reference pulse sampled upstream. We show that the detected signal is enhanced when the pulses are chirped, and that, although interferometric, the method is immune to environmental phase fluctuations and drifts. By chirping adequately the reference pulse, the transient frequency shift of the probe pulses is also detected in the time domain and the detected nonlinear signal is enhanced. Nonlinear phase shifts as low as 10 mrad, corresponding to a frequency shift of 30 GHz, i.e. 0.01% of the carrier frequency, are detected without heterodyne detection or active phase-stabilization. The diagonal and/or non-diagonal terms of reference glasses (SiO2) and crystals (Al2O3, BaF2, CaF2) are characterized. The method is finally applied to measure the soft vibration mode of KTiOAsO4 (KTA).
I Introduction
The third-order susceptibility tensor governs both resonant and non-resonant nonlinear processes involving four-wave mixing Sutherland:2003aa . The real part of the diagonal terms, responsible for the well-known optical Kerr-effect (OKE), plays a fundamental role in ultrafast optics where frequency-degenerated nonlinear processes are routinely used to modify, control or characterize the spatial, spectral and temporal properties of intense pulses. The non-diagonal terms of the tensor are also exploited in nonlinear processes such as cross-polarized wave generation Jullien200510-10-temporal- and are ubiquitous when intense waves of different polarizations are mixed in nonlinear media. This is, in particular, the case of most optical parametric amplifiers, which have become the backbone of third-generation femtosecond sources Fattahi:2014aa . It is thus essential to determine the coefficients of the tensor of nonlinear media ranging from common optical glasses to exotic nonlinear birefringent crystals.
Experimental methods suitable to measure the real part of the tensor are numerous Sutherland:2003aa and suffice it to say that OKE spectroscopy gathers time-resolved pump-probe techniques tracking the changes (polarization, frequency, spatial phase or temporal phase) of a weak probe pulses under the effect of an intense pump pulse in the medium of interest, either without DeSalvo1996Infrared-to-ult ; Chien:00 ; Chen:07 ; Borzsonyi:10 ; Burgin2005Femtosecond-inv or with LeBlanc:00 ; Thurston:2020aa interferometric detection. Another related approach, two-beam coupling (2BC), relies on the mutual interaction between two noncollinear beams crossing in the medium Kang:97 ; Smolorz:00 ; Smolorz:1999vf ; Wahlstrand:2013wl ; Patwardhan:21 . All these methods have their own advantages and drawbacks, but most of them require noise reduction to isolate the contribution of weak nonlinearities (averaging and/or modulation with heterodyne detection).
In this paper, we report a novel time-resolved ultrafast transient spectroscopy method to characterize third-order nonlinearity on the femtosecond time-scale. We coin this method as ”nonlinear chirped Doppler interferometry”. As explained in the next section, ”Doppler” refers to the observable, ”interferometry” describes the detection method and ”chirped” points out the fact that adequately chirped pulses are required.
The approach consists in monitoring the variation of the optical group delay of a transmitted probe under the effect of an intense pump pulse, instead of the phase changes. We demonstrate that, under certain chirp conditions, two distinct physical effects (spectral and temporal shifts) add up and that monitoring the optical group delay, via spectral interferometry, gives access to the nonlinear phase value and therefore to the nonlinear tensor terms of the medium of interest. We show, both theoretically and experimentally, that the method is:
-
1.
interferometric but immune to environmental phase fluctuations and drifts: no active stabilization or shielding of the interferometer is required,
-
2.
highly sensitive: nonlinear phase-shifts as low as 10 mrad can be detected without heterodyne detection,
-
3.
selective: self-focusing although visible on the experimental data does not affect the measurement,
-
4.
polarization sensitive: non-diagonal terms of the tensor can be independently measured,
-
5.
temporally-resolved: both instantaneous and delayed nonlinear processes can be investigated.
The paper is organized as follows. The theoretical line-out of nonlinear chirped Doppler interferometry is described in section 2. The experimental setup and nonlinear materials are then described in section 3. Section 4 presents measurement results : validation of the technique with known isotropic and -anisotropic materials, followed by soft vibration mode measurement in an anisotropic crystal (KTA).
II Principle
The setup is essentially a frequency-degenerated pump-probe experiment with an interferometric detection. As justified below, the probe optical group delay as a function of pump-probe delay is monitored, rather than the phase.
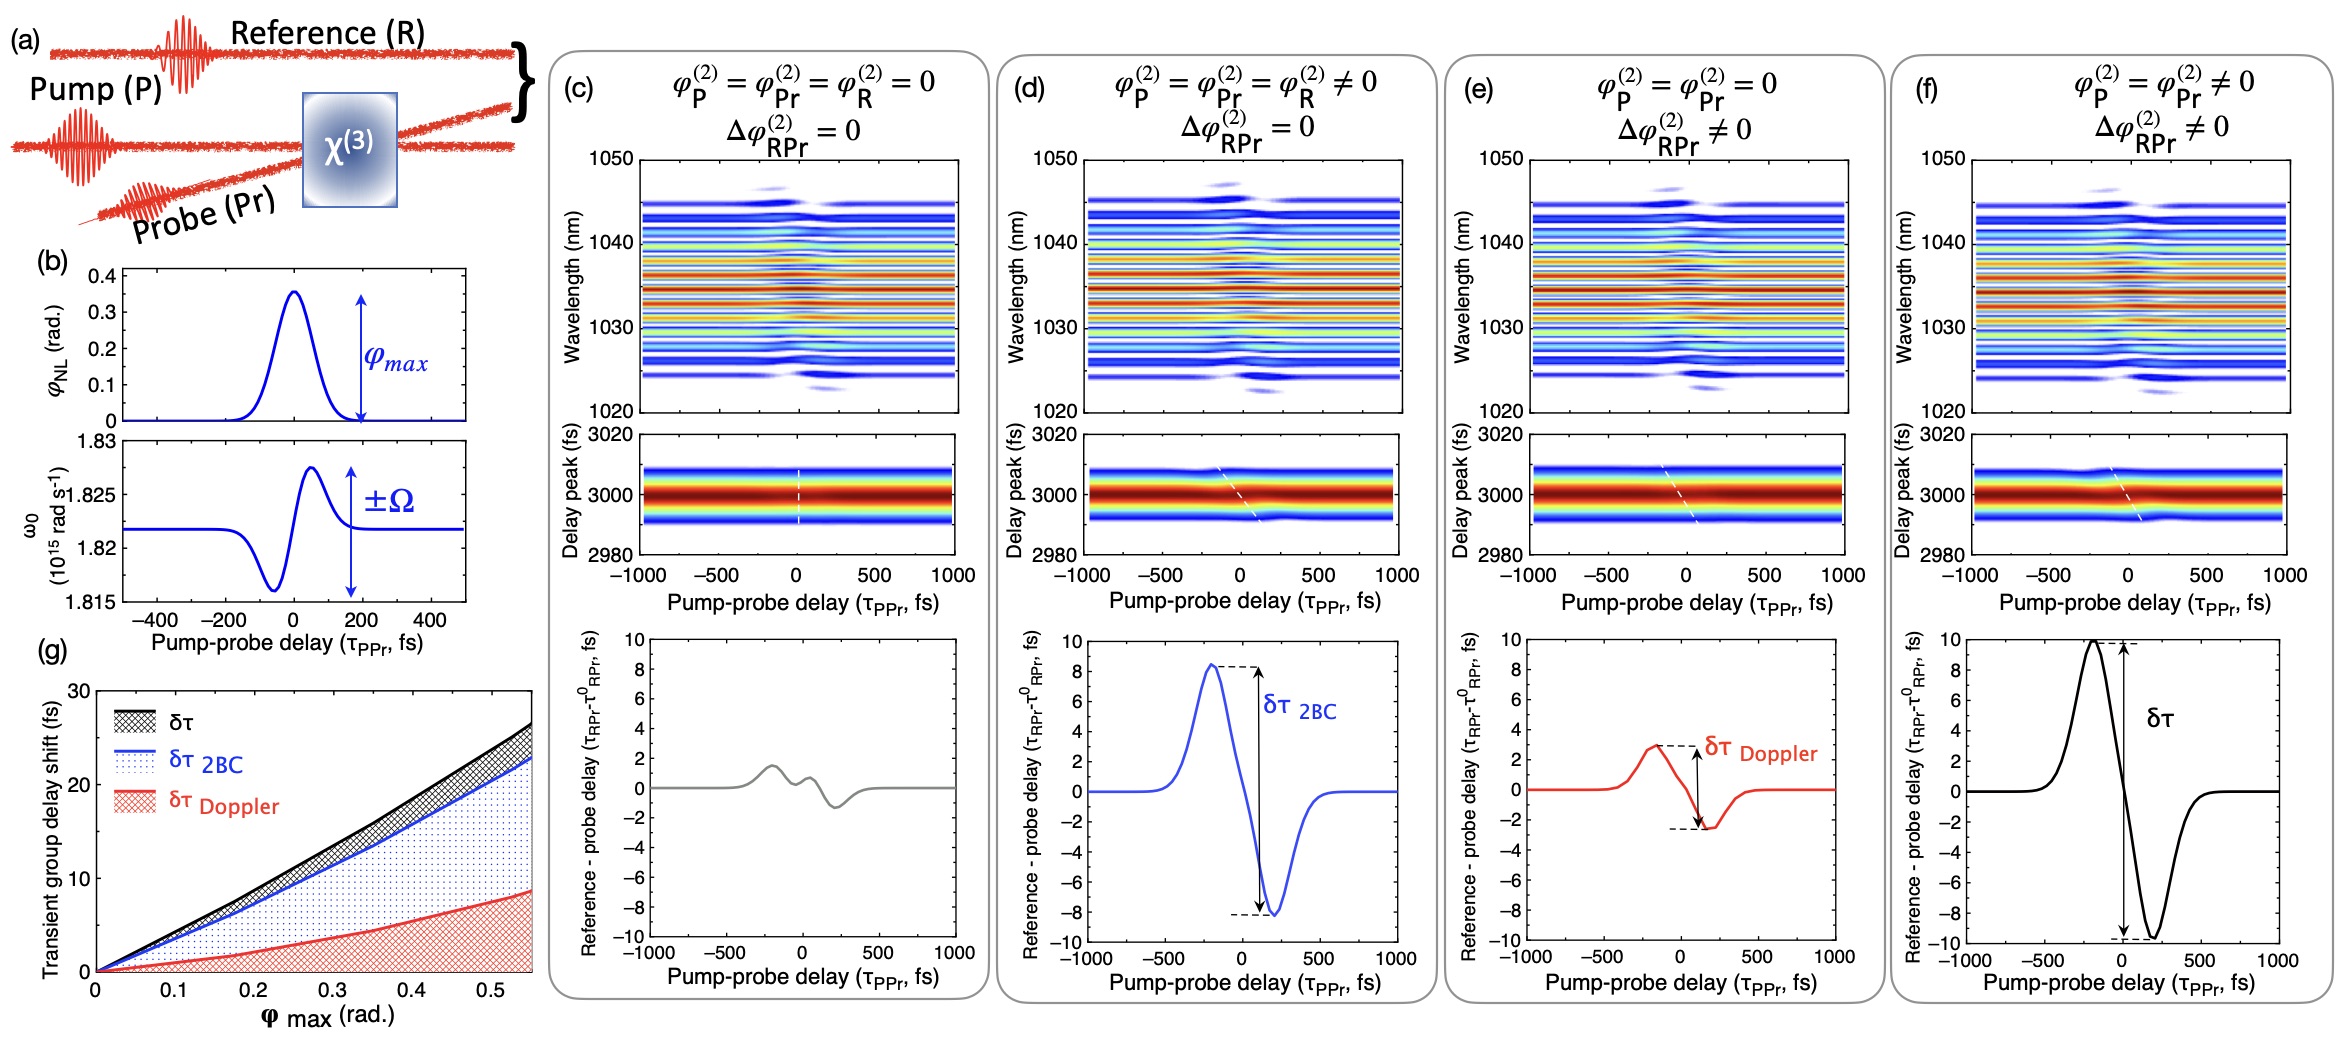
An illustration of the principle is available in Fig. 1a. A strong pump beam () and a weak probe beam (), of identical carrier frequency , are weakly focused and cross in a thin optical sample. A small angle () is introduced between the two beams to allow a spatial separation before/after the sample and a delay line controls the relative group delay between the two pulses (). Through cross-phase modulation (XPM), the probe pulse undergoes a transient nonlinear phase shift . The temporal dependence of causes a shift of the probe’s instantaneous carrier frequency, (Fig. 1b): an down-shift (shift toward the ”red”) on the rising edge of the pump pulse and a up-shift (shift toward the ”blue”) on the trailing edge of the pump pulse (for a medium characterized by a positive nonlinear index ) Boyd1992Nonlinear-optic . is proportional to the nonlinear phase, and thus to the involved term Boyd1992Nonlinear-optic . An interpretation of this effect relies on the fact that, because of the nonlinear index of refraction, the probe pulse propagates in a medium of increasing/decreasing optical thickness. This is as if the radiation source were moving away from or toward the observer, causing an (unrelativistic) Doppler effect on the observed probe frequency. For this reason, the frequency shift will be referred to as a the nonlinear Doppler shift hereafter. In nonlinear spectroscopy, can be extracted from the transient variation of , although with little precision Ripoche:1997aa . We assume in the following that this frequency shift, noted , is small compared to the optical bandwidth such that .
Let , and be the complex spectral amplitudes of, respectively, the pump, reference and probe pulses. Their respective spectral phases are , , with the convention where is the wave label. Spectral phases are hereafter assumed as purely quadratic, with chirp coefficients respectively labeled . The spectral phases thus write
| (1) |
where stands for the group delay.
The coupling between the pump and probe beams is treated elsewhere, and can be described by the following propagation equation for the probe field Wahlstrand:2013wl in the limit of a purely electronic nonlinearity:
| (2) |
where is the time-dependent pump intensity, the group index at , and is the nonlinear coupling coefficient. This expression holds as long as the input polarization states of the pump and probe beams are either parallel or perpendicular with respect to each other. The general expression of is rather complex and depends on the polarization states of the pump and probe pulses as well as on the crystallographic orientation and symmetry of the sample. For an isotropic medium, far away from any resonance, the expressions of in SI units, for respectively parallel and perpendicular polarizations, are:
| (3) | ||||
| (4) |
The propagation equation Eq 2 assumes slowly varying envelopes and neglects temporal dispersion which is compatible with the thin medium assumption and/or narrowband pulses. The effect of the pump field is three-fold: the group index is increased by (left member of Eq.2), and two nonlinear source terms contribute to the propagation (right member of Eq.2). The first source term corresponds to XPM and is responsible for the Doppler frequency shift , while the second term induces gain and loss via an energy transfer between the two beams (2BC). The interplay between these three effects is rather complex but, to simplify, the change in wave velocity can be neglected while the XPM and 2BC may significantly reshape the transmitted probe pulse in both the spectral and time domains. As a general result, the optical group delay of transmitted probe pulse is altered when the pump and probe pulses overlap. For the sake of clarity, the probe group delays with and without the pump beam are respectively noted and .
As cannot be measured directly, the transmitted probe pulse is recombined with a reference pulse (in this case a replica selected upstream) and the relative group delay between reference and probe is measured instead. We note so that . The relative delay , which is kept constant during the experiment, is chosen adequately so as to be able to resolve the phase difference between the probe and reference pulses by spectral interferometry: where is the spectral resolution of the spectrometer. For plane waves, the spectral interference pattern between the transmitted probe and the reference writes:
| (5) |
contains one non-oscillating term (DC term) and two conjugate oscillating terms (AC terms), the Fourier-transform of which is:
| (6) |
If (ie case, without the pump wave), then is equal to the Fourier-transform of , and the AC terms are centered at and well separated from the DC term at . To anticipate on the following paragraphs, four-wave mixing introduces additional contributions to the optical group delay of the probe pulse and tends to shift the location of the AC terms from to (our observable). As shown below, this definition actually aggregates two distinct physical effects.
A numerical resolution of Eq.2, described in the S.M., is proposed for a pump pulse duration of 180 fs FWHM, = 300 GW/cm2 and a crystal of 1 mm length characterized by a nonlinear index . The corresponding nonlinear XPM phase is 300 mrad. Pump and probe pulses are equally chirped, with a chirp coefficient of either = = 0 fs2, or . Reference pulse has a chirp coefficient of = + , with either = 0 fs2 or = +2000 fs2. The initial group delay between the probe and the reference pulses is =3 ps. As our toy model is unidirectional, spatial effects such as Kerr lens and self-diffraction are not simulated.
We first consider the case , i.e. all involved pulses are limited by Fourier transform. The spectral interferogram as a function of pump-probe delay, , is plotted in Fig. 1c. The Doppler transient spectral shift appears for , when the pump and probe pulses temporally overlap. For each pump-probe delay, the discrete Fourier transform of the spectral interferogram is computed and the relative group delay between the reference and probe pulses () is retrieved by fitting the AC peak with a Gaussian function. As shown on Fig. 1c, varies with the pump-probe delay . When none of the three pulses are chirped, weak variations are observed, indicating that, to the first order, the optical group delay of the transmitted probe pulse is constant despite the spectral/temporal reshaping effects.
We then consider , i.e. the three pulses are equally chirped. Because of this chirp, the instantaneous frequencies of the pump and probe pulses are detuned with respect to each other when and energy flows from one wave to the other during the nonlinear interaction (2BC becomes dominant). If the chirp coefficient is positive, the probe will gain energy for negative pump-probe delays and vice versa. As this energy transfer also scales with the pump intensity, the general effect is a reshaping of the temporal profile which is indistinguishable from an additional optical group delay (Fig. 1d). For negative pump-probe delays (resp. positive), the rear edge (resp. the leading edge) of the probe is strengthened, resulting in a overall increase (resp. decrease) of the group delay. As a result exhibits a Z-shape, similar the transient probe transmission reported for two-beam coupling Kang:97 ; Smolorz:00 ; Smolorz:1999vf ; Patwardhan:21 .
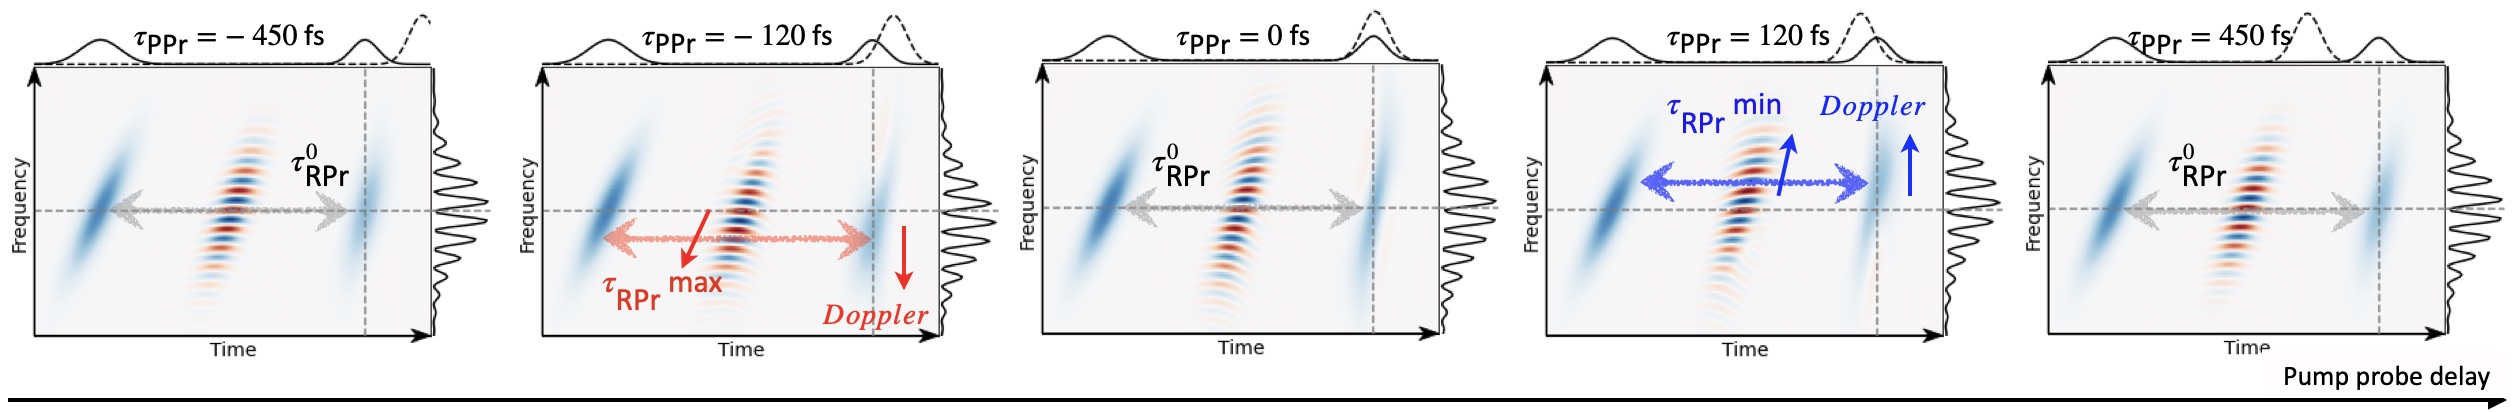
We now consider the case of unchirped pump and probe pulses with a positively chirped reference pulse (Fig. 1e). The reference pulse being chirped, the Doppler spectral shift is temporally encoded in the interferogram and (also) appears as a delay . As plotted in Fig. 1e, this effect produces a similar Z-shape behaviour, although less pronounced than in the former case - but scaling linearly with . To illustrate the principle of spectral encoding, we represent in Fig. 2 the Wigner-Ville distributions of the transmitted probe and of the delayed and chirped reference pulse. As developed in the supplementary material, the linear relationship between the nonlinear Doppler shift () and the relative chirp between probe and reference () can be retrieved analytically from Eq.6.
We have evidenced here two phenomena: temporal reshaping and temporal encoding of the nonlinear spectral shift. They originate from different mechanisms but are the two sides of the same coin. Although the differences between the spectrograms in Fig. 1 are not visible to the naked eye, the Fourier analysis shows that both mechanisms result in similar transient shifts of , over the same temporal scale (the correlation width of the pump pulse), and with similar amplitudes (a few fs). With the right chirp parameters, these two contributions may add up and increase significantly the global signal-to-noise ratio of the measurement, as shown in Fig. 1f. The delay swing is then evolving linearly with the nonlinear phase amount, as plotted in Fig. 1g. As will be demonstrated experimentally in the next section, measuring instead of phase changes not only makes the detection insensitive to phase fluctuations but also gives additional means to enhance the sensitivity and specificity (Fig. 1g) of the detection, without resorting to heterodyne detection.
III Experimental methods
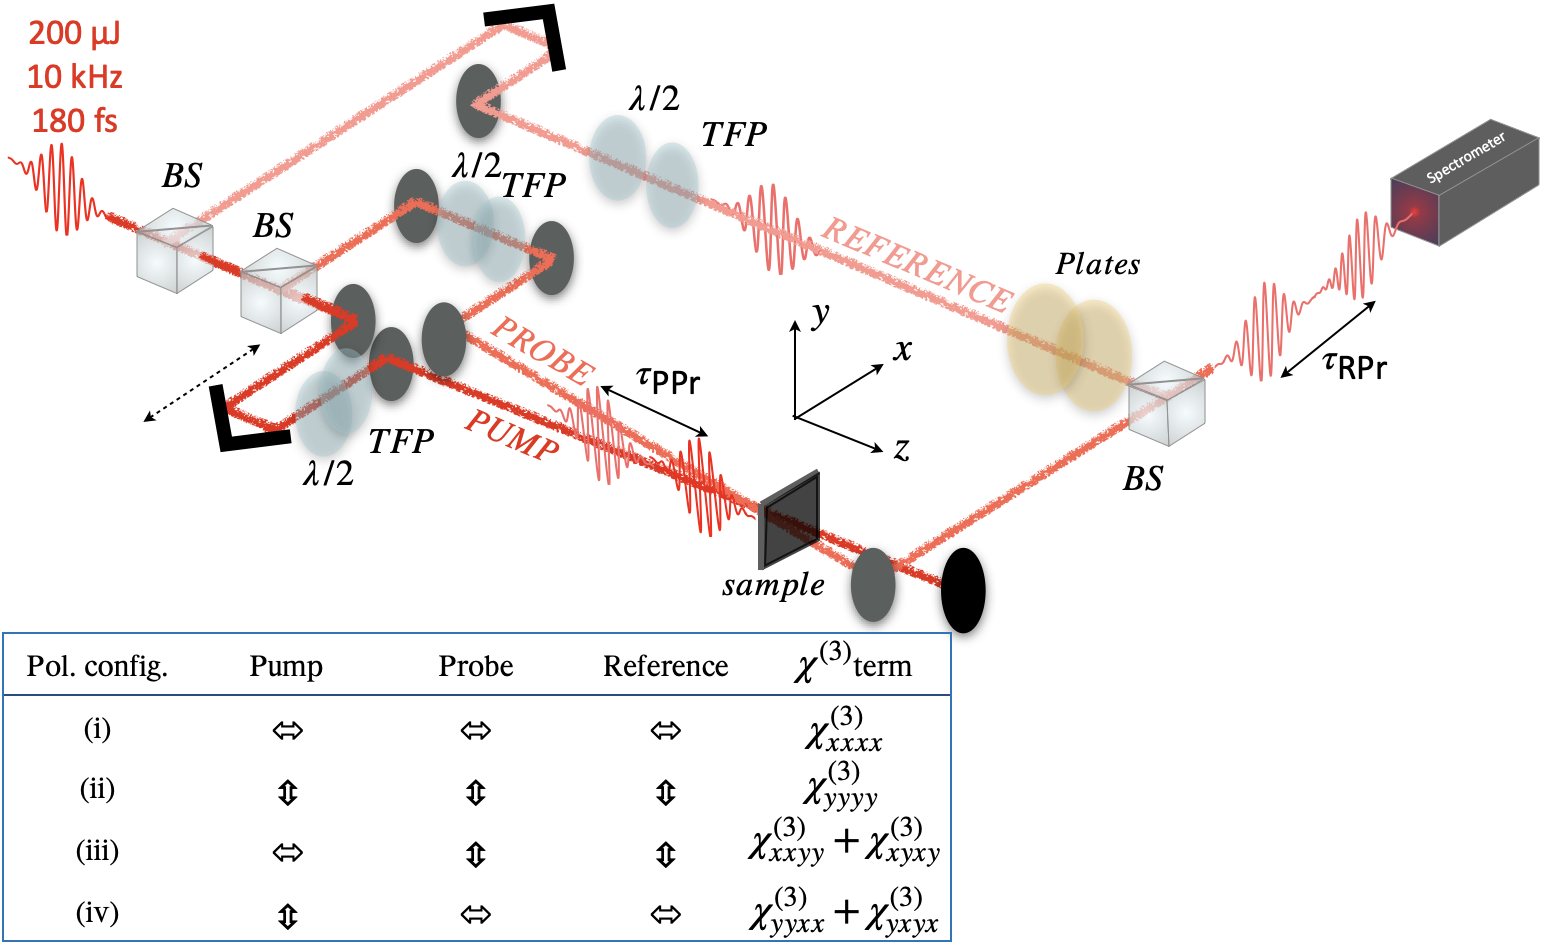
In the present experiments, a Pharos laser system (PH1-SP-1mJ, Light Conversion) delivers 180 fs FTL pulses, with a central wavelength of 1034 nm, a repetition rate of 10 kHz, and pulse energy up to 500 J. The laser chirp can be tuned by adjusting the compressor. Each pulse is split into three separated pulses: an excitation pump pulse, a probe pulse (20% of the pump energy), and a reference pulse selected before the nonlinear stage (Fig. 3). The pump and probe pulses are focused (f = 1.5 m) and overlap in the focal plane under a small angle with a pump beam size of about 550 m. The pump-probe delay () is controlled with a delay stage equipped by a motorized actuator with K-Cube controller (models Z825B and KDC101, Thorlabs). After the interaction, the probe is selected and recombined with the reference pulse. The nominal group delay between the reference and the probe pulses () is set to 3.50.15 ps for all measurements. The two pulses, probe and reference, are respectively chirped through the addition of various bulk plates: SF11 (20 mm, ), CaCO(10 mm, )Ghosh:99 and AlO (5 mm, )Malitson:72 . The resulting interference pattern is collected by a spectrometer (Avantes, spectral resolution 0.07 nm) for each step of the optical delay stage in the pump arm. The polarization and energy of each pulse are controlled by half-wave plates and thin-films polarizers (TFP). The different components of the tensor can then be measured by changing the polarization state of the three pulses.
The detailed procedure for data acquisition and analysis can be found in the S.M. To summarize, for each acquisition scan, is scanned (single scan) from -2.6 ps to 2.6 ps with temporal steps of 13 fs (400 spectra per scan). The integration time of the spectrometer is 1 ms (total acquisition time ¡1 mn, limited by the delay stage). The probe-reference delay and relative chirp are measured before each acquisition, out of pump-probe temporal overlap. is computed by fitting the modulus of the AC peak with a Gaussian function after discrete Fourier transform. The relative phase between the probe and reference pulses was also retrieved by Fourier filtering, so as to compare our analysis with usual nonlinear phase measurements.
The method was validated against a set of isotropic materials for which the nonlinear refractive indices are well known : fused silica (1 mm, at 1030 nm) Kabacinski:19 , barium fluoride (0.5 mm, at 1064 nm) Adair1989nonlinear-refra , sapphire (1 mm, at 1030 nm) Major:04 and calcium fluoride (1 mm, at 1030 nm) Kabacinski:19 . All plates are uncoated. In order to check the validity of various polarization configurations, we also characterized a barium fluoride crystal, with holographic crystallographic orientation, which is known to present an anisotropy of its third-order nonlinearity, , defined as follows Minkovski2004Nonlinear-polar ; Canova2008Efficient-gener :
| (7) |
IV Results
The method is validated in three steps. We first compare the toy model with experimental data and measure the swing amplitude of with respect to the relative chirps and nonlinear phase. We then measure the diagonal third-order tensor coefficient of a set of well-known isotropic samples. Last, we vary the polarization states of the pump and probe beams, characterize the nonlinear anisotropy of barium fluoride and compare the measured coefficients with the reported values. Finally, we investigate the instantaneous and delayed nonlinear properties of potassium titanyl arsenate crystal (KTA).
IV.1 Comparison with the toy model
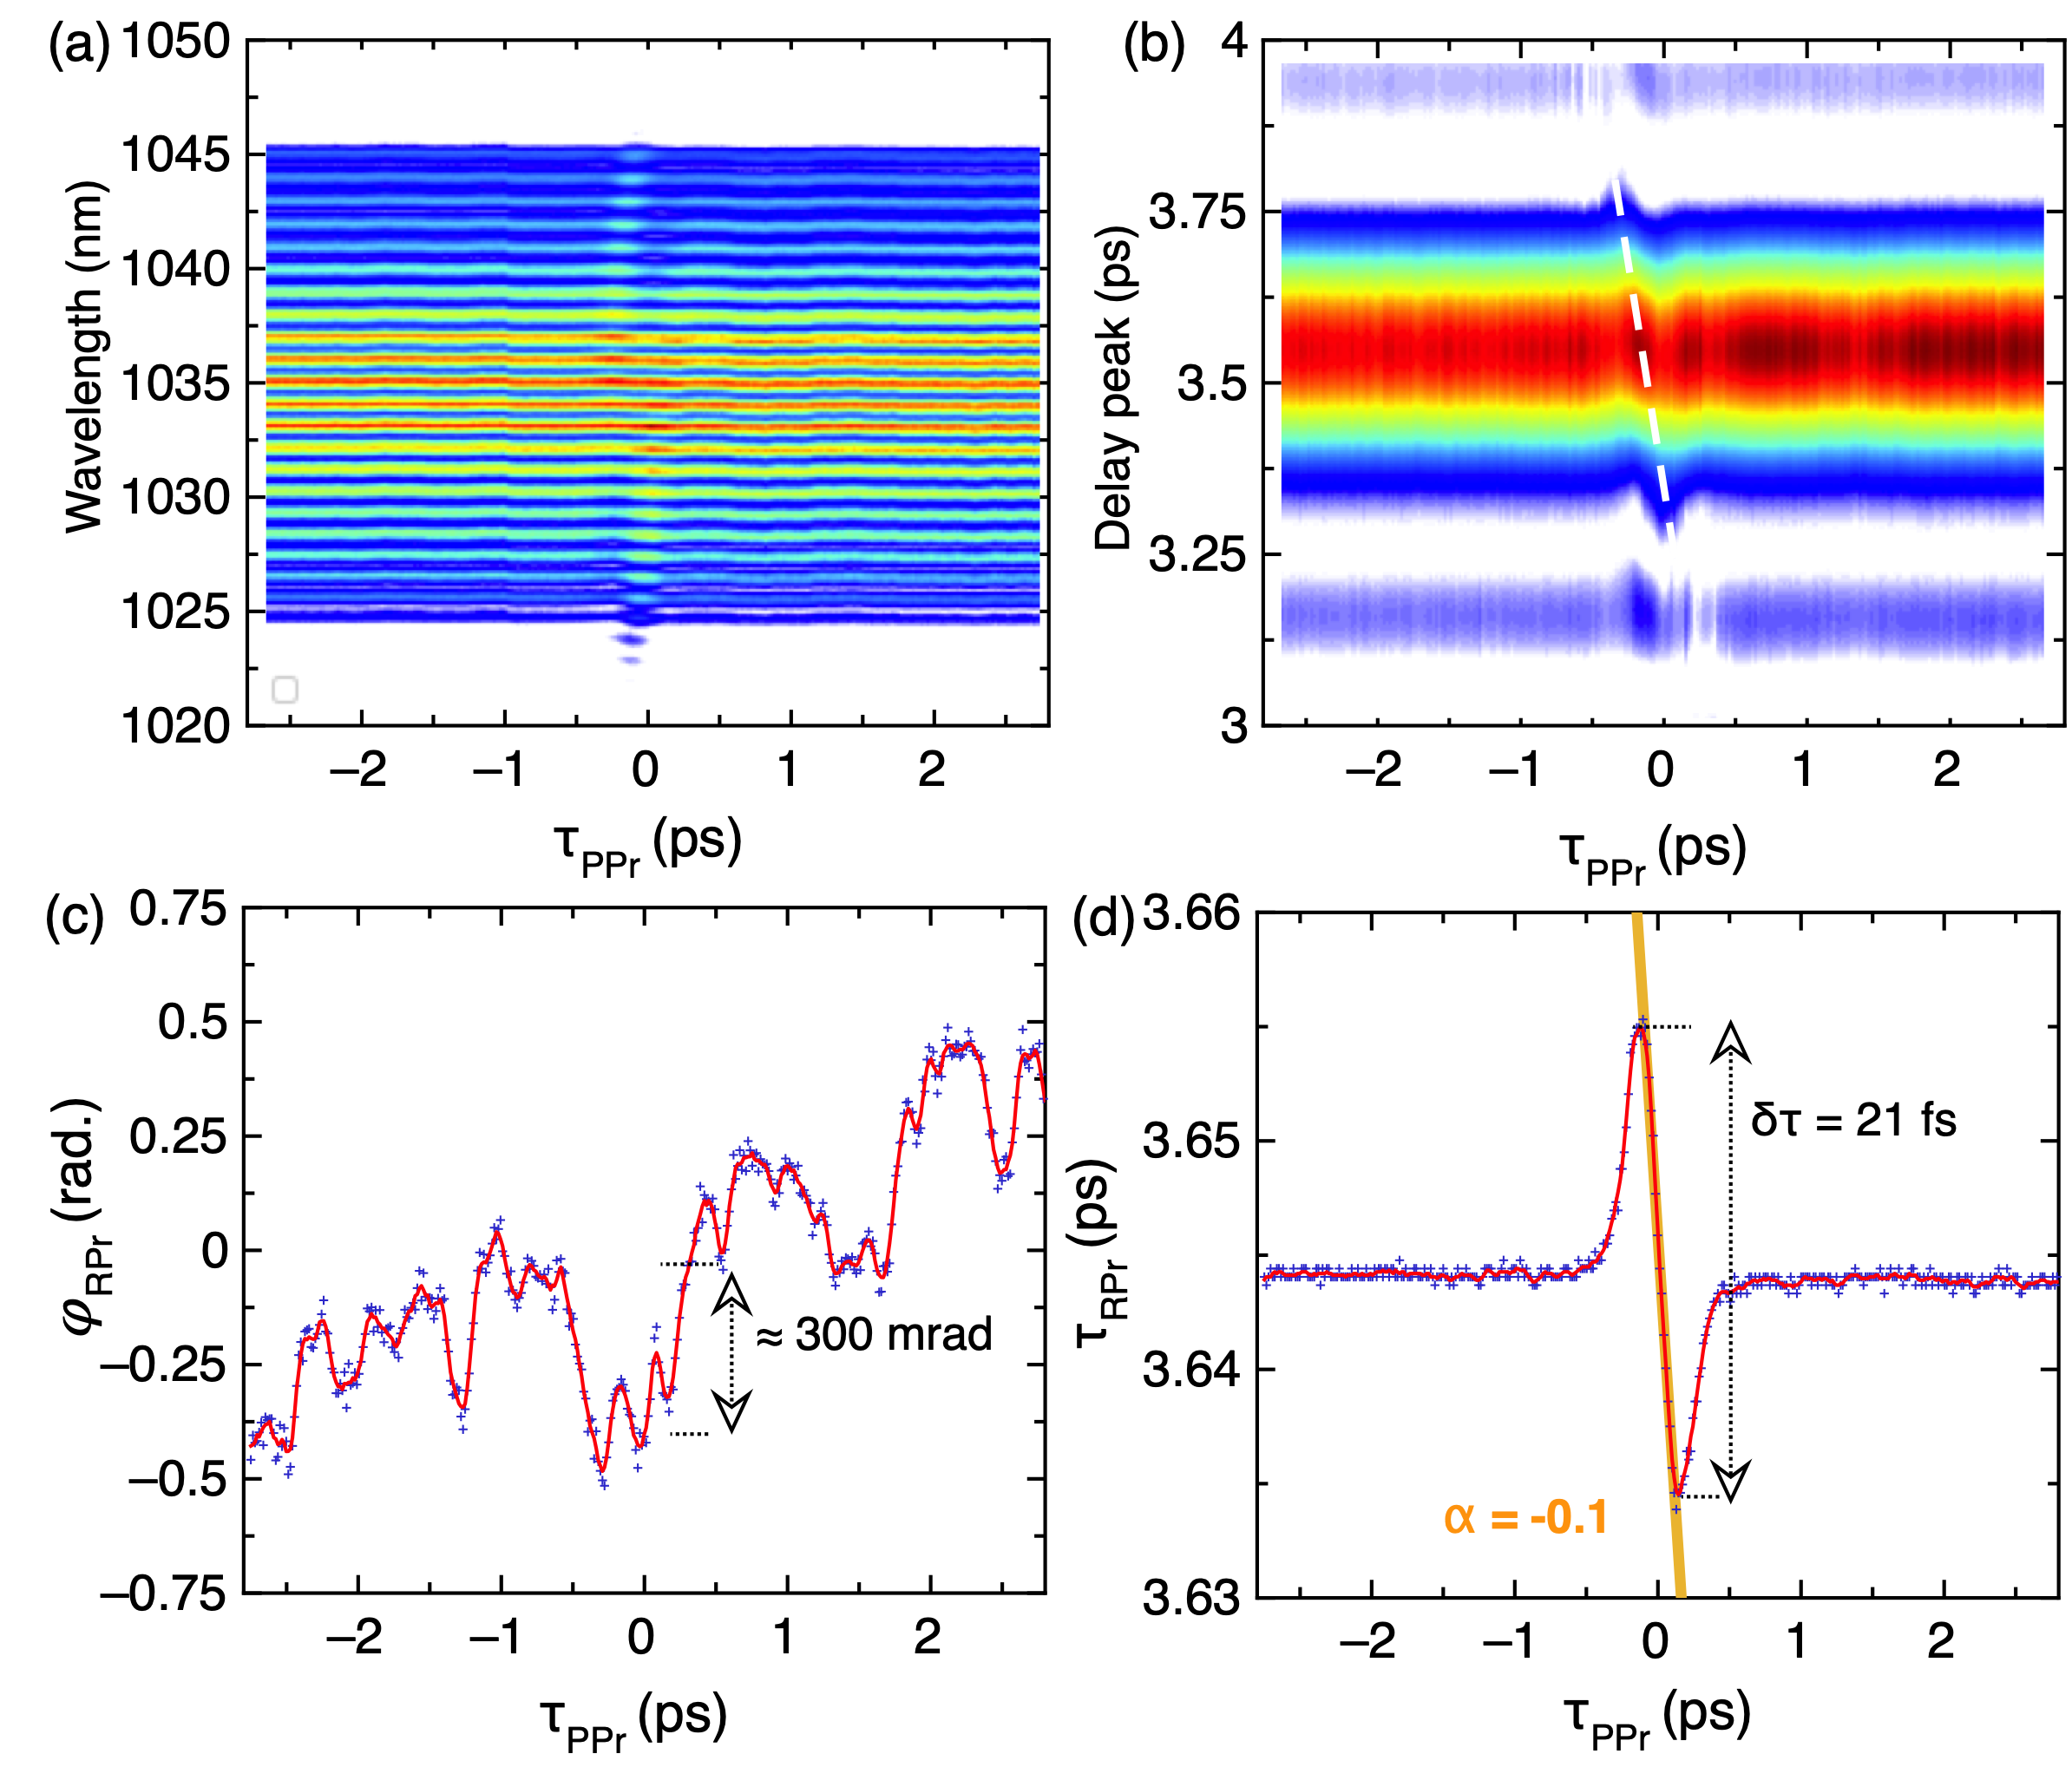
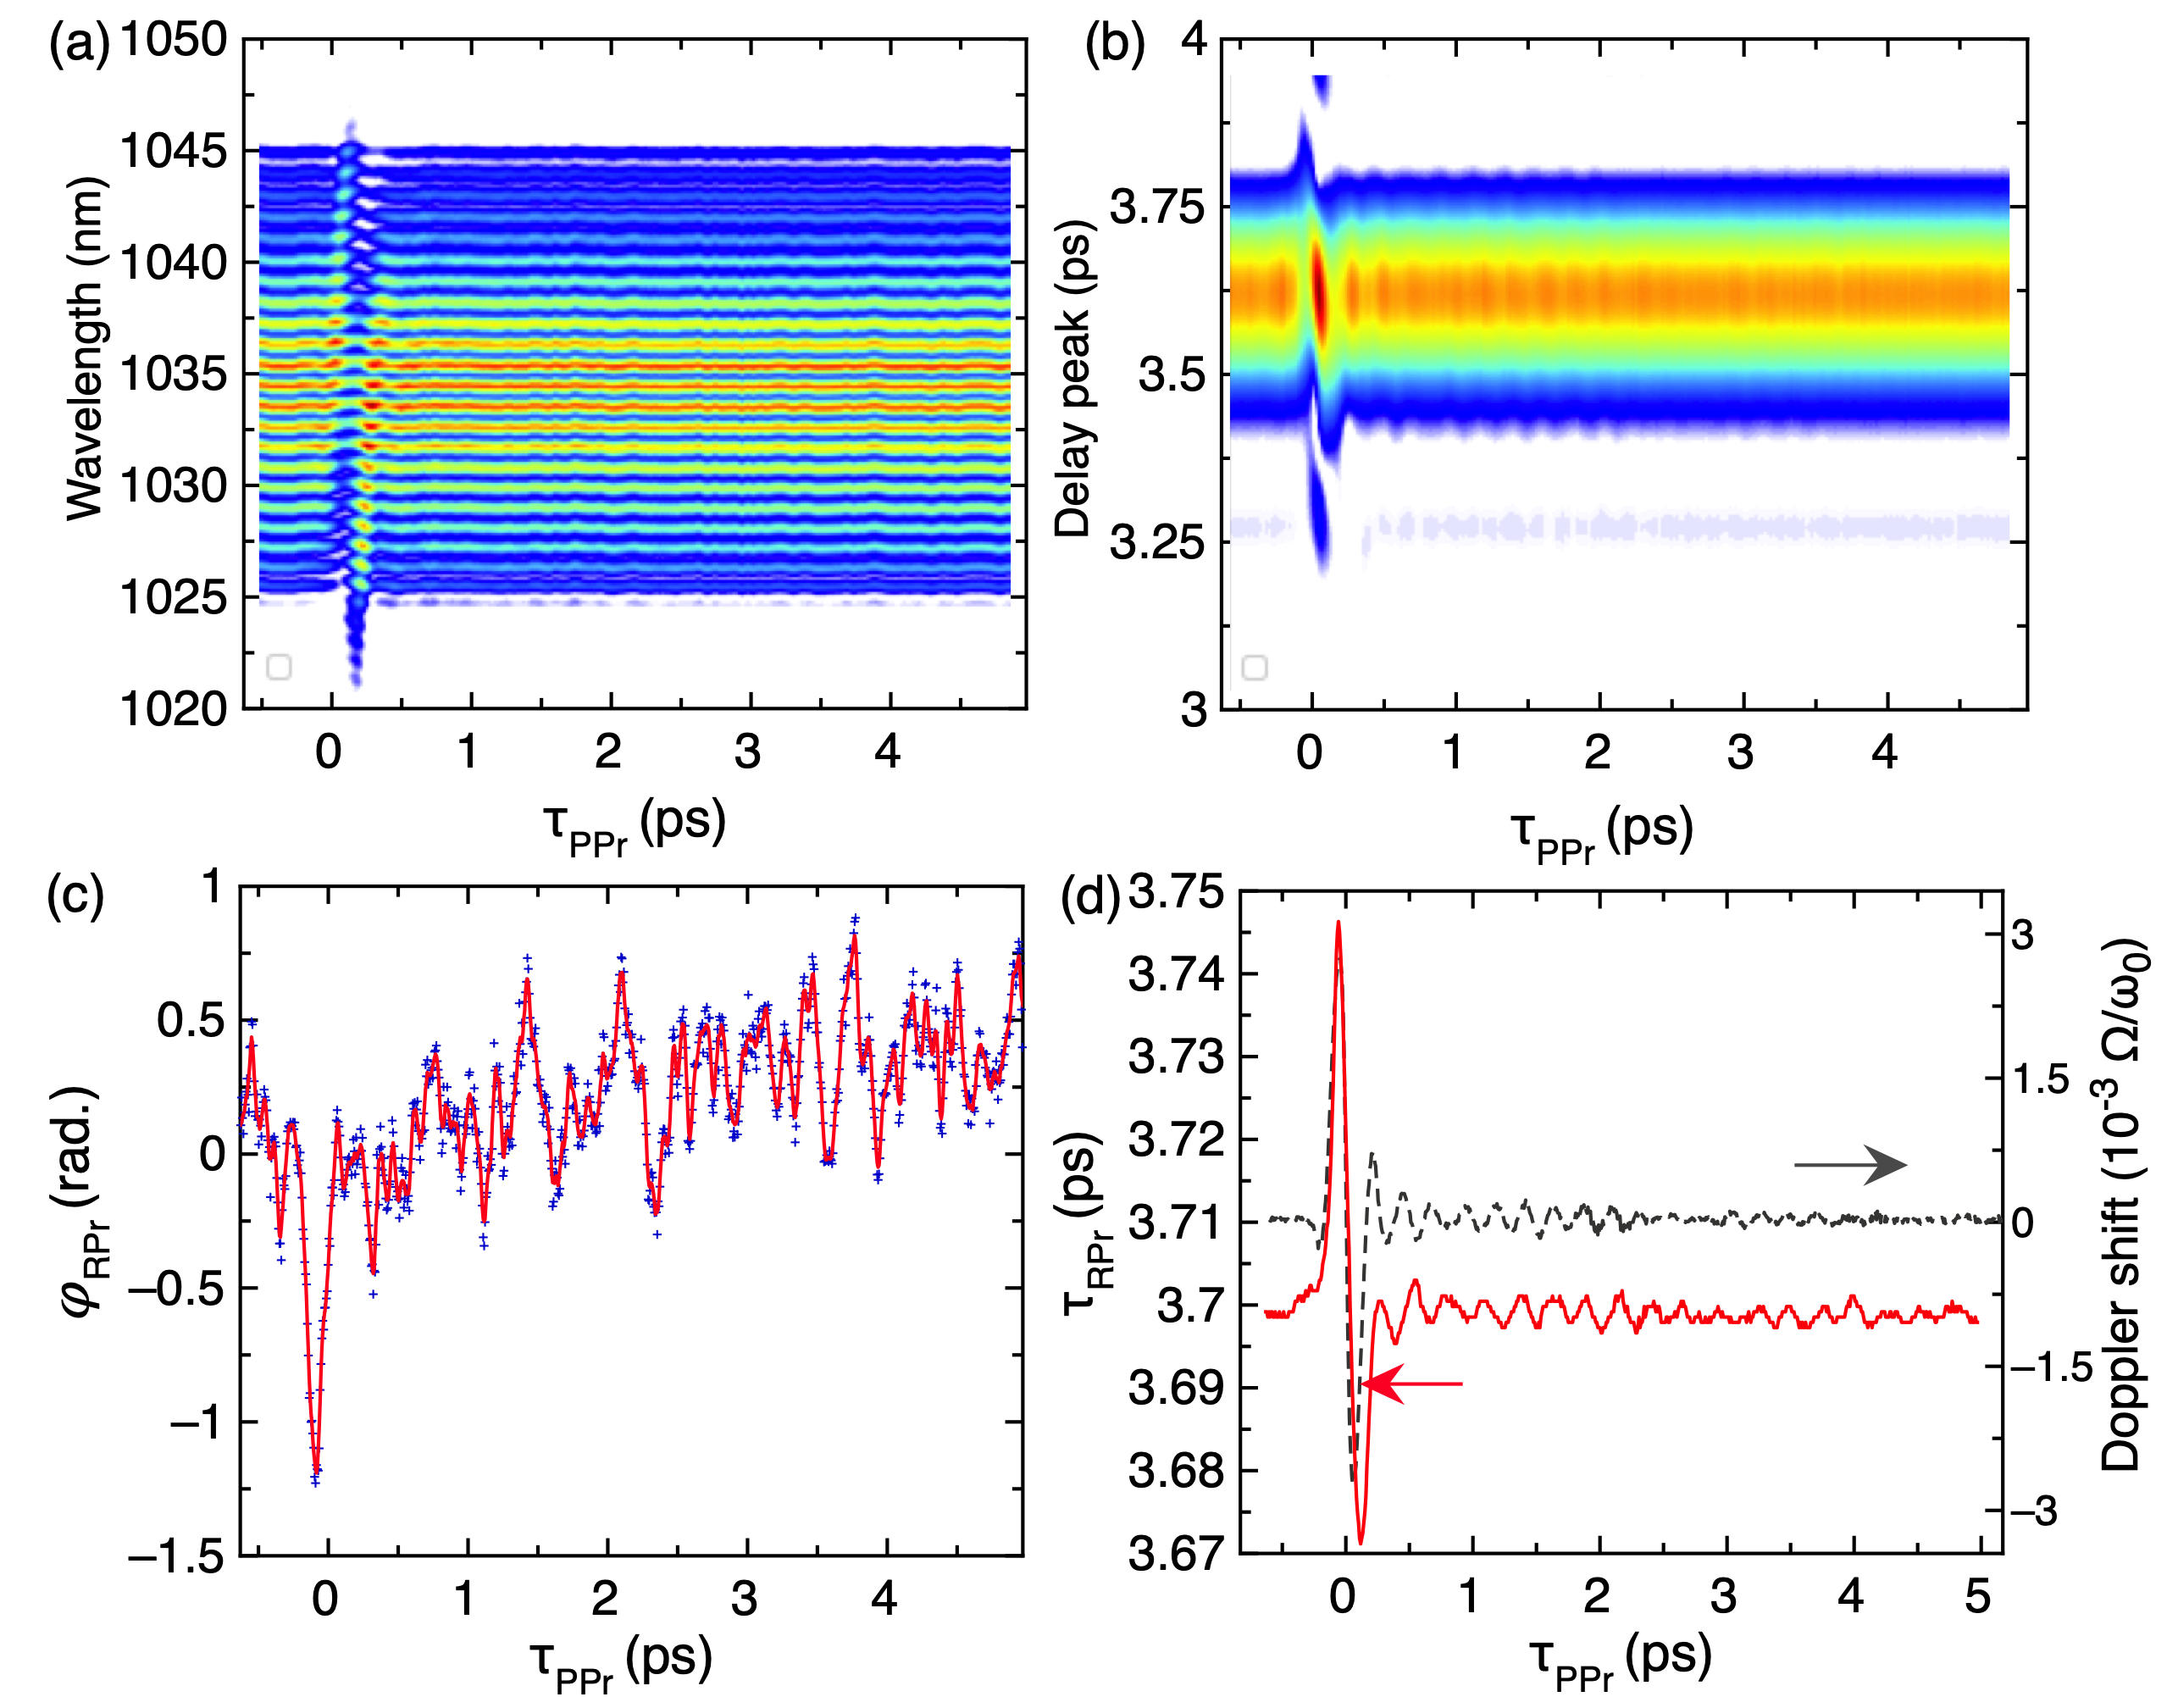
All polarization directions are first set to horizontal. The pump energy is 40 J, which corresponds to a pump peak intensity estimated to 300 GW/cm2 on the sample. The measured chirp coefficients are and . Fig. 4 gathers typical experimental results acquired for a 1 mm c-cut sapphire crystal. As expected (Fig. 4a), in the vicinity of , a red-shift is observed for while a blue-shift is observed for . Self-focusing is visible on the experimental data as a transient signal decrease but does not affect the measurement. A close-up of the Fourier transform near +3.5 ps is shown in Fig. 4b. The transient shift of the peak position () is clearly distinguishable. The latter, plotted in Fig. 4d, shows the characteristic z-shape, in excellent agreement with Fig. 1. The delay swing = 21 fs is obtained for with a linear dependence of the signal between these two extrema (slope of -0.1). For the sake of comparison, Fig. 4c represents the relative phase between the reference and the transmitted probe pulses extracted from the spectrogram by Fourier filtering. This metric is the quantity usually measured to determine the value of the non-linear phase. However, as can be seen on Fig. 4c, can hardly be distinguished from the phase noise (fluctuations and drifts) added by the interferometer. The comparison between figures 4c,d helps to appreciate the improvement in signal-to-noise ratio of our method. Monitoring the group delay rather than the spectral phase is indeed insensitive to phase fluctuations and makes it possible to measure a nonlinear signal at least an order of magnitude times weaker.
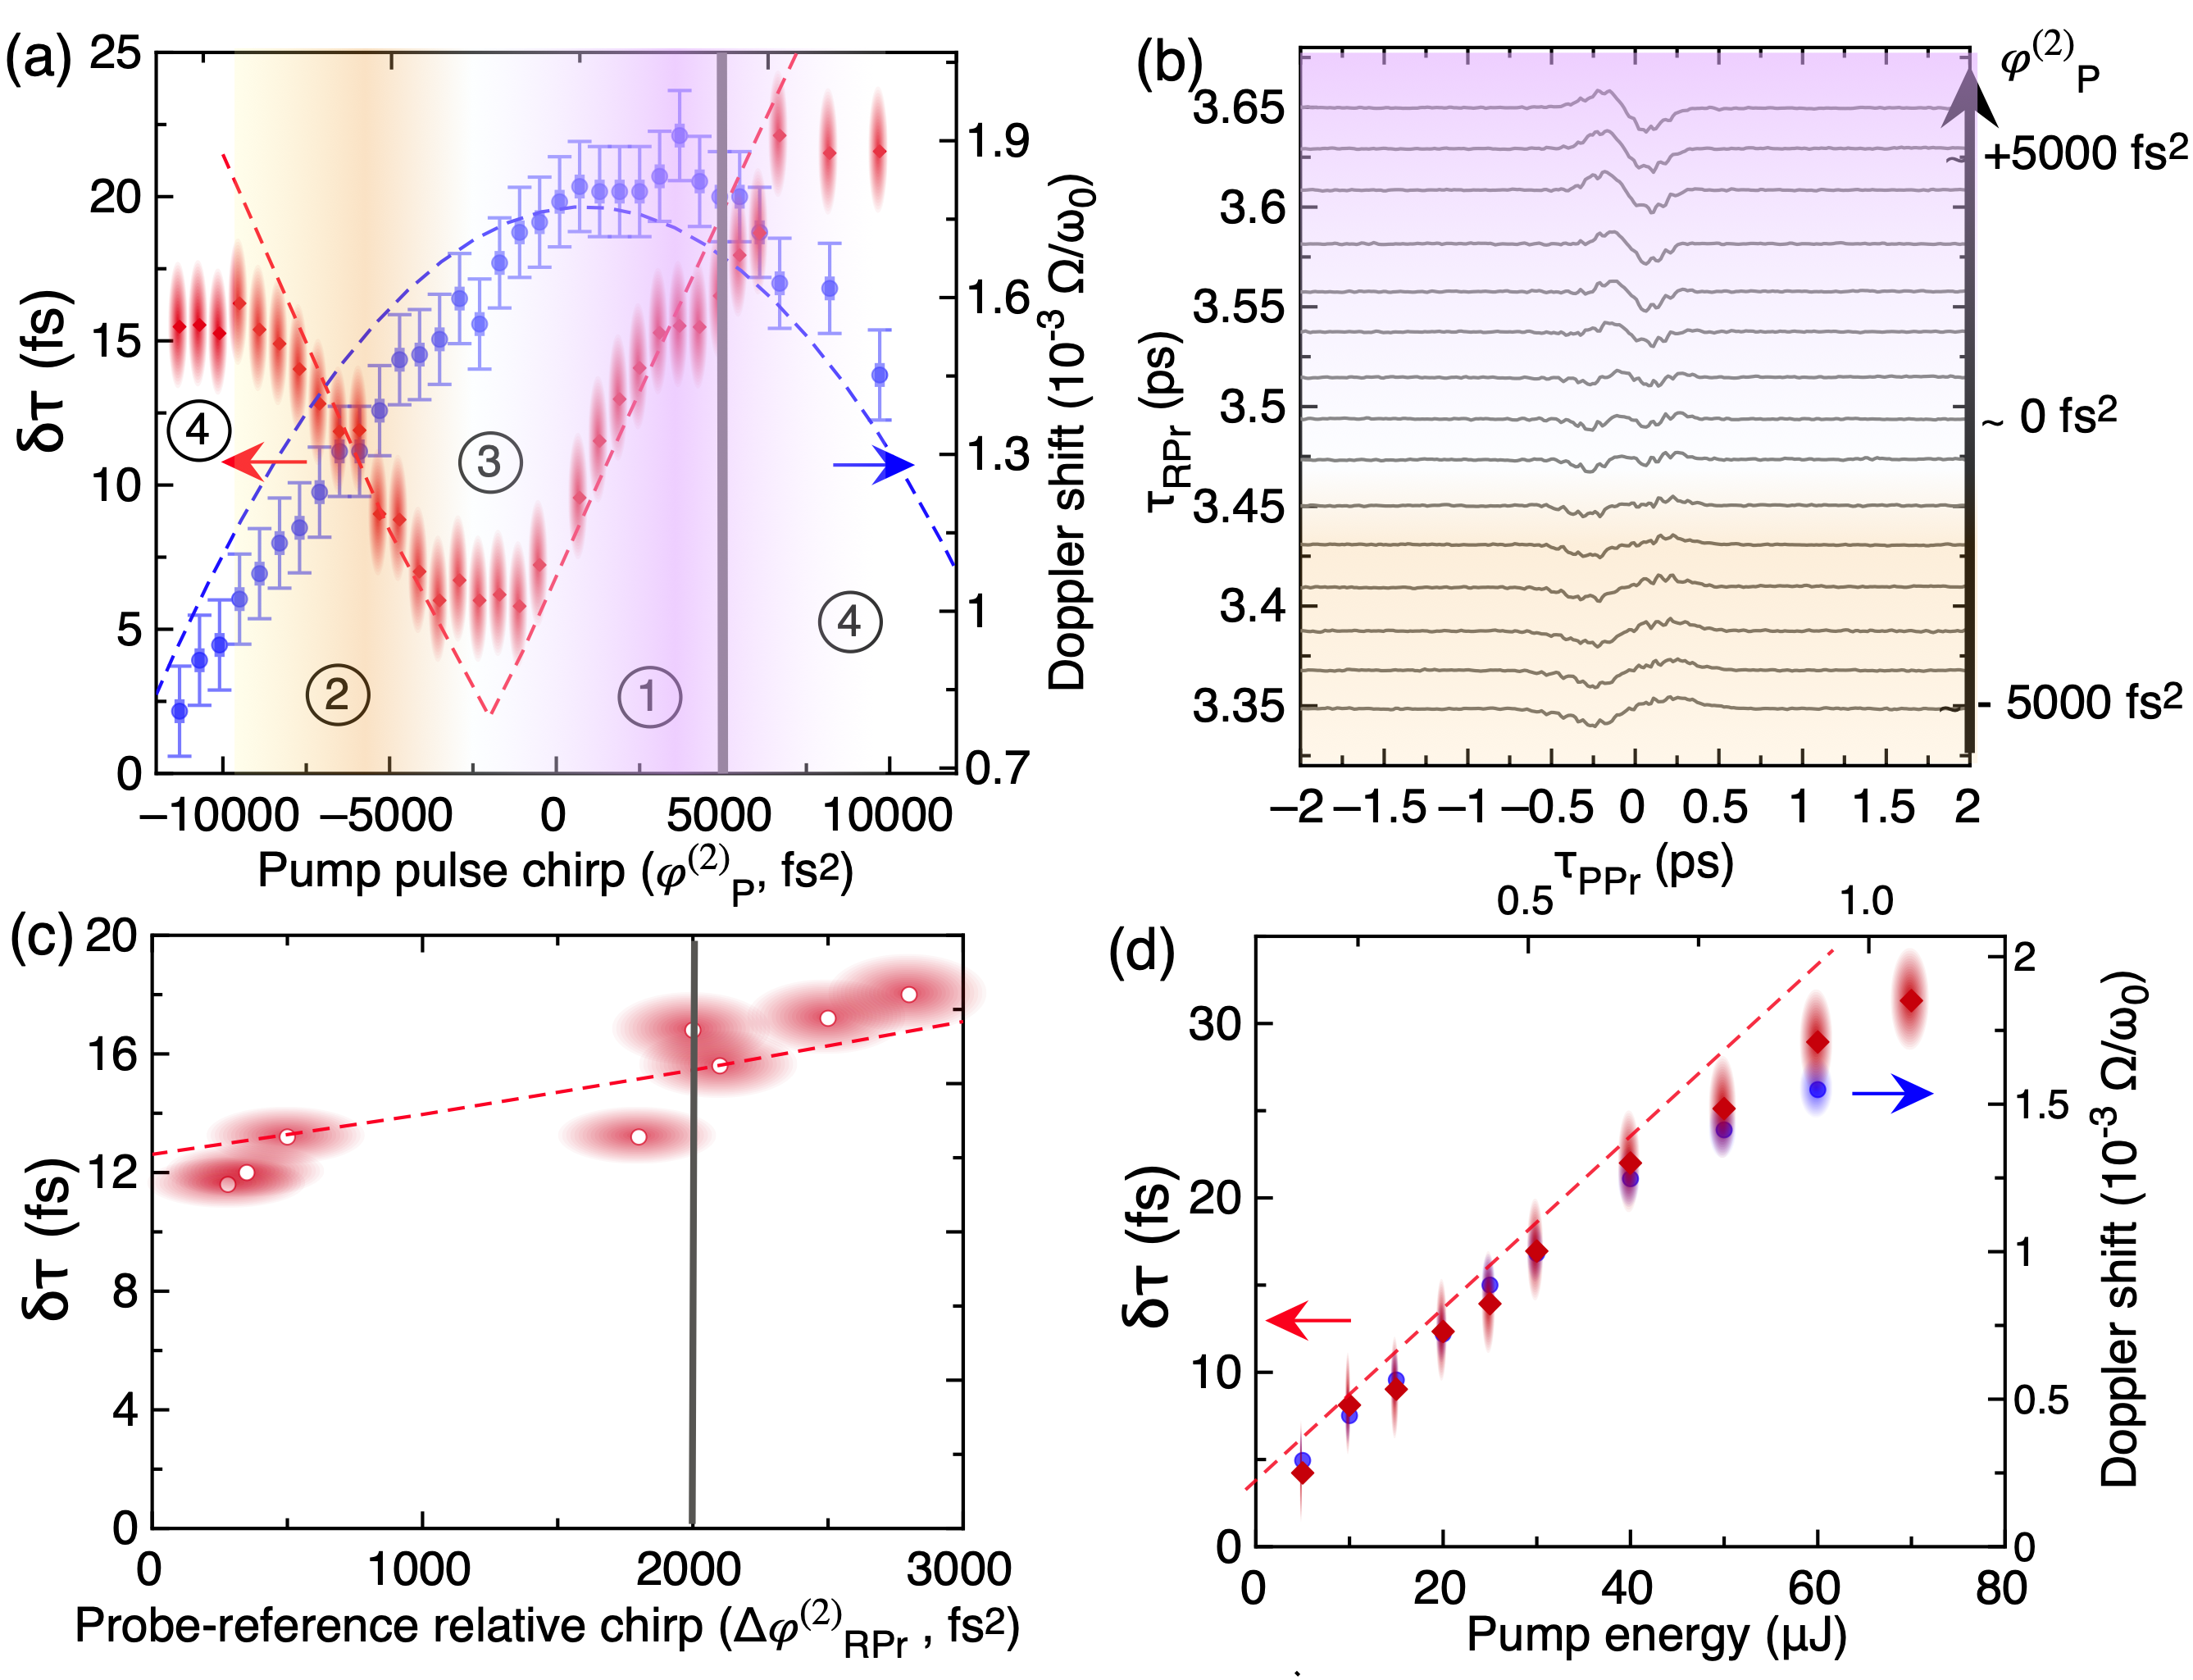
Starting from this working configuration, we then characterize as a function of (i) input chirp (controlled by the grating compressor), (ii) (controlled by adding/removing bulk in the reference beam path) and, (iii) pump energy - all other experimental parameters being kept constant. The acquired raw data are shown in Fig. 5. As explained in section 2, the input chirp mainly triggers 2BC, meanwhile tunes temporal encoding of the Doppler shift. The toy model reproduces well the variations of and (normalized with respect to ) with the input chirp (Fig. 5a). The Doppler shift follows the parabolic evolution of pump intensity, with a maximum close to pulse compression. Conversely, varies mostly linearly (V-shape) around a minimum, staggered from the compression. We can distinguish several trends, as labelled in Fig. 5a. For moderate positive input chirp (1), the Doppler shift remains mostly constant (i.e. so is the nonlinear phase) while exhibits a linear increase with the chirp value, emphasizing how the signal to noise ratio is enhanced by 2BC. This area then defines the efficient working conditions of our method. For negative input chirp (2), similar trend is observed, but with a reversed Z-shape, as shown in the raw data in Fig. 5b. Reversing the sign of the chirp is in fact equivalent to modify the sign of the energy couplings between the pump and the probe and thus to reverse the signal. The minimum of V-shape (3) corresponds to a weak signal with ill-defined shape (Fig. 5b). The large offset from pulse compression is both predicted by the model and observed. It matches the reference-probe relative chirp, -2000 fs2, and results from the compensation of the temporal and spectral contributions detailed before. The numerical fit agrees quite well with the experimental data, except for the large chirps (4). This discrepancy is attributed to higher orders of spectral phase (neglected in the model).
The increase of with is shown in Fig. 5c: the detected signal varies linearly with the relative chirp value, even if the pump energy remains the same. This additional degree of freedom, easy to implement experimentally, is be particularly useful to increase in order to detect a weak amount of nonlinear phase. Finally, we characterize how and scale with the pump intensity by scanning the pump energy from 5 J and 80 J. Fig. 5d evidences the linear dependence of both and with the pump energy up 50 J. This measurement also exemplifies that Doppler shifts spanning over more than an order of magnitude (from 30 GHz to 400 GHz, i.e. from 0.01% to 0.2% of the carrier frequency) can be detected in a single scan.
To summarize this sub-section: (i) experimental data are found in very good agreement with the toy model, (ii) the expected trends of the signal dependence on involved chirp parameters have been recovered, (iii) suitable experimental chirps and pump energy ranges so as to monitor nonlinear phase changes have been identified.
IV.2 Application to isotropic and anisotropic crystals
Although the method can in principle provide the absolute value of the nonlinear index, experimental sources of error are numerous (actual peak intensity, uncertainties on chirps…) and, in this work, we characterize relatively to a reference sample, hereafter fused silica. The experimental parameters are those shown in Fig. 4. Table 1 gathers the measured ratio between the samples to characterize (AlO, BaF, CaF) and fused silica (). A good agreement with published data () is found. It can be noted that the error interval is similar or lower to the ones given in the literature.
The last step of this validation process consists in changing the set of polarizations to check the symmetry properties of the nonlinear tensor. Comparison between polarization configuration , and enables to verify the tensor symmetry for fused silica : and . Then, BaF with holographic orientation was characterized. The ratio between obtained for two distinct polarization configuration leads to a determination of the ratio between SPM and XPM terms, and thus to the nonlinear anisotropy of (, eq. 7) Minkovski2004Nonlinear-polar ; Canova2008Efficient-gener ; Kourtev:09 . Our results are summarized in Table 2, and once again, a good agreement between the values found in the literature is obtained.
| Sample | (this work) | (literature) |
|---|---|---|
| AlO | Major:04 | |
| BaF | Adair1989nonlinear-refra | |
| CaF | Kabacinski:19 |
| Polarization configuration | (this work) | Minkovski2004Nonlinear-polar |
|---|---|---|
| (i),(ii) | ||
| (i),(iii) |
Finally, we study the nonlinear properties of a Potassium Titanyl Arsenate (KTA) crystal along =47∘ and =0∘ (X-Z plane, thickness of 2 mm). The pump energy is reduced to 15 J, so as to keep the nonlinear phase within the linearity range indicated in Fig. 5d. The polarization configurations are successively set to (i) and (ii), to measure the nonlinear indices of the fast and slow axes. Our results are gathered in Tab. 3 and found slightly lower than previous measurements reported using the Z-scan technique Li:2001tm .
Although outside the range of validity of the model developed above, a proof-of-principle measurement show that delayed linear phenomena can also be investigated with our method. The temporal scanning range is then increased to +5 ps, so as to evidence the delayed nonlinear answer of KTA (fast axis). The results are shown in Fig. 6.
| Sample | n | n |
|---|---|---|
| KTA | 7.8 0.2 | 6.5 0.2 |
For this measurement, the pump energy is increased to 75 J to increase the signal-to-noise ratio at positive pump-probe delays. The group delay swing shows an asymmetry, followed by pseudo-periodic oscillations. This measurement evidences two main virbation modes, with respective wave numbers of 66 cm-1 and 75 cm-1, matching A1 vibrational frequencies of KTA, as reported in Tu:1996vr . In case of a delayed nonlinear response, the signal seems mainly originating from temporal transcription of the phonon-induced spectral shift, as shown in Fig. 6d, where temporal and spectral oscillations perfectly match. This final measurement illustrates the potential application our method to low-frequency Raman spectroscopy Smith:2021wn .
V Conclusion
To conclude, we have introduced a jitter-free time-resolved spectroscopic method to characterize the third-order nonlinearity on the femtosecond time-scale. This approach, coined as ”nonlinear chirped Doppler interferometry”, consists in monitoring the variation of the optical group delay of a transmitted probe under the effect of a strong pump pulse, rather than the phase, via spectral interferometry between the probe and a reference pulse sampled upstream. We have shown that the optical group delay transient changes originate from two different mechanism, coherently added up : (i) 2BC triggers energy exchanges between chirped pump and probe pulses and induces temporal reshaping; (ii) the XPM frequency-shift undergone by the probe is encoded in time by adequately chirping the reference pulse. Thanks to a good agreement between experimental data and a 1D numerical model, we have been able to define experimental working area of our method, in terms of chirp of involved pulses and nonlinear phase amount.
Thus, we have demonstrated that monitoring this quantity instead of phase changes makes the detection insensitive to phase fluctuations and provides additional means to enhance the sensitivity and specificity of the detection, without resorting to heterodyne detection. Nonlinear phase shifts as low as 10 mrad, corresponding to a frequency shift of 30 GHz, i.e. 0.01% of the carrier frequency, can thus be detected. The method is suited to perform non-resonant spectroscopy in isotropic or anisotropic nonlinear media, but also to survey resonant and delayed nonlinear processes. This original approach could be easily exported to the detection of spectral shifts driven by other linear or nonlinear processes, among them fluorescence, and Raman spectroscopy.
Finally, the sensitivity reported here could be pushed further by multiple scans acquisition, higher averaging and extending the involved spectral bandwidths.
VI Funding
We acknowledge financial support from the Agence Nationale de la Recherche France (Grant ANR19CE30000601 UNLOC), the European Regional Development Fund (OPTIMAL) and from the European Union Horizon 2020 research and innovation program under the Marie Slodowska-Curie grant agreement No 860553.
References
- [1] R. L. Sutherland. Handbook of nonlinear optics. Marcel Dekker INC, 2003.
- [2] A. Jullien, O. Albert, F. Burgy, G. Hamoniaux, J.-P. Rousseau, J.-P. Chambaret, F. Augé-Rochereau, G. Chériaux, J. Etchepare, N. Minkovski, and S. M. Saltiel. temporal contrast for femtosecond ultraintense lasers by cross-polarized wave generation. Opt. Lett., 30(8):920–922, 2005.
- [3] H. Fattahi, H. G. Barros, M. Gorjan, T. Nubbemeyer, B. Alsaif, C. Y. Teisset, M. Schultze, S. Prinz, M. Haefner, M. Ueffing, A. Alismail, L. Vamos, A. Schwarz, O. Pronin, J. Brons, X. Tao Geng, G. Arisholm, M. Ciappina, V. S. Yakovlev, D.-E. Kim, A. M. Azzeer, N. Karpowicz, D. Sutter, Z. Major, T. Metzger, and F. Krausz. Third-generation femtosecond technology. Optica, 1(1):45, 2014.
- [4] R. DeSalvo and E. W. Van Stryland. Infrared to ultraviolet measurements of two-photon absorption and n2 in wide bandgap solids. IEEE J. Quantum Electron., 32(8):1324, 1996.
- [5] C. Y. Chien, B. La Fontaine, A. Desparois, Z. Jiang, T. W. Johnston, J. C. Kieffer, H. Pépin, F. Vidal, and H. P. Mercure. Single-shot chirped-pulse spectral interferometry used to measure the femtosecond ionization dynamics of air. Opt. Lett., 25(8):578–580, Apr 2000.
- [6] Y.-H. Chen, S. Varma, I. Alexeev, and H. M. Milchberg. Measurement of transient nonlinear refractive index in gases using xenon supercontinuum single-shot spectral interferometry. Opt. Express, 15(12):7458–7467, Jun 2007.
- [7] Á. Börzsönyi, Z. Heiner, A.P. Kovács, M. P. Kalashnikov, and K. Osvay. Measurement of pressure dependent nonlinear refractive index of inert gases. Opt. Express, 18(25):25847–25854, Dec 2010.
- [8] J. Burgin, C. Guillon, and P. Langot. Femtosecond investigation of the non-instantaneous third-order nonlinear suceptibility in liquids and glasses. Applied Physics Letters, 87:211916, 2005.
- [9] S. P. Le Blanc, E. W. Gaul, N. H. Matlis, A. Rundquist, and M. C. Downer. Single-shot measurement of temporal phase shifts by frequency-domain holography. Opt. Lett., 25(10):764–766, May 2000.
- [10] R. Thurston, M. M. Brister, A. Belkacem, T. Weber, N. Shivaram, and D. S. Slaughter. Time-resolved ultrafast transient polarization spectroscopy to investigate nonlinear processes and dynamics in electronically excited molecules on the femtosecond time scale. Review of Scientific Instruments, 91:053101, 2020.
- [11] Inuk Kang, Todd Krauss, and Frank Wise. Sensitive measurement of nonlinear refraction and two-photon absorption by spectrally resolved two-beam coupling. Opt. Lett., 22(14):1077–1079, Jul 1997.
- [12] Sylvia Smolorz and Frank Wise. Femtosecond two-beam coupling energy transfer from raman and electronic nonlinearities. J. Opt. Soc. Am. B, 17(9):1636–1644, Sep 2000.
- [13] S. Smolorz, F. Wise, and N. F. Borelli. Measurement of the nonlinear optical response of optical fiber materials by use of spectrally resolved two-beam coupling. Opt. Lett., 24(16):1103, 1999.
- [14] J. K. Wahlstrand, J. H. Odhner, E. T. McCole, Y.-H. Cheng, J. P. Palestro, R. J. Levis, and H. M. Milchberg. Effect of two-beam coupling in strong-field optical pump-probe experiments. Phys. Rev. A, 87:053801, 2013.
- [15] Gauri N. Patwardhan, Jared S. Ginsberg, Cecilia Y. Chen, M. Mehdi Jadidi, and Alexander L. Gaeta. Nonlinear refractive index of solids in mid-infrared. Opt. Lett., 46(8):1824–1827, Apr 2021.
- [16] R. W. Boyd. Nonlinear optics. Academic Press, INC, 1992.
- [17] J. F. Ripoche, G. Grillon, B. Prade, M. Franco, E. Nibbering, R. Lange, and A. Mysyrowicz. Determination of the time dependence of n2 in air. Optics Communications, 135:310, 1997.
- [18] G. Ghosh. Dispersion-equation coefficients for the refractive index and birefringence of calcite and quartz crystals. Opt. Commun., 163:95–102, 1999.
- [19] I. H. Malitson and M. J. Dodge. Refractive index and birefringence of synthetic sapphire. J. Opt. Soc. Am., 62:1405, 1972.
- [20] Piotr Kabaciński, Tomasz M. Kardaś, Yuriy Stepanenko, and Czesław Radzewicz. Nonlinear refractive index measurement by spm-induced phase regression. Opt. Express, 27(8):11018–11028, Apr 2019.
- [21] R. Adair, L. L. Chase, and S. A. Payne. Nonlinear refractive index of optical crystals. Physical Review B, 39(5):3337–3350, 1989.
- [22] A. Major, F. Yoshino, I. Nikolakakos, J. S. Aitchison, B. Lavorel, and P. W. E. Smith. Dispersion of the nonlinear refractive index in sapphire. Opt. Lett., 29(29):602–604, May 2004.
- [23] N. Minkovski, G. I. Petrov, S. M. Saltiel, O. Albert, and J. Etchepare. Nonlinear polarization rotation and orthogonal polarization generation experienced in a single-beam configuration. J. Opt. Soc. Am. B, 21(9):1659–1664, 2004.
- [24] L. Canova, S. Kourtev, N. Minkovski, A. Jullien, R. Lopez-Martens, O. Albert, and S. M. Saltiel. Efficient generation of cross-polarized femtosecond pulses in cubic crystals with holographic cut orientation. Appl. Phys. Lett., 92:231102, 2008.
- [25] S. Kourtev, N. Minkovski, L. Canova, A. Jullien, O. Albert, and S. M. Saltiel. Improved nonlinear cross-polarized wave generation in cubic crystals by optimization of the crystal orientation. J. Opt. Soc. Am. B, 26(7):1269–1275, 2009.
- [26] U. Gobler and C. Bosshard. Optical third-harmonic generation of fused silica in gas atmosphere: Absolute value of the third-order nonlinear optical susceptibility. Phys. Rev. B, 61(7):10702, 2000.
- [27] H. P. Li, C. H. Kam, Y. L. Lam, and W. Ji. Femtosecond z-scan measurements of nonlinear refraction in nonlinear optical crystals. Optical Materials, 15:237–242, 2001.
- [28] C. Tu, A. R. Guo, R. Tao, R. S. Katiyar, R. Guo, and A. S. Bhalla. Temperature dependent raman scattering in ktiopo4 and ktioaso4 single crystals. Journal of Applied Physics, 79:3235, 1996.
- [29] D. R. Smith, J. J. Field, D. G. Winters, S. R. Domingue, F. Rininsland, D. J. Kane, J. W. Wilson, and R. A. Bartels. Phase noise limited frequency shift impulsive raman spectroscopy. APL Photonics, 6:026107, 2021.