New evidences in IRDC G333.73+0.37: colliding filamentary clouds, hub-filament system, and embedded cores
Abstract
To unravel the star formation process, we present a multi-scale and multi-wavelength study of the filamentary infrared dark cloud (IRDC) G333.73+0.37, which hosts previously known two H ii regions located at its center. Each H ii region is associated with a mid-infrared source, and is excited by a massive OB star. Two filamentary structures and a hub-filament system (HFS) associated with one H ii region are investigated in absorption using the Spitzer 8.0 m image. The 13CO(J = 2–1) and C18O(J = 2–1) line data reveal two velocity components (around 35.5 and 33.5 km s-1) toward the IRDC, favouring the presence of two filamentary clouds at different velocities. Nonthermal (or turbulent) motions are depicted in the IRDC using the C18O line data. The spatial distribution of young stellar objects (YSOs) identified using the VVV near-infrared data traces star formation activities in the IRDC. Low-mass cores are identified toward both the H ii regions using the ALMA 1.38 mm continuum map. The VLT/NACO adaptive-optics L′-band images show the presence of at least three point-like sources and the absence of small-scale features in the inner 4000 AU around YSOs NIR31 and MIR 16 located toward the H ii regions. The H ii regions and groups of YSO are observed toward the central part of the IRDC, where the two filamentary clouds intersect. A scenario of cloud-cloud collision or converging flows in the IRDC seems to be applicable, which may explain star formation activities including HFS and massive stars.
keywords:
dust, extinction – HII regions – ISM: clouds – ISM: individual object (IRDC G333.73+0.37) – stars: formation – stars: pre–main sequence1 Introduction
In recent years, with the availability of several ground- and space-based telescopes operating in infrared, sub-millimeter (mm), and radio wavelengths, significant progress has been made by researchers to probe the physical processes involved in forming massive stars ( 8 M⊙; e.g., Zinnecker & Yorke, 2007; Tan et al., 2014; Motte et al., 2018). However, the birth of massive stars is not yet completely understood. The popular physical processes of massive star formation (MSF) reported in the literature are the cloud-cloud collision (CCC; Habe & Ohta, 1992) and the global non-isotropic collapse (GNIC) scenario (Tigé et al., 2017; Motte et al., 2018). The former process is closely related to the physical scenario of converging gas flows (Ballesteros-Paredes et al., 1999; Vázquez-Semadeni et al., 2007; Heitsch et al., 2008). The latter process includes the ingredients of the competitive accretion (CA) model (Bonnell et al., 2001; Bonnell et al., 2004; Bonnell & Bate, 2006) and the global hierarchical collapse (GHC) model (Vázquez-Semadeni et al., 2009, 2017; Vázquez-Semadeni et al., 2019). By taking a holistic view of massive star-forming regions, the filamentary web structures or hub-filament systems (HFSs) – where a central hub is surrounded by filaments – are often encountered by researchers. Massive stars and stellar clusters are exclusively found toward the central hubs. The observed HFS may reflect an imprint of the onset of the GNIC scenario (Motte et al., 2018), and may have originated by collision of clouds (Balfour et al., 2015). To carefully assess the existing theoretical models of MSF, the knowledge of the cloud to core scale physical environments of promising massive star-forming regions is crucial. In this context, this paper examines the large- and small-scale environments of an Infrared Dark Cloud (IRDC) G333.73+0.37 (hereafter, G333.73).
G333.73+0.37 shows the absorption features against the Galactic background in the Spitzer images at 3.6 – 8.0 m images, and has a filamentary appearance (Sánchez-Monge et al., 2013; Veena et al., 2018). In the sub-mm and mm images, G333.73 has also elongated filamentary morphology in emission (Beltrán et al., 2006; Veena et al., 2018), which is identified as a supercritical filament (Veena et al., 2018). Veena et al. (2018) computed the total mass of the IRDC to be 4700 M⊙ assuming a distance of 2.6 kpc, which contains several dust clumps (having temperature 14.3 – 22.3 K; mass 87 – 1530 M⊙; Veena et al., 2018). Two bright infrared sources S1 and S2 associated with H ii regions are embedded in G333.73 (see Figures 1 and 18 in Veena et al., 2018), and are clearly evident in the mid-infrared (MIR) image at 8.0 m. The source S1 is associated with IRAS 16164-4929 or the MIR bubble MWP1G333726+003642 (see Veena et al., 2018). In the radio continuum maps at 610–1300 MHz, they detected the shell-like and compact morphology of H ii regions associated with S1 and S2, respectively, which were excited by late O or early B type ZAMS stars. One point-like source MIR 16 toward S1 was found at the center of the radio continuum emission at 1300 MHz, and another source NIR31 was proposed as an exciting candidate of the H ii region associated with S2 (Veena et al., 2018). They also referred to the source S2 as NIR31. Noticeable star formation activities (including H ii regions) were reported toward the G333.73 filament (see Figure 16 in Veena et al., 2018). Both the sources NIR31 and MIR 16 were classified as young stellar objects (YSOs). They studied different molecular species (HCO+, H13CO+, HCN, HNC, N2H+, C2H, 12CO and 13CO) in the G333.73 filament. Such study allowed them to infer signatures of accretion flows along the filament and protostellar infall toward S1.
Based on the distribution of the dust continuum clumps at 870 m (from Urquhart et al., 2018) and their estimated distances, we adopt a distance of 2.35 kpc to the G333.73 filament in this paper (see Section 3.1 for more details). Considering the previously reported findings in the target site, we find that the Spitzer images at 3.6 – 8.0 m (resolution 2′′) and the molecular line data are not carefully examined to study the inner structures of the G333.73 filament hosting S1 and S2. Furthermore, cores hosting embedded YSOs (i.e., MIR 16 and NIR31) and their inner environments are yet to be studied in the G333.73 filament. Overall, in the literature, no physical process has been discussed to explain the birth of massive stars in the G333.73 filament.
In this paper, we employed multi-scale and multi-wavelength observations to study the physical processes operating in the G333.73 filament. In particular, high resolution near-infrared (NIR) images (including adaptive-optics data; resolution 01–08), the ALMA 1.38 mm continuum map (resolution 08), and molecular (i.e., 13CO(J = 2–1) and C18O(J = 2–1)) line data are utilized to examine the large- and small-scale environment of the filament including S1 and S2.
The structure of this paper is as follows: in Section 2, we start with the description of data sets used in this work. In Section 3, we elaborate the observational results extracted in this paper. In Section 4, we discuss the interpretation of the derived results. Finally, in Section 5, we give a summary of the major findings.
2 Data sets and analysis
This paper employed several observational data sets from different existing surveys (see Table 1), which were collected for an area of 25′.5 18′.54 (central coordinates: l = 333.715; b = 0.3507 ; see Figure 1) containing G333.73.
Additionally, the Herschel temperature () and column density maps (resolution 12′′; Molinari et al., 2010a; Marsh et al., 2015, 2017) of G333.73 were utilized in this paper. In the direction of S1 and S2, the primary-beam corrected ALMA continuum maps at 1.38 mm (resolution 0′′.8 0′′.77, P.A. = 37.5 – 44.9) are available, and were obtained from the ALMA science archive (project #2016.1.00191.S; PI: Sánchez-Monge, Á.). We also downloaded the NAOS-CONICA (NACO) adaptive-optics L′ images (resolution 01) toward S1 and S2 (ESO proposal ID: 091.C-0379(A); PI: João Alves). In this connection, the 8.2m VLT with NACO adaptive-optics system (Lenzen et al., 2003; Rousset et al., 2003) was employed. The raw NACO imaging data were processed in a similar way as outlined in Dewangan et al. (2015, 2016, 2018).
The reliable photometric magnitudes of point-like sources at VVV HKs bands were extracted from the VVV DR4 catalog. Bright sources are saturated in the VVV survey (Minniti et al., 2010; Saito et al., 2012; Minniti et al., 2017). Hence, 2MASS photometric data were adopted for the bright sources. The positions of the ATLASGAL 870 m dust continuum clumps (from Urquhart et al., 2018) were also collected in our target selected area.
To study the spatial-kinematic structure of the G333.73 filament, the 13CO(J =21) and C18O(J =21) line data were collected from the Structure, Excitation and Dynamics of the Inner Galactic Interstellar Medium (SEDIGISM; Schuller et al., 2017) survey. To improve sensitivities, we smoothed these SEDIGISM data cubes with a Gaussian function with a width of 3 pixels.
3 Results
3.1 Physical environment of the G333.73 filament
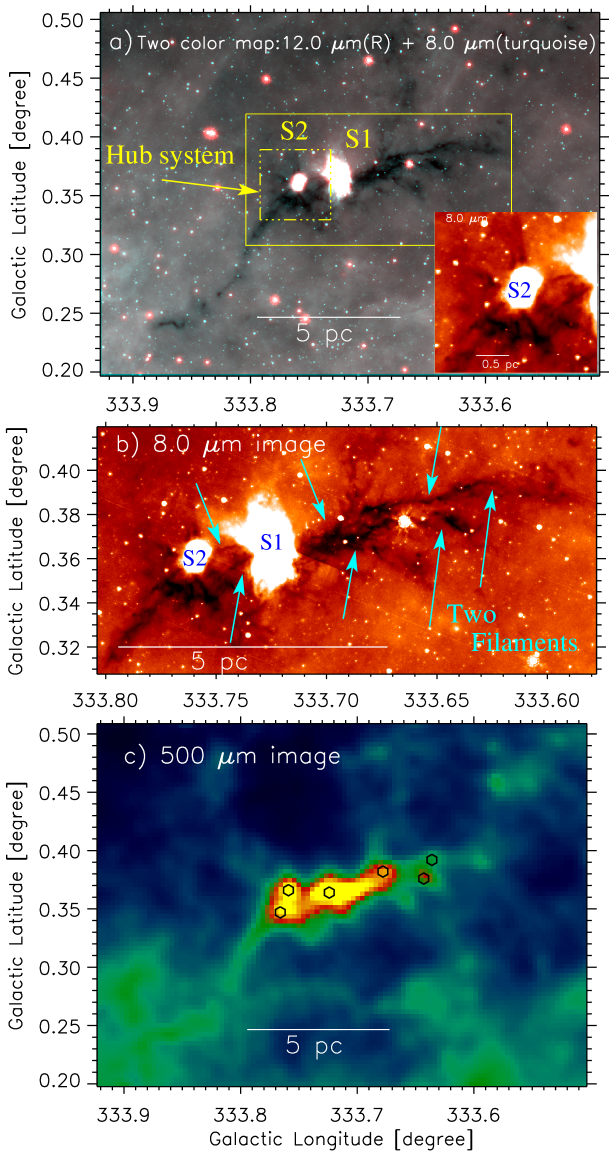
In Figure 1a, we present a two color-composite map of the G333.73 filament using the WISE 12.0 m (in red) and Spitzer 8.0 m (in turquoise) images. In both the MIR images, the absorption features against the Galactic background clearly trace the IRDC, which hosts the MIR sources S1 and S2 associated with the bright extended emissions. Our careful inspection of the MIR images reveals that the MIR source S2 is surrounded by several filaments in the absorption, revealing a HFS (see the inset in Figure 1a). Furthermore, using the Spitzer 8.0 m image, we find the presence of two filamentary features (length 6 pc) in absorption (see arrows in Figure 1b). These are the new findings in the G333.73 filament.
Figure 1c displays the Herschel 500 m continuum image (resolution 37′′), showing the G333.73 filament in emission. Note that the resolution of this Herschel sub-mm image is not enough to depict the two filamentary features seen in the Spitzer 8.0 m image. We find the positions of six ATLASGAL 870 m dust continuum clumps toward the G333.73 filament (see hexagons in Figure 1c), which are located at a distance of 2.35 kpc and are traced in a velocity range of [35.7, 33] km s-1 (from Urquhart et al., 2018).
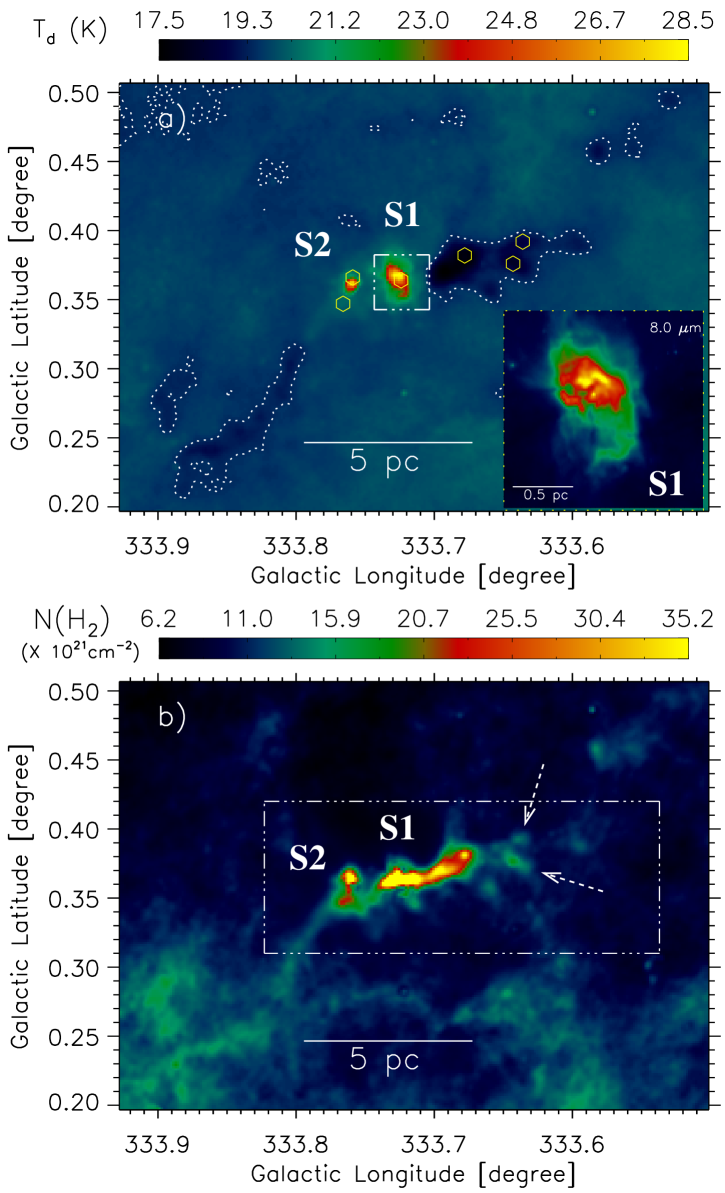
Figures 2a and 2b show the Herschel temperature and column density () maps (resolution 12′′) of the G333.73 filament, respectively. The inset in Figure 2a also presents a zoomed-in view of S1 using the Spitzer 8.0 m image, which is found to be associated with the radio continuum emission. A point-like source is seen in the inset, and has been identified as a Class I YSO labeled as MIR 16 by Veena et al. (2018). A contour at Td 19.5 K is also shown in the Herschel temperature map (see Figure 2a). We notice the temperature gradient in the filament. In Figure 2a, the areas around the MIR sources S1 and S2 (or previously known H ii regions) appear to be associated with warm dust emission (i.e. 24–28 K), while other parts of the filament show a relatively cold dust emission (i.e. 17.5–20 K). A HFS associated with S2 is not resolved in the Herschel column density map, but two arrows are marked to highlight two filamentary features seen in the Spitzer 8.0 m image (see Figure 2b).
3.2 Distribution of molecular gas in G333.73
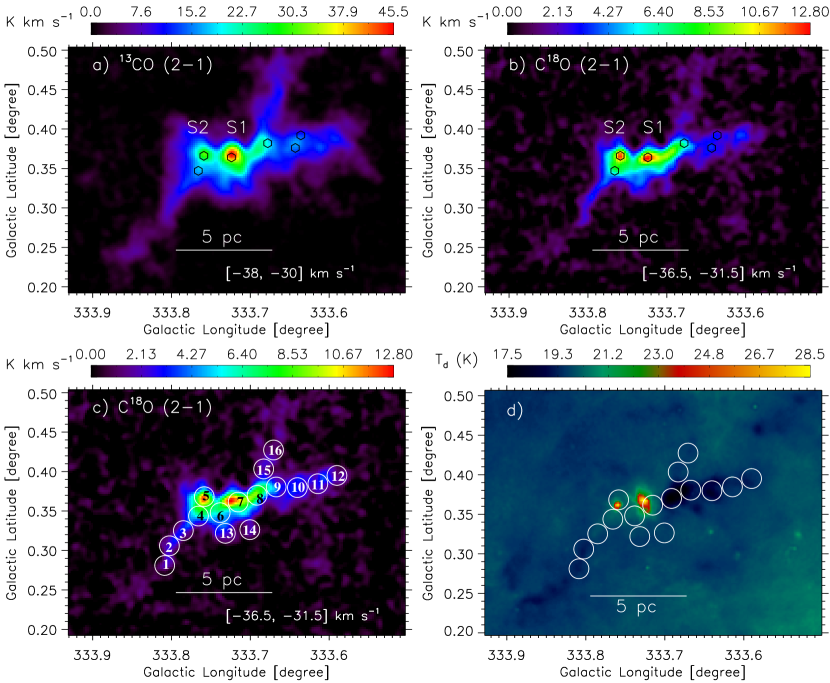
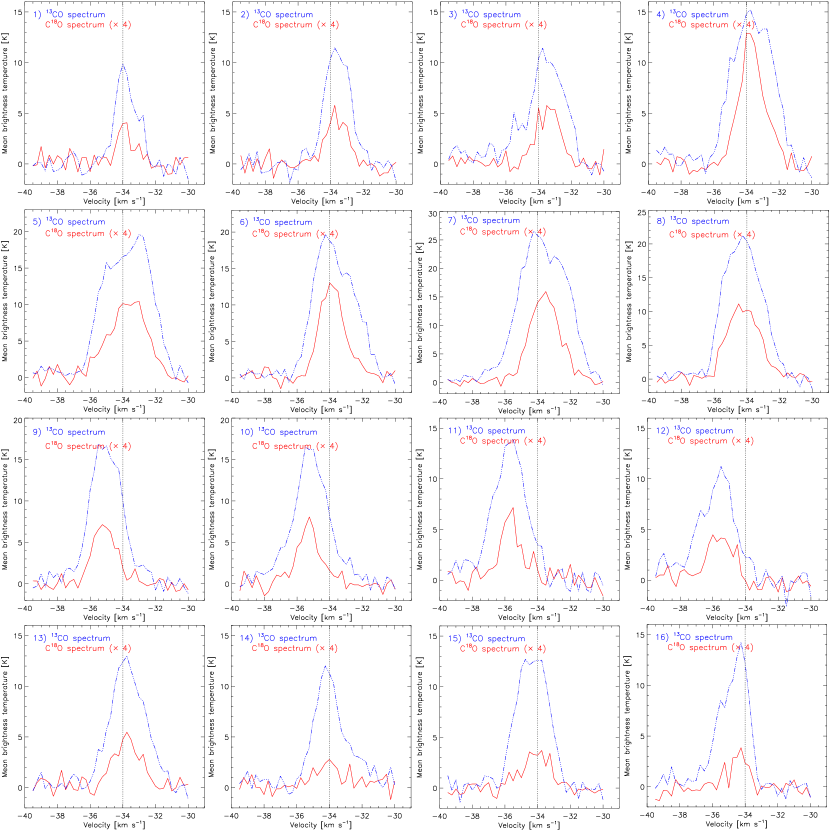
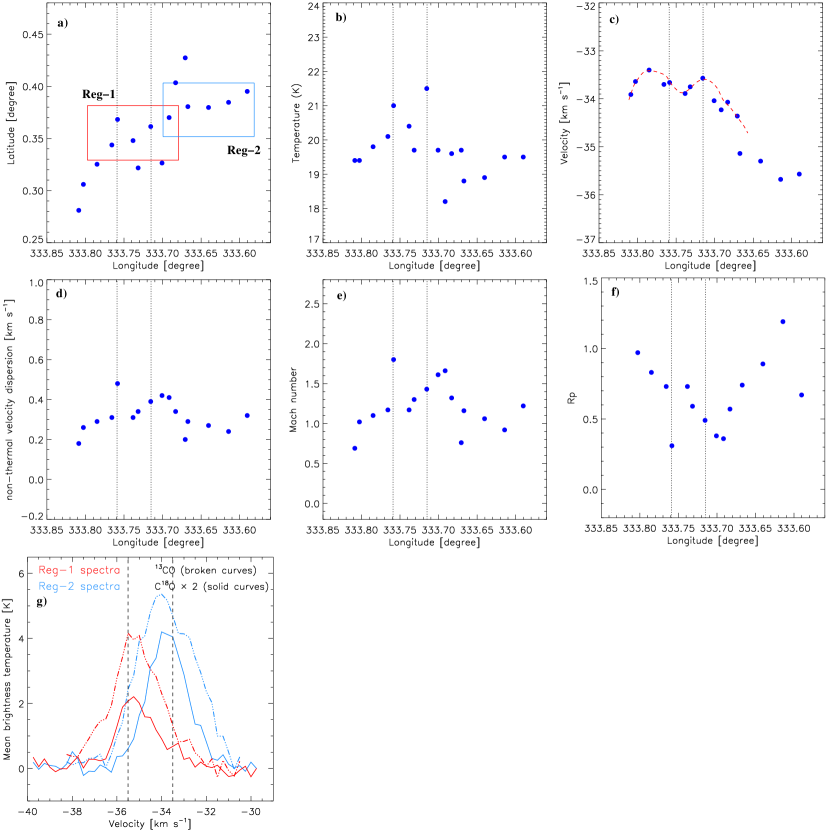
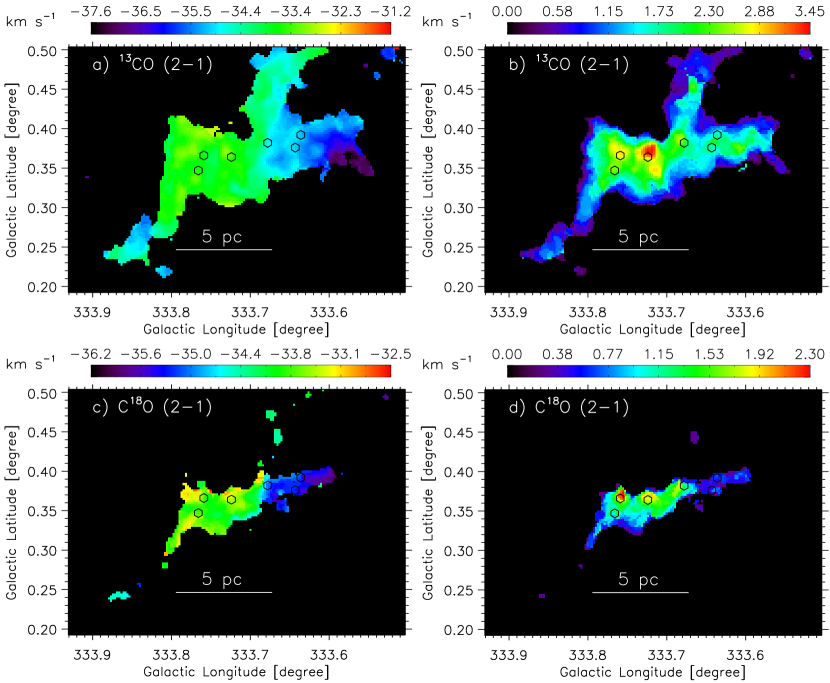
In this section, we examine the spatial and velocity distribution of the SEDIGISM 13CO(J = 2–1) and C18O(J = 2–1) emission. Figure 3a displays the 13CO integrated map at [38, 30] km s-1, while the C18O emission map at [36.5, 31.5] km s-1 is presented in Figure 3b. Both the molecular maps are overlaid with the positions of the ATLASGAL clumps. The filamentary morphology is seen in both the molecular maps, and its central part hosting S1 and S2 is depicted with high intensities. The C18O emission is known to trace the denser regions compared to the 13CO emission. We have selected 16 circular regions (radius = 45′′) distributed along the filamentary structure, which are indicated in the C18O integrated map (see Figure 3c) and the Herschel temperature map (see Figure 3d). Five circular regions (#4–8) are located toward the central part of the filament. Average spectra of 13CO(J = 2–1) and C18O(J = 2–1) toward each circular region are presented in Figure 4, allowing us to infer the peak velocity and the measured Full Width Half Maximum (FWHM) line width () of each observed spectrum. Using the C18O line data, we have computed the non-thermal velocity dispersion, sound speed, Mach number, ratio of thermal to non-thermal pressure toward each circular region. Average dust temperature is also determined for each circular region using the Herschel temperature map. All these parameters are listed in Table 2 (see also Figure 5). Mach number refers to the ratio of non-thermal velocity dispersion () to sound speed (). The sound speed (= ) can be estimated using the value of gas kinetic temperature (Tkin) and mean molecular weight (=2.37; approximately 70% H and 28% He by mass). Following the work of Lada et al. (2003), the ratio of thermal to non-thermal (or turbulent) pressure (i.e., ) is also determined. The following equation is used to obtain the non-thermal velocity dispersion:
| (1) |
where is defined earlier, (= ) is the thermal broadening for C18O at Tkin, and is the mass of hydrogen atom. Here, we adopt the average dust temperature for each circular region.
Figure 5a shows the locations of all the circular regions. In Figures 5b, 5c, 5d, 5e, and 5f, we present the distribution of the dust temperature, peak velocity, , Mach number, and against the the Galactic longitude, respectively. There is a hint of velocity variation along the filament, which is indicated by a broken curve in Figure 5c. We find that Mach number is larger than one for most of the selected circular regions (see Figure 5e). From Figure 5f, we find that Rp is smaller than one for all the selected regions (except one circular region), suggesting that the non-thermal pressure exceeds the thermal pressure in the filament.
Figure 5g displays the spectra of 13CO(J =21) and C18O(J =21) toward two regions Reg-1 and Reg-2, which are indicated by solid boxes in Figure 5a. The 13CO and C18O spectra peak around 35.5 km s-1 in the direction of Reg-1, while in the direction of Reg-2, we find the peaks of the molecular spectra around 33.5 km s-1. Five circular regions (#4–8) are located toward the Reg-1, while five circular regions (#8–12) are found in the direction of Reg-2. From Figure 5g, we find a significant velocity variation in the filament, indicating the presence of two velocity components in the direction of the filament.
In Figures 6a and 6b, we display the line velocity/velocity field/moment-1 map and the intensity-weighted line width map (moment-2) of 13CO(J = 2–1), respectively. The moment-1 and moment-2 maps of C18O(J = 2–1) are presented in Figures 6c and 6d, respectively. In all the panels of Figure 6, the positions of the ATLASGAL clumps are also marked. Noticeable velocity gradient toward the filament is clearly depicted in both the moment-1 maps. The central part of the filament hosting S1 and S2 shows higher values of line widths ( 1.5 km s-1).
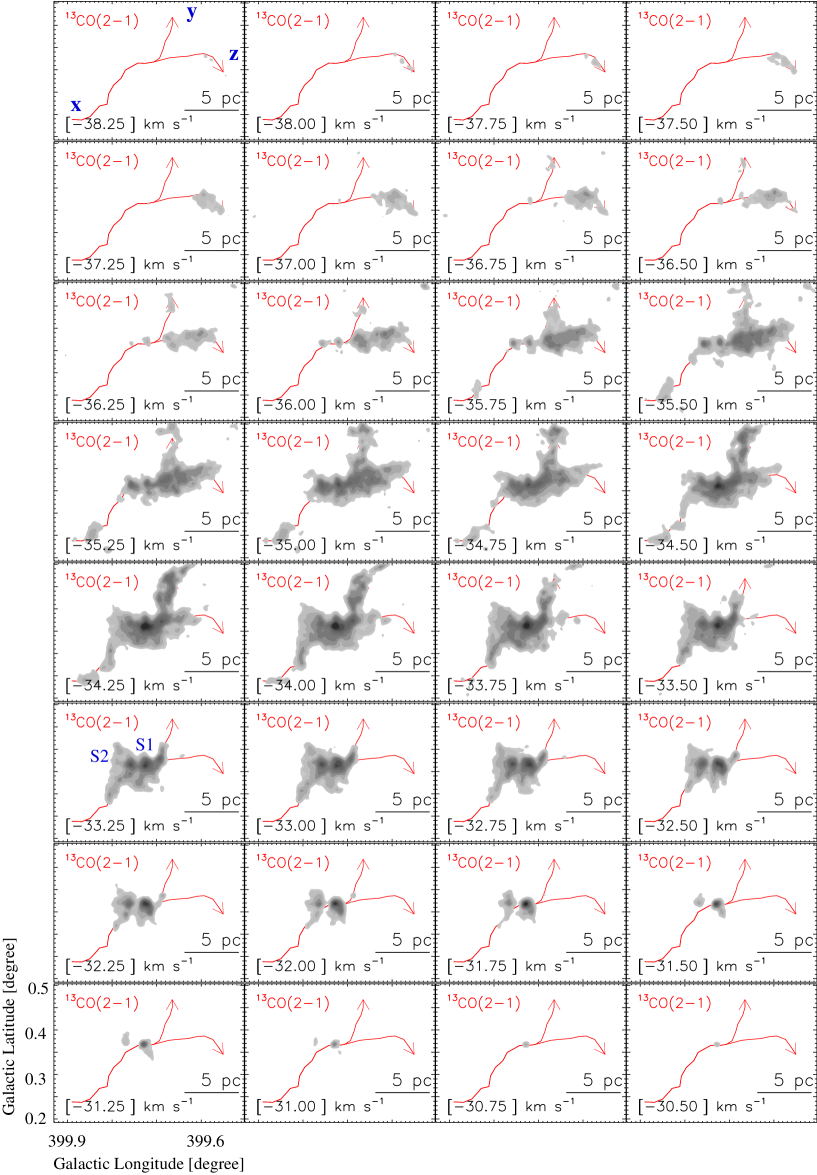
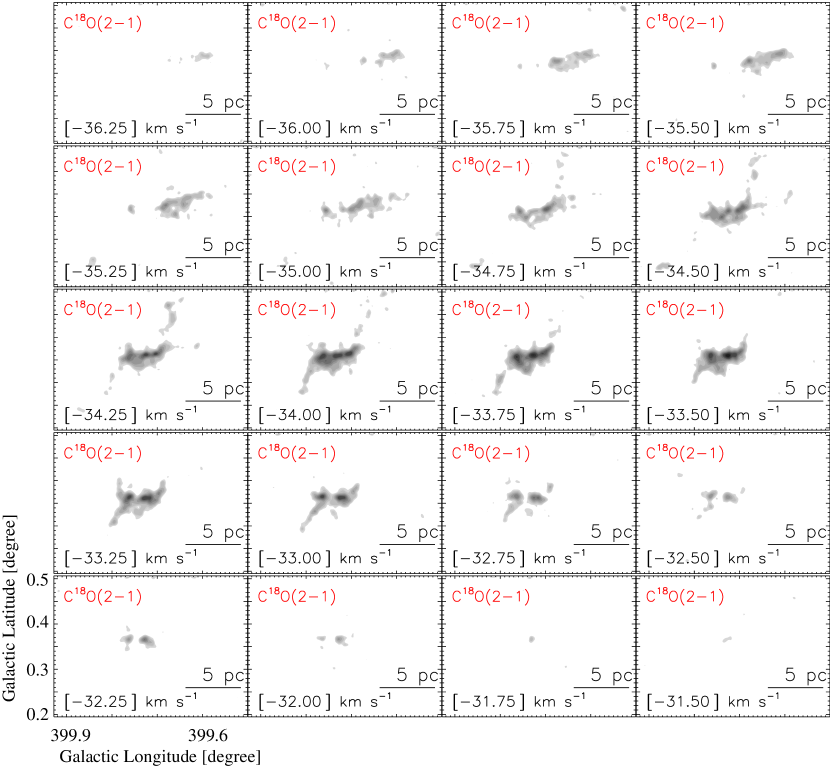
In Figure 7, to examine the gas motion in the filament, we display the velocity channel maps of 13CO(J = 2–1). In each panel of Figure 7, we have marked two curves (i.e., “xy" and “xz"), allowing us to infer two cloud components (around 35.5 and 33.5 km s-1) in the direction of the filament. In the velocity panel starting from 33.50 km s-1 to 31.25 km s-1, two molecular condensations are evident, and appear to host S1 and S2. In the panel at 33.25 km s-1, the molecular condensation associated with S2 is surrounded by filaments (see also the inset in Figure 1a), favouring the presence of the HFS. This picture concerning HFS may not be entirely valid for the molecular condensation associated with S1 (see also Figure 1b). These proposed arguments are also supported by the distribution of the C18O(J = 2–1) emission (see the velocity channel maps of C18O(J = 2–1) in Figure 8).
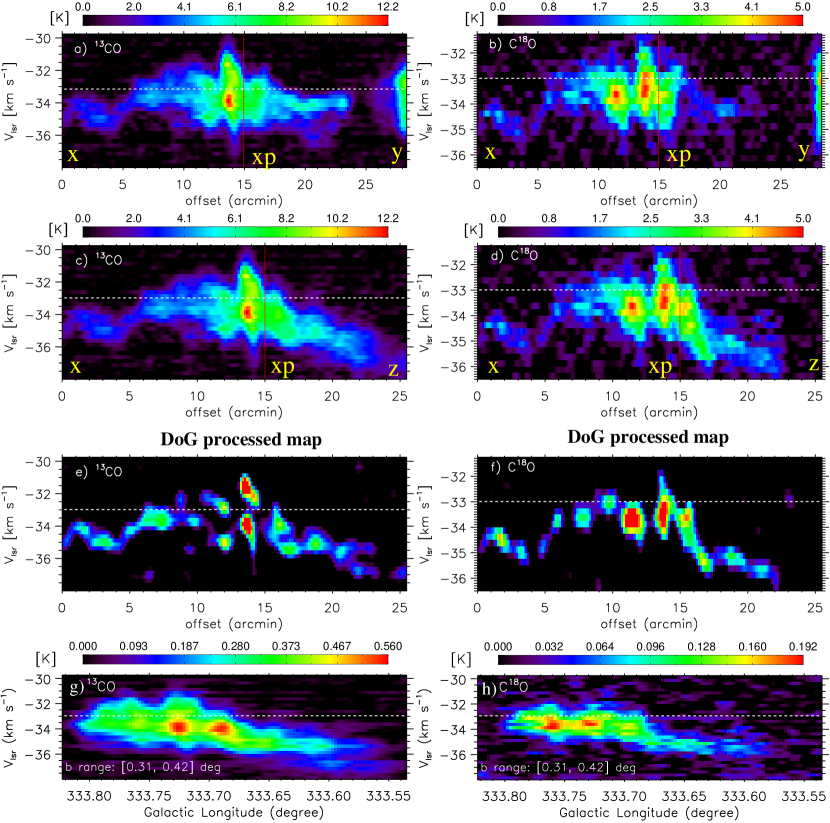
In Figures 9a and 9b, we present the position-velocity diagrams of 13CO(J = 2–1) and C18O(J = 2–1) along the curve “xy" as indicated in Figure 7, respectively. Figures 9c and 9d display the position-velocity diagrams of 13CO(J = 2–1) and C18O(J = 2–1) along the curve “xz" (see Figure 7), respectively. In Figures 9a–9d, a vertical dotted line (in red) is marked, separating two zones. The velocity structure is the same toward the “x-xp" zone in Figures 9a and 9c. Similarly, the velocity structure is identical toward the “x-xp" zone in Figures 9b and 9d. To further examine velocity structures, we exposed the position-velocity diagrams of 13CO(J = 2–1) and C18O(J = 2–1) to an edge detection algorithm (i.e. Difference of Gaussian (DoG); see Gonzalez & Woods, 2002; Assirati et al., 2014; Dewangan et al., 2017). These maps are presented in Figures 9e and 9f, and are displayed here only for a visual inspection purpose. Figures 9e and 9f are the same as Figures 9c and 9d, respectively, but are produced through the DoG algorithm. In Figures 9e and 9f, a noticeable velocity variation along the curve “xz" is clearly evident. A significant velocity gradient is seen toward the “xp-z" zone compared to the “x-xp" zone (see the velocity structure around the offset between 10′ to 18′ in Figures 9c/9e and 9d/9f). In Figures 9g and 9h, we show the Longitude-velocity diagrams of 13CO(J = 2–1) and C18O(J = 2–1), respectively, where the molecular emission is integrated over a latitude range of [0.31, 0.42].
Veena et al. (2018) examined the profiles of HCO+, H13CO+, HCN, and HNC toward the clump associated with S1, and reported signatures of infall. They also suggested the possibility of the presence of small-scale outflows toward S1. Most recently, Yang et al. (2022) examined the presence and absence of the 13CO outflows toward the ATLASGAL clumps using the SEDIGISM 13CO(J = 2–1) and C18O(J = 2–1) line data. One can find the detailed steps for identifying the outflows toward ATLASGAL clumps in Yang et al. (2022). In our selected target area, six ATLASGAL clumps are traced (see Figure 1c), and the molecular outflow is reported toward only one ATLASGAL clump (i.e., AGAL333.724+00.364) hosting S1 (Yang et al., 2022). They only provided the velocity range of the 13CO(J = 2–1) blue wing-like velocity component at [37.2, 35] km s-1, and did not report the velocity range of the 13CO(J = 2–1) red wing-like velocity component. Previously, using the C18O line data, Shimoikura et al. (2016) investigated the infalling motion with rotation of the cluster-forming clump in S235AB (distance 1.8 kpc). In this relation, they examined the position-velocity diagram along the major axis of the clump, which displays two well-defined peaks (at velocities 17.2 and 16.2 km s-1) symmetrically located with respect to the center of the clump. The velocity separation of these two peaks is about 1 km s-1.
A visual inspection of Figures 9a and 9c also hints at the presence of the 13CO(J = 2–1) blue wing-like velocity component around an offset of 14′, which is spatially related to S1. But, we are unable to clearly assess the 13CO(J = 2–1) red wing-like velocity component toward S1, which may be due to the presence of another velocity component. One can keep in mind that the locations of S1 and S2 appear to be spatially located toward the overlapping areas of the two filamentary features traced in absorption (see arrows in Figure 1b). However, at the same time, star formation signposts (i.e., infall and outflow) may not be ignored in the clump hosting S1 (see also Section 3.3). On the basis of the presence of two filamentary features, the velocity gradient seen in Figures 9c and 9d is unlikely to be explained by the inflow or outflow process. Therefore, our derived results through the analysis of the molecular line data favour the presence of two cloud components, which appear to intersect toward the areas hosting S1 and S2 or the circular regions, #4–8 as indicated in Figure 3c.
The implication of these findings is presented in Section 4.
3.3 Star formation activities in G333.73
As mentioned earlier, the central part of the filament hosts the bright infrared sources S1/IRAS 16164-4929 and S2/NIR31 associated with H ii regions, which are powered by massive stars (Veena et al., 2018). Additionally, MIR 16 and NIR31 have been classified as YSOs (Veena et al., 2018). The Class I protostar, MIR 16 was highlighted as an interesting source, and was detected at the center of the radio continuum emission at 1300 MHz (see Veena et al., 2018, for more details).
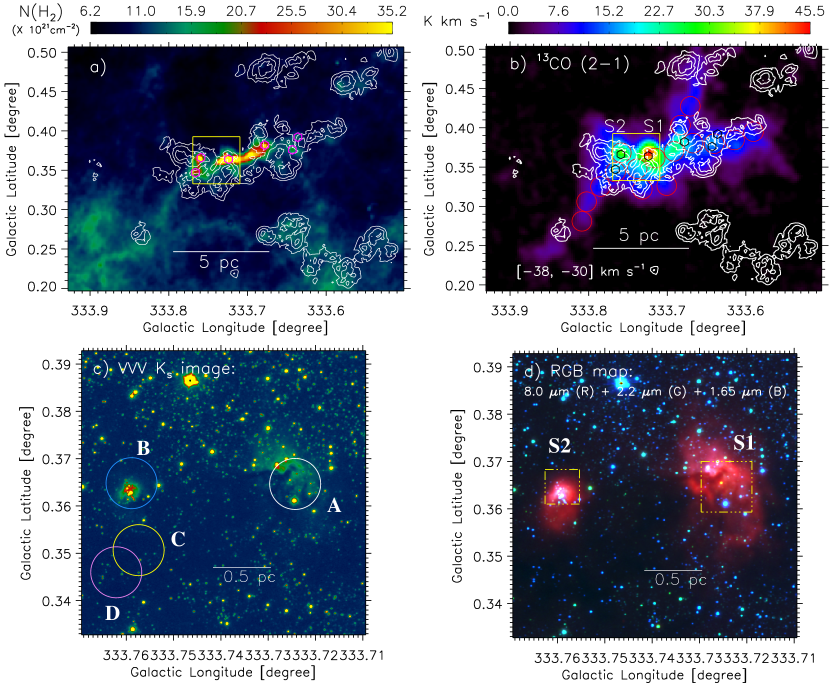
To further assess the infrared-excess sources/YSOs and their distribution in the filament, we examined the photometric magnitudes of point-like sources in the H and Ks bands from the VVV and 2MASS surveys. This work is benefited with high resolution of the VVV data. Using the NIR color-magnitude space (i.e. HKs/Ks; not shown here) and a color condition (HKs 1.7), we find 595 candidate sources with infrared-excess emission. This color condition is selected through the study of a nearby control field. Following the work of Dewangan et al. (2015), we produced the surface density map of these YSO candidates using a 10′′ grid and 6 nearest-neighbor (NN) at a distance of 2.35 kpc. In Figures 10a and 10b, we overlaid the surface density contours of YSO candidates at [5, 10, 15] YSOs pc-2 on the Herschel column density map and the 13CO(2–1) moment-0 map, respectively. On the basis of the surface density contours, the groups/clusters of YSO candidates are mainly evident in the direction of 12 circular regions (i.e., #3–13 and #15; see circles in Figure 10b and also Figure 3c). This particular analysis confirms the ongoing star formation activities (including massive stars) in the filament.
3.4 High-resolution NIR and mm maps
Figures 10c and 10d present the VVV Ks image and a three color-composite map (RGB: 8.0 m (in red), Ks (in green), and H (in blue) images) of an area hosting S1 and S2 (see a solid box in Figures 10a and 10b). In the direction of S2, a compact MIR emission surrounding several point-like sources (including NIR31) is evident in the infrared images. An extended MIR emission hosting the embedded source MIR 16 at its center is found in the direction of S1.
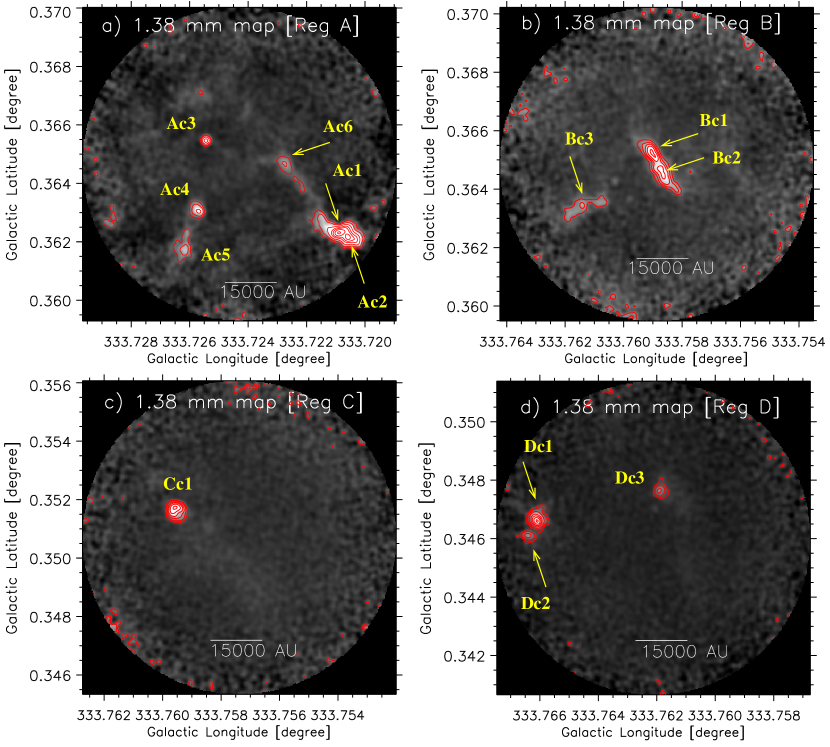
At least four pointings (i.e., “Reg A – Reg D") are found toward the central part of the filament, where the ALMA continuum maps at 1.38 mm are available (see big circles in Figure 10c). One can notice that the ALMA pointings “Reg A" and “Reg B" are found toward S1 and S2, respectively. The ALMA 1.38 mm continuum map and contours of Reg A, Reg B, Reg C, and Reg D are presented in Figures 11a, 11b, 11c, and 11d, respectively. To find out the continuum sources in each ALMA map at 1.38 mm (see also Dewangan, 2021), we used the clumpfind IDL program (Williams et al., 1994), enabling us to obtain the total flux, the FWHM not corrected for beam size for the x-axis (i.e., FWHMx), and for the y-axis (i.e., FWHMy). In Reg A, Reg B, Reg C, and Reg D, we find six (i.e., Ac1–Ac6), three (i.e., Bc1–Bc3), one (i.e., Cc1), and three (i.e., Dc1–Dc3) continuum sources/cores, respectively. We have listed the fluxes, deconvolved FWHMx & FWHMy, and masses of all the continuum sources in Table 3.
Concerning the mass calculation of each core, we adopted the following equation (Hildebrand, 1983):
| (2) |
where is the total integrated flux (in Jy), is the distance (in kpc), is the gas-to-dust mass ratio, is the Planck function for a dust temperature , and is the dust absorption coefficient. This work utilizes = 0.9 cm2 g-1 at 1.3 mm (Ossenkopf & Henning, 1994), = 22 K (see circular regions highlighted by a dagger in Table 2), and = 2.35 kpc. All the selected continuum sources are revealed as low-mass cores (see Table 3). We may suggest the uncertainty in the mass estimation to be typically 20% and at maximum 50%, which could be due to uncertainties in the adopted opacity, dust temperature, and measured flux.
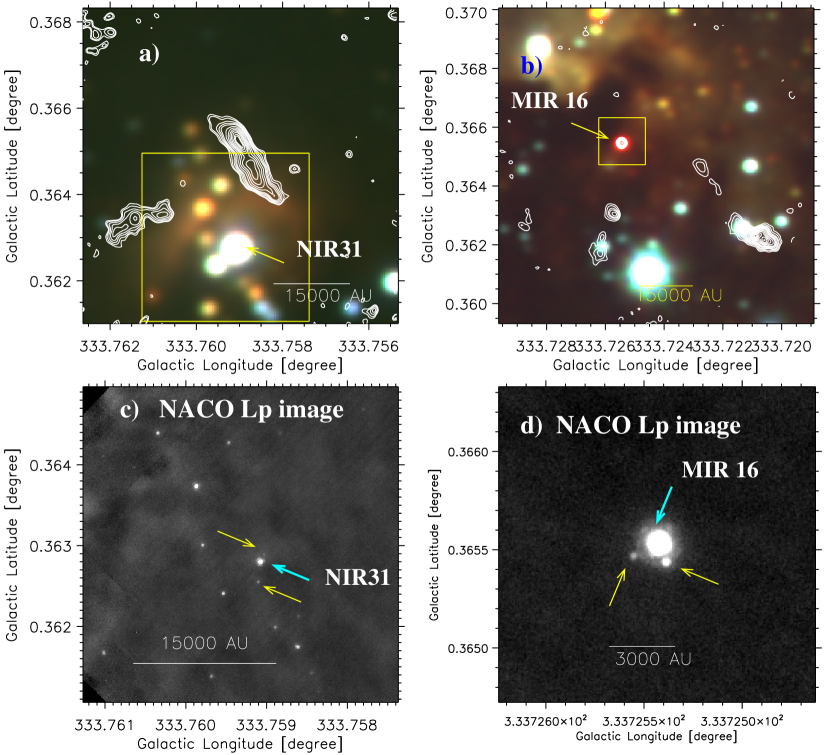
Figures 12a and 12b present the overlay of the ALMA 1.38 mm continuum emission contours on a three color-composite map using VVV (RGB: Ks (red), H (green), and J (blue)) images of an area hosting S2 and S1, respectively (see dotted-dashed boxes in Figure 10d). The 1.38 mm continuum emission is not observed toward the YSO NIR31, which was proposed as an exciting source of the H ii region. Interestingly, in the ALMA map, the compact continuum emission is detected toward the Class I YSO, MIR 16. In Figures 12c and 12d, we have presented the VLT/NACO L′-band images (resolution 01) toward the YSOs NIR31 and MIR 16, respectively (see a solid box in Figures 12a and 12b), allowing us to infer inner structures around the objects. Below the 4000 AU scale, at least three point-like sources are seen toward both the YSOs (see arrows in Figures 12c and 12d), but no small-scale features are found around these YSOs.
4 Discussion
Despite the previously reported multi-wavelength study of the G333.73 filament, the birth process of massive stars is yet to be explored. In this context, this paper deals with a multi-scale and multi-wavelength study of the G333.73 filament. In Section 3.2, we find the presence of nonthermal (or turbulent) motions in the filament, and its central part contains earlier studied two H ii regions. The filament is also associated with star formation activities (see Section 3.3). From Figure 1b, we find the presence of two filamentary structures in the G333.73 filament. A HFS associated with S2 is investigated in the filament. In the direction of S1 and S2, low-mass cores are detected using the ALMA continuum map (see Section 3.4).
The observed HFS associated with S2 indirectly reflects the inflow material toward the central hub from a large scale of 1–10 pc, which can be channeled through the molecular cloud filaments (e.g., Treviño-Morales et al., 2019). According to an evolutionary scheme for MSF associated with the HFSs (see Tigé et al., 2017; Motte et al., 2018), low mass stellar embryos will be responsible for infrared bright massive protostars. These low mass stellar embryos are expected to gain the material via gravitationally-driven inflows from the parental massive dense cores/clumps. Hence, the presence of low-mass cores toward the HFS associated with S2 gives an impression that the cores producing massive stars may not gain the entire mass prior to core collapse, but instead, these entities gain mass simultaneously (e.g., Zhang et al., 2009; Wang et al., 2011; Wang et al., 2014; Sanhueza et al., 2019; Svoboda et al., 2019; Dewangan et al., 2021). Our analysis enables us to predict that in future, the central part of the G333.73 filament will form new O-type stars.
The analysis of the 13CO(J = 2–1) and C18O(J = 2–1) emission reveals a new picture in the G333.73 filament, which is the existence of the two velocity components (around 35.5 and 33.5 km s-1) in the direction of the filament (see Section 3.2). This result and the two filamentary structures seen in the Spitzer 8.0 m image together favour the presence of two filaments or filamentary clouds at different velocities toward our target site. It seems that the MSF and the clustering of YSO candidates are concentrated toward the central part of the filament where the two filamentary clouds having a velocity separation of about 2 km s-1 intersect. These observational findings seem to favour the theory of CCC or converging flows in the G333.73 filament.
Concerning the CCC process, numerical simulations of a head-on collision of two dissimilar clouds were carried out by Habe & Ohta (1992). They found gravitationally unstable cores/clumps at the interface of the clouds in the simulations, which were produced due to the effect of the compression of the colliding clouds. Clusters of YSOs and massive stars are strongly expected at the intersection of the colliding clouds or the shock-compressed interface layer. In relation to the scenario of converging flows, it has been proposed that molecular clouds can be the result of the convergence of streams of neutral gas (Ballesteros-Paredes et al., 1999; Vázquez-Semadeni et al., 2007; Heitsch et al., 2008). With time, there is possibility of the merging/converging/collision of the filaments of molecular gas, which can lead the formation of cores and stars (e.g., Galván-Madrid et al., 2010; Beuther et al., 2020; Dewangan et al., 2020). In general, CCC may be treated as the high-density form of colliding gas flows in a bigger manner, which is initiated in the low-density medium (Beuther et al., 2020).
Concerning head-on collision of two clouds, the smoothed particle hydrodynamics simulations also predict the existence of a configuration of filaments (e.g., hub or spokes systems) through the collision event (Balfour et al., 2015). In the simulations, a shock-compressed layer is generated by the colliding clouds, and fragments into filaments. Such filaments then can be responsible for a network like a spider’s web. The latest review article on CCC by Fukui et al. (2021a) also favours the origin of the hub filaments with their complex morphology in the collision process. Together, one of the strongest predictions of these scenarios is the existence of a shock-compressed interface layer by the colliding clouds/flows, where HFSs, massive stars, and clusters of YSOs can be originated.
Following the equation given in Henshaw et al. (2013), one can infer the time-scale for which the material is accumulated at the collision zones or the collision time-scale, which is defined as
| (3) |
where, and are the average densities of the pre-collision and post-collision region, respectively. is the collision length-scale, while is the observed relative velocity. In this study, the spatial extent of the overlapping regions of the two clouds is 2 pc, which have a velocity separation of 2 km s-1. Due to unknown viewing angle of the collision, we assume a typical viewing angle of 45, resulting 2.8 pc (2 pc/sin(45)) and 2.8 km s-1 (2 km s-1/cos(45)). Reliable estimates of and values are beyond the scope of this paper. But, in general, the collision favours . Therefore, a range of collision timescale is determined to be 2–20 Myr for a given range of the mean density ratio of 1–10. This analysis indicates a representative time-scale of the collision of two clouds to be 2 Myr. Earlier, the dynamical ages of H ii regions associated with S1 and S2 were reported to be 0.2 and 0.01 Myr respectively (Veena et al., 2018), which are much younger than .
In the Herschel column density map, the peak column density of 5.8–7.8 1022 cm-2 is found in the direction of the overlapping regions of the two clouds (see locations around S1 and S2 in Figure 2b), where star formation activities (including massive stars) are evident (see Figure 10). Fukui et al. (2021b) carried out magnetohydrodynamic (MHD) simulations of colliding molecular flows, and studied the O-type star formation by exploring column density in the filaments. They reported the dependencies in column density for the formation of O-type stars in isolation and/or in a cluster. They suggested that 10 O stars (or a single O star) can be produced for total column density of 1023 (1022) cm-2 (see also Inoue et al., 2018; Liow & Dobbs, 2020).
In the direction of N159E-Papillon Nebula and N159W-South in the Large Magellanic Cloud (distance 50 kpc), the presence of massive stars and HFSs has been reported (e.g., Fukui et al., 2019; Tokuda et al., 2019, and references therein). N159E-Papillon cloud is located 50 pc away from the N159W-South region in projection (see Figure 7 in Fukui et al., 2019). Using the ALMA 13CO (2–1) line data, velocity structures toward both the regions were examined. A noticeable velocity gradient was observed toward N159E-Papillon cloud (see Figure 3 in Fukui et al., 2019) and the N159W-South (see Figure 5 in Tokuda et al., 2019). In connection to the formation of hub-filaments and massive stars, using the ALMA observations, Fukui et al. (2019) and Tokuda et al. (2019) suggested the applicability of a scenario of the large-scale colliding flow in the N159E-Papillon Nebula and N159W-South. CCC was proposed to be operated around 2 Myr ago in N159E-Papillon (see Figure 7 in Fukui et al., 2019). This proposed scenario was in agreement with the MHD numerical simulations of Inoue et al. (2018). Such collision event produces the shock-compressed layer where massive filaments with massive stars at their vertex are expected (see Inoue et al., 2018, for more details). In this paper, we also find a significant velocity gradient toward the “xp-z" zone (see the velocity structure around the offset between 10′ to 18′ in Figures 9c/9e and 9d/9f). The observed velocity structure and the collisional time-scale in our target site appear to be very similar as reported toward N159E-Papillon Nebula and N159W-South.
Recently, Wu et al. (2018) studied three-dimensional turbulent MHD simulations of non-colliding and colliding giant molecular clouds (GMCs). They found collisions between GMCs can produce higher turbulence within dense gas structures, which has been observationally reported in dense IRDCs. On the other hand, in the case of non-colliding GMCs, one may expect turbulent decay with much less energetic high-density structures (see also Sakre et al., 2021). Hence, it is likely that the colliding filaments may be the potential driver of the nonthermal (or turbulent) motions in our target IRDC.
Overall, in the G333.73 filament, star formation activities (including massive stars) and the HFS seem to be explained by the scenario of the converging/colliding flows from two different velocity components.
5 Summary and Conclusions
To probe the ongoing star formation process in the G333.73 filament, an observational study is carried out in this paper. The paper has utilized a multi-scale and multi-wavelength approach, allowing to examine the cloud to core scale physical environments of the G333.73 filament. The SEDIGISM 13CO(J =21) and C18O(J =21) line data are examined to study the structure and kinematics of the molecular gas in the filament. In addition to the existing large scale infrared and sub-mm continuum surveys (i.e., Spitzer-GLIMPSE, WISE, Herschel, ATLASGAL), the ALMA 1.38 mm dust continuum map (resolution 08), the VLT/NACO adaptive-optics L′-band images (resolution 01), and the VVV NIR data (resolution 08) are explored.
At least two filamentary structures (length 6 pc) and a HFS associated with S2 are identified in absorption using the Spitzer 8.0 m image. The 13CO(J = 2–1) and C18O(J = 2–1) emissions show two velocity components (around 35.5 and 33.5 km s-1) in the direction of the G333.73 filament, supporting the presence of two filaments or filamentary clouds at different velocities. Nonthermal (or turbulent) motions in the filament are investigated using the 13CO and C18O line data. Based on the distribution of YSO candidates, we trace star formation activities in the filament, which also hosts previously known two H ii regions at its center. In the direction of these H ii regions associated with S1 and S2, low-mass cores are identified using the ALMA continuum map. The VLT/NACO adaptive-optics L′-band images show the presence of at least three point-like sources and the absence of small-scale features in the inner 4000 AU around two previously known YSOs NIR31 and MIR 16. The locations of H ii regions and groups of infrared-excess sources are evident toward the central part of the G333.73 filament, where the two filamentary clouds intersect.
Our outcomes appear to support the scenario of CCC or converging flows in the G333.73 filament, which may also explain the observed HFS. We also propose that in the direction of the HFS associated with S2, new O-type stars may form in future.
Acknowledgments
We are grateful to the anonymous reviewer for the constructive comments and suggestions, which greatly improved the scientific contents of the paper. The research work at Physical Research Laboratory is funded by the Department of Space, Government of India. This work is based [in part] on observations made with the Spitzer Space Telescope, which is operated by the Jet Propulsion Laboratory, California Institute of Technology under a contract with NASA. This publication is based on data acquired with the Atacama Pathfinder Experiment (APEX) under programmes 092.F-9315 and 193.C-0584. APEX is a collaboration among the Max-Planck-Institut fur Radioastronomie, the European Southern Observatory, and the Onsala Space Observatory. The processed data products are available from the SEDIGISM survey database located at https://sedigism.mpifr-bonn.mpg.de/index.html, which was constructed by James Urquhart and hosted by the Max Planck Institute for Radio Astronomy. This paper makes use of the following ALMA archive data: ADS/JAO.ALMA#2016.1.00191.S. ALMA is a partnership of ESO (representing its member states), NSF (USA) and NINS (Japan), together with NRC (Canada), MOST and ASIAA (Taiwan), and KASI (Republic of Korea), in cooperation with the Republic of Chile. The Joint ALMA Observatory is operated by ESO, AUI/NRAO and NAOJ.
Data availability
The ALMA continuum data underlying this article are available from the publicly accessible JVO ALMA FITS archive111http://jvo.nao.ac.jp/portal/alma/archive.do/. The SEDIGISM molecular line data underlying this article are available from the publicly accessible website222https://sedigism.mpifr-bonn.mpg.de/index.html. The Herschel temperature and column density maps underlying this article are available from the publicly accessible website333http://www.astro.cardiff.ac.uk/research/ViaLactea/. The Herschel, Spitzer, and 2MASS data underlying this article are available from the publicly accessible NASA/IPAC infrared science archive444https://irsa.ipac.caltech.edu/frontpage/. The ESO VLT/NACO data underlying this article are available from the publicly accessible ESO website555https://archive.eso.org/eso/eso_archive_main.html. The VVV data underlying this article are available from the publicly accessible website666http://horus.roe.ac.uk/vsa/vvvGuide.html.
| Survey | Wavelength/Frequency/line(s) | Resolution () | Reference |
|---|---|---|---|
| SEDIGISM | 13CO, C18O (J = 2–1) | 30 | Schuller et al. (2017) |
| APEX Telescope Large Area Survey of the Galaxy (ATLASGAL) | 870 m | 19.2 | Schuller et al. (2009) |
| Herschel Infrared Galactic Plane Survey (Hi-GAL) | 70–500 m | 6–37 | Molinari et al. (2010b) |
| Wide Field Infrared Survey Explorer (WISE) | 12 m | 6 | Wright et al. (2010) |
| Spitzer Galactic Legacy Infrared Mid-Plane Survey Extraordinaire (GLIMPSE) | 3.6–8.0 m | 2 | Benjamin et al. (2003) |
| Vista Variables in the Vía Líactea (VVV) | 1.25–2.2 m | 0.8 | Minniti et al. (2010) |
| Two Micron All Sky Survey (2MASS) | 1.25–2.2 m | 2.5 | Skrutskie et al. (2006) |
| Region | Longitude | Latitude | Td | Vlsr | Mach number | Rp | |||
|---|---|---|---|---|---|---|---|---|---|
| [degree] | [degree] | (K) | (km s-1) | (km s-1) | (km s-1) | (km s-1) | () | ||
| 1 | 333.809 | 0.281 | 19.4 | 33.9 | 0.4 | 0.26 | 0.18 | 0.7 | 2.1 |
| 2 | 333.803 | 0.306 | 19.4 | 33.6 | 0.6 | 0.26 | 0.26 | 1.0 | 1.0 |
| 3 | 333.785 | 0.325 | 19.8 | 33.4 | 0.7 | 0.26 | 0.29 | 1.1 | 0.8 |
| 4† | 333.766 | 0.344 | 20.1 | 33.7 | 0.7 | 0.26 | 0.31 | 1.2 | 0.7 |
| 5† | 333.758 | 0.368 | 21.0 | 33.7 | 1.1 | 0.27 | 0.48 | 1.8 | 0.3 |
| 6† | 333.738 | 0.348 | 20.4 | 33.9 | 0.8 | 0.26 | 0.31 | 1.2 | 0.7 |
| 7† | 333.715 | 0.361 | 21.5 | 33.6 | 0.9 | 0.27 | 0.39 | 1.4 | 0.5 |
| 8† | 333.691 | 0.370 | 18.2 | 34.2 | 1.0 | 0.25 | 0.41 | 1.7 | 0.3 |
| 9 | 333.667 | 0.380 | 18.8 | 35.1 | 0.7 | 0.25 | 0.29 | 1.2 | 0.7 |
| 10 | 333.640 | 0.380 | 18.9 | 35.3 | 0.7 | 0.25 | 0.27 | 1.1 | 0.9 |
| 11 | 333.614 | 0.385 | 19.5 | 35.7 | 0.6 | 0.26 | 0.24 | 0.9 | 1.2 |
| 12 | 333.590 | 0.395 | 19.5 | 35.6 | 0.8 | 0.26 | 0.32 | 1.2 | 0.7 |
| 13 | 333.731 | 0.322 | 19.7 | 33.8 | 0.8 | 0.26 | 0.34 | 1.3 | 0.6 |
| 14 | 333.701 | 0.326 | 19.7 | 34.0 | 1.0 | 0.26 | 0.42 | 1.6 | 0.4 |
| 15 | 333.683 | 0.403 | 19.6 | 34.1 | 0.8 | 0.26 | 0.34 | 1.3 | 0.6 |
| 16 | 333.671 | 0.427 | 19.7 | 34.4 | 0.5 | 0.26 | 0.20 | 0.8 | 1.7 |
| Name | Longitude | Latitude | Total Flux | FWHMx FWHMy | Mass (M⊙) |
|---|---|---|---|---|---|
| (degree) | (degree) | (mJy) | (′′ ′′) | at = 22 K | |
| Ac1 | 333.721 | 0.362 | 65.09 | 2.3 1.6 | 6.9 |
| Ac2 | 333.721 | 0.362 | 57.70 | 1.5 1.4 | 6.1 |
| Ac3 | 333.725 | 0.365 | 7.96 | 0.7 0.7 | 0.8 |
| Ac4 | 333.726 | 0.363 | 10.23 | 1.0 1.1 | 1.1 |
| Ac5 | 333.726 | 0.362 | 11.94 | 1.1 2.2 | 1.3 |
| Ac6 | 333.723 | 0.365 | 05.97 | 1.0 1.2 | 0.6 |
| Bc1 | 333.759 | 0.365 | 16.89 | 1.4 1.6 | 1.8 |
| Bc2 | 333.759 | 0.365 | 23.36 | 1.9 2.4 | 2.5 |
| Bc3 | 333.761 | 0.363 | 9.85 | 3.4 1.6 | 1.0 |
| Cc1 | 333.760 | 0.352 | 22.99 | 1.4 1.4 | 2.4 |
| Dc1 | 333.766 | 0.347 | 30.98 | 1.2 1.4 | 3.3 |
| Dc2 | 333.766 | 0.346 | 6.54 | 1.2 0.9 | 0.7 |
| Dc3 | 333.762 | 0.348 | 6.54 | 1.0 1.2 | 0.7 |
References
- Assirati et al. (2014) Assirati L., Silva N. R., Berton L., Lopes A. A., Bruno O. M., 2014, in Journal of Physics Conference Series. p. 012020 (arXiv:1311.2561), doi:10.1088/1742-6596/490/1/012020
- Balfour et al. (2015) Balfour S. K., Whitworth A. P., Hubber D. A., Jaffa S. E., 2015, MNRAS, 453, 2471
- Ballesteros-Paredes et al. (1999) Ballesteros-Paredes J., Hartmann L., Vázquez-Semadeni E., 1999, ApJ, 527, 285
- Beltrán et al. (2006) Beltrán M. T., Brand J., Cesaroni R., Fontani F., Pezzuto S., Testi L., Molinari S., 2006, A&A, 447, 221
- Benjamin et al. (2003) Benjamin R. A., et al., 2003, PASP, 115, 953
- Beuther et al. (2020) Beuther H., et al., 2020, A&A, 638, A44
- Bonnell & Bate (2006) Bonnell I. A., Bate M. R., 2006, MNRAS, 370, 488
- Bonnell et al. (2001) Bonnell I. A., Bate M. R., Clarke C. J., Pringle J. E., 2001, MNRAS, 323, 785
- Bonnell et al. (2004) Bonnell I. A., Vine S. G., Bate M. R., 2004, MNRAS, 349, 735
- Dewangan (2021) Dewangan L. K., 2021, MNRAS, 504, 1152
- Dewangan et al. (2015) Dewangan L. K., Luna A., Ojha D. K., Anandarao B. G., Mallick K. K., Mayya Y. D., 2015, ApJ, 811, 79
- Dewangan et al. (2016) Dewangan L. K., Ojha D. K., Zinchenko I., Janardhan P., Ghosh S. K., Luna A., 2016, ApJ, 833, 246
- Dewangan et al. (2017) Dewangan L. K., Ojha D. K., Baug T., 2017, ApJ, 844, 15
- Dewangan et al. (2018) Dewangan L. K., Baug T., Ojha D. K., Ghosh S. K., 2018, ApJ, 869, 30
- Dewangan et al. (2020) Dewangan L. K., Baug T., Ojha D. K., 2020, MNRAS, 496, 1278
- Dewangan et al. (2021) Dewangan L. K., et al., 2021, arXiv e-prints, p. arXiv:2111.01373
- Fukui et al. (2019) Fukui Y., et al., 2019, ApJ, 886, 14
- Fukui et al. (2021a) Fukui Y., Habe A., Inoue T., Enokiya R., Tachihara K., 2021a, PASJ, 73, S1
- Fukui et al. (2021b) Fukui Y., Inoue T., Hayakawa T., Torii K., 2021b, PASJ, 73, S405
- Galván-Madrid et al. (2010) Galván-Madrid R., Zhang Q., Keto E., Ho P. T. P., Zapata L. A., Rodríguez L. F., Pineda J. E., Vázquez-Semadeni E., 2010, ApJ, 725, 17
- Gonzalez & Woods (2002) Gonzalez R. C., Woods R. E., 2002, Digital image processing, 2nd edn. Prentice-Hall, Englewood Cliffs, NJ
- Habe & Ohta (1992) Habe A., Ohta K., 1992, PASJ, 44, 203
- Heitsch et al. (2008) Heitsch F., Hartmann L. W., Slyz A. D., Devriendt J. E. G., Burkert A., 2008, ApJ, 674, 316
- Henshaw et al. (2013) Henshaw J. D., Caselli P., Fontani F., Jiménez-Serra I., Tan J. C., Hernandez A. K., 2013, MNRAS, 428, 3425
- Hildebrand (1983) Hildebrand R. H., 1983, QJRAS, 24, 267
- Inoue et al. (2018) Inoue T., Hennebelle P., Fukui Y., Matsumoto T., Iwasaki K., Inutsuka S.-i., 2018, PASJ, 70, S53
- Lada et al. (2003) Lada C. J., Bergin E. A., Alves J. F., Huard T. L., 2003, ApJ, 586, 286
- Lenzen et al. (2003) Lenzen R., et al., 2003, in Iye M., Moorwood A. F. M., eds, Society of Photo-Optical Instrumentation Engineers (SPIE) Conference Series Vol. 4841, Instrument Design and Performance for Optical/Infrared Ground-based Telescopes. pp 944–952, doi:10.1117/12.460044
- Liow & Dobbs (2020) Liow K. Y., Dobbs C. L., 2020, MNRAS, 499, 1099
- Marsh et al. (2015) Marsh K. A., Whitworth A. P., Lomax O., 2015, MNRAS, 454, 4282
- Marsh et al. (2017) Marsh K. A., et al., 2017, MNRAS, 471, 2730
- Minniti et al. (2010) Minniti D., et al., 2010, New Astron., 15, 433
- Minniti et al. (2017) Minniti D., Lucas P., VVV Team 2017, VizieR Online Data Catalog, p. II/348
- Molinari et al. (2010a) Molinari S., et al., 2010a, PASP, 122, 314
- Molinari et al. (2010b) Molinari S., et al., 2010b, A&A, 518, L100
- Motte et al. (2018) Motte F., Bontemps S., Louvet F., 2018, ARA&A, 56, 41
- Ossenkopf & Henning (1994) Ossenkopf V., Henning T., 1994, A&A, 291, 943
- Rousset et al. (2003) Rousset G., et al., 2003, in Wizinowich P. L., Bonaccini D., eds, Society of Photo-Optical Instrumentation Engineers (SPIE) Conference Series Vol. 4839, Adaptive Optical System Technologies II. pp 140–149, doi:10.1117/12.459332
- Saito et al. (2012) Saito R. K., et al., 2012, A&A, 537, A107
- Sakre et al. (2021) Sakre N., Habe A., Pettitt A. R., Okamoto T., 2021, PASJ, 73, S385
- Sánchez-Monge et al. (2013) Sánchez-Monge Á., Beltrán M. T., Cesaroni R., Fontani F., Brand J., Molinari S., Testi L., Burton M., 2013, A&A, 550, A21
- Sanhueza et al. (2019) Sanhueza P., et al., 2019, ApJ, 886, 102
- Schuller et al. (2009) Schuller F., et al., 2009, A&A, 504, 415
- Schuller et al. (2017) Schuller F., et al., 2017, A&A, 601, A124
- Shimoikura et al. (2016) Shimoikura T., Dobashi K., Matsumoto T., Nakamura F., 2016, ApJ, 832, 205
- Skrutskie et al. (2006) Skrutskie M. F., et al., 2006, AJ, 131, 1163
- Svoboda et al. (2019) Svoboda B. E., et al., 2019, ApJ, 886, 36
- Tan et al. (2014) Tan J. C., Beltrán M. T., Caselli P., Fontani F., Fuente A., Krumholz M. R., McKee C. F., Stolte A., 2014, in Beuther H., Klessen R. S., Dullemond C. P., Henning T., eds, Protostars and Planets VI. p. 149 (arXiv:1402.0919), doi:10.2458/azu_uapress_9780816531240-ch007
- Tigé et al. (2017) Tigé J., et al., 2017, A&A, 602, A77
- Tokuda et al. (2019) Tokuda K., et al., 2019, ApJ, 886, 15
- Treviño-Morales et al. (2019) Treviño-Morales S. P., et al., 2019, A&A, 629, A81
- Urquhart et al. (2018) Urquhart J. S., et al., 2018, MNRAS, 473, 1059
- Vázquez-Semadeni et al. (2007) Vázquez-Semadeni E., Gómez G. C., Jappsen A. K., Ballesteros-Paredes J., González R. F., Klessen R. S., 2007, ApJ, 657, 870
- Vázquez-Semadeni et al. (2009) Vázquez-Semadeni E., Gómez G. C., Jappsen A. K., Ballesteros-Paredes J., Klessen R. S., 2009, ApJ, 707, 1023
- Vázquez-Semadeni et al. (2017) Vázquez-Semadeni E., González-Samaniego A., Colín P., 2017, MNRAS, 467, 1313
- Vázquez-Semadeni et al. (2019) Vázquez-Semadeni E., Palau A., Ballesteros-Paredes J., Gómez G. C., Zamora-Avilés M., 2019, MNRAS, 490, 3061
- Veena et al. (2018) Veena V. S., Vig S., Mookerjea B., Sánchez-Monge Á., Tej A., Ishwara-Chandra C. H., 2018, ApJ, 852, 93
- Wang et al. (2011) Wang K., Zhang Q., Wu Y., Zhang H., 2011, ApJ, 735, 64
- Wang et al. (2014) Wang K., et al., 2014, MNRAS, 439, 3275
- Williams et al. (1994) Williams J. P., de Geus E. J., Blitz L., 1994, ApJ, 428, 693
- Wright et al. (2010) Wright E. L., et al., 2010, AJ, 140, 1868
- Wu et al. (2018) Wu B., Tan J. C., Nakamura F., Christie D., Li Q., 2018, PASJ, 70, S57
- Yang et al. (2022) Yang A. Y., et al., 2022, A&A, 658, A160
- Zhang et al. (2009) Zhang Q., Wang Y., Pillai T., Rathborne J., 2009, ApJ, 696, 268
- Zinnecker & Yorke (2007) Zinnecker H., Yorke H. W., 2007, ARA&A, 45, 481