Synthetic Graph Generation to Benchmark Graph Learning
Abstract.
Graph learning algorithms have attained state-of-the-art performance on many graph analysis tasks such as node classification, link prediction, and clustering. It has, however, become hard to track the field’s burgeoning progress. One reason is due to the very small number of datasets used in practice to benchmark the performance of graph learning algorithms. This shockingly small sample size (~10) allows for only limited scientific insight into the problem.
In this work, we aim to address this deficiency. We propose to generate synthetic graphs, and study the behaviour of graph learning algorithms in a controlled scenario. We develop a fully-featured synthetic graph generator that allows deep inspection of different models. We argue that synthetic graph generations allows for thorough investigation of algorithms and provides more insights than overfitting on three citation datasets. In the case study, we show how our framework provides insight into unsupervised and supervised graph neural network models.
1. Introduction
In recent years, there has been a tremendous increase in popularity of machine learning on graph-structured data (Chami et al., 2020). Most notably, an overwhelming number of Graph Neural Network (GNN) models have been proposed for solving task such as node classification (Kipf and Welling, 2017; Veličković et al., 2018), link prediction (Rozemberczki et al., 2021), and graph clustering (Bianchi et al., 2020; Tsitsulin et al., 2020). These methods have been applied to several application domains, such as social networks (Perozzi et al., 2014b), recommender systems (Ying et al., 2018), and even molecular analysis (Defferrard et al., 2016).
Despite (or perhaps due to) this abundance of methods, there are still many outstanding issues with benchmarks for graph learning. In our opinion, the primary issue is that only a few datasets (Hu et al., 2020) are actually used when benchmarking algorithms on these tasks. Making the situation worse, these datasets are remarkably similar to each other; for example, many are derived from from academic citation networks. Furthermore, some of datasets are particularly ill-suited for use as GNN evaluation, exhibiting extreme structural characteristics, such as abnormally high homophily (Shchur et al., 2018), and lacking rich features representative of real-world graphs (Halcrow et al., 2020). We see all this as a critical problem for the field, as the lack of a diverse evaluation suite can give only the illusion of progress.
In this work, we study the use of synthetic graph generation to ameliorate these weaknesses of current graph learning benchmarking. We propose a fully-featured synthetic graph generator that allows deep inspection of different models. Synthetic graph generations allows for thorough investigation of algorithms and provides more insights than overfitting on a few citation datasets. In the case study, we show how our framework provides insight into unsupervised and supervised graph neural network models.
Specifically, our contributions are the following:
-
•
We unify the ongoing efforts in synthetic evaluation of graph learning algorithms.
-
•
We propose a framework that presents a clear path towards new controllable experiments.
-
•
We present two case studies that validate the effectiveness of our approach.
2. Related Work
We now briefly review recent advances in evaluation of graph learning algorithms. We describe two main categories of papers: efforts in non-synthetic evaluation, such as establishment of new evaluation protocols and new datasets, and synthetic datasets or benchmark studies. While there are some contemporary efforts in creating artificial graphs with node features (Shah, 2020), no studies have proved their usefulness for benchmarking graph algorithms.
2.1. Non-Synthetic Benchmark Sets
While benchmark sets are not the primary focus of this paper, they provide insight into best methodological practices for benchmarking. Many such best practices, such as fixed train and test split, are not specific to the consideration of synthetic graph data.
TUBenchmark (Morris et al., 2020) is collection of graph classification datasets. It includes several biological and chemical graph tasks, primarily on graph classification. While the feature dimension of this dataset collection is rich—there are both node and edge features present—the sizes of most datasets are very small both in terms of the number of graphs and number of nodes in such graphs. This prevents us from making meaningful predictions about methods’ performance on out-of-domain datasets. Moreover, there is no guidance for the data split, or metrics used for evaluation for these datasets, limiting the comparability of different methods.
Open Graph Benchmark (Hu et al., 2020) fixes this problem: it unifies the evaluation protocol in terms of the data splits, metrics, and tasks on several datasets representing different application domains and tasks. Nevertheless, the scarcity of datasets per task is preventing deeper insights into performance of graph learning algorithms.
The first benchmark study to introduce a synthetic task is in (Dwivedi et al., 2020). It considers two recipes: semi-supervised graph clustering akin to our proposal from Section 4.2 and a subgraph search task. Importantly, node features in the paper are not useful for the task, as they are sampled from a discrete uniform distribution.
2.2. Synthetic Graph Mining Tasks
We now review different synthetic generators tailored to generate data for a particular task. In several graph mining papers, synthetically generated tasks are used to exemplify a particular sensitivity or a feature of an algorithm. All of them, however, do not leverage the full power of synthetic graph generation, which, as we will exemplify later in the paper, is able to provide insight into many different aspects of graph learning algorithms.
We distinguish three main lines of investigation: unsupervised and semi-supervised clustering tasks, subgraph and substructure search, and learning or varying graph statistics.
Graph clustering (Schaeffer, 2007) is one of the fundamental problems in graph analysis. In many graph mining tasks, ground-truth labels are highly correlated with the meso- and macroscopic structure of a graph. The most popular model to generate graphs with a predefined cluster structure is the Stochastic Block Model (SBM) (Snijders and Nowicki, 1997). SBMs generate edges of graphs conditioned on some predefined partition of a graph. As a general model, many modifications have been proposed in the literature for including additional properties to generated graphs (Lee and Wilkinson, 2019), making them particularly suited for the needs of benchmarking. Stochastic blockmodels have been explored for both unsupervised (Perozzi et al., 2014a; Tsitsulin et al., 2020) and semi-supervised (Rozemberczki et al., 2021; Dwivedi et al., 2020) settings. In the semi-supervised setting, we provide the algorithms additional node labels for a small subset of nodes. In the extreme case, we label just one node per cluster, as done in (Dwivedi et al., 2020). The task is then to recover latent partitions that generated the data.
Substructure search tasks aim to either find or count some small graph structures embedded in some larger graph. In this line of work, (Chen et al., 2020) studies how graph neural networks can count motifs (3–4 node subgraphs) in graphs. In a similar direction, (Dwivedi et al., 2020) plants a pre-defined graph into random SBM graphs to test the ability of graph neural networks to find exact substructures.
Last, synthetic graphs can help to study how different statistical properties are captures in different graph models. For instance, (You et al., 2020) learns statistics such as PageRank or average path length of a graph in order to select well-performing architectures to be transferred to real-world applications. Synthetic data generation also aids the study of variables that are very hard to control—(Zhu et al., 2020) generates random graphs and inserts node features from real ones to control for the degree of homophily in graphs.
3. Evaluating Learning Algorithms with Synthetic Graphs
We now describe our proposed methodology for benchmarking graph learning algorithms using generated data. We apply our model to the unsupervised and semi-supervised graph clustering case, however, we believe that our model can be easily extended to tasks like substructure search and statistical property prediction.
We introduce an attributed, degree-corrected stochastic block model (ADC-SBM). The SBM (Snijders and Nowicki, 1997) plants a partition of clusters (“blocks”) in a graph, and generates edges via a distribution conditional on that partition. This model has been used extensively to benchmark graph clustering methods (Fortunato and Hric, 2016), and has recently been used for experiments on state-of-the-art supervised GNNs (Dwivedi et al., 2020). In our version of the model, node features are also generated, using a multivariate mixture model, with the mixture memberships having some association (or de-assocation) with the cluster memberships. We proceed to describing the graph generation and feature generation components of our model. The code of our model is publicly available on GitHub111https://github.com/google-research/google-research/tree/master/graph_embedding/simulations.
ADC-SBM graph generation. We fix a number of nodes and a number of clusters , and choose node cluster memberships uniformly-at-random. Define the matrix where is the expected number of edges shared between nodes in clusters and . We determine by fixing (1) the expected average degree of the nodes , and (2) the expected average sub-degree of a node to any cluster other than its own. The difference , where , controls the spectral detectability of the clusters (Nadakuditi and Newman, 2012). Finally, we generate a power-law -vector on the range with exponent . The ADC-SBM is generated so that the expected degree of node is proportional to . Note that are arbitrary, though their difference increases the extremity of the power law. We use the generated memberships and the generated parameters and as inputs to the degree-corrected SBM function from the graph-tool (Peixoto, 2014) package.
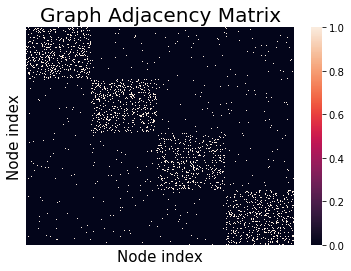
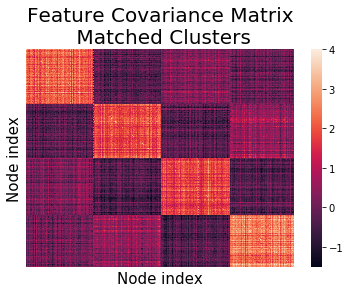
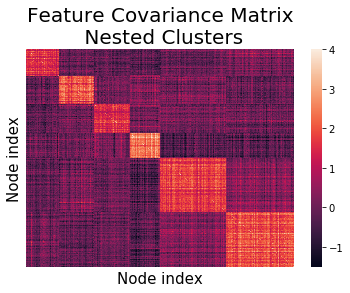
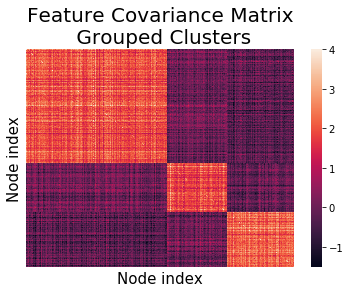
ADC-SBM feature generation. We generate feature memberships from cluster labels. For graph clustering GNNs that operate both on edges and node features, it is important to examine performance on data where feature clusters diverge from or segment the graph clusters: thus potentially . Our proposed method affords the creation of feature memberships which match, group, or nest the graph memberships, as illustrated in Figure 1. With feature memberships in-hand, we generate zero-mean feature cluster centers from a -multivariate normal with covariance matrix . Then, for feature cluster , we generate its features from a -multivariate normal with covariance matrix . Note that the ratio controls the expected value of the classical between/within-sum-of-squares of the clusters.
We also generate optional edge features in the similar way. We group edges into intra-class and inter-class ones; we sample intra-class edge features from zero-mean, unit-covariance -multivariate normal distribution. Inter-class edges are sampled with mean and unit covariance. Essentially, the bigger is, the further apart are inter-class and intra-class edge features, the easier the task of recovering the ground-truth partition is.
4. Case studies
We now describe how an ADC-SBM model can be adopted to study model characteristics in different domains. This is especially useful when there are only a few relevant academic benchmarks available. First, we examine using the model for studying unsupervised clustering methods using GNNs. Second, we examine adapting the model to examine the performance of state-of-the-art models for semi-supervised classification in multigraphs.
4.1. Unsupervised Clustering
We begin with unsupervised clustering with graph neural network models. To study model robustness, we define “default” ADC-SBM parameters, and explore model parameters in a range around the defaults. We configure our default model as follows: we generate graphs with nodes grouped in clusters, and -dimensional features grouped in matching feature clusters with intra-cluster center variance and cluster center variance. We mimic real-world graphs’ degree distribution with average degree and average inter-cluster degree with power law parameters . In total, we consider 4 different scenarios. We take DMoN (Tsitsulin et al., 2020), a modern GNN clustering method, as an example method to be studied, and compare it to three baselines: SBM-based community detection that uses purely local information, k-means over the feature vectors, and Deep Graph Infomax (Veličković et al., 2019), a baseline that naïvely combines two signals. We normalize the signal strength such that clustering with only features or graph structure yields the same performance.
4.1.1. Experimental Findings and Discussion.
To better understand the limits of the task, we study the performance of our baselines and report the results on Figure 2. In particular, our interest lies in the performance of the SBM and pure k-means over features, as these two baselines depict the performance possible when utilizing only one aspect of the data.
When varying graph signal strength, DMoN can effectively leverage the feature signal to obtain outstanding clustering performance even when the graph structure is close to random, far beyond the spectral detectability threshold (pictured in gray). As for the feature signal strength, even in the presence of a weak feature signal DMoN outperforms stochastic SBM minimization. On the other hand, k-means(DGI) offers some improvements over using features or the graph structure alone, but it never surpasses the strongest signal provider in the graph. Specifically, k-means(DGI) is never better than the best of k-means(features) or SBM. Graph density and power law strength scenarios serve as an example of robustness studies that are possible with our framework. For instance, sparse regime with low average degree is notoriously difficult for graph-only SBM, however, for the DMoN, that is able to leverage both the graph and feature signal, the performance is never worse than the k-means(features) baseline.
4.2. Semi-Supervised Node Classification
The semi-supervised node classification experiments used a modified set of the default ADC-SBM graph and feature generation hyperparameters from Subsection 4.1. We used -dimensional node features with cluster center standard deviation and the ratio of inter-class was set as . We generated dimensional edge features with a standard deviation of and the shift of the inter and intra-cluster edge feature distributions was .
Our node classification experiments compared the predictive performance of state-of-the-art graph convolutional models (Klicpera et al., 2019; Bojchevski et al., 2020; Veličković et al., 2018; Kipf and Welling, 2017; Rozemberczki et al., 2021) using synthetic graphs generated with the default settings of ADC-SBM. In each experiment one of the graph generation hyperparameters was modulated and we evaluated the semi-supervised classifiers with -shot learning tasks (Shchur et al., 2018) and plotted the mean test accuracy scores on Figure 3. Each model was trained for 200 epochs with a learning rate of and had dimensional convolutional (and edge aggregation) filters.
4.2.1. Experimental Findings and Discussion.
Our results in Scenario 1 show that models (GCN, GAT, APPNP) which do not utilize edge features are robust to graph densification as their predictive performance is unaffected. Increasing the dimensionality of the feature space in Scenario 2 initially helps the predictive performance, but the models start to overfit. The results in Scenario 3 and 4 demonstrate that the performance of models depends more on the quality of the node feature signal, than the graph signal – namely the intra-cluster density of the graph.
5. Conclusion
This paper introduces the first concise set of evaluation protocols to study and evaluate graph learning algorithms on generated graphs. We unify the ongoing efforts in model evaluation and propose a unifying framework with a clear path towards scientific investigation of graph learning algorithms. We verify that our framework delivers actionable scientific insights on two case studies for unsupervised and supervised graph learning models.
References
- (1)
- Bianchi et al. (2020) Filippo Maria Bianchi, Daniele Grattarola, and Cesare Alippi. 2020. Spectral clustering with graph neural networks for graph pooling. In ICML.
- Bojchevski et al. (2020) Aleksandar Bojchevski, Johannes Klicpera, Bryan Perozzi, Amol Kapoor, Martin Blais, Benedek Rózemberczki, Michal Lukasik, and Stephan Günnemann. 2020. Scaling Graph Neural Networks with Approximate PageRank. In KDD.
- Chami et al. (2020) Ines Chami, Sami Abu-El-Haija, Bryan Perozzi, Christopher Ré, and Kevin Murphy. 2020. Machine learning on graphs: A model and comprehensive taxonomy. arXiv preprint arXiv:2005.03675 (2020).
- Chen et al. (2020) Zhengdao Chen, Lei Chen, Soledad Villar, and Joan Bruna. 2020. Can graph neural networks count substructures?. In NeurIPS.
- Defferrard et al. (2016) Michaël Defferrard, Xavier Bresson, and Pierre Vandergheynst. 2016. Convolutional neural networks on graphs with fast localized spectral filtering. In NIPS.
- Dwivedi et al. (2020) Vijay Prakash Dwivedi, Chaitanya K Joshi, Thomas Laurent, Yoshua Bengio, and Xavier Bresson. 2020. Benchmarking Graph Neural Networks. arXiv preprint arXiv:2003.00982 (2020).
- Fortunato and Hric (2016) Santo Fortunato and Darko Hric. 2016. Community Detection in Networks: A User Guide. Physics reports (2016).
- Halcrow et al. (2020) Jonathan Halcrow, Alexandru Mosoi, Sam Ruth, and Bryan Perozzi. 2020. Grale: Designing networks for graph learning. In Proceedings of the 26th ACM SIGKDD International Conference on Knowledge Discovery & Data Mining. 2523–2532.
- Hu et al. (2020) Weihua Hu, Matthias Fey, Marinka Zitnik, Yuxiao Dong, Hongyu Ren, Bowen Liu, Michele Catasta, and Jure Leskovec. 2020. Open graph benchmark: Datasets for machine learning on graphs. In NeurIPS.
- Kipf and Welling (2017) Thomas N. Kipf and Max Welling. 2017. Semi-Supervised Classification with Graph Convolutional Networks. In ICLR.
- Klicpera et al. (2019) Johannes Klicpera, Aleksandar Bojchevski, and Stephan Günnemann. 2019. Combining Neural Networks with Personalized PageRank for Classification on Graphs. In ICLR.
- Lee and Wilkinson (2019) Clement Lee and Darren J Wilkinson. 2019. A review of stochastic block models and extensions for graph clustering. Applied Network Science (2019).
- Morris et al. (2020) Christopher Morris, Nils M Kriege, Franka Bause, Kristian Kersting, Petra Mutzel, and Marion Neumann. 2020. Tudataset: A collection of benchmark datasets for learning with graphs. arXiv preprint arXiv:2007.08663 (2020).
- Nadakuditi and Newman (2012) Raj Rao Nadakuditi and Mark EJ Newman. 2012. Graph Spectra and the Detectability of Community Structure in Networks. Physical review letters (2012).
- Peixoto (2014) Tiago P. Peixoto. 2014. The graph-tool python library. figshare (2014). https://doi.org/10.6084/m9.figshare.1164194
- Perozzi et al. (2014a) Bryan Perozzi, Leman Akoglu, Patricia Iglesias Sánchez, and Emmanuel Müller. 2014a. Focused Clustering and Outlier Detection in Large Attributed Graphs. In KDD.
- Perozzi et al. (2014b) Bryan Perozzi, Rami Al-Rfou, and Steven Skiena. 2014b. Deepwalk: Online Learning of Social Representations. In KDD.
- Rozemberczki et al. (2021) Benedek Rozemberczki, Peter Englert, Amol Kapoor, Martin Blais, and Bryan Perozzi. 2021. Pathfinder Discovery Networks for Neural Message Passing. In WWW.
- Schaeffer (2007) Satu Elisa Schaeffer. 2007. Graph clustering. Computer science review (2007).
- Shah (2020) Neil Shah. 2020. Scale-Free, Attributed and Class-Assortative Graph Generation to Facilitate Introspection of Graph Neural Networks. In KDD MLG.
- Shchur et al. (2018) Oleksandr Shchur, Maximilian Mumme, Aleksandar Bojchevski, and Stephan Günnemann. 2018. Pitfalls of graph neural network evaluation. arXiv preprint arXiv:1811.05868 (2018).
- Snijders and Nowicki (1997) Tom AB Snijders and Krzysztof Nowicki. 1997. Estimation and Prediction for Stochastic Blockmodels for Graphs with Latent Block Structure. Journal of classification (1997).
- Tsitsulin et al. (2020) Anton Tsitsulin, John Palowitch, Bryan Perozzi, and Emmanuel Müller. 2020. Graph Clustering with Graph Neural Networks. arXiv preprint arXiv:2006.16904 (2020).
- Veličković et al. (2018) Petar Veličković, Guillem Cucurull, Arantxa Casanova, Adriana Romero, Pietro Liò, and Yoshua Bengio. 2018. Graph Attention Networks. In ICLR.
- Veličković et al. (2019) Petar Veličković, William Fedus, William L Hamilton, Pietro Liò, Yoshua Bengio, and R Devon Hjelm. 2019. Deep graph infomax. In ICLR.
- Ying et al. (2018) Rex Ying, Ruining He, Kaifeng Chen, Pong Eksombatchai, William L Hamilton, and Jure Leskovec. 2018. Graph convolutional neural networks for web-scale recommender systems. In KDD.
- You et al. (2020) Jiaxuan You, Rex Ying, and Jure Leskovec. 2020. Design space for graph neural networks. In NeurIPS.
- Zhu et al. (2020) Jiong Zhu, Yujun Yan, Lingxiao Zhao, Mark Heimann, Leman Akoglu, and Danai Koutra. 2020. Generalizing graph neural networks beyond homophily. In NeurIPS.