Learning List-wise Representation in Reinforcement Learning for Ads Allocation with Multiple Auxiliary Tasks
Abstract.
With the recent prevalence of reinforcement learning (RL), there have been tremendous interests in utilizing RL for ads allocation in recommendation platforms (e.g., e-commerce and news feed sites). To achieve better allocation, the input of recent RL-based ads allocation methods is upgraded from point-wise single item to list-wise item arrangement. However, this also results in a high-dimensional space of state-action pairs, making it difficult to learn list-wise representations with good generalization ability. This further hinders the exploration of RL agents and causes poor sample efficiency. To address this problem, we propose a novel RL-based approach for ads allocation which learns better list-wise representations by leveraging task-specific signals on Meituan food delivery platform. Specifically, we propose three different auxiliary tasks based on reconstruction, prediction, and contrastive learning respectively according to prior domain knowledge on ads allocation. We conduct extensive experiments on Meituan food delivery platform to evaluate the effectiveness of the proposed auxiliary tasks. Both offline and online experimental results show that the proposed method can learn better list-wise representations and achieve higher revenue for the platform compared to the state-of-the-art baselines.
1. Introduction
Ads and organic items are mixed together and displayed to users in e-commerce feed nowadays (Ghose and Yang, 2009). E-commerce platforms gain the platform service fee (hereinafter referred to as fee) according to orders and charge advertisers based on exposures or clicks. The increase number of displayed ads brings higher ads revenue, but worse user experience, which results in a decrease in order quantify and fee (Zhao et al., 2018). Therefore, how to allocate limited ad slots effectively to maximize the overall revenue (i.e., fee and ads revenue) has been considered a meaningful and challenging problem (Wang et al., 2011; Mehta, 2013; Zhang et al., 2018). Unlike the practice of allocating ads to pre-determined slots (Ouyang et al., 2020; Li et al., 2020; Carrion et al., 2021; Wei et al., 2020; Feng et al., 2021), recent dynamic ads allocation strategies usually model the ads allocation problem as an Markov Decision Process (MDP) (Sutton et al., 1998) and solve it using reinforcement learning (RL) (Zhang et al., 2018; Liao et al., 2021; Zhao et al., 2021; Feng et al., 2018; Zhao et al., 2020). For instance, Xie et al. (2021) propose a hierarchical RL-based framework which first decides on the type of the item to present and then determines the specific item for each slot. However, this work make decisions based on the point-wise representation of candidate items, without considering the crucial arrangement signal (Liao et al., 2021) hidden in item arrangement. Zhao et al. (2021) and Liao et al. (2021) propose different DQN architectures to achieve better performance, which both take the list-wise representation of item arrangement as input and allocate the slots in one screen at a time. However, these algorithms encounter one major challenge: The rarity of the list-wise item arrangement results in a high-dimensional state-action space. For example, the number of candidate items in each slot on Meituan food delivery platform is more than millions, which leads to the curse of dimensionality for item arrangements in multiple slots of one screen. The high-dimensional state-action space makes it difficult to learn a generalizable list-wise representation, which further causes poor sample efficiency and suboptimal performance.
Utilizing auxiliary task is one common solution for representation learning in RL (Hafner et al., 2019a; Hafner et al., 2019b; Guo et al., 2020; Mazoure et al., 2020; Liu et al., 2021). For instance, Finn et al. (2016) present an auxiliary task for learning state representation using deep spatial autoencoders. Jaderberg et al. (2016) propose an auxiliary task to predict the onset of immediate reward given some historical context. Liu et al. (2021) leverage return to construct a contrastive auxiliary task for speeding up the main RL task. However, domain knowledge is very helpful information that has not been fully explored. Most existing auxiliary tasks for representation learning lack the utilization of domain knowledge in e-commerce scenario, which makes them unable to achieve good performance on ads allocation.
To this end, we propose an auxiliary-task based RL method, which aims to learn an efficient representation by leveraging task-specific signals in e-commerce scenario. Specifically, we propose three different types of auxiliary tasks based on reconstruction, prediction, and contrastive learning respectively. The reconstruction-based auxiliary task learns a list-wise representation that can be used to reconstruct key information in the original input. The prediction-based auxiliary task predicts the reward calculated based on user’s feedback (e.g., click or pull-down). The contrastive-learning based auxiliary task aggregates representations of similar state-action pairs and distinguishes representations of different state-action pairs.
We evaluate method using real-world dataset provided by Meituan food delivery platform. Both offline experimental results and online A/B test show that the proposed auxiliary tasks for ads allocation could effectively accelerate the list-wise representation learning of the agent and achieve significant improvement in terms of platform revenue.
The contributions of this paper are summarized as follows:
-
•
We introduce a unified RL framework to learn the list-wise representation for ads allocation. This solution enables us to handle list-wise representation learning efficiently in high-dimensional space.
-
•
We design three novel auxiliary tasks, which effectively utilize the side information in ads allocation scenario to aid the learning of agent.
-
•
We conduct extensive experiments on real-world dataset collected from Meituan food delivery platform. The results verify that our method achieves better performance.
2. Related Works
2.1. Ads Allocation
As shown in Figure 1, the ads allocation system takes ranked ads list and ranked organic items list as input, and outputs a mixed list of the two (Liao et al., 2021; Yan et al., 2020). Traditional strategy for ads allocation is to display ads at fixed slots (Ouyang et al., 2020; Li et al., 2020). However, allocating ads to pre-determined slots may lead to suboptimal overall performance. Recently, dynamic ads allocation strategies (Yan et al., 2020; Liao et al., 2021; Zhao et al., 2020; Xie et al., 2021), which adjust the number and slots of ads according to the interest of users, have received growing attention. According to whether RL is used, existing dynamic ads allocation strategies can be roughly categorized into two categories (Liao et al., 2021): non RL-based and RL-based.
Non RL-based dynamic ads allocation strategies usually use classical algorithms (e.g., Bellman-Ford algorithm, unified ranking score function and so on) to allocate ad slots. For instance, Koutsopoulos (2016) define ads allocation as a shortest-path problem on a weighted directed acyclic graph where nodes represent ads or slots and edges represent expected revenue and use Bellman-Ford algorithm to find the shortest path as result. Meanwhile, Yan et al. (2020) propose a unified ranking score function which uses the interval between adjacent ads as an important factor. But these methods cannot effectively utilize rich features hidden in items, resulting in poor scalability and iteration.
Since the feed continuously displays items to the user page by page, RL-based dynamic ads allocation strategies model the problem in feed as an MDP and solved it with different RL techniques. According to whether the input of the agent for ads allocation is an ad or an entire screen at a time, we divide these methods into point-wise allocation methods and list-wise allocation methods. For instance, Xie et al. (2021) propose a representative point-wise allocation method using hierarchical RL, where the low-level agent generates a personalized channel list (e.g., ad channel or organic item channel) and the high-level agent recommends specific items from heterogeneous channels under the channel constraints. As for list-wise allocation methods, Zhao et al. (2021) propose a DQN architecture to determine the optimal ads and ads position jointly. Liao et al. (2021) propose a novel architecture named CrossDQN, which constructs the list-wise representation to model the arrangement signal hidden in the item arrangement.
Compared with point-wise allocating, list-wise allocation methods (Liao et al., 2021, 2022) allocate multiple slots at a time, which not only introduces the list-wise representation capabilities, but also induces several challenges including: larger state-action space, harder-to-learn representation and lower sampling efficiency. To tackle these challenges, we focus on improving performance of RL-based dynamic ads allocation strategies by learning an efficient and generalizable list-wise representation. Although there has been efforts to apply representation learning in e-commerce scenarios such as CTR prediction (Ni et al., 2021; Zhu et al., 2021; Ouyang et al., 2019), to the best of our knowledge, our approach is the first attempt to use representation learning in ads allocation.
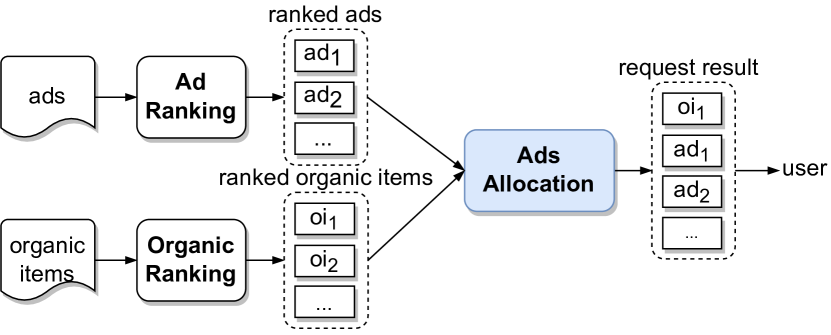
Structure of an ads allocation system. In ads allocation system, it takes the ranked ads and ranked organic items as input and outputs the allocated result.
2.2. Representation Learning
Auxiliary tasks are almost the benchmark for representation learning in RL nowadays (Liu et al., 2021; Ha and Schmidhuber, 2018; Guo et al., 2020). Specifically, the auxiliary task can be used for both the model-based setting and the model-free setting (Liu et al., 2021). In the model-based settings, world models can be used as auxiliary tasks to achieve better performance (François-Lavet et al., 2019; Hafner et al., 2019a; Hafner et al., 2019b). Since there are complex components e.g., the latent transition or reward module in the world model, these methods are empirically unstable to train and relies on different regularizations to converge (Liu et al., 2021). In the model-free settings, various auxiliary tasks are constructed to improve performance (Shelhamer et al., 2016; Guo et al., 2020; Mazoure et al., 2020; Liu et al., 2021). According to the different objectives of auxiliary tasks, existing auxiliary tasks in model-free RL frameworks can be roughly categorized into three types, reconstruction-based (Finn et al., 2016; Ha and Schmidhuber, 2018), prediction-based (Jaderberg et al., 2016; Van den Oord et al., 2018; Guo et al., 2020) and contrastive-learning based (Laskin et al., 2020; Liu et al., 2021; Anand et al., 2019).
As for reconstruction-based auxiliary tasks, the learning of representation is assisted by an encoder-decoder structure with the goal of minimizing the reconstruction error. For instance, Finn et al. (2016) present an auxiliary task for learning state representation using deep spatial autoencoders and Ha and Schmidhuber (2018) use variational autoencoder to accelerate the learning of representation layer. In many interesting environments reward is encountered very sparsely, making it difficult for the agent to learn. So the prediction-based auxiliary tasks are proposed to remove the perceptual sparsity of rewards and rewarding states and used to aid the training of an agent. For example, Jaderberg et al. (2016) propose an auxiliary task to predict the onset of immediate reward given some historical context. Van den Oord et al. (2018) propose a universal unsupervised learning approach to extract useful representation and hope the learned representation can predict the representation of the state of the subsequent steps respectively. Contrastive learning has seen dramatic progress recently, and been introduced to learn state representation. For instance, Laskin et al. (2020) adopt a contrastive auxiliary task to accelerate representation learning by leveraging the image augmentation. Liu et al. (2021) leverage return to construct a contrastive auxiliary task for speeding up the main RL task.
In this paper, we propose three different types of auxiliary tasks for ads allocation based on prior domain knowledge and combine them in a single framework, which can be easily applied to the existing RL-based ads allocation strategies and improve the performance.
3. Problem Formulation
We adopt a great paradigm for problem formulation, also used in recent related works such as CrossDQN (Liao et al., 2021). When a user browses in feed, the platform displays items to the user page by page in one request. Each page contains slots and the task is to allocate ad slots for each page in the request sequentially. Mathematically, the ads allocation problem is formulated as an MDP, which can be denoted by a tuple (, , , , ), as follows:
-
•
State space . A state consists of the information of candidate items, the user and the context. The candidate items consist of the ads list and the organic items list which are available in current page . Each item has sparse features (e.g., whether it is free of delivery fee, whether it is in promotion, whether it is a brand merchant and so on). Each user has sparse features (e.g., age, gender and so on) and historical behaviors. The context contains sparse features (e.g., order time, order location and so on). With embedding, these large-scale sparse features are transformed into low-dimensional dense vectors. See more details in Section 4.1.
-
•
Action space . An action is the decision whether to display an ad on each slot in current page, which is formulated as follows:
(1) where means to display an ad on the -th slot and means to display an organic item on the -th slot. In our scenario, we do not change the sequence of the items within ads list and organic items list when allocating slots.
-
•
Reward . After the system takes an action in one state and generates a page, a user browses this page of the mixed list and gives a feedback. The reward includes platform revenue and user experience, as follows:
(2) where and denote the ads revenue, service fee and user experience score of this page respectively. is set to when the user places an order, clicks, leaves, respectively. is the coefficient used to balance platform revenue and user experience.
-
•
Transition probability . defines the state transition probability from to after taking the action , where is the index for the page in a request. When the user pulls down to the first item in the next page, the state transits to the state of next page . Since seeing the same items in the same request causes awful user experience, the items selected by are removed from the next state . When the user no longer pulls down, the transition terminates.
-
•
Discount factor . The discount factor balances the short-term and long-term rewards.
Given the MDP formulated as above, the objective is to find an ads allocation policy to maximize the total reward. In this paper, we mainly focus on how to design auxiliary tasks to accelerate representation learning and improve the performance.
4. Methodology
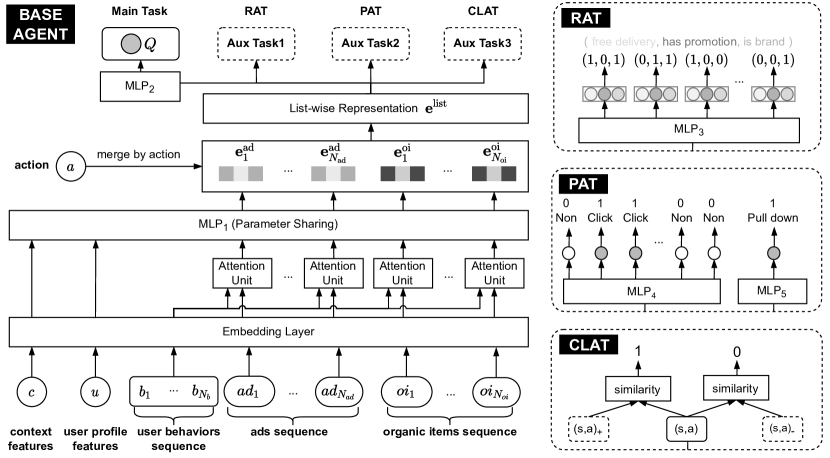
As shown in Figure 2, our method consists of a base agent and three different types of auxiliary tasks. The base agent first takes a state and an action as input to generate the list-wise representation and uses the representation to predict the corresponding Q-value. Specifically, these three different auxiliary tasks are designed to accelerate the learning of list-wise representation: i) The Reconstruction-based Auxiliary Task (RAT) adopts the encoder-decoder structure to reconstruct key information in the list-wise representation. ii) The Prediction-based Auxiliary Task (PAT) utilizes user behaviors to alleviate the sparse reward problem and guide the learning of the list-wise representation. iii) The Contrastive-Learning based Auxiliary Task (CLAT) is a method that constructs positive sample pairs for ads allocation and optimizes a contrastive loss to help the learning of list-wise representation. We describe the above components in detail in the following subsections.
4.1. Base Agent
The base agent takes a state and an action as input to generate a list-wise representation and outputs the corresponding Q-value as depicted in. Notice that, the base agent is mainly used to illustrate the general practice of RL-based ads allocation rather than the main focus of this paper. Therefore, some complex but effective modules (e.g., Dueling DQN (Wang et al., 2016; Liao et al., 2021), multi-channel attention unit (Liao et al., 2021), multi-channel interaction module (Liao et al., 2022)) are not mentioned. But they can be easily added to the base agent to further improve the overall performance in experiment. See more details in Section 5.1.
Here we first employ an embedding layer to extract the embeddings from raw inputs. Mathematically, sparse features can be represented by , where is the number of sparse features (i.e., for item, user and context, respectively) and is the dimension of embedding. Then we flatten each matrix and represent it as . We denote the embeddings for ads, organic items, historical behaviors of the user, the user profile, the context as , , , , and respectively, where the subscript denotes the index within the list and , , and are the number of ads, organic items, and historical behaviors.
After embedding, we adopt a target attention network (Vaswani et al., 2017; Zhou et al., 2018) followed by a Multi-Layer Perception (MLP) to generate the representation of each item:
| (3) | ||||
where denotes concatenation, is the target attention unit which calculates the attention weight of each historical behavior and generates a weighted behavior representation. The embeddings of item, user profile and the context are concatenated with the behavior representation generated from target attention unit to generate the representation of each item (i.e., each ad and each organic item).
Afterwards, the representations of ads and organic items are selected and concatenated according to the action. For example, when action 111 in this example is ., the first three of ranked ads list and the first seven of ranked organic items list are selected and concatenated as follows:
| (4) |
Finally, the base agent feeds the list-wise representation into an MLP and outputs the Q-value:
| (5) |
4.2. Reconstruction-based Auxiliary Task
Reconstruction can prevent key information from being lost in the representation (Mirowski et al., 2016; van der Pol et al., 2020; Laskin et al., 2020; Hessel et al., 2019). In Meituan food delivery platform, users care about some aspects when they browses and place orders, e.g., the delivery fee, promotion, brand and so on. The above aspects greatly influence the user experience thus are of high correlation with the behaviors of users.
There is a strong correlation between these key information and behavior of users. Preventing them from being lost in the list-wise representation can effectively improve the performance of the agent. To this end, we select the top most concerned factors as labels222The ranking score of different factors is determined based on the prior survey on user preferences. to build the reconstruction-based auxiliary task.
Specifically, RAT takes the list-wise representation as input and types of binary features as labels. The decoder network outputs the predicted values for each slot, as follows:
| (6) |
where is the -th predicted value for the item on the -th slot.
The reconstruction-based auxiliary loss is:
| (7) |
where is the weight of the -th key information, is the label for the -th key information of the item on the -th slot, and the cross entropy is defined as:
| (8) |
4.3. Prediction-based Auxiliary Task
In practice, the base agent may suffer from sample inefficiency due to the natural sparsity of reward compared to the tremendous search space. Therefore, we incorporate supervised signals based on user behaviors to jointly guide the agent in training. There are two main types of user behaviors: click and pull-down. The former can be used to predict the reward of the current request and the latter determines whether the trajectory terminates.
Specifically, the click-based prediction task takes the list-wise representation as input and outputs the predicted click-through rates (CTR) for each slot:
| (9) |
In our scenario, since the transition of adjacent requests is reflected in the probability of pull-down, designing an auxiliary task to predict whether there is an pull-down or not can help the list-wise representation to embed the impact of the current request on subsequent requests. Analogously, the pull-down based prediction task takes the list-wise representation as input and outputs the probability of the user’s pull-down as follows:
| (10) |
The prediction-based auxiliary loss is:
| (11) |
where indicates the item in the -th slot is clicked or not by the user and indicates whether there is a pull-down or not. The prediction-based auxiliary loss directly optimizes the list-wise representation through the supervision information based on user behaviors, which can make training more robust and accelerate model convergence in training.
4.4. Contrastive-Learning based Auxiliary Task
The main idea of most contrastive-learning based auxiliary tasks is to hope that the representation of anchor sample is closer to the representation of positive samples and farther from the representation of negative samples in the latent vector space (Liu et al., 2021; Anand et al., 2019; Sermanet et al., 2018; Dwibedi et al., [n. d.]; Aytar et al., 2018). Here we introduce a contrastive learning based auxiliary task to improve the differentiation of the representation between different types of state-action pairs. Taking one sample as an anchor sample, we define a sample with similar representation in state-action space as a positive sample and a sample with different representation in state-action space as a negative sample. The following is the detail of constructing positive and negative samples.
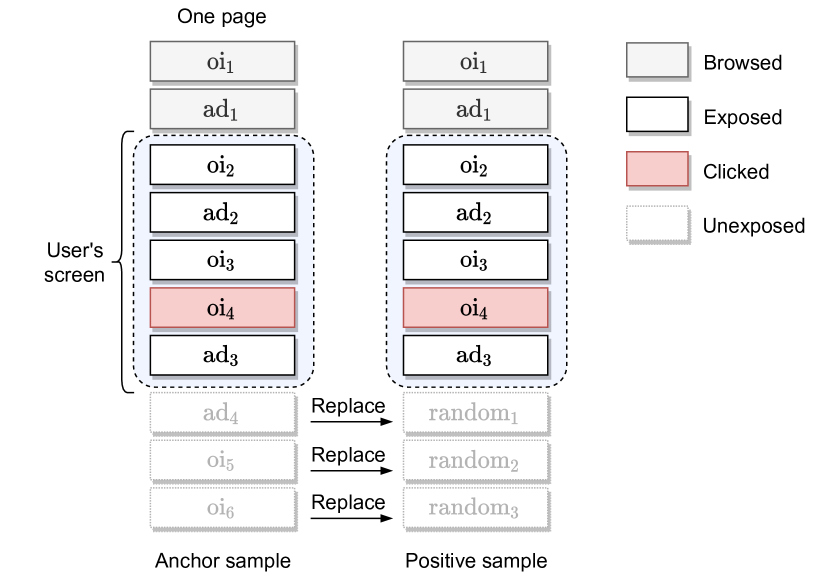
Firstly, we construct positive sample based on user behavior. For instance, as shown in Figure 3, if the user scrolls to the 7th slot in current page and gives a feedback, it reflects that the items other than the first seven have little influence on user since the user may have not seen them when making the decision. Therefore, we replace the rest of the items in current page to generate a positive sample whose representation in the state-action space should be close to the anchor sample. For negative samples, we randomly sample from other requests. Finally, the contrastive-learning based auxiliary loss (Sohn, 2016) is calculated as:
| (12) |
where is the representation of positive sample, is the number of negative samples, and the consine similarity of two representations is calculated as follows:
| (13) |
4.5. Offline Training
| Method | Revenue Indicators | Experience Indicators | ||
|---|---|---|---|---|
| HRL-Rec | 0.2390 (0.0035) | 0.2662 (0.0053) | 0.2441 (0.0013) | 0.9530 (0.0038) |
| DEAR | 0.2402 (0.0029) | 0.2679 (0.0067) | 0.2487 (0.0007) | 0.9621 (0.0024) |
| CrossDQN | 0.2465 (0.0006) | 0.2740 (0.0009) | 0.2508 (0.0008) | 0.9667 (0.0036) |
| DSAE | 0.2466 (0.0018) | 0.2741 (0.0052) | 0.2508 (0.0011) | 0.9635 (0.0047) |
| UNREAL | 0.2471 (0.0012) | 0.2744 (0.0038) | 0.2511 (0.0006) | 0.9645 (0.0022) |
| RCRL | 0.2482 (0.0007) | 0.2765 (0.0022) | 0.2521 (0.0006) | 0.9648 (0.0023) |
| Our Method | 0.2541 (0.0006) | 0.2815 (0.0024) | 0.2554 (0.0008) | 0.9718 (0.0031) |
| - w/o RAT | 0.2491 (0.0003) | 0.2761 (0.0009) | 0.2538 (0.0004) | 0.9701 (0.0015) |
| - w/o PAT | 0.2487 (0.0011) | 0.2756 (0.0028) | 0.2535 (0.0009) | 0.9694 (0.0042) |
| - w/o CLAT | 0.2483 (0.0010) | 0.2768 (0.0013) | 0.2531 (0.0010) | 0.9688 (0.0044) |
| - w/o all AT | 0.2464 (0.0051) | 0.2739 (0.0007) | 0.2506 (0.0008) | 0.9665 (0.0036) |
| Improvement | 2.38% | 1.81% | 1.31% | 0.73% |
We follows the offline RL paradigm, and the process of offline training is shown in Algorithm 1. We train our agent based on an offline dataset generated by an online random exploratory policy . For each iteration, we sample a batch of transitions from the offline dataset and update the agent using gradient back-propagation w.r.t. the loss:
| (14) |
where is the same loss function as the loss in DQN (Mnih et al., 2015), and are the coefficients to balance the four losses. Specifically,
| (15) |
4.6. Online Serving
We illustrate the process of online serving in Algorithm 2. In the online serving system, the agent selects the action with the highest reward based on current state and converts the action to ad slots set for the output. When the user pulls down, the agent receives the state for the next page, and then makes a decision based on the information of next state.
5. Experiments
In this section, we evaluate the proposed method333The code and data example are publicly accessible at https://github.com/princewen/listwise_representation on real-world dataset, with the aim of answering the following two questions: i) How does our method perform compared with the baselines? ii) How do different auxiliary tasks and hyperparameter settings affect the performance of our method?
5.1. Experimental Settings
5.1.1. Dataset
Since there are no public datasets for ads allocation problem, we collect a real-world dataset by running a random exploratory policy on the Meituan platform during March 2021. As presented in Table 2, the dataset contains requests, users, ads and organic items. Notice that each request contains several transitions.
5.1.2. Evaluation Metrics
Since both user experience and platform revenue are important for ads allocation, similar to (Liao et al., 2021), we evaluate the performance of methods with both revenue indicators and experience indicators. As for revenue indicators, we use ads revenue and service fee in a period to measure platform revenue, which is calculated as and ( is the number of requests). As for experience indicators, we use the the global ratio of the number of orders to the number of requests and the average user experience score (defined in Section 3) to measure the degree of satisfaction of the user demand, which is calculated as and ( is the number of orders).
5.1.3. Hyperparameters
We implement our method with TensorFlow and apply a gird search for the hyperparameters. is 444Follow the experiment result in (Liao et al., 2021)., is , is , is , is , is , is , the hidden layer sizes of all MLPs are , the learning rate is , the optimizer is Adam (Kingma and Ba, 2014) and the batch size is 8,192.
5.2. Offline Experiment
In this section, we train our method with offline data and evaluate the performance using an offline estimator. We use Cross DQN (Liao et al., 2021) as the base agent in this subsection to achieve further improvement. Through extended engineering, the offline estimator models the user preference and aligns well with the online service.
Statistics of the dataset. #requests #users #ads #organic items 12,729,509 2,000,420 385,383 726,587
5.2.1. Baselines
We compare our method with the following three representative RL-based dynamic ads allocation methods and three representative RL representation learning methods using different types of auxiliary tasks:
-
•
HRL-Rec (Xie et al., 2021). HRL-Rec is a typical RL-based ads allocation method, which divides the integrated recommendation into two levels of tasks and solves using hierarchical reinforcement learning. Specifically, the model first decides the channel (i.e., select an organic item or an ad) and then determine the specific item for each slot.
-
•
DEAR (Zhao et al., 2021). DEAR is an advanced RL-based ads allocation method, which designs a deep Q-network architecture to determine three related tasks jointly, i.e., i) whether to insert an ad to the recommendation list, and if yes, ii) the optimal ad and iii) the optimal location to insert.
-
•
Cross DQN (Liao et al., 2021). Cross DQN is a state-of-the-art RL-based ads allocation method, which takes the crossed state-action pairs as input and allocates slots in one screen at a time. It designs some units (e.g., MCAU) to optimize the combinatorial impact of the items on user behavior.
-
•
DSAE (Finn et al., 2016). DSAE presents a reconstruction-based auxiliary task for representation learning in RL, which uses deep spatial autoencoders to learn the spatial feature representation. Here we take Cross DQN as agent and use the deep spatial autoencoders to build an auxiliary task, with the aim of helping the learning of list-wise representation.
-
•
UNREAL (Jaderberg et al., 2016). UNREAL contains a prediction-based auxiliary task for representation learning in RL, which predicts the onset of immediate reward with some historical context. Here we take Cross DQN as agent and use the prediction-based auxiliary task in UNREAL to aid the training of an agent.
-
•
RCRL (Liu et al., 2021). RCRL proposes a return-based contrastive representation learning method for RL, which leverages return to construct a contrastive auxiliary task for speeding up the main RL task. Here we also take Cross DQN as agent for equality and use the return-based contrastive loss to accelerate representation learning.
The experimental results on the sensitivity of , and .
| 0.0 | 0.005 | 0.01 | 0.05 | 0.1 | |
|---|---|---|---|---|---|
| 0.0 | -0.76% | -0.74% | -0.25% | -0.02% | 0.03% |
| 0.005 | -0.64% | -0.72% | 0.05% | -0.04% | -0.20% |
| 0.01 | -0.43% | -0.43% | -0.09% | 0.05% | -0.13% |
| 0.05 | -0.51% | -0.57% | -0.09% | 0.13% | -0.25% |
| 0.1 | -0.25% | -0.13% | -0.25% | -0.46% | -0.72% |
| 0.0 | 0.005 | 0.01 | 0.05 | 0.1 | |
|---|---|---|---|---|---|
| 0.0 | -0.32% | -0.02% | 0.87% | 1.18% | 0.85% |
| 0.005 | -0.09% | 0.20% | 1.04% | 0.80% | 0.76% |
| 0.01 | 0.05% | 0.62% | 1.13% | 1.56% | 0.52% |
| 0.05 | 0.15% | 1.49% | 1.58% | 1.74% | 0.19% |
| 0.1 | -0.53% | 0.25% | 0.83% | 0.19% | -0.44% |
| 0.0 | 0.005 | 0.01 | 0.05 | 0.1 | |
|---|---|---|---|---|---|
| 0.0 | -0.44% | -0.13% | -0.08% | -0.04% | -0.15% |
| 0.005 | -0.16% | 0.22% | 0.85% | 1.23% | 0.57% |
| 0.01 | -0.04% | 0.64% | 1.08% | 1.53% | 1.09% |
| 0.05 | 0.10% | 0.95% | 1.30% | 1.95% | 1.81% |
| 0.1 | -0.01% | 0.55% | 1.02% | 1.76% | 1.25% |
| 0.0 | 0.005 | 0.01 | 0.05 | 0.1 | |
|---|---|---|---|---|---|
| 0.0 | -0.23% | 0.03% | 1.02% | 0.97% | 0.92% |
| 0.005 | 0.03% | 0.25% | 1.18% | 0.94% | 0.87% |
| 0.01 | 0.25% | 1.30% | 1.16% | 1.69% | 0.62% |
| 0.05 | 0.62% | 1.65% | 1.74% | 1.91% | 0.22% |
| 0.1 | -0.46% | 0.31% | 0.94% | 0.34% | -0.27% |
| 0.0 | 0.005 | 0.01 | 0.05 | 0.1 | |
|---|---|---|---|---|---|
| 0.0 | -0.34% | -0.36% | 0.57% | 0.95% | 0.74% |
| 0.005 | -0.06% | -0.15% | 0.90% | 0.78% | 0.50% |
| 0.01 | 0.10% | 0.99% | 0.73% | 1.34% | 0.25% |
| 0.05 | 1.39% | 1.09% | 1.58% | 1.35% | -0.02% |
| 0.1 | -0.84% | 0.25% | 0.55% | -0.06% | -0.48% |
5.2.2. Performance Comparison
We keep the percentage of ads exposed at the same level for all methods to ensure comparability (Liao et al., 2021). The offline experimental results are shown in Table 1 and we have the following observations: Intuitively, our method has made great improvements over state-of-the-art baselines in both revenue indicators and experience indicators. And we have the following detailed observations from the experimental results: i) Compared with all RL-based ads allocation baselines, our method achieves strongly competitive performance on both the platform revenue and the user experience. Specifically, our method improves over the best baseline w.r.t. , , and by 2.38%, 1.81%, 1.31% and 0.73% separately. ii) Compared with different types of auxiliary task methods, our results are substantially better than corresponding types of baseline separately. The superior performance of our method justifies that the agent learned more effectively with the help of our designed auxiliary tasks, which can more effectively utilize the side information on ads allocation scenario.
5.2.3. Ablation Study
To verify the impact of three auxiliary tasks, we study four ablated variants of our method (i.e., w/o RAT, w/o PAT, w/o CLAT, w/o all AT) and have the following findings: i) The performance gap between w/ and w/o the first auxiliary task verifies the effectiveness of reconstruction-based auxiliary task, since the key information is embedded in the representation. ii) The performance gap between w/ and w/o the second auxiliary task verifies the effectiveness of prediction-based auxiliary task, which brings in supervised information based on users behaviors to jointly guide the agent in training. iii) The performance gap between w/ and w/o the third auxiliary task verifies the effectiveness of contrastive-learning based auxiliary task, which makes the distinction between different types of state-action pair representations more reasonable. iv) The performance gap between w/ and w/o all auxiliary tasks verifies the fact that the three auxiliary tasks can greatly improve the performance of an agent for ads allocation.
5.2.4. Hyperparameter Analysis
We analyze the sensitivity of these four types of hyperparameters:
-
•
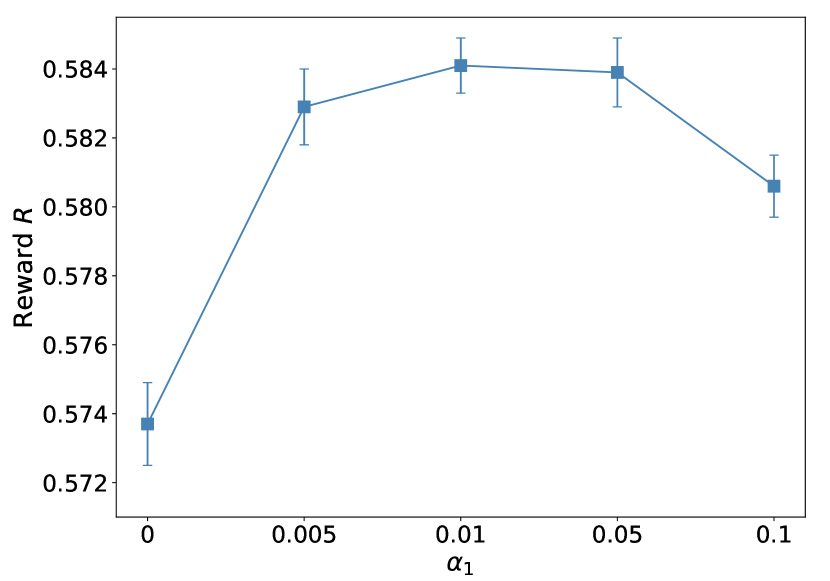
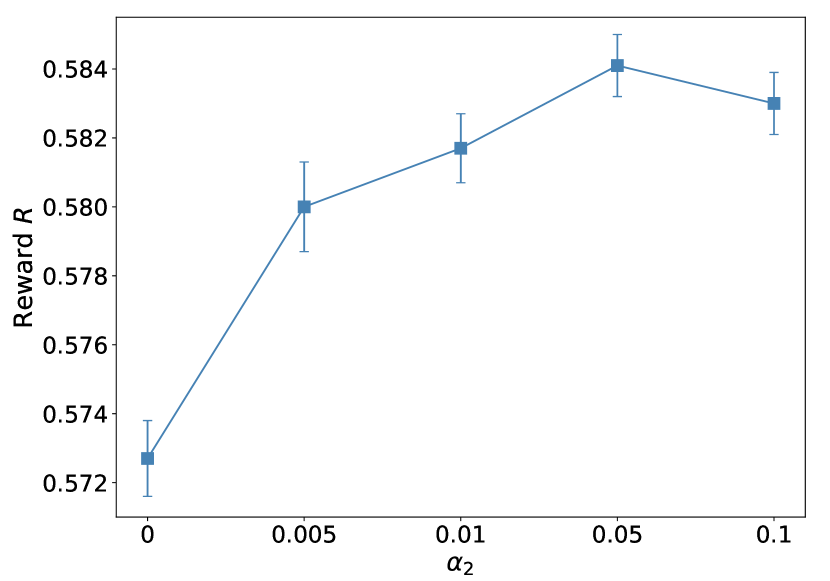
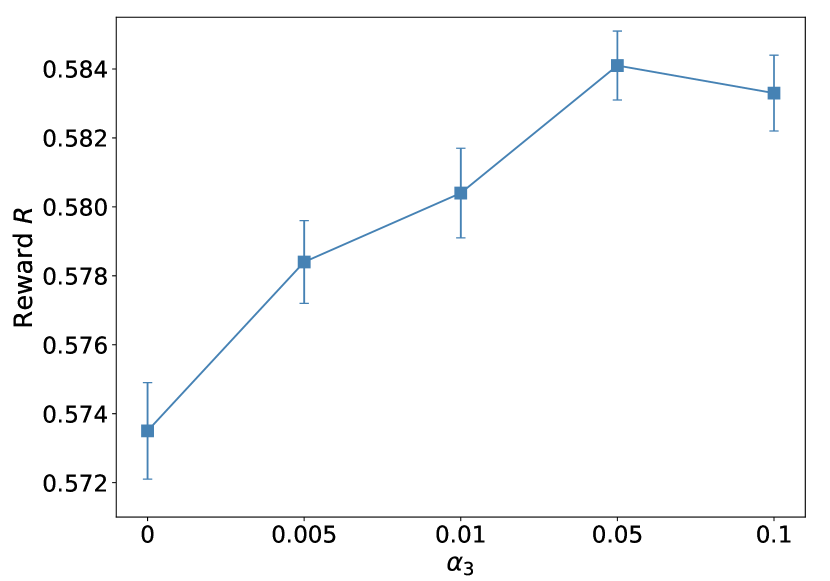
Coefficients , , . We perform a detailed analysis of , , and have the following findings: i) The sensitivity of , , is shown in Figure 4(c). Increasing , and within a certain range can improve the performance of the agent in auxiliary tasks, which further helps the performance in main task. But if , and are too large, it would cause the performance of main task to degrade. Therefore, if the appropriate , and are chosen, the auxiliary tasks would greatly improve the performance of the agent in main task. ii) Table 4(e) illustrates the performance when different weights of auxiliary tasks are used simultaneously. The best performance is obtained when is , is and is . One possible explanation is that different auxiliary tasks can effectively guide the representation to learn in a target direction within a certain range. But if one weight of an auxiliary task is too large, it may cause the learning direction to be dominated by this task, resulting in a decrease in the performance.
-
•
The amount of information used for reconstruction . In reconstruction-based auxiliary task, we select top most concerned factors to build the reconstruction-based auxiliary task. We experiment with from to . The experimental result is a typical convex curve and the optimal result is obtained when is . One reasonable explanation is that key information is helpful to the learning of the representation to a certain extent. But if there is too much information, it will also lead to learning difficulties for the agent.
-
•
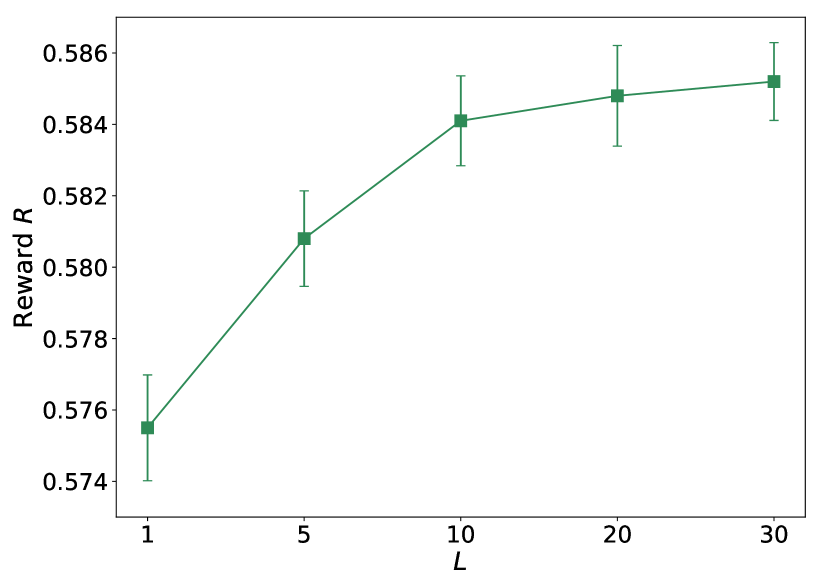
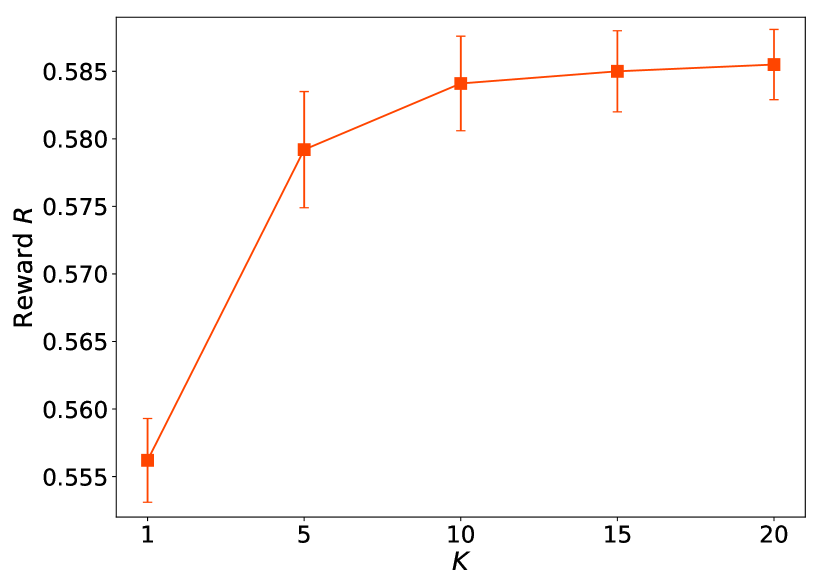
The size of contrastive sample set . In contrastive-learning based auxiliary task, we construct a comparative sample set for each sample, which consists of positive sample of the same type and randomly sampled negative samples. As shown in figure 5(b), increasing within a certain range can effectively improve the performance, but the performance will not increase if is larger than a threshold. From the result it is clear that maintaining a reasonable size can effectively save computing resources while keeping the performance.
-
•
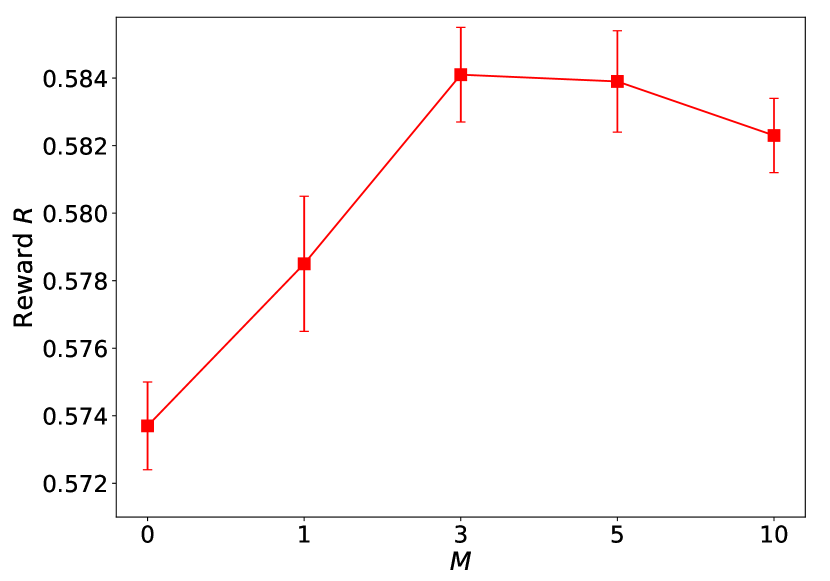
The number of allocated slots in each request . As shown in Figure 5(c), increase can boost the performance. The best performance is obtained when the number of allocated slots in each request is taken as . One reasonable explanation is that the list-wise information increases as increases. But the action space grows exponentially with . If is too large, the huge action space would make decision-making more difficult.
5.3. Online Results
We compare our method with Cross DQN and both strategies are deployed on the Meituan platform through online A/B test. We keep total percentage of ads exposed the same for two methods for a fair comparison. The two experimental groups use the same number of users and are observed for two consecutive weeks. As a result, we find that , , and increase by 2.92%, 1.91%, 2.21% and 1.13%, which demonstrates that our method can effectively improve both platform revenue and user experience.
6. Conclusion and future work
In this paper, we propose three different types of auxiliary tasks to learn an efficient and generalizable representation in the high-dimensional state-action space in the ads allocation scenario. Specifically, the three different types of auxiliary tasks are based on reconstruction, prediction, and contrastive learning respectively. The reconstruction based auxiliary task helps to learn a representation that embeds the key factors that affect the users. The prediction based auxiliary task extracts labels based on the behavior of the users and learns a representation that is predictive of the behavior-based rewards. The contrastive learning based auxiliary task helps to aggregate semantically similar representations and differentiate different representations. Practically, both offline experiments and online A/B test have demonstrated the superior performance and efficiency of the proposed method.
However, adding multiple auxiliary tasks at the same time inevitably introduces the challenge that how to balance multiple auxiliary tasks. So, how to automatically balance between multiple auxiliary tasks to maximize the platform revenue is one of our priorities in the future. In addition, it is worth noting that our method follows the offline reinforcement learning paradigm. Compared with online reinforcement learning, offline reinforcement learning faces additional challenges (such as the distribution shift problem). The impact of these challenges to the ads allocation problem is also a potential research direction in the future.
Acknowledgements.
We thank the anonymous reviewers for their constructive suggestions and comments. We also thank Fan Yang, Bingqi Zhu, Hui Niu for helpful discussions.References
- (1)
- Anand et al. (2019) Ankesh Anand, Evan Racah, Sherjil Ozair, Yoshua Bengio, Marc-Alexandre Côté, and R Devon Hjelm. 2019. Unsupervised state representation learning in atari. arXiv preprint arXiv:1906.08226 (2019).
- Aytar et al. (2018) Yusuf Aytar, Tobias Pfaff, David Budden, Tom Le Paine, Ziyu Wang, and Nando de Freitas. 2018. Playing hard exploration games by watching youtube. arXiv preprint arXiv:1805.11592 (2018).
- Carrion et al. (2021) Carlos Carrion, Zenan Wang, Harikesh Nair, Xianghong Luo, Yulin Lei, Xiliang Lin, Wenlong Chen, Qiyu Hu, Changping Peng, Yongjun Bao, and Weipeng P. Yan. 2021. Blending Advertising with Organic Content in E-Commerce: A Virtual Bids Optimization Approach. ArXiv abs/2105.13556 (2021).
- Dwibedi et al. ([n. d.]) Debidatta Dwibedi, Jonathan Tompson, Corey Lynch, and Pierre Sermanet. [n. d.]. Learning actionable representations from visual observations. In 2018 IEEE. In RSJ International Conference on Intelligent Robots and Systems (IROS). 1577–1584.
- Feng et al. (2018) Jun Feng, H. Li, Minlie Huang, Shichen Liu, Wenwu Ou, Zhirong Wang, and Xiaoyan Zhu. 2018. Learning to Collaborate: Multi-Scenario Ranking via Multi-Agent Reinforcement Learning. Proceedings of the 2018 World Wide Web Conference (2018).
- Feng et al. (2021) Yufei Feng, Yu Gong, Fei Sun, Qingwen Liu, and Wenwu Ou. 2021. Revisit Recommender System in the Permutation Prospective. ArXiv abs/2102.12057 (2021).
- Finn et al. (2016) Chelsea Finn, Xin Yu Tan, Yan Duan, Trevor Darrell, Sergey Levine, and Pieter Abbeel. 2016. Deep spatial autoencoders for visuomotor learning. In 2016 IEEE International Conference on Robotics and Automation (ICRA). IEEE, 512–519.
- François-Lavet et al. (2019) Vincent François-Lavet, Yoshua Bengio, Doina Precup, and Joelle Pineau. 2019. Combined reinforcement learning via abstract representations. In Proceedings of the AAAI Conference on Artificial Intelligence, Vol. 33. 3582–3589.
- Ghose and Yang (2009) A. Ghose and Sha Yang. 2009. An Empirical Analysis of Search Engine Advertising: Sponsored Search in Electronic Markets. Manag. Sci. 55 (2009), 1605–1622.
- Guo et al. (2020) Zhaohan Daniel Guo, Bernardo Avila Pires, Bilal Piot, Jean-Bastien Grill, Florent Altché, Rémi Munos, and Mohammad Gheshlaghi Azar. 2020. Bootstrap latent-predictive representations for multitask reinforcement learning. In International Conference on Machine Learning. PMLR, 3875–3886.
- Ha and Schmidhuber (2018) David Ha and Jürgen Schmidhuber. 2018. Recurrent world models facilitate policy evolution. Advances in neural information processing systems 31 (2018).
- Hafner et al. (2019a) Danijar Hafner, Timothy Lillicrap, Jimmy Ba, and Mohammad Norouzi. 2019a. Dream to control: Learning behaviors by latent imagination. arXiv preprint arXiv:1912.01603 (2019).
- Hafner et al. (2019b) Danijar Hafner, Timothy Lillicrap, Ian Fischer, Ruben Villegas, David Ha, Honglak Lee, and James Davidson. 2019b. Learning latent dynamics for planning from pixels. In International conference on machine learning. PMLR, 2555–2565.
- Hessel et al. (2019) Matteo Hessel, Hubert Soyer, Lasse Espeholt, Wojciech Czarnecki, Simon Schmitt, and Hado van Hasselt. 2019. Multi-task deep reinforcement learning with popart. In Proceedings of the AAAI Conference on Artificial Intelligence, Vol. 33. 3796–3803.
- Jaderberg et al. (2016) Max Jaderberg, Volodymyr Mnih, Wojciech Marian Czarnecki, Tom Schaul, Joel Z Leibo, David Silver, and Koray Kavukcuoglu. 2016. Reinforcement learning with unsupervised auxiliary tasks. arXiv preprint arXiv:1611.05397 (2016).
- Kingma and Ba (2014) Diederik P Kingma and Jimmy Ba. 2014. Adam: A method for stochastic optimization. arXiv preprint arXiv:1412.6980 (2014).
- Koutsopoulos (2016) Iordanis Koutsopoulos. 2016. Optimal advertisement allocation in online social media feeds. In Proceedings of the 8th ACM International Workshop on Hot Topics in Planet-scale mObile computing and online Social neTworking. 43–48.
- Laskin et al. (2020) Michael Laskin, Aravind Srinivas, and Pieter Abbeel. 2020. Curl: Contrastive unsupervised representations for reinforcement learning. In International Conference on Machine Learning. PMLR, 5639–5650.
- Li et al. (2020) Xiang Li, Chao Wang, Bin Tong, Jiwei Tan, Xiaoyi Zeng, and Tao Zhuang. 2020. Deep Time-Aware Item Evolution Network for Click-Through Rate Prediction. In Proceedings of the 29th ACM International Conference on Information & Knowledge Management. 785–794.
- Liao et al. (2022) Guogang Liao, Xiaowen Shi, Ze Wang, Xiaoxu Wu, Chuheng Zhang, Yongkang Wang, Xingxing Wang, and Dong Wang. 2022. Deep Page-Level Interest Network in Reinforcement Learning for Ads Allocation. arXiv preprint arXiv:2204.00377 (2022).
- Liao et al. (2021) Guogang Liao, Ze Wang, Xiaoxu Wu, Xiaowen Shi, Chuheng Zhang, Yongkang Wang, Xingxing Wang, and Dong Wang. 2021. Cross DQN: Cross Deep Q Network for Ads Allocation in Feed. arXiv preprint arXiv:2109.04353 (2021).
- Liu et al. (2021) Guoqing Liu, Chuheng Zhang, Li Zhao, Tao Qin, Jinhua Zhu, Jian Li, Nenghai Yu, and Tie-Yan Liu. 2021. Return-based contrastive representation learning for reinforcement learning. arXiv preprint arXiv:2102.10960 (2021).
- Mazoure et al. (2020) Bogdan Mazoure, Remi Tachet des Combes, Thang Doan, Philip Bachman, and R Devon Hjelm. 2020. Deep reinforcement and infomax learning. arXiv preprint arXiv:2006.07217 (2020).
- Mehta (2013) Aranyak Mehta. 2013. Online Matching and Ad Allocation. Found. Trends Theor. Comput. Sci. 8 (2013), 265–368.
- Mirowski et al. (2016) Piotr Mirowski, Razvan Pascanu, Fabio Viola, Hubert Soyer, Andrew J Ballard, Andrea Banino, Misha Denil, Ross Goroshin, Laurent Sifre, Koray Kavukcuoglu, et al. 2016. Learning to navigate in complex environments. arXiv preprint arXiv:1611.03673 (2016).
- Mnih et al. (2015) Volodymyr Mnih, Koray Kavukcuoglu, David Silver, Andrei A Rusu, Joel Veness, Marc G Bellemare, Alex Graves, Martin Riedmiller, Andreas K Fidjeland, Georg Ostrovski, et al. 2015. Human-level control through deep reinforcement learning. nature 518, 7540 (2015), 529–533.
- Ni et al. (2021) Juan Ni, Zhenhua Huang, Jiujun Cheng, and Shangce Gao. 2021. An effective recommendation model based on deep representation learning. Information Sciences 542 (2021), 324–342.
- Ouyang et al. (2019) Wentao Ouyang, Xiuwu Zhang, Shukui Ren, Chao Qi, Zhaojie Liu, and Yanlong Du. 2019. Representation learning-assisted click-through rate prediction. arXiv preprint arXiv:1906.04365 (2019).
- Ouyang et al. (2020) Wentao Ouyang, Xiuwu Zhang, Lei Zhao, Jinmei Luo, Yu Zhang, Heng Zou, Zhaojie Liu, and Yanlong Du. 2020. MiNet: Mixed Interest Network for Cross-Domain Click-Through Rate Prediction. In Proceedings of the 29th ACM International Conference on Information & Knowledge Management. 2669–2676.
- Sermanet et al. (2018) Pierre Sermanet, Corey Lynch, Yevgen Chebotar, Jasmine Hsu, Eric Jang, Stefan Schaal, Sergey Levine, and Google Brain. 2018. Time-contrastive networks: Self-supervised learning from video. In 2018 IEEE international conference on robotics and automation (ICRA). IEEE, 1134–1141.
- Shelhamer et al. (2016) Evan Shelhamer, Parsa Mahmoudieh, Max Argus, and Trevor Darrell. 2016. Loss is its own reward: Self-supervision for reinforcement learning. arXiv preprint arXiv:1612.07307 (2016).
- Sohn (2016) Kihyuk Sohn. 2016. Improved deep metric learning with multi-class n-pair loss objective. Advances in neural information processing systems 29 (2016).
- Sutton et al. (1998) Richard S Sutton, Andrew G Barto, et al. 1998. Introduction to reinforcement learning. Vol. 135. MIT press Cambridge.
- Van den Oord et al. (2018) Aaron Van den Oord, Yazhe Li, and Oriol Vinyals. 2018. Representation learning with contrastive predictive coding. arXiv e-prints (2018), arXiv–1807.
- van der Pol et al. (2020) Elise van der Pol, Daniel Worrall, Herke van Hoof, Frans Oliehoek, and Max Welling. 2020. MDP homomorphic networks: Group symmetries in reinforcement learning. Advances in Neural Information Processing Systems 33 (2020).
- Vaswani et al. (2017) Ashish Vaswani, Noam Shazeer, Niki Parmar, Jakob Uszkoreit, Llion Jones, Aidan N Gomez, Lukasz Kaiser, and Illia Polosukhin. 2017. Attention is all you need. arXiv preprint arXiv:1706.03762 (2017).
- Wang et al. (2011) B. Wang, Zhaonan Li, Jie Tang, Kuo Zhang, Songcan Chen, and Liyun Ru. 2011. Learning to Advertise: How Many Ads Are Enough?. In PAKDD.
- Wang et al. (2016) Ziyu Wang, Tom Schaul, Matteo Hessel, Hado Hasselt, Marc Lanctot, and Nando Freitas. 2016. Dueling network architectures for deep reinforcement learning. In International conference on machine learning. PMLR, 1995–2003.
- Wei et al. (2020) Jianxiong Wei, Anxiang Zeng, Yueqiu Wu, Pengxin Guo, Q. Hua, and Qingpeng Cai. 2020. Generator and Critic: A Deep Reinforcement Learning Approach for Slate Re-ranking in E-commerce. ArXiv abs/2005.12206 (2020).
- Xie et al. (2021) Ruobing Xie, Shaoliang Zhang, Rui Wang, Feng Xia, and Leyu Lin. 2021. Hierarchical Reinforcement Learning for Integrated Recommendation. In Proceedings of AAAI.
- Yan et al. (2020) Jinyun Yan, Zhiyuan Xu, Birjodh Tiwana, and Shaunak Chatterjee. 2020. Ads Allocation in Feed via Constrained Optimization. In Proceedings of the 26th ACM SIGKDD International Conference on Knowledge Discovery & Data Mining. 3386–3394.
- Zhang et al. (2018) Weiru Zhang, Chao Wei, Xiaonan Meng, Yi Hu, and Hao Wang. 2018. The whole-page optimization via dynamic ad allocation. In Companion Proceedings of the The Web Conference. 1407–1411.
- Zhao et al. (2018) Mengchen Zhao, Z. Li, Bo An, Haifeng Lu, Yifan Yang, and Chen Chu. 2018. Impression Allocation for Combating Fraud in E-commerce Via Deep Reinforcement Learning with Action Norm Penalty. In IJCAI.
- Zhao et al. (2021) Xiangyu Zhao, Changsheng Gu, Haoshenglun Zhang, Xiwang Yang, Xiaobing Liu, Hui Liu, and Jiliang Tang. 2021. DEAR: Deep Reinforcement Learning for Online Advertising Impression in Recommender Systems. In Proceedings of the AAAI Conference on Artificial Intelligence, Vol. 35. 750–758.
- Zhao et al. (2020) Xiangyu Zhao, Xudong Zheng, Xiwang Yang, Xiaobing Liu, and Jiliang Tang. 2020. Jointly learning to recommend and advertise. In Proceedings of the 26th ACM SIGKDD International Conference on Knowledge Discovery & Data Mining. 3319–3327.
- Zhou et al. (2018) Guorui Zhou, Xiaoqiang Zhu, Chenru Song, Ying Fan, Han Zhu, Xiao Ma, Yanghui Yan, Junqi Jin, Han Li, and Kun Gai. 2018. Deep interest network for click-through rate prediction. In Proceedings of the 24th ACM SIGKDD International Conference on Knowledge Discovery & Data Mining. 1059–1068.
- Zhu et al. (2021) Yi Zhu, Xindong Wu, Jipeng Qiang, Yunhao Yuan, and Yun Li. 2021. Representation learning with collaborative autoencoder for personalized recommendation. Expert Systems with Applications 186 (2021), 115825.