Spatially resolved molecular interstellar medium in a quasar host galaxy
Abstract
We present high spatial resolution (04, 2.2kpc) observations of the CO, CO and [C I]369μm lines and dust continuum emission from the interstellar medium in the host galaxy of the quasar J03053150 at . These, together with archival [C II]158μm data at comparable spatial resolution, enable studies of the spatial distribution and kinematics between the ISM in different phases. When comparing the radial profiles of CO, [C II]158μm and the dust continuum, we find that the CO and dust continuum exhibit similar spatial distributions, both of which are less extended than the [C II]158μm, indicating that the CO and dust continuum are tracing the same gas component, while the [CII]158um is tracing a more extended one. In addition, we derive the radial profiles of the [C II]158μm/CO, [C II]158μm/far-infrared (FIR), CO/FIR, and dust continuum ratios. We find a decreasing ratio with radius, possibly indicating a decrease of dust optical depth with increasing radius. We also detect some of the ISM lines and continuum emission in the companion galaxies previously discovered in the field around J03053150. Through comparing the line-to-line and line-to-FIR ratios, we find no significant differences between the quasar and its companion galaxies.
1 Introduction
In the past two decades, the Atacama Large Millimeter/submillimeter Array (ALMA), the NOrthern Extended Millimeter Array (NOEMA) and the Karl G. Jansky Very Large Array (JVLA) have revealed detections of the (sub)millimeter dust and multi-phase gas emission in quasar host galaxies in the early universe. Bright CO and [C II]158μm emission lines are now frequently detected in the host galaxies of the quasars at the highest redshift. The majority of these observations are executed at spatial resolution, which trace the global interstellar medium (ISM) properties of these quasars (e.g., Wang et al. 2013, 2016; Decarli et al. 2018; Yang et al. 2019; Li et al. 2020a, b). Spatially resolved ISM observations of quasars, are only available for the brightest ISM emission lines, e.g., the [C II]158μm line. These already reveal variations of gas kinematics in the quasars, i.e., some of them suggest ordered rotation, others show complex gas kinematics with no clear velocity gradient (e.g., Shao et al. 2017; Neeleman et al. 2019; Venemans et al. 2019, 2020; Wang et al. 2019a; Novak et al. 2020; Neeleman et al. 2021). Recently, spatially resolved CO observations at a spatial resolution of 02 for a quasar have been obtained by Wang et al. (2019b), where they found a more concentrated spatial distribution of CO compared to the [C II]158μm line.
Taking advantage of the high sensitivity of ALMA, a number of companion galaxies have recently been discovered in the field of quasars at (e.g., Decarli et al. 2017, 2018; Walter et al. 2018; Mazzucchelli et al. 2019; Neeleman et al. 2019, 2021; Venemans et al. 2018, 2020). These companion galaxies are detected within 60 kpc and within of the quasar redshift and are often found to be bright in the far-infrared (FIR; 42.5122.5) continuum and the [C II]158μm line. The brightest ones have [C II]158μm luminosities comparable to or even brighter than that of the quasar host galaxies, while the less luminous companions are over an order of magnitude fainter. Direct comparisons of the quasar with their companion galaxies provide a unique view on the potential impact of the Active Galactic Nuclei (AGN) on the ISM properties. Observations of fine-structure lines and molecular CO suggest similar [O III]88μm/FIR and [C II]158μm/FIR ratios but different CO excitation between the quasars and their companions (e.g., Walter et al. 2018; Neeleman et al. 2019; Pensabene et al. 2021).
The quasar VIKING J030516.92–315056.0 (hereafter J03053150) is among the FIR brightest quasars at with a FIR luminosity of (1.60 0.06) (Venemans et al., 2019). It was also detected in the [C II]158μm line with a luminosity of (5.9 0.4) (Venemans et al., 2019). In ALMA Cycle 2, Venemans et al. (2017a) detected the CO and CO lines. ALMA observations of the [C II]158μm line with extremely high spatial resolution (, 410pc) was reported in Venemans et al. (2019), which reveal complex gas spatial distribution and kinematics. Two cavities found in the zero velocity channel map as well as the intensity map suggest that the quasar is likely to affect the spatial distribution and kinematics of its surrounding ISM in the host galaxy. In addition, three companion galaxies within 40 kpc from the quasar J03053150 were detected in [C II]158μm.
In this paper, we present spatially resolved ( 04, 2.2kpc) ALMA observations of the CO, CO, and [C I]369μm emission lines as well as the dust continuum emission of the quasar J03053150. These observations probe the molecular ISM, and enable a direct comparison of the spatial distribution and kinematics the ISM emission in different phases, when combined with previous [C II]158μm observations at similar spatial resolution. In addition, comparisons of the quasar emission with that of the companion galaxies will enable a study of the impact of the AGN on the gas properties. We adopt a standard CDM cosmology with with and , throughout this paper.
2 Observations
We obtained ALMA observations of the CO, CO, and [C I]369μm emission lines as well as the underlying continuum of J03053150 during 2017 December 04–17 (Cycle 5 program ID 2017.1.01532.S). 45-47 antennas were used in the C43–6 configuration and the baseline length was between 15 and 2517 meters. The total observing time was 3.67 hours on source. J2357–5311 was used for flux and bandpass calibration, and the phase calibrator was J0326–3243. The ALMA Band 3 receiver covered the CO line in the lower sideband and the CO and [C I]369μm lines in the upper sideband, while the remaining two spectral windows were observing the continuum emission.
To study the spatial distribution and kinematics of the ISM in different phases, we also use earlier ALMA data of the [C II]158μm line, which traces the neutral ISM (Cycle 3 program ID 2015.1.00399.S). This [C II]158μm data of J03053150 has previously been published in Venemans et al. (2020).
All the data were reduced following the standard pipeline and imaged using the TCLEAN task in CASA. To obtain a comparable beam size of the [C II]158μm with that of the CO lines, we employed natural weighting for the [C II]158μm data and Briggs weighting with a robust parameter of 0.5 for the CO lines in imaging. This leads to synthesized beam sizes of 020 020 for [C II]158μm, 044 030 for CO and 037 026 for CO and [C I]369μm in FWHM. To match the beam sizes of CO and [C II]158μm, we downgraded the spatial resolution of the [C II]158μm data to that of the CO line using the convolve2D function in CASA. We used all line-free channels to image the continuum. A first order polynomial continuum was subtracted from the datacube using UVCONTSUB task in CASA for spectral line imaging. We binned the [C II]158μm line to 35 width and the resulting rms was 0.28 per binned channel. The CO, CO, and [C I]369μm lines were also binned to 35 width and the rms was 0.13 per binned channel. All line-free channels were used for the continuum imaging. The continuum sensitivities were 5.7 and 20.3 at 98.7 and 258.1 GHz, respectively.
3 Results
3.1 The quasar
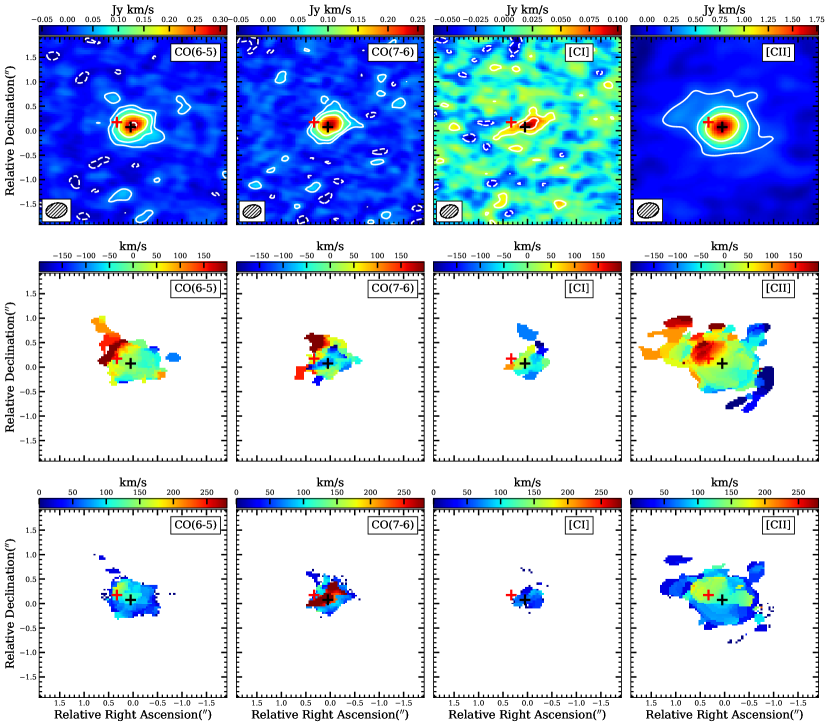
We detect the CO, CO, and [C I]369μm emission lines, as well as the underlying continuum emission of the quasar J03053150. All the spectral lines and the continuum emission are spatially resolved at our resolution of . We show the intensity, velocity and velocity dispersion maps in Figure 1. The beam-matched [C II]158μm data is shown as well for comparison (Venemans et al., 2020). We find a part with high velocity and high velocity dispersion northeast to the quasar on the CO and [C II]158μm maps. This position is coincident with the peak of the companion galaxy C1 discovered in Venemans et al. (2019). The high velocity/velocity dispersion in that region is likely a result of interactions between the quasar and C1. The velocity and velocity dispersion maps of all the spectral lines reveal some rotation and high velocity dispersion, which is consistent with results obtained for the super-high resolution [C II]158μm data (Venemans et al., 2019). We measure the source sizes of the emission lines and the continuum emissions through the CASA UVMODELFIT task in the UV-plane. This leads to a comparable source size of (0.39 0.04)(0.32 0.04) with a position angle of PA=109° 75° for the CO line, and (0.32 0.03)(0.26 0.03), PA=-68° 20° for the CO line. The [C II]158μm line suggests a larger source size of (0.51 0.02)(0.47 0.02), PA=127° 28°. The deconvolved size for the continuum emission at 98.7 GHz is (0.30 0.01)(0.28 0.01), PA=9° 43°.
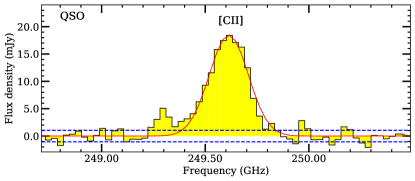
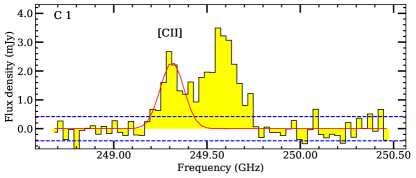
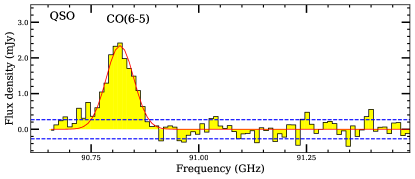
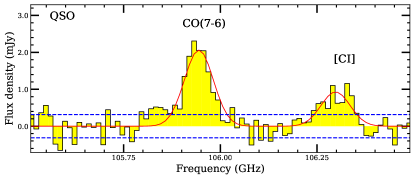
We measure the spectral line fluxes within an aperture of with the residual scaling method presented in Novak et al. (2019), to obtain emission of the quasar while avoiding possible contaminations from the close companion C1. The resulting spectra are shown in Figure 2. As the [C I]369μm emission line is not as strong as the CO lines, we assume the same line width for the CO and the [C I]369μm lines and fit the three lines, namely CO, CO, and [C I]369μm, simultaneously with three Gaussians. This leads to a line width of in FWHM, and line fluxes of 0.63 0.04, 0.55 0.04, and 0.25 0.03 for the CO, CO, and [C I]369μm lines, respectively. The derived CO and CO line fluxes are consistent with results obtained in ALMA Cycle 2 observations within the uncertainties (Venemans et al., 2017a). We fit the spectrum of the [C II]158μm line with a Gaussian profile. This yields a line width of in FWHM, and a line flux of 5.25 0.30 . The derived line widths for the [C II]158μm, CO and [C I]369μm lines are consistent within the uncertainties. The measured [C II]158μm flux is consistent with that obtained in Venemans et al. (2019) and Venemans et al. (2020). The measured line widths, fluxes, and luminosities are listed in Table 1. The continuum flux densities measured within the aperture are 0.27 0.02 mJy and 5.20 0.08 mJy at 98.7 and 258.1GHz, respectively.
3.2 Companion galaxies
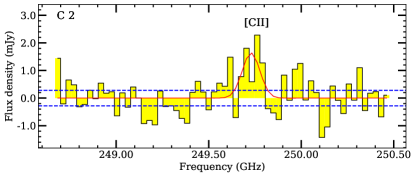
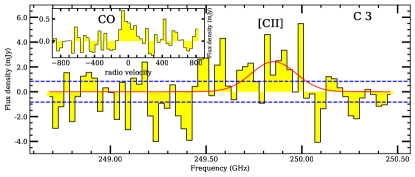
Our re-analysis of the [C II]158μm data confirms the three companion sources originally reported in (Venemans et al., 2019). In addition, we detect the CO or/and CO lines in some of the companion galaxies (namely C1, C2, and C3). The [C II]158μm, [C I]369μm, CO, and CO intensity maps of C1, C2, and C3 are shown in Figure 3. The spectral line fluxes for companion galaxies are measured in intensity maps through adopting line widths determined from super-high resolution [C II]158μm data (Venemans et al., 2019). We detect the [C II]158μm and CO lines in C1. We do not detect the CO line, possibly because of low S/N at that frequency. Considering its close distance to the quasar, we measure the line flux within a 03 radius aperture centered on the [C II]158μm peak. The resulting line fluxes are and for CO and [C II]158μm. The 3 upper limits for CO and [C I]369μm are both 0.04 . C2 is only detected in the [C II]158μm line with a line flux of , leaving 3 upper limits of 0.05, 0.04, and 0.04 for CO, CO, and [C I]369μm. As for C3, the [C II]158μm intensity map suggests an extended gas structure, while the CO and CO emission are not spatially resolved. The extended [C II]158μm feature is also observed in the super-high resolution [C II]158μm data (Venemans et al., 2019). The CO and CO fluxes of C3 are , and . The [C I]369μm flux upper limit for C3 is 0.05 . The measured [C II]158μm fluxes for the three companion galaxies are consistent with those obtained in the high-spatial resolution observations (Venemans et al., 2019). We show the spectra of [C II]158μm for the companion galaxies in Figure 2. As for the continuum detections, only C3 has been detected in the 258.1 GHz continuum, leaving a continuum flux density of 0.44 0.08 mJy. Through combining observations in different ALMA cycles, Venemans et al. (2020) detect the 258.1GHz continuum emission in all the three companion galaxies around J03053150. The non-detection of the C2 continuum at 258.1GHz thus suggests that the 3 limit of the emission surface brightness is 16.0. The 3 upper limits for the surface brightness for C2 and C3 at 98.7GHz are both 1.5. In Figure 4, we show the continuum maps at 98.7 and 258.1GHz. The peak positions of the [C II]158μm line and the 258.1GHz continuum for C3 are consistent. Details of the quasar and the companion galaxy measurements are listed in Table 1.
| J03053150 | C1 | C2 | C3 | |
| R.A. | 03h05m16.92 | 03h05m16.95 | 03h05m16.87 | 03h05m16.38 |
| Decl. | –31∘50′5592(6) | –31∘50′5574(13) | –31∘50′5526(23) | –31∘50′5496(31) |
| 6.613910.00015 | 6.62310.0003 | 6.61040.0004 | 6.60660.0006 | |
| () | 250 11 | |||
| CO flux () | 0.63 0.04 | 0.06 0.01 | 0.05 0.02 | |
| ( ) | 2.49 0.16 | 0.25 0.04 | 0.18 | 0.20 0.08 |
| Deconvolved size () | (0.39 0.04)(0.32 0.04), PA=109° 75° | |||
| CO flux () | 0.55 0.04 | 0.07 0.02 | ||
| ( ) | 2.53 0.18 | 0.19 | 0.20 | 0.31 0.08 |
| Deconvolved size () | (0.32 0.03)(0.26 0.03), PA=-68° 20° | |||
| [C I]369μm flux () | 0.25 0.03 | |||
| ( ) | 1.15 0.14 | 0.19 | 0.20 | 0.22 |
| (mJy) | 5.20 0.08 | 0.44 0.08 | ||
| (mJy) | 0.27 0.02 | |||
| Deconvolved size () | (0.30 0.01)(0.28 0.01), PA=9° 43° | |||
| () | 268 11 | |||
| [C II]158μm flux () | 5.25 0.30 | 0.48 0.03 | 0.27 0.07 | 0.87 0.31 |
| ( ) | 56.94 3.25 | 5.16 0.33 | 2.93 0.76 | 9.41 3.36 |
| Deconvolved size e () | (0.51 0.02)(0.47 0.02), PA=127° 28° | |||
| ( ) | 2.2–4.0 | 0.21–0.37 | 0.36 | 0.24–0.44 |
| ( ) | 3.0 1.3 | 0.48 | 0.44 | 0.60 |
| () | 1.4–2.6 | |||
| () |
4 Discussions
4.1 Spatial Distribution and resolved ratios of different gas tracers
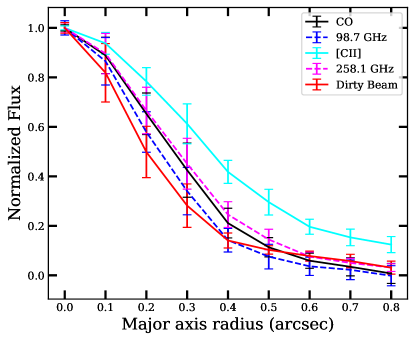
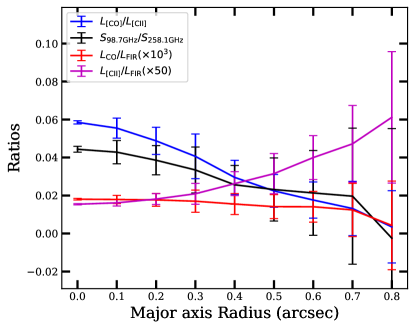
We study the dependence of the spectral line and the continuum intensities with distances to the quasar, to explore the spatial distribution of the gas in different phases and the dust. To obtain the radial profiles, we divide the intensity maps into a series of concentric rings with a width of , with the center fixed to the peak flux pixel, and the major, the minor axes and the position angle fixed to the parameters adopted from the [C II]158μm source size. To increase the S/N ratio of the CO measurements, we take the average of the CO and CO datacubes to form a mean CO intensity map. The resulting radial profiles are shown in Figure 5. All the lines and continuum show intensities that exceed the radial profile of the dirty beam (04) at large radii, implying that the sources are extended. The radial profile of CO follows that of the continuum within the uncertainties, indicating that they are possibly originated from the same gas component. The [C II]158μm radial profile reduces to half of the peak intensity at larger radius compared to that of the CO and dust continuum, which implies that the [C II]158μm emission is more extended than the CO and the continuum. This result is consistent with previous findings that the [C II]158μm line in quasars have larger source sizes than that of the mid to high-J (J ) CO and dust continuum (e.g., Shao et al. 2017; Li et al. 2020a; Venemans et al. 2020). As for low-J (J ) CO lines, Shao et al. (2019) find similar source sizes as that of [C II]158μm in a sample of three quasars, while both of which are larger than the sizes of dust continuum.
In Figure 5, we also show the radial profiles of the CO/[C II]158μm, CO/FIR, [C II]158μm/FIR ratios as well as the continuum flux density ratio (). Similar to findings in high resolution [C II]158μm observations of other quasars, the [C II]158μm/FIR ratio of J03053150 exhibits a deficit in the center and an increasing trend with increasing distance to the center. The CO/FIR ratio is almost flat with increasing radius. A decreasing trend of the CO/[C II]158μm ratio with increasing radius is consistent with an extended spatial distribution of the [C II]158μm line relative to CO assuming the spatial distribution of these two lines are Gaussian. Interestingly, we find a decreasing trend of the ratio with increasing radius.
The dust emission () is described through
| (1) |
where and are the Planck function at dust temperature and Cosmic Microwave Background temperature, respectively. is optical depth which can be further expressed as
| (2) |
is dust opacity, which depends on frequency through
| (3) |
and is dust mass surface density, which is independent on frequency. We consider two simplifications. In the first case we assume remain constant with radius, but we enable as a function of radius (). The derivatives of the dust continuum ratio () relative to is :
| (4) |
suggesting an opposite monotonicity of relative to . In the second simplification, we assume a constant throughout the source, while consider as a function of (the dependence of reduces to through ). The derivative of relative to is:
| (5) |
indicating the same monotonicity between and (or ). Accordingly, the decreasing ratio with increasing radius can be explained by (1) an increase of with assuming a uniform or (2) a decrease of or with for constant across . An increasing temperature with increasing radius seems inconsistent with the scenario of more AGN dust heating toward the center. However, we cannot rule out that the interactions between the quasar and C1 that drive the observed increasing temperature with increasing distances to the center. The second explanation is more likely to be the case, given that expected decreasing (or ) with radius.
4.2 Gas properties
We estimate the molecular gas mass of the quasar based on the CO and [C I]369μm lines. Assuming the [C I]369μm emission to be optically thin, the neutral carbon mass can be estimated through
| (6) |
where is the partition function and is the excitation temperature (Weiß et al. 2003, 2005; Venemans et al. 2017a). Adopting K from Venemans et al. 2017a, we estimate an neutral carbon mass of based on the [C I]369μm line. The neutral carbon abundance relative to molecular hydrogen is . Utilizing the neutral carbon abundance measured in infrared bright galaxies from Walter et al. (2011) of , we estimate a molecular gas mass of . We derive a molecular gas mass surface density of . We also estimate the molecular gas masses for the three companion galaxies based on their [C I]369μm upper limits. The resulting 3 upper limits for the molecular gas masses of C1, C2 and C3 are 4.8, 4.4 and 6.0, respectively.
Low- CO transitions trace the cold molecular gas, and thus can be used as molecular gas mass indicators through
| (7) |
Where is the molecular gas conversion factor, and is the CO luminosity in the unit of . is calculated from the CO flux through
| (8) |
For J03053150, we only detect the CO and CO lines. To derive molecular gas mass, we utilize the following two methods to estimate the CO flux from the CO line. (1) We employ the CO/CO ratio of the CO spectral line energy distribution model prediction for J2310+1855 (Li et al., 2020a), this leads to an estimated molecular gas mas of . (2) We use the observed CO/CO flux ratio in the range of 5.7–10.3 for quasars in Shao et al. (2019). Using the approximation that from Carilli & Walter (2013), and adopting a conversion factor for local (Ultra) Luminous Infrared Galaxies ((U)LIRGs) of (Downes & Solomon, 1998), we estimate the molecular gas mass of J03053150 from the CO lines to be 2.2–4.0 . The derived molecular gas mass surface density is 1.4–2.6 . As for the companion galaxies, the molecular gas masses based on CO are 2.1–3.7 , 3.6 and 2.4–4.4 for C1, C2 and C3, respectively. Assuming the CO lines of companion galaxies are spatially unresolved, we thus estimate the 3 lower limit of the gas mass surface density to be and for C1 and C3, respectively.
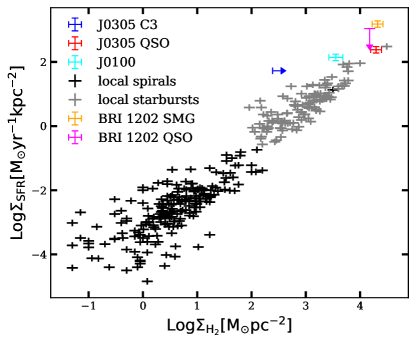
The gas masses based on CO and [C I]369μm are within the uncertainties. In Figure 6, we show the relation between the star formation rate density and molecular gas surface density for J03053150 and the companion galaxies. The derived molecular gas mass surface densities of the quasar from both CO and [C I]369μm are consistent and comparable to the maximum values found in local starburst galaxies (Kennicutt & De Los Reyes, 2021). The gas surface density 3 upper limits for C3 is consistent with the lowest value found for the average of local starburst galaxies, and higher than that of local spiral galaxies (de los Reyes & Kennicutt 2019; Kennicutt & De Los Reyes 2021). Similar as that found for other high- quasars and galaxies (e.g., J0100, BRI 1202 QSO, and BRI 1202 SMG), J03053150 and the companion galaxy C3 reside on the local star-formation law. The molecular gas masses for all the companion galaxies are an order of magnitude lower than that in the quasar.
4.3 The ISM properties of the quasar and its close companions
The ISM lines and continuum emission at (sub)millimeter provide rich information on the ISM properties. For example, when the illumination radiation field is dominated by X-rays the ISM emission in X-ray dominated regions (XDRs) tend to have lower [C II]158μm/[C I]369μm ratio compared to a radiation field dominated by UV photons (the ISM components illuminated by UV photons are generally referred to as photo-dissociation regions, PDRs). In local AGNs and (U)LIRGs, extensive observations of the FIR fine structure lines suggest a deficit of line-to-FIR ratio with increasing FIR luminosity, namely the “FIR line deficit”. High CO-to-FIR ratios are generally expected when the ISM is heated by e.g., X-rays or shocks besides UV photons from young massive stars (Uzgil et al., 2016). In this work, we detect the CO, [C II]158μm, [C I]369μm and continuum emissions in the quasar J03053150 and its three close companions. Direct comparisons between the quasar and companion galaxies thus enable us to explore the possible impacts of the central accreting supermassive black hole on the ISM.
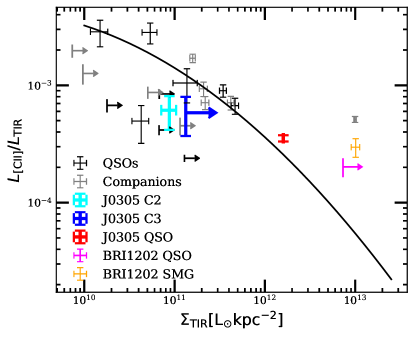
Adopting a FIR dust continuum modified black body model with parameters of and (Venemans et al., 2019), we calculate the FIR luminosities based on the [C II]158μm continuum flux densities for the quasar and the companion galaxies. We obtain CO, CO, [C I]369μm, and [C II]158μm-to-FIR ratios of , , , and for J03053150. We adopt dust continuum flux densities in Venemans et al. (2020) for FIR luminosity estimations for C1, C2, and C3. We estimate the CO, CO,[C I]369μm, and [C II]158μm to FIR luminosity ratios for C1 to be , , , and . The CO, CO,[C I]369μm, and [C II]158μm to FIR luminosity ratios of C2 are , , , and . As for C3, the ratios between CO, CO, [C I]369μm, [C II]158μm and FIR luminosity are , , , , and . We also calculate the total infrared (TIR; 81000 ) surface densities and [C II]158μm/TIR ratios of the quasar, and its companion galaxy C2 and C3 for a direct comparison with other samples. In Figure 6, we show the [C II]158μm/TIR . Similar as those found for other quasars and companion galaxies, J03053150 and its companion galaxies follow the spatially resolved [C II]158μm deficit trend of local LIRGs (Wagg et al. 2012; Jones et al. 2016; Decarli et al. 2017; Díaz-Santos et al. 2017; Neeleman et al. 2019).
In addition, we calculate the [C II]158μm/[C I]369μm ratios of the quasar J03053150 and its close companions as diagnostics between PDRs and XDRs. The quasar J03053150 exhibits a [C II]158μm/[C I]369μm ratio of 49.5, which is consistent with PDRs (Meijerink & Spaans, 2005; Meijerink et al., 2007). The lower limits of the [C II]158μm/[C I]369μm ratios for C1, C2 and C3 are 36.9, 19.5 and 49.6 respectively, which is also within the ranges for the PDR model prediction. Despite the presence of luminous AGN, the [C II]158μm/[C I]369μm ratio of J03053150 excludes the XDR dominance in the ISM excitation of the quasar. J03053150 reveals a [C II]158μm-to-CO ratio of 10. Comparable ratios are found for the companion galaxies. To summarize, we find no significant differences in the line-to-line and line-to-FIR ratios between J03053150 and its companion galaxies.
5 Summary
In this work, we present an analysis of the CO, CO, [C I]369μm lines as well as the dust continuum emission in the quasar J03053150 at 04 resolution. Some of these lines are also detected in the companion galaxies within 40 kpc from the quasar. We summarize the main results below.
We detect CO emission in two of the three companion galaxies. Their respective CO fluxes are an order of magnitude fainter than those observed in the quasar. We derive molecular gas masses and molecular gas mass surface densities for the quasar and companion galaxies from both CO and [C I]369μm luminosities. The gas mass in the quasar is an order of magnitude higher than those found for companion galaxies. The molecular gas mass surface density of the quasar is at the high end of what is found in local starburst galaxies. The upper limits for the gas mass surface densities of the companion galaxies are comparable to the lowest values found in local starburst galaxies and higher than local spiral galaxies.
We compare the radial profiles of the CO, [C II]158μm and the dust continuum emission of the quasar. The [C II]158μm profile is above both the CO and the dust continuum, suggesting a more extended spatial distribution of [C II]158μm relative to the CO and the dust continuum. CO and dust continuum have similar radial profiles, implying similar gas component as traced by the CO and the dust. In addition, we calculate the CO/[C II]158μm, [C II]158μm-to-FIR, CO-to-FIR, and dust continuum ratio profiles. The CO/[C II]158μm ratio decreases with increasing radius, confirming the more extended spatial distribution of CO compared to [C II]158μm. The decreasing [C II]158μm-to-FIR ratio with increasing distance to the center is consistent with high-resolution [C II]158μm observations of other quasars. The CO-to-FIR ratio on the other hand is almost flat with radius. We find a decreasing ratio with increasing radius, which is possibly due to a decrease of dust optical depth with increasing radius.
We compare the ISM properties in the quasar and companion galaxies through the [C II]158μm/[C I]369μm, CO/[C II]158μm, [C II]158μm-to-FIR, and CO-to-FIR ratios. No significant differences are found between the quasar and the companion galaxies. Future high-J (J10) CO observations will be critical in discriminating the differences of ISM properties between the quasar and the companions.
6 Acknowledgements
We thank Mladen Novak and Melanie Kaasinen for help with the data reduction. We thank the referee for constructive comments that helped improve our manuscript. This work was supported by the National Science Foundation of China (NSFC, 11721303, 11991052) and the National Key R&D Program of China (2016YFA0400703). R.W. acknowledges supports from the NSFC grants No. 11533001 and the Thousand Youth Talents Program of China. B.P.V. and F.W. acknowledge funding through ERC Advanced Grant 740246 (Cosmic Gas). This paper makes use of the following ALMA data: ADS/JAO.ALMA2017.1.01532.S, ADS/JAO.ALMA2015.1.00399.S. ALMA is a partnership of ESO (representing its member states), NSF (USA) and NINS (Japan), together with NRC (Canada), MOST and ASIAA (Taiwan), and KASI (Republic of Korea), in cooperation with the Republic of Chile. The Joint ALMA Observatory is operated by ESO, AUI/NRAO and NAOJ.
References
- Carilli & Walter (2013) Carilli, C. L. & Walter, F. 2013, ARA&A, 51, 105. doi:10.1146/annurev-astro-082812-140953
- Cormier et al. (2015) Cormier, D., Madden, S. C., Lebouteiller, V., et al. 2015, A&A, 578, A53. doi:10.1051/0004-6361/201425207
- Decarli et al. (2017) Decarli, R., Walter, F., Venemans, B. P., et al. 2017, Nature, 545, 457. doi:10.1038/nature22358
- Decarli et al. (2018) Decarli, R., Walter, F., Venemans, B. P., et al. 2018, ApJ, 854, 97. doi:10.3847/1538-4357/aaa5aa
- de los Reyes & Kennicutt (2019) de los Reyes, M. A. C. & Kennicutt, R. C. 2019, ApJ, 872, 16. doi:10.3847/1538-4357/aafa82
- Díaz-Santos et al. (2017) Díaz-Santos, T., Armus, L., Charmandaris, V., et al. 2017, ApJ, 846, 32. doi:10.3847/1538-4357/aa81d7
- Downes & Solomon (1998) Downes, D. & Solomon, P. M. 1998, ApJ, 507, 615. doi:10.1086/306339
- Farrah et al. (2013) Farrah, D., Lebouteiller, V., Spoon, H. W. W., et al. 2013, ApJ, 776, 38. doi:10.1088/0004-637X/776/1/38
- Jones et al. (2016) Jones, G. C., Carilli, C. L., Momjian, E., et al. 2016, ApJ, 830, 63. doi:10.3847/0004-637X/830/2/63
- Kennicutt & De Los Reyes (2021) Kennicutt, R. C. & De Los Reyes, M. A. C. 2021, ApJ, 908, 61. doi:10.3847/1538-4357/abd3a2
- Li et al. (2020a) Li, J., Wang, R., Riechers, D., et al. 2020, ApJ, 889, 162. doi:10.3847/1538-4357/ab65fa
- Li et al. (2020b) Li, J., Wang, R., Cox, P., et al. 2020, ApJ, 900, 131. doi:10.3847/1538-4357/ababac
- Mazzucchelli et al. (2019) Mazzucchelli, C., Decarli, R., Farina, E. P., et al. 2019, ApJ, 881, 163. doi:10.3847/1538-4357/ab2f75
- Meijerink & Spaans (2005) Meijerink, R., & Spaans, M. 2005, A&A, 436, 397
- Meijerink et al. (2007) Meijerink, R., Spaans, M., & Israel, F. P. 2007, A&A, 461, 793
- Neeleman et al. (2019) Neeleman, M., Bañados, E., Walter, F., et al. 2019, ApJ, 882, 10. doi:10.3847/1538-4357/ab2ed3
- Neeleman et al. (2021) Neeleman, M., Novak, M., Venemans, B. P., et al. 2021, ApJ, 911, 141. doi:10.3847/1538-4357/abe70f
- Novak et al. (2019) Novak, M., Bañados, E., Decarli, R., et al. 2019, ApJ, 881, 63. doi:10.3847/1538-4357/ab2beb
- Novak et al. (2020) Novak, M., Venemans, B. P., Walter, F., et al. 2020, ApJ, 904, 131. doi:10.3847/1538-4357/abc33f
- Neeleman et al. (2021) Neeleman, M., Novak, M., Venemans, B. P., et al. 2021, ApJ, 911, 141. doi:10.3847/1538-4357/abe70f
- Pensabene et al. (2021) Pensabene, A., Decarli, R., Bañados, E., et al. 2021, A&A, 652, A66. doi:10.1051/0004-6361/202039696
- Shao et al. (2017) Shao, Y., Wang, R., Jones, G. C., et al. 2017, ApJ, 845, 138. doi:10.3847/1538-4357/aa826c
- Shao et al. (2019) Shao, Y., Wang, R., Carilli, C. L., et al. 2019, ApJ, 876, 99. doi:10.3847/1538-4357/ab133d
- Spinoglio et al. (2015) Spinoglio, L., Pereira-Santaella, M., Dasyra, K. M., et al. 2015, ApJ, 799, 21. doi:10.1088/0004-637X/799/1/21
- Uzgil et al. (2016) Uzgil, B. D., Bradford, C. M., Hailey-Dunsheath, S., et al. 2016, ApJ, 832, 209. doi:10.3847/0004-637X/832/2/209
- Venemans et al. (2016) Venemans, B. P., Walter, F., Zschaechner, L., et al. 2016, ApJ, 816, 37. doi:10.3847/0004-637X/816/1/37
- Venemans et al. (2018) Venemans, B. P., Decarli, R., Walter, F., et al. 2018, ApJ, 866, 159. doi:10.3847/1538-4357/aadf35
- Venemans et al. (2019) Venemans, B. P., Neeleman, M., Walter, F., et al. 2019, ApJ, 874, L30
- Venemans et al. (2017a) Venemans, B. P., Walter, F., Decarli, R., et al. 2017, ApJ, 845, 154. doi:10.3847/1538-4357/aa81cb
- Venemans et al. (2017b) Venemans, B. P., Walter, F., Decarli, R., et al. 2017, ApJ, 851, L8. doi:10.3847/2041-8213/aa943a
- Venemans et al. (2020) Venemans, B. P., Walter, F., Neeleman, M., et al. 2020, ApJ, 904, 130. doi:10.3847/1538-4357/abc563
- Weiß et al. (2003) Weiß, A., Henkel, C., Downes, D., et al. 2003, A&A, 409, L41. doi:10.1051/0004-6361:20031337
- Walter et al. (2018) Walter, F., Riechers, D., Novak, M., et al. 2018, ApJ, 869, L22. doi:10.3847/2041-8213/aaf4fa
- Wagg et al. (2012) Wagg, J., Wiklind, T., Carilli, C. L., et al. 2012, ApJ, 752, L30. doi:10.1088/2041-8205/752/2/L30
- Walter et al. (2011) Walter, F., Weiß, A., Downes, D., et al. 2011, ApJ, 730, 18. doi:10.1088/0004-637X/730/1/18
- Wang et al. (2019b) Wang, F., Wang, R., Fan, X., et al. 2019, ApJ, 880, 2. doi:10.3847/1538-4357/ab2717
- Wang et al. (2013) Wang, R., Wagg, J., Carilli, C. L., et al. 2013, ApJ, 773, 44. doi:10.1088/0004-637X/773/1/44
- Wang et al. (2016) Wang, R., Wu, X.-B., Neri, R., et al. 2016, ApJ, 830, 53. doi:10.3847/0004-637X/830/1/53
- Wang et al. (2019a) Wang, R., Shao, Y., Carilli, C. L., et al. 2019, ApJ, 887, 40. doi:10.3847/1538-4357/ab4d4b
- Weiß et al. (2005) Weiß, A., Downes, D., Henkel, C., et al. 2005, A&A, 429, L25. doi:10.1051/0004-6361:200400085
- Yang et al. (2019) Yang, J., Venemans, B., Wang, F., et al. 2019, ApJ, 880, 153. doi:10.3847/1538-4357/ab2a02