section[1cm]
1.\contentspage
Online Supplemental
Material
Laser-probing the rotational cooling of molecular ions by electron
collisions
Ábel Kálosi1,2,
Manfred Grieser1,
Robert von Hahn1,
Ulrich Hechtfischer1,†,
Claude Krantz1,‡,
Holger Kreckel1,
Damian Müll1,
Daniel Paul1,
Daniel W. Savin2,
Patrick Wilhelm1,
Andreas Wolf1,
Oldřich Novotný1
1Max-Planck-Institut für Kernphysik, 69117 Heidelberg,
Germany
2Columbia Astrophysics Laboratory, Columbia University, New York, NY 10027, USA
†Now at: ASML Nederland B.V., Veldhoven, The Netherlands
‡Present address: GSI Helmholtz Centre for Heavy Ion Research, 64291 Darmstadt
In this Supplemental Material we present the background of our measurements on inelastic electron collisions with CH+ and the modeling calculations we use for analyzing the results. We summarize the basic parameters of CH+ and its radiative rotational cooling. Details are given for the experimental procedure of the laser measurements to determine rotational level populations. We then describe the parameters of our merged-beams electron–ion interaction setup and discuss how the measurements are affected by a metastable electronic state of CH+ and by the rotational-level dependent dissociative recombination of this ion. We also summarize calculations on the inelastic electron collision cross sections and the resulting rotational transition rates for our study.
List of Supplemental Material
1[2]
2CH+ energy levels and radiative cooling
| Level | 111Scaled by using ; rounded value | ||||||
|---|---|---|---|---|---|---|---|
| (cm-1) | (cm-1) | ( cm-1) | (cm-1) | (cm-1) | (Å) | (Å) | |
| , 222Data from Ref. [3] | 0 | 13.93070(19) | 1.3761(21) | 2857.561(22) | 14.177461(75) | 1.1308843(30) | 1.1409 |
| , 333Data from Ref. [4] unless stated otherwise in this row. | 9530(50)444Band origin of the -, - band ([4], Table IX) | 13.7770(34) | 1.4760(70) | 2631(30)555Ref. [5] with uncertainty estimated from remark included there | 14.08(2) | 1.1348(8) | 1.147 |
| , 22footnotemark: 2 | 24118.726(14) | 11.42351(18) | 1.9800(19) | 1864.402(22) | 11.88677(72) | 1.235053(37) | 1.2598 |
The main properties of the molecular ground state and the first two bound, electronically excited levels of CH+ are summarized in Table S1. This uses the experimental values [3] from the spectroscopy of the allowed – transitions. Moreover, the parameters deduced from experimental studies [5, 4] of the metastable level are included. For the rotational levels of the ground state (rotational quantum number ), we use the recent rotational constants from terahertz spectroscopy [6] with relative deviations from Table S1 of 10-4. This yields the energy levels given in Table S2.
For calculating the radiative transition probabilities between rotational levels in the , ground state we use the steps described earlier [7]. The Einstein coefficient for the spontaneous decay of level is obtained as [2]
| (S1) |
where with the level energies and is the permanent electric dipole moment of the , CH+ molecule. We use the most recent theoretical value [8] D (1 = 2.541748 D), calculated at an internuclear separation of 2.1530 Å. This separation agrees reasonably with the average internuclear distance for , of Table S1. In these equations, is the velocity of light, the vacuum permeability, Planck’s constant and the elementary charge.
| Energy | ||||
|---|---|---|---|---|
| (cm-1) | (eV) | (s-1) | (s) | |
| 0 | 0 | 0 | 0 | |
| 1 | 27.86 | 0.003454 | 0.00640 | 156.1 |
| 2 | 83.54 | 0.010357 | 0.0614 | 16.29 |
| 3 | 167.0 | 0.02070 | 0.2213 | 4.52 |
| 4 | 278.1 | 0.03448 | 0.524 | 1.846 |
| 5 | 416.7 | 0.05166 | 1.076 | 0.929 |
The property of the ambient radiation field relevant for absorption and total emission on a rotational transition with wavenumber is the occupation number of the vacuum modes at , which for a thermal radiation field at a temperature is
| (S2) |
with the Boltzmann constant . The decay rate by spontaneous and stimulated transitions from a level into the next lower one is then given as
| (S3) |
while the excitation rate by radiative absorption from into the next higher level is
| (S4) |
We use a superposition of two thermal components, one at K at a small relative fraction and a main component at an effective cold radiation temperature , (), where is fitted to the radiative cooling data. This yields the effective occupation number
| (S5) |
When the CH+ ions begin to be stored in the CSR after their production in the ion source, a significant fraction of them is found to populate the metastable state. Most levels (except the , symmetry level, which is expected to be much longer lived [4] and is further discussed in Supplemental Sec. 19) decay with an average lifetime that was previously measured [9] to be close to 7 s. As long storage times up to 600 s are the main concern of this work, we begin modeling the level populations in the , ground state at a time of 21 s (), starting with the measured populations of the lowest rotational levels in , . After this time, we neglect all population in higher excited levels of the metastable state that could decay into the selected low- levels based on the experimentally observed disappearance of the fraction of the dissociative recombination (DR) signal which we can uniquely attribute to the metastable state by storage-time dependent molecular fragment imaging (further discussed in Supplemental Sec. 19).
5CH+ storage and laser probing of rotational energy levels
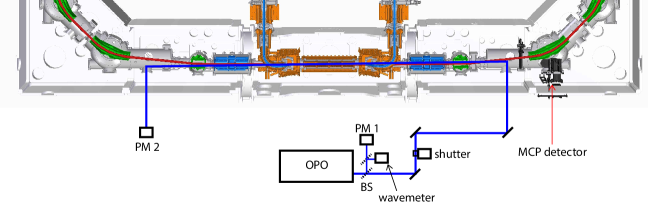
The method for laser probing of rotational levels is similar to that used in previous work [10] at the CSR. Pulses from a tunable optical parametric oscillator (OPO) laser (Ekspla NT342b, repetition rate 20 Hz) are directed into the CSR. Conditions different in the present experiment are discussed in the following. In the present setup, the laser counterpropagates relative to the ion beam (see Fig. S1) with a grazing angle of 1.5∘. The laser wavelength (near 306 nm) is continuously monitored by a wavemeter (HighFinesse/Ångstrom Laser Spectrum Analyzer LSA UV-I, HighFinesse GmbH, Tübingen, Germany). Hence, the applied laser wavenumber is specified with 0.1 cm-1 stability over the duration of the experiment and a calibration uncertainty of 1 cm-1. In addition to the wavemeter yields the spectral width of the applied laser light. For modeling the photodissociation spectrum, we use a Gaussian distribution of with a full width at half maximum (FWHM) of 6.1(3) cm-1 [ cm-1]. The laser pulse energy is measured pulse by pulse (see power monitors in Fig. S1) and variations of the pulse energy transmitted through the CSR (typically 0.1–0.2 mJ) are measured with 5% uncertainty for normalizing the photodissociation signal to the irradiated photon flux.
The CH+ ions are stored at a beam energy near 279.5 keV with run-by-run variations monitored on an 10-4 (0.03 keV) level by ion revolution frequency measurements. The absolute energy has a relative uncertainty of , corresponding to 0.8 keV. The beam velocity is (with the velocity of light) where , with its relative variations being monitored with uncertainty for the purpose of Doppler correction of the laser wave number. The typical number of ions stored in the CSR is 107. The overlap length of the ion beam with the grazing laser beam is m, corresponding to 1% of the CSR circumference. This yields an ion number on the order of in the laser overlap region. For recombination rate measurements was reduced by a factor of 101 to avoid saturating the neutral product detector.
By the Doppler correction, the wave number in the ion rest frame () is obtained from the laser wave number as
| (S6) |
The Doppler correction cm-1 can be monitored for each run with an uncertainty of (0.01 cm-1), while the uncertainty of the absolute size of the Doppler correction is (0.35 cm-1). Owing to the low beam velocity of the present experiment, this uncertainty is about a factor of 3 lower than in the CH+ photodissociation experiment at the TSR () [1], where the Doppler correction constitutes the dominant component of the uncertainty (1.1 cm-1) in the CH+ dissociation energy measured by that experiment.
The microchannel plate (MCP) detector (see Fig. S1) detects neutral fragments from the interaction section of the CSR. The fragments induced by laser pulses reach the detector with a time spread of s, spaced by 50 ms corresponding to the pulse repetition frequency. In the breaks between pulses, a continuous neutralization rate of the circulating CH+ ions of the order of 103 s-1 is observed, stemming from the CH+ collisions with the residual gas. Laser-induced neutral count rates were recorded in time gates of 0.6 s duration synchronized with the laser pulses at wavenumbers () and [see Fig. 1(b) of the main paper]. The value cm-1 was added to the probing wavenumbers in order to monitor the full background rate , which includes any laser-induced events not related to the levels of , CH+. Moreover, a summed rate for the continuous background from any neutrals formed in collisions of CH+ ions with residual gas molecules was obtained from a 90-s gate ending 12 s before and another 40-s gate starting 2.4 s after each laser pulse. Together with the laser pulse energy , the normalized photodissociation signal is found as
| (S7) |
To yield the photodissociation signals, pulses at a given laser wavenumber were typically repeated during 4 s before setting the next value of () or in the measurement cycle. Doppler corrected values are given for all probing wave numbers.
(a) (b)
(b)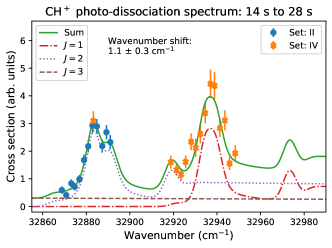
(c)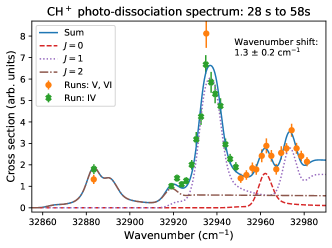 (d)
(d)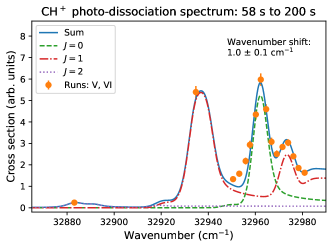
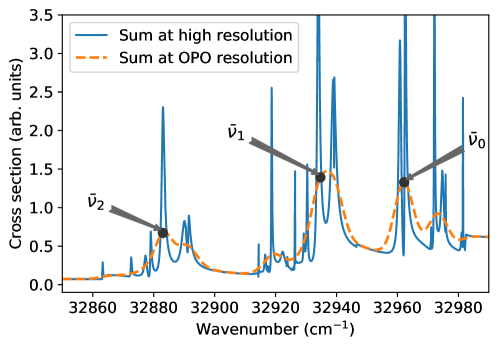
The rotational probing makes use of the resonant structure of the near-threshold CH+ photodissociation, in which rotationally resolved predissociation resonances are observed and are found to be in excellent agreement with theoretical predictions. The underlying theory uses experimentally adjusted fine-structure resolved molecular potential curves and is based on Hechtfischer et al. [1] and Barinovs and van Hemert [11], with details discussed in the supplement of O’Connor et al. [10]. Using the calculated cross sections for separate initial CH+() ions, a rotationally averaged spectrum
| (S8) |
() is shown in Fig. S2 after convolution over a Gaussian broadened wavenumber distribution, illustrating the present experimental resolution. The rotational populations are set for a thermal distribution with a rotational temperature at the upper end of the range of interest here, yielding dominant resonant contributions for , together with small, smooth contributions for (mainly) . In contrast to previous work [10] at CSR, the data are not acquired at full two-dimensional (time and wavenumber) resolution, but at the set of probing wave numbers only.
For rotational probing, the measured signals , with from Eq. (S7), are expressed as
| (S9) |
with and the probing amplitudes . Detailed scans of the photodissociation signal (Fig. S3) were performed for calibrating the probing amplitudes and in particular the shift , which accounts for the residual uncertainty of the absolute wave number scale and the dissociation energy of CH+. In fact, these scans already observe the temporal change of the rotational populations . Considering the radiative lifetimes of the levels in the ground state (Table S2), significant contributions are expected to include for s and for s. The spectra observed in the indicated time windows were fitted to theoretical cross sections
| (S10) |
The ensemble of fit results shows that, relating to the scale of the applied wavemeter after the Doppler correction, the probing amplitudes can be obtained from the calculated, Gaussian convoluted cross sections when shifting the wavenumber scale of these results up by cm-1. The fitted relative amplitudes of the -specific contributions in the time windows of Fig. S3(b) and (c) then allow us to derive the rotational populations within the electronic state.
The purpose of the measurements is to track the rotational populations in the electronic state once that its feeding from the metastable state, with a measured average lifetime s, can be neglected. We consider that we can neglect this feeding for storage times s. From the results of Fig. S3(b) and (c) (with only a minor effect of the in the earlier one of these time windows), we estimate the starting populations in the levels of the ground state as given in Table S3. Effects of decay in the earlier one of these time windows is included in the given uncertainties. Populations in rotational levels with lifetimes of 2 s are neglected.
| 0 | 0.03 |
|---|---|
| 1 | 0.39 |
| 2 | 0.43 |
| 3 | 0.15 |
8Merged-beams electron collisions
The electron beam is merged with the circulating ion beam (see Fig. S1) with the help of a bent magnetic guiding field (20 mT in the bending regions and 10 mT in the overlap region with the ion beam). After being transported from the electron source at 20 eV, the electrons are decelerated in 0.85 m long drift tube to an energy of 11.79 eV, at which the beam velocity is matched to that of the stored ion beam (279.4 keV kinetic energy). The velocity distribution in the co-moving frame of the electron beam is anisotropic with respect to the beam direction with a transverse temperature and a longitudinal temperature . The electrons are emitted from a laser-illuminated photocathode operated near room temperature. It was shown [12] that the transverse temperatures of the emitted electrons then approach the bulk temperature (i.e., thermal energy meV/). The magnetic guiding field strength at the cathode exceeds the field strength in the interaction region by a factor of 20. Correspondingly, through the inverse magnetic-bottle effect, the transverse temperature in the interaction region is reduced compared to the emission temperature by approximately this factor [13] (i.e., meV). From initial operating experience at the CSR electron cooler, is estimated to be somewhat larger than the theoretical limit (1.3 meV) and to lie between 1.5 meV and 3 meV. In Supplemental Sec. 16 we discuss how we determined the best-fit value of for this work.
The current profile of the electron beam was measured and is approximated by a cylindrical beam with a diameter of mm in the interaction region.
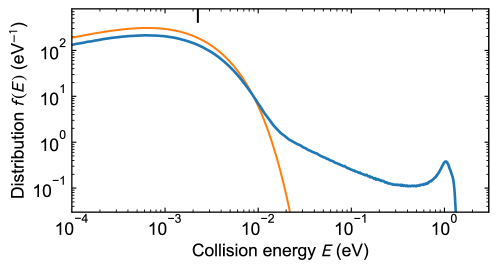
While the relative velocity between electrons and ions is minimized by adjusting the precise electron velocity such that the electron cooling effect [14] on the ion beam is maximized, the velocity spread due to the beam temperatures leads to finite collision energies. Moreover, in the merging regions, electrons and ions interact at increased relative velocities. Using the geometry of the merging regions and the deceleration fields around the drift tube, the relative velocities are modeled by Monte-Carlo integration over the complete ion beam length of m where both, electrons and ions, are present. This model also takes into account the electron beam temperatures (assuming Maxwellian velocity distributions) and the experimental ripple and noise on the voltage difference between the cathode and the interaction drift tube. Based on measurements for the situation during the CH+ beam time, root mean square (r.m.s.) voltage fluctuations of 0.1 V are inserted in the model calculations. The resulting collision energy distribution is shown in Fig. S4 for meV. The low-energy part () can be very well fitted by the scaled energy distribution, , resulting from a bi-modal Maxwellian electron velocity distribution, with the normalized energy distribution reading
| (S11) |
The parameters of this fit are and . The case shown in Fig. S4 leads to a fitted meV, with this value being dominated by the effect of the electron beam acceleration voltage fluctuations. Moreover, the fraction of the modeled distribution fitted by the normalized function of Eq. (S11) is . Hence, 70% of the total ion–electron overlap length, corresponding to m, contributes with a narrow energy distribution (), while for 30% of the effective collision energy distribution is much wider with up to 1 eV of collision energy.
For the laser probing studies of rotationally inelastic collisions, reported here, the electron current was 18.5 A. Together with the measured effective electron beam radius and the electron velocity in the central part of the interaction region, this yields an electron density of cm-3, where the uncertainty is dominated by the knowledge of the electron current profile.
Dissociative recombination (DR) measurements used the same MCP detector (see Fig. S1) as that applied for the photodissociation measurements. In DR measurements, this detector continuously counts the neutral products from the electron–ion interaction region and also analyzes their kinetic energy release (KER) by measuring the transverse distance between the pairs of neutrals formed by DR.
For any electron-induced process (such as DR or inelastic collisions) the energy dependent cross section leads to a merged-beams rate coefficient
| (S12) |
where is the electron mass.
Based on the experience that by optimizing the electron cooling the ion beam is approximately centered within the electron beam, we assume concentric beams for our modeling of the experimental situation. The ion beam profile in the interaction region is measured by imaging the center-of-mass of coincident two-fragment DR events on the imaging detector and derived from these data by taking into account the projection of the neutral fragment trajectories from the interaction region to the detector. Here, the ion beam size and its divergence are assumed to be related [15] by the known focusing properties of the storage ring [16]. The determined r.m.s. ion beam sizes in the horizontal direction (bending plane of the storage ring) and the vertical size , reached after after electron cooling times of s and 20 s, are listed in Table S4. Assuming a Gaussian beam profile, we describe the normalized transversal density distribution by
| (S13) |
Conversion to polar coordinates yields
| (S14) |
with for and , and . The transverse overlap fraction for an electron beam radius is then
| (S15) |
with the angular integration of Eq. (S14) being equivalent to the integral representation of the modified Bessel function . The integral of Eq. (S15) is easily calculated numerically. Using the measured electron beam diameter [ mm, see p. 7] leads to the results for listed in Table S4. We conclude that the overlap efficiency appropriate to our 50% duty cycle measurement conditions is .
| s | s | |
|---|---|---|
| (mm) | 2.98(30) | 2.40(24) |
| (mm) | 1.70(17) | 1.56(16) |
| 0.88(4) | 0.95(2) | |
| (mm) | 2.45(22) | 2.07(19) |
| Effective FWHM diam. (mm) | 5.77(52) | 4.87(45) |
For a round beam of r.m.s. radius the overlap fraction would be . The that yields is
| (S16) |
The radii and FWHM diameters for an equivalent round ion beam are included in Table S4. They lead to the 6 mm effective ion beam diameter quoted in the main paper.
For ions circulating in the storage ring, the rate of the collisionally induced process is then
| (S17) |
All results were obtained with the given (see p. 7). The factor linking all collisional rates to is cm-3, representing the effective average of the electron density over the storage ring circumference.
11Theoretical results on CH+ rotationally inelastic collisions
The cross section for rotationally inelastic collisions of electrons with positive molecular ions can be calculated [17, 18] in compact form using the Coulomb–Born (CB) approximation, which assumes the free-electron wave functions for a Coulomb potential of the ion and multipole interaction with the molecular charge distribution to be valid at all distances from the molecular center of mass. For free–free transitions of the incident electron leading to molecular excitation, the cross section for electric dipole interaction in first-order perturbation theory is obtained for rotational excitation as
| (S18) |
where is the incident electron energy and the excitation energy, the molecular electric dipole moment (in the vibrational ground state for the present case). and are the atomic unit of energy and the Bohr radius, respectively.
The angular factors apply to rotational levels in a electronic state. The Gaunt factor represents the integral over the continuum Coulomb wave functions with the parameters and . We interpolate from the recent high-accuracy tabulation by van Hoof et al. [20]. The Gaunt factors near threshold () are close to and significantly vary only for . Hence, Eq. (S18) implies that abruptly rises to at and, at higher , decreases approximately proportional to .
The CB expression Eq. (S18) is also suitable for estimating vibrational excitation. The related excitation cross section for in the harmonic approximation, after summing over rotational final states, is obtained [17] by replacing
| (S19) |
with the dipole moment derivative at the equilibrium distance (where , with the reduced mass , is the root-mean-square spatial extension of the vibrational ground-state probability distribution), using also the appropriate excitation energy . The increasing and the mostly smaller size of the dipole moment expression in general lead to a significantly smaller excitation cross section for vibration than for rotation.
The significant deviations expected from the assumptions of the CB approximation in the inner molecular region were considered for rotational excitation in recent -matrix calculations for a number of small diatomic molecules, including CH+ [19]. Excitation cross section data underlying the rate coefficients presented in Ref. [19] were made available to us by the authors. They are given on an electron energy grid from 0.01 eV in steps of 0.02 eV, thus starting somewhat above the to threshold (0.00346 eV). Using the cross-section data on this rather coarse energy grid, we determine intermediate values by linear interpolation on a double-logarithmic scale (thus requiring a constant power law between any two points). Moreover, from the lowest grid point above the threshold we extrapolate down in using the power law of the next-higher interpolation interval.
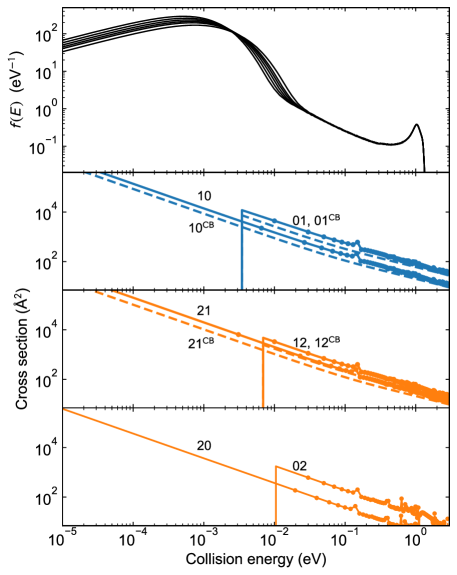
Inelastic electron-impact cross sections for CH+ based on Eq. (S18) and on the calculations by Hamilton et al. [19] are shown in Fig. S5. In addition to excitation cross sections , the de-excitation cross sections are also shown, which for a given pair of levels can be obtained using the principle of detailed balance,
| (S20) |
where are the statistical weights of the bound molecular levels. The -matrix results in Fig. S5 show very similar trends as the compact CB results, with the difference essentially consisting in the value of the excitation cross section at threshold, . Moreover, the CB results follow the dipole selection rule of , while the -matrix calculations show significant contributions also for . In the present context we consider including the -matrix results with .
The experimental collision energy distributions shown in the top frame of Fig. S5 suggest that, while de-excitation will be dominant, also excitation will occur and sensitively depend on the transverse electron temperature.
The rates of inelastic transitions are obtained from the merged-beams rate coefficients according to Eq. (S12), using the energy distribution for matched average electron and ion beam velocities and the cross sections . To illustrate the relevance of the various electron energies, we consider equally spaced bins on a logarithmic energy scale such that, for to a base ,
| (S21) |
With and we obtain the integrand
| (S22) |
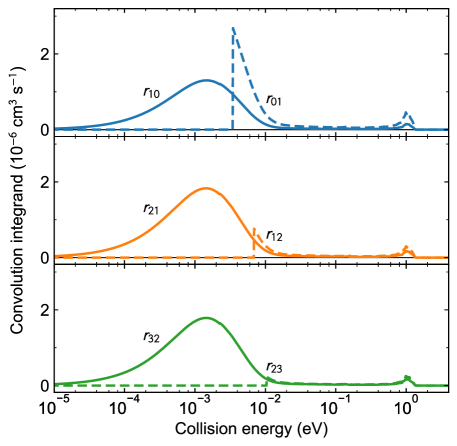
The energy dependent contributions to the logarithmic integral Eq. (S21) can be visualized directly through the graphical area under the functions when plotted with the logarithmic energy scale. They are presented in Fig. S6 for the dipole-allowed excitation and de-excitation channels with the lowest .
The numerical integration makes use of the exponential decrease of at high energy and can be performed conveniently from the sum over bins on a fine grid in . At low energy () both, and , remain finite for the cooling channels (). Here we extend the explicit calculation of down to a limit so that for the energy distribution and the cross sections are well approximated by
| (S23) |
With this implies for
| (S24) |
such that Eq. (S21) can be replaced by
| (S25) |
The chosen limit corresponds to the lowest value on the logarithmic scale shown in Fig. S6.
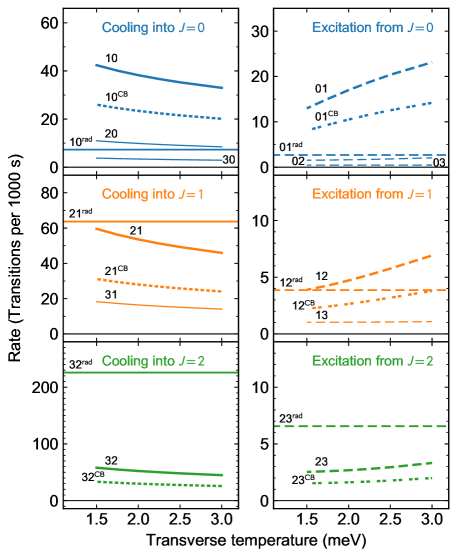
The inelastic rates for our experimental conditions are obtained according to Eq. (S17) by multiplication of with the fixed ring-averaged electron density, for which we here assume the value of cm-3. The results are shown in Fig. S7 for the estimated experimental range of the transverse electron temperature discussed above.
For comparison, Fig. S7 includes also the radiative transition rates for rotational cooling and excitation from Eqs. (S3) and (S4). It can be seen that the additional effect of inelastic electron collisions is expected to substantially exceed the radiative rates for the transitions between the rotational ground state and the excited state. Thus, the time constant (reciprocal rate) is 141 s for radiative cooling [at the fitted CSR effective occupation number, Eq. (S5)] and is expected to become 25 s through inelastic electron collisions. Between the levels and 1, electronic and radiative rates are of similar size for both cooling and excitation, while for the level pair and 2 the electronic rates are small compared to radiational cooling and excitation. Note that the collisional cooling rates keep their magnitude for higher , while the radiative cooling rates rapidly increase with . For the comparison with the experimental results, we consider that rotational levels will have relaxed radiatively after s of storage and neglect their population at later times. The rotational population model is hence restricted to the three levels .
14Time dependent modeling
The relative rotational populations in the stored beam are defined as where is the total number of stored ions. We consider total rates leading to transitions , which conserve the . The master equation for the relative populations is given by
| (S26) |
where
| (S27) |
with the radiative rates from Eqs. (S3) and (S4) and the inelastic collision rates as presented in Fig. S7. ( denotes the Kronecker delta.)
The equilibrium populations follow from setting in Eq. (S26). Considering radiation only (), Eqs. (S3), (S4) and (S27) lead for the equilibrium population ratio of two subsequent rotational levels to
| (S28) |
Assuming a fully thermal radiation field, i.e., according to Eq. (S2) with an effective temperature , results for in
| (S29) |
This is used to derive in the main paper.
Changes of the relative rotational populations can also be caused by the DR in merged-beams collisions at matched electron and ion velocities, according to the level-dependent loss rates . As these collisions lead to a change in the total ion number , the effect on is described by the non-linear equation
| (S30) |
which follows from , considering the time derivatives of both and . We explicitly consider Eq. (S30) in the model used for Fig. 3 of the main paper. For the purpose of a rough estimate, consider the rate of population change in a two-level system ( and 1) with . Eq. (S30) then leads to
| (S31) | ||||
The result of this estimate is given in Supplemental Sec. 22.
17Constraining the transverse temperature

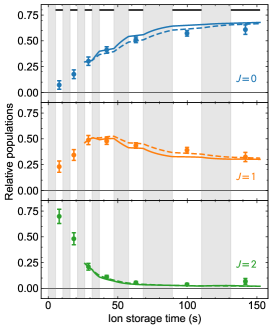


The uncertainty of translates into an uncertainty of the modeled inelastic rates. Since we measure the rotational populations for up to 150 s, while the expected total cooling time constants () amount to at most 25 s (see Fig. S7), the longest storage time should already come close to the collisional equilibrium populations. The rotational levels most sensitive to this equilibrium are and 1. We have calculated time-dependent models of for a set of discrete values of in the estimated experimental range (see Fig. S8) and compare these results to the populations measured by laser probing. The best agreement of the modeled with the measurement in the final probing interval ( s) is obtained for the model with meV. From this we conclude the experimentally constrained value of meV used in the main paper.
20Metastable electronically excited CH+ state
The excitation of the metastable electronic state in the stored ion beam is revealed by the KER of the neutral DR products observed at the MCP. The ground state of CH+ lies 7.18 eV above the lowest neutral level C() + H(). In DR at near-zero electron collision energy (matched beam velocities) the mainly populated final state is C() + H() with a KER close to 5.9 eV. Higher excited singlet and triplet terms, starting at 7.48 eV with C(), cannot be reached from the CH+ ground state. Conversely, the lowest triplet state of CH+ lies 1.18 eV above CH. Hence, DR of low-energy electrons with the metastable CH+ ions can reach such higher excited terms. The C() term (7.95 eV above the C ground state) is found here (as earlier by Amitay et al. [9]) to be by far the dominating channel for low-energy DR of CH. The KER, whose value identifies the final as well as the initial levels of the DR process, is near 0.4 eV, much lower than that for the CH+ ground state. DR events with higher KER, and thus lower lying terms of the C atom as final channels, were not detected from metastable CH+ ions.
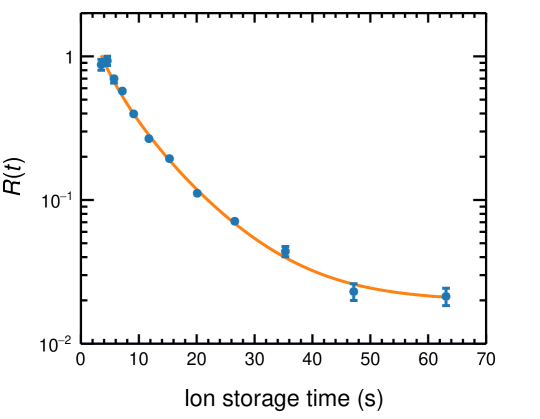
We follow the earlier procedure [9] and extract the relative DR signals (at matched beam velocities) from the () and () states by analyzing the magnitude of the contribution with low KER, assigned to the metastable state, to the observed DR-product imaging distribution as a function of storage time. Assuming a constant ratio of the effective (i.e., -averaged) DR cross sections for the metastable and the ground states , the ratio of these DR signals can be expressed in terms of the relative metastable population as
| (S32) |
The storage times for the present data extend up to 100 s while they were limited to 25 s in the previous measurements [9]. Starting at the times of s after injection, we can account for the data (see Fig. S9) by assuming a single-exponential model for
| (S33) |
with an exponential decay [ s and for ] and constant offset []. Around the start of the observation, this fitted amounts to more than . This causes the relation of to to be significantly non-linear, such that we can independently fit both and the model parameters. A probable candidate as the source of the long-lived ( s) contribution signal can be attributed to the sublevel. The existence of this longer lived metastable rotational level was pointed out earlier [4], predicting that it can radiatively decay only via much slower magnetic dipole transitions (mean lifetimes ).
We find a lifetime somewhat longer than the previous value [9] of s, which we explain by the extended time range of the measurement, our different cooling conditions for the rotational populations, and the modified fit model including a longlived contribution. We consider the fit results using Eq. S33 as the best estimate of the metastable population and apply it for the analysis of the DR rates in Supplement Sec. 22. Regarding possible feeding of -levels in the ground state by metastable decays, this is equivalent to the fractional metastable populations for and for as stated in the main paper. Considering faster earlier decay components in a more complex model of would imply smaller non-linear effects in the function , which after fitting the parameters would lead to even lower values for and to larger values of . As for the assumption of a constant ratio of in the observed time window, we examined the underlying mechanism that drives DR for the metastable state. For the DR from ground-state CH+, we observe a weak rotational dependence among the relevant low- levels (see Supplement Sec. 22, Table S5). Theoretically, such a weak dependence is predicted [21] for a strong neutral dissociating resonance for low-energy electronic continuum states with the CH+ core, which manifests itself in an anti-crossing pattern within the energetic structure of the Rydberg states of CH (see Fig. 1 of Ref. [22]). A similar efficient direct DR route likely also exists for the metastable state of CH+, considering the energetic structure in the Rydberg states of and symmetries of CH (see Fig. 3 of Ref. [22]). Given the non-resonant nature of such a direct DR pathway, only a weak rotational dependence for the DR rate coefficient [23] is likely expected for metastable () CH+.
23Rotational dependence of dissociative recombination
The laser probing was also combined with studies of the DR rate. Laser probing and DR measurements could in general not be performed simultaneously, as laser probing required high stored ion numbers (typically ions) to observe sufficient photodissociation signal with the pulsed laser, while the continuous count rates from DR had to be limited by lower stored ion numbers (typically ions) to avoid saturation of the detector. However, a control cycle was developed where the electron velocity was repeatedly set (in a wobbling scheme with typical dwell times of 30 ms) to values detuned from the ion beam velocity. Velocity-detuned time windows were used to measure the background in the detector count rate not induced by electron collisions (subtracted for determining the DR merged-beams rate coefficient) and for laser probing to find the time dependent relative rotational populations. This way, laser-probing and DR measurements were performed for the same control cycle such that the effect of changing, laser-probed rotational populations on the DR rate coefficient could be analyzed. To distinguish the relative populations from those discussed in the main paper (measured while only matched electron and ion beam velocities were used) they are denoted as in the following. The given DR rate coefficients always refer to those measured in the wobbling phases when the average electron and ion beam velocities were matched to each other.
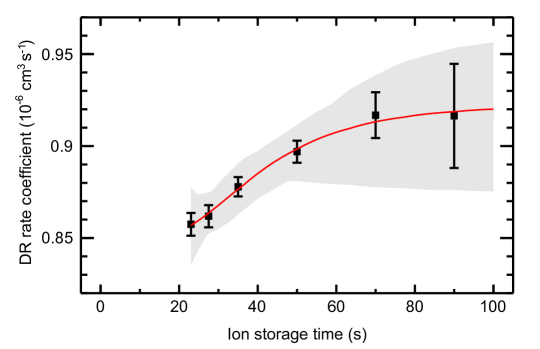
As shown in Fig. S10, the DR rate at matched average beam velocities (corresponding to the present laser probing of inelastic collisions) showed a slight time dependence that is attributed to the variation of the relative populations of the three lowest levels . We assume for these levels DR rate coefficients [corresponding to the quantities used in the main paper; ] as well as for the state (see Sec. 19 of this Supplemental Information). With this we model the total DR rate by
| (S34) |
where the populations are normalized such that their sum amounts to [see Eq. (S33)].
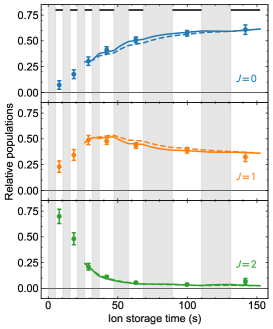
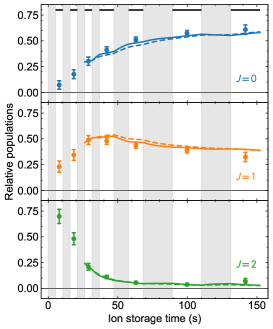
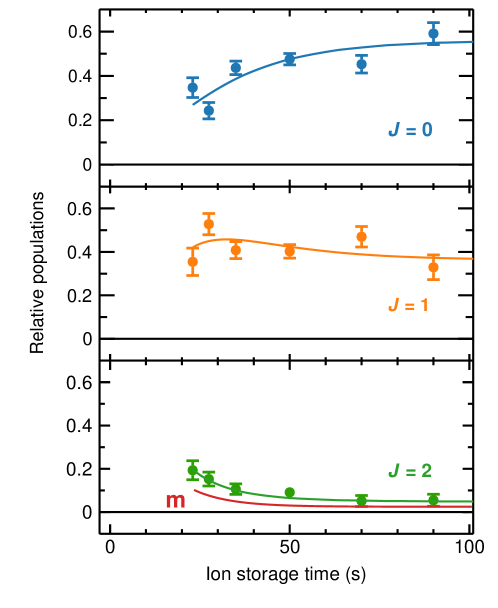
The laser-probed rotational populations are visualized in Fig. S11. Within the statistical scatter, the data for and show clear trends in that should lead to changes in depending on the -dependence of the DR rate coefficients. We represent the trends in by smooth curves with normalized relative populations, which is included in Fig. S11.
| Quantity | Value |
|---|---|
| ( cm3 s-1) | |
To estimate the parameters and in the model of Eq. (S34) we use the smoothed trends of . A linear least-squares minimization procedure cannot be applied in our case since its results violate the physical constraints and . Thus, we use the more robust Markov-chain Monte-Carlo (MCMC) analysis method [24]. The latter is based on the Bayesian inference principle and samples the marginal-likelihood function of the model over the relevant parameter space with Markov chains, i.e., in a more efficient way than sampling uniformly. As a result, the MCMC analysis provides the probability distributions for all parameters, i.e., and , and their mutual correlations.
We use the MCMC package emcee [25] and constrain the valid parameter space to positive values for all rate coefficients. As a prior we choose for all parameters a broad uniform distribution over the interval cm3 s-1. After 60 iterations the MCMC routine converges and a further iterations are used to generate the aforementioned probability distributions for the individual rate coefficients and and specific linear combinations. From those, the most probable values and the uncertainties of the parameters are derived as mean values and standard deviations of the distributions for and (with sharp uncertainties given from the extent of the distributions for and ), as summarized in Table S5. The results document that the average of the and rate coefficients is found with a smaller relative uncertainty than the difference . To calculate the effect of the -specific DR rates on the populations according to Eq. (S30), we use with the best estimator values given for in Table S5. The results of this time dependent model are shown in Fig. 3 of the main paper.
We remark that the experimental result for (Table S5), the ring-averaged electron density, and the estimate of effects caused by -specific DR at the end of Supplemental Sec. 13, Eq. (S31), lead to s-1. This estimate can be directly compared to the inelastic and radiative rates shown in Fig. S7. The effect of the -specific DR rates counteracts the increase of due to the radiative cooling. Its magnitude corresponds to only about half the cooling rate included in this figure (label ). However, the DR-induced -changing rates are about an order of magnitude lower than those caused by the inelastic collisions.
References
- Hechtfischer et al. [2002] U. Hechtfischer, C. J. Williams, M. Lange, J. Linkemann, D. Schwalm, R. Wester, A. Wolf, and D. Zajfman, Photodissociation spectroscopy of stored CH+ ions: Detection, assignment, and close-coupled modeling of near-threshold Feshbach resonances, J. Chem. Phys. 117, 8754 (2002).
- Bernath [2005] P. F. Bernath, Spectra of Atoms and Molecules, 2nd ed. (Oxford University Press, New York, 2005).
- Hakalla et al. [2006] R. Hakalla, R. Kȩpa, W. Szajna, and M. Zachwieja, New analysis of the Douglas-Herzberg system (-) in the CH+ ion radical, Eur. Phys. J. D 38, 481 (2006).
- Hechtfischer et al. [2007] U. Hechtfischer, J. Rostas, M. Lange, J. Linkemann, D. Schwalm, R. Wester, A. Wolf, and D. Zajfman, Photodissociation spectroscopy of stored CH+ and CD+ ions: Analysis of the – system, J. Chem. Phys. 127, 204304 (2007).
- Kusunoki and Ottinger [1980] I. Kusunoki and C. Ottinger, Triplet CH+(CD+) emission from chemiluminescent ion–molecule reaction C+()+ H2(D2), J. Chem. Phys. 73, 2069 (1980).
- Doménech et al. [2018] J. L. Doménech, P. Jusko, S. Schlemmer, and O. Asvany, The first laboratory detection of vibration-rotation transitions of CH and CH and improved measurement of their rotational transition frequencies, Astrophys. J. 857, 61 (2018).
- Meyer et al. [2017] C. Meyer, A. Becker, K. Blaum, C. Breitenfeldt, S. George, J. Göck, M. Grieser, F. Grussie, E. Guerin, R. von Hahn, P. Herwig, C. Krantz, H. Kreckel, J. Lion, S. Lohmann, P. Mishra, O. Novotný, A. O’Connor, R. Repnow, S. Saurabh, D. Schwalm, L. Schweikhard, K. Spruck, S. Sunil Kumar, S. Vogel, and A. Wolf, Radiative rotational lifetimes and state-resolved relative detachment cross sections from photodetachment thermometry of molecular anions in a cryogenic storage ring, Phys. Rev. Lett. 119, 023202 (2017).
- Cheng et al. [2007] M. Cheng, J. M. Brown, P. Rosmus, R. Linguerri, N. Komiha, and E. G. Myers, Dipole moments and orientation polarizabilities of diatomic molecular ions for precision atomic mass measurement, Phys. Rev. A 75, 012502 (2007).
- Amitay et al. [1996] Z. Amitay, D. Zajfman, P. Forck, U. Hechtfischer, B. Seidel, M. Grieser, D. Habs, R. Repnow, D. Schwalm, and A. Wolf, Dissociative recombination of CH+: Cross section and final states, Phys. Rev. A 54, 4032 (1996).
- O’Connor et al. [2016] A. O’Connor, A. Becker, K. Blaum, C. Breitenfeldt, S. George, J. Göck, M. Grieser, F. Grussie, E. Guerin, R. von Hahn, U. Hechtfischer, P. Herwig, J. Karthein, C. Krantz, H. Kreckel, S. Lohmann, C. Meyer, P. Mishra, O. Novotný, R. Repnow, S. Saurabh, D. Schwalm, K. Spruck, S. Sunil Kumar, S. Vogel, and A. Wolf, Photodissociation of an internally cold beam of CH+ ions in a cryogenic storage ring, Phys. Rev. Lett. 116, 113002 (2016).
- Barinovs and van Hemert [2004] Ğ. Barinovs and M. C. van Hemert, CH+ potential energy curves and photodissociation cross-section, Chem. Phys. Lett. 399, 406 (2004).
- Orlov et al. [2003] D. A. Orlov, U. Weigel, M. Hoppe, D. Schwalm, A. S. Jaroshevich, A. S. Terekhov, and A. Wolf, Cold electrons from cryogenic GaAs photocathodes: Energetic and angular distributions, Hyperfine Interact. 146/147, 215 (2003).
- Pastuszka et al. [1996] S. Pastuszka, U. Schramm, M. Grieser, C. Broude, R. Grimm, D. Habs, J. Kenntner, H.-J. Miesner, T. Schüßler, D. Schwalm, and A. Wolf, Electron cooling and recombination experiments with an adiabatically expanded electron beam, Nucl. Instrum. Methods Phys. Res. Sect. A – Accel. Spectrom. Dect. Assoc. Equip. 369, 11 (1996).
- [14] G. I. Budker and A. N. Skrinskiĭ, Electron cooling and new possibilities in elementary particle physics, Usp. Fiz. Nauk 124, 561–595 (1978) [Sov. Phys. Usp. 21, 277–296 (1986)].
- Krantz et al. [2021] C. Krantz, H. Buhr, M. Grieser, M. Lestinsky, O. Novotný, S. Novotny, D. Orlov, R. Repnow, A. Terekhov, P. Wilhelm, and A. Wolf, Transverse electron cooling of heavy molecular ions, Phys. Rev. Accel. Beams 24, 050101 (2021).
- von Hahn et al. [2016] R. von Hahn, A. Becker, F. Berg, K. Blaum, C. Breitenfeldt, H. Fadil, F. Fellenberger, M. Froese, S. George, J. Göck, M. Grieser, F. Grussie, E. A. Guerin, O. Heber, P. Herwig, J. Karthein, C. Krantz, H. Kreckel, M. Lange, F. Laux, S. Lohmann, S. Menk, C. Meyer, P. M. Mishra, O. Novotný, A. P. O’Connor, D. A. Orlov, M. L. Rappaport, R. Repnow, S. Saurabh, S. Schippers, C. D. Schröter, D. Schwalm, L. Schweikhard, T. Sieber, A. Shornikov, K. Spruck, S. Sunil Kumar, J. Ullrich, X. Urbain, S. Vogel, P. Wilhelm, A. Wolf, and D. Zajfman, The cryogenic storage ring CSR, Rev. Sci. Instrum. 87, 063115 (2016).
- [17] R. F. Boĭkova and V. D. Ob”edkov, Rotational and vibrational excitation of molecular ions by electrons, Zh. Eksp. Teor. Fiz. 54, 1439 (1968) [Sov. Phys. JETP 27, 772–774 (1968)].
- Neufeld and Dalgarno [1989] D. A. Neufeld and A. Dalgarno, Electron-impact excitation of molecular ions, Phys. Rev. A 40, 633 (1989).
- Hamilton et al. [2016] J. R. Hamilton, A. Faure, and J. Tennyson, Electron-impact excitation of diatomic hydride cations – I. HeH+, CH+, ArH+, Mon. Not. R. Astron. Soc. 455, 3281 (2016).
- van Hoof et al. [2014] P. A. M. van Hoof, R. J. R. Williams, K. Volk, M. Chatzikos, G. J. Ferland, M. Lykins, R. L. Porter, and Y. Wang, Accurate determination of the free–free Gaunt factor – I. Non-relativistic Gaunt factors, Mon. Not. R. Astron. Soc. 444, 420 (2014).
- Mezei et al. [2019] Z. J. Mezei, M. D. Epée Epée, O. Motapon, and I. F. Schneider, Dissociative recombination of CH+ molecular ion induced by very low energy electrons, Atoms 7, 82 (2019).
- Vázquez et al. [2007] G. J. Vázquez, J. M. Amero, H. P. Liebermann, R. J. Buenker, and H. Lefebvre-Brion, Insight into the Rydberg states of CH, J. Chem. Phys. 126, 164302 (2007).
- Larsson and Orel [2008] M. Larsson and A. E. Orel, Dissociative Recombination of Molecular Ions (Cambridge University Press, Cambridge, 2008).
- Hogg and Foreman-Mackey [2018] D. W. Hogg and D. Foreman-Mackey, Data analysis recipes: Using Markov Chain Monte Carlo, Astrophs. J. Suppl. Ser. 236, 11 (2018).
- Foreman-Mackey et al. [2013] D. Foreman-Mackey, D. W. Hogg, D. Lang, and J. Goodman, emcee: The MCMC hammer, Publ. Astron. Soc. Pac. 125, 306 (2013).