Doubly-Robust Estimation for Correcting Position-Bias
in Click Feedback for Unbiased Learning to Rank
Abstract.
Clicks on rankings suffer from position-bias: generally items on lower ranks are less likely to be examined – and thus clicked – by users, in spite of their actual preferences between items. The prevalent approach to unbiased click-based learning-to-rank (LTR) is based on counterfactual inverse-propensity-scoring (IPS) estimation. In contrast with general reinforcement learning, counterfactual doubly-robust (DR) estimation has not been applied to click-based LTR in previous literature.
In this paper, we introduce a novel DR estimator that is the first DR approach specifically designed for position-bias. The difficulty with position-bias is that the treatment – user examination – is not directly observable in click data. As a solution, our estimator uses the expected treatment per rank, instead of the actual treatment that existing DR estimators use. Our novel DR estimator has more robust unbiasedness conditions than the existing IPS approach, and in addition, provides enormous decreases in variance: our experimental results indicate it requires several orders of magnitude fewer datapoints to converge at optimal performance. For the unbiased LTR field, our DR estimator contributes both increases in state-of-the-art performance and the most robust theoretical guarantees of all known LTR estimators.
1. Introduction
The basis of recommender systems and search engines are ranking models that aim to provide users with rankings that meet their preferences or help in their search task (Liu, 2009). The performance of a ranking model is vitally important to the quality of the user experience with a search or recommendation system. Accordingly, the field of learning-to-rank (LTR) concerns methods that optimize ranking models (Liu, 2009); click-based LTR uses logged user interactions to supervise its optimization (Joachims, 2002). However, clicks are biased indicators of user preference (Joachims et al., 2017a; Radlinski et al., 2008) because there are many factors beside user preference that influence click behavior. Most importantly, the rank at which an item is displayed is known to have an enormous effect on whether it will be clicked or not (Craswell et al., 2008). Generally, users do not consider all the items that are presented in a ranking, and instead, are more likely to examine items at the top of the ranking. Consequently, lower-ranked items are less likely to be clicked by users, regardless of whether users actually prefer these items (Joachims et al., 2017b). Therefore, clicks can be more reflective of where an item was displayed during the gathering of data than whether users prefer it. This form of bias is referred to as position-bias (Wang et al., 2018a; Craswell et al., 2008; Agarwal et al., 2019c); it is extremely prevalent in user clicks on rankings. Correspondingly, this has lead to the introduction of unbiased LTR: methods for click-based optimization that mitigate the effects of position-bias. Wang et al. (2016) and Joachims et al. (2017b) proposed using IPS estimators (Horvitz and Thompson, 1952) to correct for position-bias. By treating the examination probabilities as propensities, IPS can estimate ranking metrics unbiasedly w.r.t. position-bias. This has lead to the inception of the unbiased LTR field, in which IPS estimation has remained the basis for most state-of-the-art methods (Oosterhuis and de Rijke, 2020, 2021a; Agarwal et al., 2019a, b; Vardasbi et al., 2020b). However, variance is a large issue with IPS-based LTR and remains an obstacle for its adoption in real-world applications (Oosterhuis and de Rijke, 2021a).
Outside of LTR, DR estimators are a widely used alternative for IPS estimation (Kang et al., 2007; Robins et al., 1994), for instance, for optimization in contextual bandit problems (Dudík et al., 2014). The DR estimator combines an IPS estimate with the predictions of a regression model, such that it is unbiased when per treatment either: the estimated propensity or the regression model is accurate (Kang et al., 2007). Additionally, the DR estimator can also bring large decreases in variance if the regression model is adequately accurate (Dudík et al., 2014). Unfortunately, existing DR estimators are not directly applicable to the unbiased LTR problem, since the treatment variable – that indicates whether an item was examined or not – cannot be observed in the data. This is the characteristic problem of position-biased clicks: when an item is not clicked, we cannot determine whether the user chose not to interact or the user did not examine it in the first place. Consequently, the unbiased LTR field has not progressed beyond the usage of IPS estimation.
Our main contribution is the first DR estimator that is specifically designed to perform unbiased LTR from position-biased click data. Instead of using the actual treatment: user examination, which is unobservable in click data, our novel estimator uses the expectation of treatment per rank to construct a covariate instead. Similar to DR estimators for other tasks, it combines the preference predictions of a regression model with IPS estimation. Unlike IPS estimators which are only unbiased with accurate knowledge of the logging policy, our DR estimator requires either the correct logging policy propensity or an accurate regression estimate per item. As a result, our DR estimator has less strict requirements for unbiasedness than IPS estimation. Moreover, it can also provide enormous decreases in variance compared to IPS: our experimental results indicate that the DR estimator requires several orders of magnitude fewer datapoints to converge at optimal performance. In all tested top-5 ranking scenarios, it needs less than logged interactions to reach the performance that IPS reaches at logged interactions. Additionally, when compared to other state-of-the-art methods DR also provides better performance across all tested scenarios. Therefore, the introduction of DR estimation for unbiased LTR contributes the first unbiased LTR estimator that is provenly more robust than IPS, while also improving state-of-the-art performance on benchmark unbiased LTR datasets.
1.1. Structure of the Paper
The remained of this work is structured as follows:
Section 2 discusses relevant existing work on click-based and unbiased LTR and earlier methods that have applied DR estimation to clicks. Then Section 3 explains our LTR problem setting by describing our assumptions about user behavior, how click data is logged and our LTR goal. Our background section is divided in two parts: Section 4 provides background on counterfactual estimation methods in general, not specific to LTR. These generic methods are introduced so that we can later contrast them with LTR specific methods and illustrate the adaptations that are required to deal with position-bias specifically. Subsequently, Section 5 describes the existing IPS method that is specifically designed for LTR and position-bias. Furthermore, it discusses existing regression loss estimation and earlier DR estimation methods that have been applied to clicks.
Our novel methods, the novel DR estimator designed to correct position-bias and a novel cross-entropy loss estimator, are introduced in Section 6. Then Section 7 details the experiments that were performed to evaluate our novel method, the results of these experiments are presented and discussed in Section 8. Finally, Section 9 provides a conclusion of this work, followed by the appendices that provide extended proofs for the theoretical claims of the work.
2. Related Work
This section provides a brief overview of the existing literature in the unbiased LTR field, in addition, relevant work on dealing with position-biased clicks and existing methods that apply DR estimation to click data outside of the LTR field are also discussed.
Optimizing ranking models based on click-data is a well-established concept (Joachims, 2002). Early methods took an online dueling-bandit approach (Yue and Joachims, 2009; Schuth et al., 2016) and later an online pairwise approach (Oosterhuis and de Rijke, 2018). The first LTR method with theoretical guarantees of unbiasedness was introduced by Wang et al. (2016) and then generalized by Joachims et al. (2017b). They assume the probability that a user examines an item only depends on the rank at which it is displayed and that clicks only occur on examined items (Wang et al., 2018a; Craswell et al., 2008). Then using counterfactual IPS estimation they correct for the selection bias imposed by the examination probabilities. The introduction of this approach launched the unbiased LTR field: Agarwal et al. (2019a) expanded the approach for optimizing neural networks. Oosterhuis and de Rijke (2020) generalized the approach to also correct for the item-selection-bias in top- ranking settings by basing the propensities on a stochastic logging policy. Agarwal et al. (2019b) showed that user behavior shows an additional trust-bias: increased incorrect clicks at higher ranks (Joachims et al., 2017a), Vardasbi et al. (2020b) extended the IPS estimator with affine corrections to correct for this trust-bias. Singh and Joachims (2019) use IPS to optimize for a fair distribution of exposure over items. Jagerman et al. (2020) consider safe model deployments by bounding model performance. Oosterhuis and de Rijke (2021a) introduced a generalization of the top- and affine estimators that considers the possibility that the logging policy is updated during the gathering of data. Wang et al. (2021) proposed a ratio-propensity-scoring (RPS) estimator that weights pairs of clicked and non-clicked items by their ratio between the propensities. RPS is an extension of IPS that introduces bias but also reduces variance.
In contrast with the rest of the field, recent work has proposed some methods that do not rely on IPS to the field. Zhuang et al. (2021) and Yan et al. (2022) fit predictive models to observed click data that explicitly factorizes relevance and bias factors, while they report promising real-world results, their methods do not provide strong theoretical guarantees w.r.t. unbiasedness. Ovaisi et al. (2020) propose an adaptation of Heckman’s two-stage method. Besides these exceptions and to the best of our knowledge, all methods in the unbiased LTR field are based on IPS.
Interestingly, methods for dealing with position-biased clicks have also been developed outside of the unbiased LTR field. Komiyama et al. (2015) and Lagrée et al. (2016) propose bandit algorithms that use similar IPS estimators for serving ads in multiple on-screen positions at once. Furthermore, Li et al. (2018) also propose IPS estimators for the unbiased click-based evaluation of ranking models. This further evidences the widespread usage of IPS estimation for correcting position-biased clicks.
Nevertheless, there is previous work that has applied DR estimators to position-biased clicks: Saito (2020) proposed a DR estimator for post-click conversions that estimates how users treat an item after clicking it. Kiyohara et al. (2022) designed a DR estimator for policy-evaluation under cascading click behavior (Vardasbi et al., 2020a). Lastly, Yuan et al. (2020) introduced a DR estimator for click-through-rate (CTR) prediction on advertisements placements. Section 5.3 will discuss these methods in a bit more depth, and how they differ from the prevalent IPS approach to unbiased LTR and our proposed DR estimator. Important for our current discussion is that each of these methods tackles a different problem setting than the LTR problem setting in this work. Moreover, the latter two DR estimators use corrections based on action propensities, similar to generic counterfactual estimation, and in stark contrast with the examination propensities of unbiased LTR. Finally, these works focus on policy evaluation instead of LTR, thus it appears that the effectiveness of DR for ranking model optimization is currently still unknown to the field.
3. Problem Definition
This section describes the assumptions underlying the theory of this paper and details our exact problem setting. Specifically, it introduces the assumed mathematical model by which clicks are generated, the metric we aim to optimize, and notation to describe logged data.
3.1. User Behavior Assumptions
This paper assumes that the probability of a click depends on the user preference w.r.t. item and the position (also called rank) at which is displayed. Let be the probability that a user prefers item and for each let and such that , the probability of receiving a click when displayed at position is:
| (1) |
This assumption has been derived (Vardasbi et al., 2020b) from a more interpretable user-model proposed by Agarwal et al. (2019b). Their model is based on the examination assumption (Richardson et al., 2007): users first examine an item before they interact with it, i.e. let indicate examination then . Additionally, they also incorporate the concept of trust-bias: users are more likely to click against their preferences on higher ranks because of their trust in the ranking model. This can be modelled by having the probability of a click conditioned on examination vary over :
| (2) |
The proposed user model results in the following click probability:
| (3) |
by comparing Eq. 1 and 3 we see that:
| (4) |
Agarwal et al. (2019b) provide empirical results that suggest this user-model is more accurate than the previous model that ignores the trust-bias effect: (Wang et al., 2016; Joachims et al., 2017b; Wang et al., 2018a). Since the assumption in Eq. 1 is true in both models, our work is applicable to most settings in earlier unbiased LTR work (Wang et al., 2016; Joachims et al., 2017b; Agarwal et al., 2019b; Vardasbi et al., 2020b; Oosterhuis and de Rijke, 2020; Singh and Joachims, 2019; Jagerman et al., 2020; Oosterhuis and de Rijke, 2021a; Ovaisi et al., 2020; Wang et al., 2021).
3.2. Definition of the LTR Goal
The goal of our ranking task is to maximize the probability that a user will click on something they prefer. Let be the ranking policy to optimize, with indicating the probability that places at position and let indicate a ranking of size : , lastly, let be the collection of items to be ranked. Most ranking metrics are a weighted sum of item relevances, where the weights depend on the item positions:
| (5) |
DCG (Järvelin and Kekäläinen, 2002) is a very traditional ranking metric: , however, discounted cumulative gain (DCG) has no clear interpretation in our assumed user model. In contrast, we argue that our metric should actually be motivated by our user behavior assumptions, accordingly, this work will use the weights: . This choice results in an easily interpreted metric; for brevity of notation, we first introduce the expected position weight per item:
| (6) |
using Eq. 1, our ranking metric can then be formulated as:
| (7) |
This formulation clearly reveals that our chosen metric directly corresponds to the expected number of items that are both clicked and preferred in our assumed user behavior model. Hence, we will call this metric: the number of expected clicks on preferred items, abbreviated to ECP.
Given a ranking metric, the LTR field provides several optimization methods to train ranking models. A popular approach for deterministic ranking models is to optimize a differentiable lower bound on the ranking metric (Wang et al., 2018b; Burges, 2010). For probabilistic ranking models, a simple sampled-approximation of the policy-gradient can be applied (Williams, 1992). Alternatively, recent methods provide more efficient approximation methods specifically designed for the LTR problem (Oosterhuis, 2021; Ustimenko and Prokhorenkova, 2020).
Finally, we note that our main contributions work with any choice of weights and are therefore equally applicable to most traditional LTR metrics. Furthermore, for the sake of simplicity and brevity and without loss of generalization, our notation and our defined goal are limited to a single query or ranking context. We refer to previous work by Joachims et al. (2017b) and Oosterhuis and de Rijke (2021a) as examples of how straightforward it is to expand these to expectations over multiple queries or contexts.
3.3. Historically Logged Click Data
Lastly, in the unbiased LTR setting, optimization is performed on historically logged click data. This means a logging policy was used to show rankings to users in order to collect the resulting clicks. We will assume the data contains rankings that were sampled from and displayed to users, where is the th ranking and indicates whether was clicked when was displayed. The bias parameters and have to be estimated from user behavior, we will use and to denote the estimated values. To keep our notation brief, we will use the following to denote that all the estimated bias parameters are accurate:
| (8) |
We will investigate both the scenarios where the and bias parameters are known from previous experiments (Agarwal et al., 2019b; Fang et al., 2019; Wang et al., 2018a) and where they still have to be estimated. Similarly, the exact distribution of the logging policy may also have to be estimated, the following denotes that the estimated distribution for item is accurate:
| (9) |
To summarize, our goal is to maximize based on click data gathered using from the position-biased click model in Eq. 1.
4. Background: Applying Generic Counterfactual Estimation to Click-Through-Rates
This section will give an overview of counterfactual estimation for generic reinforcement learning (Dudík et al., 2014; Kang et al., 2007; Sutton et al., 1998), its purpose is two-fold: (i) to illustrate why it is not effective for the LTR problem; and (ii) to contrast the generic estimators with the existing estimators for LTR and our novel estimators. While it appears that the field is aware that generic counterfactual estimation is not a practical solution to LTR (Saito and Joachims, 2021; Kiyohara et al., 2022; Joachims et al., 2017b), to the best of our knowledge, previous published research has not gone in depth on the reasons for this ineffectiveness.
4.1. The Generic Estimation Goal
The first issue between the LTR problem and generic counterfactual estimation is that the latter assumes that the rewards for the actions performed by the logging policy are directly observed, as is the case for standard reinforcement learning tasks (Dudík et al., 2014; Sutton et al., 1998). However, in the LTR problem, clicks are observed instead of the relevances on which metrics are based. Consequently, for this section, we will restrict ourselves to estimating CTR instead, luckily this task is similar enough to the LTR problem for our discussion. Let indicate the th item in ranking , under our assumed click model, the CTR of a policy is:
| (10) |
The goal in this section is thus to estimate for any given policy using data collected by a logging policy . Importantly, to be effective at optimization, the estimation process should work for any possible in the model space.
4.2. Generic Inverse-Propensity-Scoring Estimation
Standard inverse-propensity-scoring (IPS) estimation corrects for the mismatch between and by reweighting the observed action inversely w.r.t. their estimated propensity: the probability that takes this observation (Dudík et al., 2014). In our case, an action is a ranking and its estimated propensity is . Applying standard IPS estimation to the LTR task results in the following generic IPS estimator:
| (11) |
The IPS weight aims to correct for the difference in action probability between and , e.g. if an action is underrepresented in the data because then IPS will compensate by giving more weight to this action as: . To understand when this approach can provide unbiased estimation, we first look at its expected value:
| (12) |
The result is very similar to the formula for CTR (Eq. 11) except for the ratio between the estimated and real propensity. Clearly, for unbiasedness this ratio must be equal to one, i.e. the estimated propensity needs to be correct, additionally, each action that may take must have a positive propensity from :
| (13) |
Thus unbiased estimation via generic IPS is possible, however, the requirements are practically infeasible for any large ranking problem due to its enormous action space. Importantly, for unbiasedness, has to give a non-zero probability to each action may take, but data is often collected without knowledge of what will be evaluated (or reused for many different policies). Moreover, when using IPS for unbiased optimization it should be unbiased for any possible in the policy space that optimization is performed over. In practice, this means that the number of possible rankings is enormous and each should get a non-zero probability by , which translates to giving a positive probability to rankings. This is quite undesirable since the user experience is likely to suffer under such a random policy, but moreover, it also brings serious variance problems. In particular, when we consider the variance of the generic IPS estimator, we see that small propensities increase variance by a massive degree:
| (14) |
Thus, to summarize, to apply generic IPS to LTR unbiasedly, all rankings require a positive propensity, but due to the enormously large number of rankings this leads to extremely small propensity values which lead to enormous variance. As a result, generic IPS is not a practical solution for unbiased low-variance LTR and has been widely avoided in practice (Kiyohara et al., 2022). Section 5.1 will describe the IPS approach specifically designed for LTR that has much more feasible unbiasedness requirements.
4.3. The Generic Direct Method
Before we continue to LTR specific methods, we will describe the direct-method (DM) and generic doubly-robust (DR) estimation, in order to compare them with our novel estimator later. First, the direct method uses regression estimates from a regression model to estimate policy performance (Dudík et al., 2014). Let indicate a regression estimate of , the generic DM estimator is then:
| (15) |
Clearly, DM is unbiased when the regression estimates are correct for all rankings that may show:
| (16) |
However, this is not a very useful requirement in practice, since solving the regression problem is arguably just as difficult as the subsequent LTR problem. Nonetheless, its unbiasedness requirements are very different than those for IPS, a benefit of DR is that it combines both requirements advantageously.
4.4. Generic Doubly Robust Estimation
Besides DM and IPS, DR estimation makes use of a covariate (CV), that aims to have a large covariance with IPS estimation but the same expected value as DM. We will call this the generic CV:
| (17) |
CV makes use of the actions sampled by , allowing it to have a high covariance with IPS, but uses predicted click probabilities instead of using the actual clicks, enabling it to have the same expected value as DM. Importantly, when IPS is unbiased, i.e. when the estimated propensities are correct, CV is also an unbiased estimate of DM:
| (18) |
The DR estimator is a combination of the above three estimators (Dudík et al., 2014; Kang et al., 2007; Robins et al., 1994):
| (19) |
The DR starts with regression-based estimate of DM then for each logged ranking it adds the difference between the observed clicks and the predicted clicks. In other words, DR uses DM as a baseline and adds an IPS estimate of the difference between the regression model and the actual clicks.
The first advantage of DR estimation are its unbiasedness requirements. It has the following bias w.r.t. CTR:
| (20) |
As we can see the bias of DR is a summation over rankings, where per ranking the error in propensity is multiplied with the error in predicted click probability. Due to this product, only one of the two errors has to be zero per ranking for the total bias to be zero. In other words, DR is unbiased when for each ranking either the propensity or the predicted click probabilities are correct:
| (21) |
As a result, if either DM or IPS is unbiased then DR is unbiased, furthermore, it can potentially be unbiased when neither DM or IPS are. In addition, to the beneficial unbiasedness requirements, DR can also allow for reduced variance if there is a positive covariance between IPS and CV:
| (22) |
In practice, this means that somewhat accurate regression estimates can provide a decrease in variance over IPS. Nevertheless, this decrease is not enough to overcome the variance problems that stem from the small propensities that are involved in LTR. Consequently, state-of-the-art unbiased LTR does not apply standard IPS and DR (Oosterhuis and de Rijke, 2021a; Ai et al., 2021).
5. Background: Counterfactual Estimation for Unbiased Learning-to-Rank
While Section 4 covers the standard counterfactual estimation techniques and why they are ineffective for the LTR problem, this section describes the existing IPS estimator that is specifically designed for LTR and discuss previous work that has applied DR estimation to click data.
5.1. Inverse-Propensity-Scoring in Unbiased LTR
As discussed in Section 2, the main approach in state-of-the-art unbiased LTR work is based on inverse-propensity-scoring (IPS) estimation (Horvitz and Thompson, 1952). Under the affine click model in Eq. 1, the propensities are not the probability of observation, as in the earliest unbiased LTR work (Wang et al., 2016; Joachims et al., 2017b), but the expected correlation between the click probability and the user preference for an item under (Vardasbi et al., 2020b; Oosterhuis and de Rijke, 2021a):
| (23) |
where indicates the probability that places at position . Because are may be unknown, we use the following estimated values:
| (24) |
where the clipping parameter prevents small values and is applied for variance reduction (Joachims et al., 2017b; Strehl et al., 2010). The state-of-the-art IPS estimator introduced by Oosterhuis and de Rijke (2021a) first corrects each (non-)click with – the value for the position where the click took place – to correct for clicks in spite of preference (trust-bias), and then inversely weights the result by to correct for the correlation between the user preference and the click probability (position-bias and item-selection-bias (Oosterhuis and de Rijke, 2020)):
| (25) |
where indicates the position of in the th ranking.
The main difference between the generic IPS estimation (Eq. 11) and the LTR IPS estimator (Eq. 25) is that the former bases its corrections on the differences between the action probabilities of and , while the latter uses the correlation between clicks and relevance under . Thus while both use the behavior of the logging policy , the LTR IPS estimator uses the assumed click model of Eq. 1 as well. While the reliance on the click model makes the estimator more effective, it also makes the estimator specifically designed for this click behavior. The remainder of this section discusses that, due to this specific design, the theoretical properties of the LTR IPS estimator are clearly preferable over those of generic IPS estimation applied to the LTR problem.
To start, the IPS estimator has the following bias:
| (26) |
Appendix A provides a derivation of its bias, it also proves that the IPS estimator is unbiased when both the bias parameters and the logging policy distribution are correctly estimated and clipping has no effect (Joachims et al., 2017b; Vardasbi et al., 2020b):
| (27) |
Conversely, IPS is biased when clipping does have an effect, even if the bias parameters and logging policy distribution are correctly estimated.
Importantly, these unbiasedness requirements are much more feasible than those for the generic IPS estimator (Eq. 21); where the generic IPS estimator requires each ranking to have a positive probability () of being displayed during logging, the LTR IPS estimator requires each item to have a propensity greater than (). In other words, the correlation between clicks and relevances should be greater than , this is even feasible under a deterministic logging policy that always displays the same single ranking if all items are displayed at once (Joachims et al., 2017b; Oosterhuis and de Rijke, 2020). However, the IPS estimator does need accurate estimate of the bias parameters and in addition to an accurate estimate of the logging policy , but previous work indicates that this is actually doable in practice (Joachims et al., 2017b; Wang et al., 2016, 2018a; Agarwal et al., 2019c). In summary, compared to generic IPS estimation, the IPS estimator for LTR has replaced infeasible requirements on the logging policy with attainable requirements on bias estimation.
The variance of the IPS estimator can be decomposed in the following parts:
| (28) |
We see how clipping prevents extremely large values for the variance multiplier from the IPS weight by preventing small values and can thereby greatly reduce variance (Joachims et al., 2017b; Strehl et al., 2010). Importantly, the reduction in variance is often much greater than the increase in bias, making this an attractive trade-off that has been widely adopted by the unbiased LTR field (Agarwal et al., 2019a; Oosterhuis and de Rijke, 2020). There is currently no known method for variance reduction in IPS-based position-bias correction that does not introduce bias, and thus, in practice unbiased LTR methods are actually often applied in a biased manner111Oosterhuis and de Rijke (2021a) apply unbiased LTR in an online fashion to reduce variance, but this solution does not apply to our problem setting..
5.2. Existing Cross-Entropy Loss Estimation
As discussed, DM requires an accurate regression model to be unbiased or effective. In the ideal situation, one may optimize a regression model for estimating relevance using the cross-entropy loss:
| (29) |
However, this loss cannot be computed from the click-data since cannot be observed. Luckily, Bekker et al. (2019) have introduced an estimator that can be applied to position-biased clicks:
| (30) |
Saito et al. (2020) showed that this estimator is effective for recommendation tasks on position-biased click data. is unbiased (Bekker et al., 2019; Saito et al., 2020) when there is no trust-bias, propensities are accurate and clipping has no effect:
| (31) |
In Section 6.5, we propose a novel variation on this estimator that can also correct for trust-bias and that treats non-displayed items in a more intuitive way.
5.3. Existing Doubly-Robust Estimation for Logged Click Data
Our discussion of generic counterfactual estimation in Section 4 concluded with DR estimation and the advantageous properties it can have over IPS and DM (Kang et al., 2007; Robins et al., 1994). Given that the current state-of-the-art in LTR is based on IPS, it seems very promising to apply DR to unbiased LTR. Unfortunately, at first glance it seems DR is inapplicable to the LTR problem, since treatment is the examination of the user and we cannot directly observe whether a user has examined a non-clicked item or not. Because DR estimation balances IPS and regression estimates unbiasedly using the knowledge of treatment in the data, e.g. which actions where taken (Dudík et al., 2014) (cf. Eq. 19), it appears this characteristic problem of position-biased clicks makes existing DR estimation inapplicable.
However, as discussed in Section 4, this is not a problem for generic counterfactual estimators for CTR estimation from logged click data. Accordingly, previous work that has applied DR estimation to clicks has taken the generic approach with corrections based on purely based on action propensities. For instance, Yuan et al. (2020) use IPS and DR estimators for CTR prediction on advertisements that are presented in different display positions. Their IPS weights are based on the difference in action probabilities between the logging policy and the evaluated policy (cf. Eq. 11 & 19). In a similar vain, Kiyohara et al. (2022) propose a DR estimator for predicting a CTR-based slate-metric under cascading user behavior, they also use IPS weights based solely on action probabilities. These method are very different from the IPS approach for unbiased LTR (Section 5.1) because their corrections are not based on the mismatch between clicks and relevance, but on the mismatch between action probabilities between policies. As a result, they cannot handle situations where is deterministic and position-bias occurs, in contrast with the LTR IPS estimator. We thus argue that the approaches of Yuan et al. (2020) and Kiyohara et al. (2022) are better understood as methods for correcting policy differences, instead of methods designed for correcting position-bias in clicks directly.
Another DR estimator applied to click data was proposed by Saito (2020), who realized that when estimating post-click conversions, the click signal can be seen as the treatment variable. This avoids the unobservable examination problem as clicks are always directly observable in the data. The propensities of Saito are thus based on click probabilities, instead of action or examination probabilities. While being very useful for post-click conversions, their method cannot be applied to predicting click probabilities or our LTR problem setting.
In summary, existing DR estimation does not seem directly applicable to position-bias since the treatment variable, item examination, is unobservable in click logs. To the best of our knowledge, DR estimators that have been applied to clicks correct for the mismatch between logging policy and the evaluated policy. Currently, there does not appear to be a DR estimator that uses the correlations between clicks and relevances as state-of-the-art IPS estimation for LTR.
6. Method: The Direct Method and Doubly Robust Estimation for Learning to Rank
In Section 4 the generic IPS, DM and DR estimators were introduced, subsequently, Section 5 showed how IPS has been successfully adapted for the LTR problem specifically. This naturally raises the question whether adaptations of DM and DR estimation for LTR could bring additional success to the field. To answer this question, this section introduces novel DM and DR estimators for LTR and also a novel estimator for the cross-entropy loss.
6.1. The Direct Method for Learning to Rank
As discussed in Section 4, the direct-method (DM) solely relies on regression to estimate performance, in contrast with IPS which uses click frequencies and propensities (Dudík et al., 2014). The generic DM estimator in Eq. 15 estimates CTR with the estimated bias parameters and and the relevance estimates . However, to estimate (Eq. 7), we only require the weight estimate and per item . The DM estimate of then is:
| (32) |
While to the best of our knowledge it is novel, our DM estimator is extremely straightforward: for each item we multiply its estimated expected position weight with its relevance estimate: . The biggest difference with the generic DM is that instead of using the policy probabilities or and directly, it uses which is based on their values (Eq. 24).
By considering Eq. 7, 24 and 32, we can clearly see has the following condition for unbiasedness:
| (33) |
In other words, both the bias parameters and the regression model have to be accurate for to be unbiased. The first part of the condition is required because accurate and are needed for an accurate estimate of the weights. The second part of the condition: that all regression estimates need to be correct, show that it is practically infeasible for DM to be unbiased since finding an accurate values appears to be as difficult as the ranking task itself. This reasoning could explain why – to the best of our knowledge – no existing work has applied DM to unbiased LTR. However, the experimental findings in this paper cast doubt on this reasoning, since they show that DM can be more effective than IPS, especially when the number of displayed rankings is not very large.
An advantage of DM over IPS is how non-clicked items are treated: The IPS estimator (Eq. 25) treats items that are not clicked in the logged data as completely irrelevant items that should be placed at the bottom of a ranking. As pointed out in previous work (Wang et al., 2021), this seems very unfair to items that were never displayed during logging, and this winner-takes-all behavior could potentially explain the high variance of IPS. In contrast, because DM relies on regression estimates it can provide non-zero values to all items, even those never displayed. Additionally, DM does not require any estimate of the logging policy whereas IPS heavily relies on . But DM does not utilize any of the click-data, and thus, DM cannot correct for inaccuracies in the regression estimates. Furthermore, the unbiasedness criteria for DM are much less feasible than those of IPS. Ideally, the advantageous properties of both IPS and DM should be combined in a single estimator, while avoiding the downsides of each approach. The following subsection considers whether DR estimation could result in such a combination.
6.2. A Novel Doubly-Robust Estimator for Relevance Estimation under Position-Bias
Now that we have IPS and DM estimators for LTR, we only require a covariate (CV) to construct a doubly-robust (DR) estimator (Dudík et al., 2014). As discussed in Section 4, CV should have the same expected value as DM when IPS is unbiased, while simultaneously having a high covariance with IPS. With these requirements in mind, we propose the following CV:
| (34) |
Interestingly, CV does not use the observed clicks but utilizes at what ranks an item was displayed in the logged data. The last part of the estimator represents the increase in click probability an item receives by being displayed at a position, the hope is that this correlates with the actual observed clicks. Importantly, CV has the same expected value as DM when is correct and clipping has no effect (see Theorem B.2 for proof):
| (35) |
If we compare the above condition with the unbiasedness condition of IPS in Eq. 27, we see that the latter encapsulates the former. In other words, CV is an unbiased estimate of DM when IPS is an unbiased estimate of .
Since our CV has the required properties, we can straightforwardly propose our novel DR estimator (cf. Eq. 19):
| (36) |
We see that our DR estimator follows a similar structure as generic DR estimation (Section 4): it starts with DM as a baseline then adds an IPS estimate of the difference between DM and the true reward . Concretely, the difference between each observed click signal and the predicted click probability is taken and reweighted with an IPS estimate. Effectively, the observed clicks are thus used to estimate and correct the error of DM.
An intuitive advantage of DR is that for items that were never displayed during logging (i.e. ), DR relies solely on regression to estimate their relevance, similar to DM. Yet for items that have been displayed many times, DR will estimate relevance more similar to IPS for those items, thereby it is able to correct for regression mistakes with clicks. The combination of these properties, means that DR can avoid the winner-takes-all behavior of IPS where all non-displayed or non-clicked items are seen as completely non-relevant and pushed to the bottom of the ranking. We expect this to mean that DR does not have the same variance problems as IPS. At the same time, DR still relies on clicks and thus does not require perfectly accurate regression estimates. Our theoretical analysis shows that this enables DR to have more reasonable unbiasedness requirements than DM.
The main difference with standard DR estimation for contextual bandits, i.e. as described by Dudík et al. (2014), and our DR estimator is that our CV uses a soft expected-treatment variable . This difference is necessary because relevances cannot be observed directly and have to be inferred from click signals . Thus, while standard CV would use the observed reward signal, our CV infers the relevance from the observed click. We call a soft expected-treatment variable because it can be seen as the expected effect that relevance had on the click probability. To the best of our knowledge, our DR estimator is the first to use such a soft-treatment variable.
Moreover, in contrast with the existing methods described in Section 4 and 5.3 that use propensities based on the mismatch between and (Yuan et al., 2020; Kiyohara et al., 2022; Saito, 2020). Our DR estimator uses the correlation between clicks and relevance to correct for position-bias, it is thus also applicable when the logging policy is deterministic and inherents the advantages that the LTR IPS estimator has over generic IPS estimation. We thus argue that our DR estimator is the first that is designed to directly correct for position-bias, and therefore provides a very significant contribution to the unbiased LTR field.
6.3. Theoretical Properties of the Novel Doubly-Robust Estimator
Sections 7 and 8 experimentally investigate the performance improvements our contribution brings, whereas Appendix C proves several theoretical advantages DR has over both IPS and DM in terms of bias and variance. We summarize our main theoretical findings in the remainder of this section.
Theorem C.1 shows that our DR has the following bias:
| (37) |
Furthermore, Corollary C.3 shows that if the bias parameters are correctly estimated, this can be simplified to:
| (38) |
The multiplication of errors in the bias can be beneficial for more robustness (cf. Eq. 20), however, it only occurs when the bias parameters are correct. From the simplified bias, Theorem C.4 derives the following unbiasedness conditions:
| (39) |
In other words, DR is unbiased when the bias parameters are correctly estimated and per item either the logging policy distribution is correctly estimated and clipping has no effect or the regression estimate is correct. In contrast, remember that IPS needs an accurate and clipping to have no effects for all items, and DM needs accurate regression estimates for all items. Therefore, DR is unbiased when either IPS or DM is but can also be unbiased in situations where neither is. Clearly, our DR is more robust than IPS and DM, yet all of the LTR estimators still require accurate bias parameters. This seems inescapable since our reward is also based on user behavior, i.e. due to its weights accurate and estimates are needed.
In addition to the better unbiasedness conditions, Theorem C.5 proves our DR estimator has less or equal bias than IPS when and are accurate and each estimate is less than twice the true value:
| (40) |
We see that our DR estimator is able to reduce bias with somewhat accurate regression estimates. In particular, it appears that it mitigates some of the bias introduced to IPS by clipping. Overall, it appears that our DR estimator has better unbiasedness criteria than IPS or DM and has lower bias than IPS given adequate regression estimates.
Besides bias, we should also consider the variance of our DR estimator, from Eq. 36 it follows that (cf. Eq. 22):
| (41) |
Thus, a large covariance between IPS and CV allows for a reduction in the variance of our DR estimator. To better understand when this may be the case, Theorem C.6 proves the following condition for improved variance over IPS:
| (42) |
We note that this is the same condition as in Eq. 40: correct and estimates and regression estimates that are somewhat correct. Interestingly, this shows that under this condition DR can improve over IPS both in terms of bias and variance. In contrast, while the practice of clipping reduces variance but introduces bias (Joachims et al., 2017b; Strehl et al., 2010), it appears that under certain conditions DR can avoid this tradeoff altogether.
Finally, we note that there is also an important exception; our DR estimator is equivalent to IPS when all are equal to their corresponding :
| (43) |
There are only two non-trivial situations where this can occur: (i) when the logging policy is deterministic and clipping has no effect: ; and (ii) when all regression estimates are zero: . In all other scenarios, our DR estimator does not reduce to IPS estimation. This means that even when is deterministic, DR can have benefits over IPS when clipping is applied.
To summarize, we have introduced a novel DR estimator that is specifically designed for the LTR problem. In terms of bias and variance, our DR estimator is more robust than both the IPS and the DM estimators: when either of IPS or DM is unbiased the DR estimator is also unbiased, and in addition, there exist cases where DR is unbiased and neither IPS nor DM are. Moreover, when the bias parameters are accurate and all regression estimates are between zero and twice the true preferences, we can prove that both the bias and variance of DR are less or equal to those of IPS.
In terms of theory, our novel DR estimator is a breakthrough for the unbiased LTR field: it is the first unbiased LTR method that uses DR estimation to directly correct for position-bias, importantly, this makes it provenly more robust than IPS estimation in terms of both bias and variance. Our DR estimator is applicable in any unbiased LTR setting where IPS can be applied and with any regression estimates, allowing for widespread adoption across the entire field.
6.4. Applying LTR to Doubly-Robust Ranking Metric Estimates
It might not be directly obvious how LTR can be performed with the DR estimator, while it is actually very straightforward. To begin, we consider the common approaches for LTR when relevances are known: bounding (Wang et al., 2018b; Burges, 2010) and sample-based approximation (Williams, 1992; Oosterhuis, 2021; Ustimenko and Prokhorenkova, 2020). Bounding has a long tradition in LTR for optimizing deterministic models (Burges, 2010); Wang et al. (2018b) introduced the LambdaLoss method and proved that it can bound ranking metrics, let be a vector of all true item relevances then: . For probabilistic policies, the policy gradient can be approximated based on sampled rankings (Williams, 1992), recently Oosterhuis (2021) proposed the PL-Rank method: .
To apply LTR methods like these to estimated metrics, we follow Oosterhuis and de Rijke (2020) and reformulate the to a sum over items that with expected-rank weights and relevance estimates :
| (44) |
Let indicate a vector of all relevance estimates, Oosterhuis and de Rijke (2020) prove that LambaLoss can be used as a bound on the estimated metric: . Similarly, the derivation of Oosterhuis (2021) is equally applicable to and can thus approximate the policy gradient: . As such, existing LTR methods are straightforwardly applied to our DR estimator in order to optimize ranking models w.r.t. unbiased click-based estimates of performance.
6.5. Novel Cross-Entropy Loss Estimation
While our DR estimator can be applied with any regression model, we will propose a novel estimator for the cross-entropy loss to optimize an accurate regression model. There are two issues with the existing estimator (Eq. 30) we wish to avoid: (i) does not correct for trust-bias, and (ii) for any never-displayed item the estimate contains the loss that pushes towards zero. In other words, penalizes positive values for items that were never displayed during logging, while it seems more intuitive that a loss estimate should be indifferent to the values of never-displayed items. We propose the following estimator:
| (45) |
Our novel estimator has corrections to deal with trust-bias and utilizes the to weight the negative part of the loss: . One possible interpretation is that replaces the in Eq. 30 using the fact that . Another interpretation is that the second weight looks at the difference between the expected click probability if the item was maximally relevant () and the observed click frequency, the expected difference reveals how much relevance the item lacks. Regardless of interpretation, the important property is that . Furthermore, when an item is never displayed, the corresponding does not affect the estimate since in that case: . Appendix D proves is unbiased in the following circumstances:
| (46) |
These are the same conditions as those we proved for the IPS estimator (Eq. 27): the bias parameters and the logging policy need to be accurately estimated and clipping should have no effect. Thus our novel cross-entropy loss estimator can correct for position-bias, even when trust-bias is present, and is indifferent to predictions on never-displayed items.
7. Experimental Setup
In order to evaluate our novel DR estimator, we apply the semi-synthetic setup that is common in unbiased LTR (Oosterhuis and de Rijke, 2018, 2019; Hofmann et al., 2013; Zhuang and Zuccon, 2020; Vardasbi et al., 2020b; Ovaisi et al., 2020; Joachims et al., 2017b). This simulates a web-search scenario by sampling queries and documents from commercial search datasets, while user interactions and rankings are simulated using probabilistic click models. We use the three largest publicly-available LTR industry datasets: Yahoo! Webscope (Chapelle and Chang, 2011), MSLR-WEB30k (Qin and Liu, 2013) and Istella (Dato et al., 2016). Each dataset contains queries, preselected documents per query and for the query-document pairs: feature representations and labels indicating expert-judged relevance, with we use . The queries in the datasets are divided into training, validation and test partitions. Our logging policy is obtained by supervised training on 1% of the training partition (Joachims et al., 2017b). At each interaction , a query is sampled uniformly over the training and validation partitions and a corresponding ranking is sampled from the logging policy. Clicks are simulated using the click model in Eq. 1. We simulate both a top- setting, where only five items can be displayed at once, and a full-ranking setting where all items are displayed simultaneously. The parameters for the top-5 setting are based on empirical work by Agarwal et al. (2019b): and ; for the full-ranking setting we use Eq. 4 with: , , and , because these closely match the top-5 parameters while being applicable to longer rankings. We simulate both top- settings where and are known and where they are estimated with expectation-maximization (EM) (Vardasbi et al., 2020b; Agarwal et al., 2019b). All models are neural networks with two 32-unit hidden layers, applied in Plackett-Luce ranking models optimized using policy gradients estimated with PL-Rank-2 (Oosterhuis, 2021). The only exception is the logging policy in the full-ranking settings which is a deterministic ranker to better match earlier work (Joachims et al., 2017b; Vardasbi et al., 2020b; Agarwal et al., 2019a). Propensities use frequentist estimates of the logging policy: , we clip with in the top-5 setting and in the full-ranking setting. Early stopping is applied using counterfactual estimates based on clicks on the validation set.
Our main performance metric is the expected number of clicks on preferred items (ECP), as introduced in Section 3.2. In addition, Appendix E also provides our main results measured with the NDCG metric.
Our results evaluate our DM estimator (Eq. 32) and our DR estimator (Eq. 32) both using the estimates of a regression model optimized by our loss (Eq. 45). Their performance is compared with the following baselines: (i) a naive estimator that ignores bias (Eq. 25 with ); (ii) IPS(Eq. 25); (iii) ratio-propensity-scoring(RPS) (Wang et al., 2021); and (iv) DMoptimized with (Eq. 30 & 32) from previous work (Bekker et al., 2019; Saito et al., 2020). None of the estimators receive any information about queries that were not sampled in the training data. To compare the differences with the optimal performance possible, we also optimize a model based on the true labels (full-information).
As an example for clarity, the following procedure is used to evaluate the performance of our DR estimator at displayed rankings in the top-5 setting with estimated bias parameters: (1) queries are sampled with replacement from the training and validation partitions, a displayed ranking is generated for each sampled query using the stochastic logging policy. (2) Clicks on each ranking are simulated using the click model in Eq. 1 and the true and parameters. (3) EMis applied to the simulated click data to obtain estimated and parameters. (4) A regression model is optimized using , , and the click data simulated on the training set, is computed for each item. (5) A ranking model is optimized to maximize the DR estimate of its ECP, using , , and the training click data, early stopping criteria are estimated with the validation click data. (6) Finally, the true ECP (, Eq. 7) of the resulting ranking model is computed on the test-set and added to our results. We repeat each procedure twenty times independently and report the mean results in addition to standard deviation and 90% confidence intervals. Statistical differences with the performance of our DR estimator were measured via a two-sided student’s t-test (Student, 1908).
| Yahoo! Webscope | MSLR-WEB30k | Istella | |
| Top-5 Setting with Known Bias Parameters | 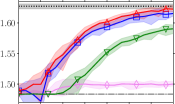 |
 |
 |
 |
 |
 |
|
| Top-5 Setting with Estimated Bias Parameters | 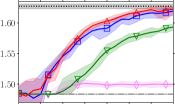 |
 |
 |
 |
 |
 |
|
| Full-Ranking with Known Bias Parameters | 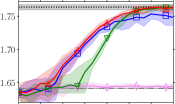 |
 |
 |
 |
 |
 |
|
|
|
|||
| Yahoo! Webscope | MSLR-WEB30k | Istella | |||||||
| Top-5 Setting with Known Bias Parameters | |||||||||
| Logging | 1.483 | 1.483 | 1.483 | 1.110 | 1.110 | 1.110 | 1.691 | 1.691 | 1.691 |
| Full-Info. | 1.628 (0.005)▲ | 1.628 (0.005)▲ | 1.628 (0.005)▲ | 1.282 (0.008)▲ | 1.282 (0.008)▲ | 1.282 (0.008) | 1.994 (0.021)▲ | 1.994 (0.021)▲ | 1.994 (0.021) |
| Naive | 1.495 (0.009)▼ | 1.498 (0.002)▼ | 1.500 (0.002)▼ | 1.114 (0.009)▼ | 1.121 (0.009)▼ | 1.121 (0.007)▼ | 1.707 (0.019)▼ | 1.736 (0.006)▼ | 1.737 (0.003)▼ |
| DM (prev) | 1.519 (0.010)▼ | 1.540 (0.009)▼ | 1.565 (0.009)▼ | 1.139 (0.022)▽ | 1.214 (0.016)▼ | 1.201 (0.011)▼ | 1.539 (0.072)▼ | 1.696 (0.042)▼ | 1.904 (0.009)▼ |
| RPS | 1.539 (0.007)▼ | 1.581 (0.004)▼ | 1.581 (0.005)▼ | 1.187 (0.009)▲ | 1.248 (0.004)▼ | 1.250 (0.006)▼ | 1.805 (0.007)▲ | 1.875 (0.008)▼ | 1.876 (0.007)▼ |
| IPS | 1.486 (0.007)▼ | 1.552 (0.006)▼ | 1.590 (0.004)▼ | 1.110 (0.007)▼ | 1.187 (0.008)▼ | 1.237 (0.007)▼ | 1.710 (0.032)▼ | 1.879 (0.014)▼ | 1.950 (0.014)▼ |
| DM (ours) | 1.542 (0.006)▽ | 1.594 (0.004)▼ | 1.616 (0.003)▼ | 1.143 (0.030) | 1.252 (0.008)▼ | 1.271 (0.007)▼ | 1.721 (0.035)▼ | 1.898 (0.023)▼ | 1.966 (0.017)▼ |
| DR (ours) | 1.548 (0.011) | 1.602 (0.004) | 1.623 (0.003) | 1.157 (0.026) | 1.263 (0.008) | 1.281 (0.006) | 1.769 (0.037) | 1.952 (0.024) | 2.004 (0.009) |
| Top-5 Setting with Estimated Bias Parameters | |||||||||
| Logging | 1.483 | 1.483 | 1.483 | 1.110 | 1.110 | 1.110 | 1.691 | 1.691 | 1.691 |
| Full-Info. | 1.628 (0.005)▲ | 1.628 (0.005)▲ | 1.628 (0.005)▲ | 1.282 (0.008)▲ | 1.282 (0.008)▲ | 1.282 (0.008) | 1.994 (0.021)▲ | 1.994 (0.021)▲ | 1.994 (0.021) |
| Naive | 1.492 (0.006)▼ | 1.498 (0.003)▼ | 1.499 (0.003)▼ | 1.112 (0.008)▼ | 1.121 (0.008)▼ | 1.122 (0.006)▼ | 1.703 (0.018) | 1.739 (0.005)▼ | 1.735 (0.011)▼ |
| DM (prev) | 1.540 (0.007)▼ | 1.570 (0.009)▼ | 1.558 (0.005)▼ | 1.153 (0.025) | 1.209 (0.016)▼ | 1.191 (0.011)▼ | 1.662 (0.039)▼ | 1.769 (0.049)▼ | 1.910 (0.014)▼ |
| RPS | 1.537 (0.007)▼ | 1.582 (0.003)▼ | 1.581 (0.005)▼ | 1.188 (0.011)▲ | 1.245 (0.006)▼ | 1.250 (0.006)▼ | 1.811 (0.009)▲ | 1.875 (0.005)▼ | 1.876 (0.007)▼ |
| IPS | 1.488 (0.009)▼ | 1.555 (0.006)▼ | 1.593 (0.003)▼ | 1.111 (0.007)▼ | 1.182 (0.007)▼ | 1.233 (0.009)▼ | 1.710 (0.033) | 1.874 (0.013)▼ | 1.944 (0.019)▼ |
| DM (ours) | 1.546 (0.007) | 1.591 (0.010)▼ | 1.619 (0.005)▽ | 1.138 (0.021) | 1.251 (0.011)▼ | 1.272 (0.008)▼ | 1.662 (0.047)▼ | 1.878 (0.043)▼ | 1.961 (0.010)▼ |
| DR (ours) | 1.548 (0.006) | 1.603 (0.003) | 1.623 (0.004) | 1.149 (0.028) | 1.260 (0.005) | 1.282 (0.005) | 1.724 (0.057) | 1.945 (0.014) | 1.994 (0.012) |
| Full-Ranking Setting with Known Bias Parameters | |||||||||
| Logging | 1.641 | 1.641 | 1.641 | 1.372 | 1.372 | 1.372 | 1.769 | 1.769 | 1.769 |
| Full-Info. | 1.764 (0.004)▲ | 1.764 (0.004)▲ | 1.764 (0.004) | 1.531 (0.007)▲ | 1.531 (0.007)▲ | 1.531 (0.007) | 2.025 (0.013)▲ | 2.025 (0.013)▲ | 2.025 (0.013) |
| Naive | 1.642 (0.007)▼ | 1.642 (0.002)▼ | 1.645 (0.002)▼ | 1.369 (0.007)▼ | 1.374 (0.006)▼ | 1.374 (0.006)▼ | 1.757 (0.014)▼ | 1.777 (0.003)▼ | 1.777 (0.003)▼ |
| DM (prev) | 1.642 (0.003)▼ | 1.630 (0.005)▼ | 1.597 (0.036)▼ | 1.368 (0.007)▼ | 1.365 (0.010)▼ | 1.356 (0.015)▼ | 1.795 (0.006)▼ | 1.810 (0.006)▼ | 1.807 (0.011)▼ |
| RPS | 1.652 (0.004)▼ | 1.651 (0.001)▼ | 1.661 (0.002)▼ | 1.388 (0.006)▼ | 1.386 (0.006)▼ | 0.587 (0.004)▼ | 1.807 (0.018)▼ | 1.823 (0.002)▼ | 1.708 (0.044)▼ |
| IPS | 1.643 (0.011)▼ | 1.716 (0.003)▼ | 1.762 (0.002) | 1.368 (0.009)▼ | 1.468 (0.006)▼ | 1.532 (0.007) | 1.766 (0.022)▼ | 1.953 (0.015)▼ | 2.033 (0.013) |
| DM (ours) | 1.672 (0.009) | 1.734 (0.005)▼ | 1.748 (0.009)▼ | 1.409 (0.021) | 1.512 (0.010) | 1.529 (0.007) | 1.819 (0.028) | 2.008 (0.013) | 2.047 (0.009)▲ |
| DR (ours) | 1.676 (0.010) | 1.740 (0.004) | 1.763 (0.004) | 1.422 (0.017) | 1.510 (0.009) | 1.531 (0.006) | 1.834 (0.019) | 1.998 (0.019) | 2.031 (0.012) |
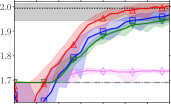
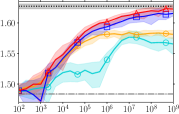
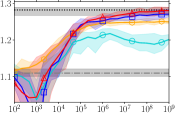
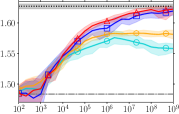
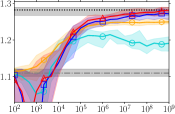
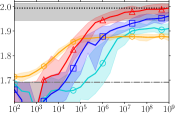
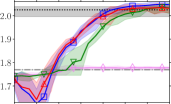
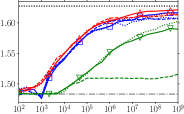
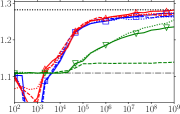
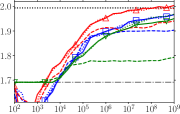
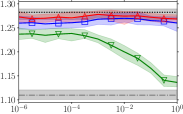
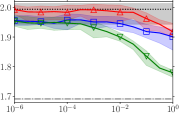
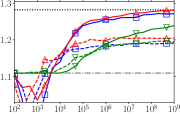
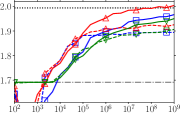
8. Results
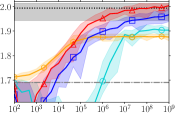
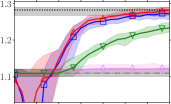
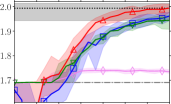
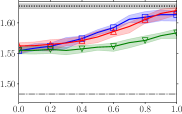
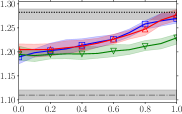
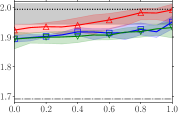
Our main experimental results are displayed in Figure 1 and Table 7. Both display performance reached, in terms of the ECP metric (Eq. 7), for different estimators on varying amounts of simulated interaction data; and both are split in three rows, each indicating the results of one of the three simulated settings. The displayed results are means over twenty independent runs, 90% confidence intervals are visualized in Figure 1 so that meaningful differences can be recognized. Furthermore, Table 7 displays standard deviations and statistical significant performance differences with DR using a two-sided student’s t-test (Student, 1908).
8.1. Performance of Inverse Propensity Scoring
To begin our analysis, we consider the performance of IPS; In Figure 1, we see that in both top-5 settings IPS is unable to reach optimal ECP when on any of the datasets, an observation also made in previous work (Oosterhuis and de Rijke, 2021a). In the top-5 setting with known bias parameters, IPS is theoretically proven to be unbiased and will converge at optimal ECP as . Consequently, we can conclude that it is high variance which prevents us from observing IPS’s convergence in the top-row of Figure 1 222The effect of clipping can be excluded since our clipping strategy has no effect in our experimental setting when .. This observation illustrates the importance of variance reduction: it is not bias but high variance that prevents IPS from reaching optimal performance with feasible amounts of interaction data. In contrast with the two top-rows of Figure 1, the bottom row shows that IPS can reach optimal ECP on all datasets in the full-ranking setting. A plausible explanation is that interactions on a complete ranking provide much more information than when only the top-5 can be interacted with. Possibly, the item-selection-bias in the top-5 settings greatly increase the variance of IPS due to the winner-takes-all behavior described in Section 6.1. Overall, we see that while IPS can approximate optimal ECP in the full-ranking setting with reasonable amounts of data, its variance prevents it from reaching good ECP in top-5 settings even when given an enormous number of interactions.
8.2. Performance of Novel Direct Method and Doubly-Robust Estimators
Next we consider whether our DR estimator provides an improvement over the performance of IPS. Figure 1 reveals that this is clearly the case: in all settings it outperforms IPS when and only in the full-ranking setting does IPS catch up around . Moreover, DR always has a higher or comparable mean ECP than IPS when , across all datasets and settings. Table 7 does not report a single instance of IPS significantly outperforming DR but many instances where DR significantly outperforms IPS. In all of the top-5 settings, the ECP of DR when is not reached by IPS when , regardless of whether bias parameters are known or estimated. Therefore the DR appears to provide an increase in data-efficiency over IPS of a factor greater than 1,000 in all of the top-5 settings. We thus confidently conclude that DR provides significantly and considerably higher performance than state-of-the-art IPS, given that , which in top-5 settings leads to an enormous increase in data-efficiency.
Subsequently, we compare the performance of our DM estimator with IPS. In Figure 1, we see that in some cases DM has substantially better ECP than IPS, particularly in the top-5 settings on Yahoo! and MSLR. Yet, we also see that, on all settings on the Istella dataset, the ECP differences between DM and IPS are much smaller; and on the full-ranking setting on Yahoo!, DM appears to converge at noticeably worse ECP than IPS. These results are quite surprising as it shows that this simple but previously-unconsidered approach is actually a competitive baseline to IPS. We conclude that DM appears preferable over IPS in top-5 settings where not all items can be displayed at once, but not necessarily in full-ranking settings.
Lastly, our comparison considers both our novel DM and DR estimators. In Figure 1, we see that overall DM has lower ECP than DR, but in some cases it has comparable or not significantly different ECP. Table 7 reveals that in both the top-5 settings and the full-ranking setting on Yahoo!, DR has a significantly higher ECP than DM, even though these differences are smaller than compared with IPS. This result confirms that the DR approach can indeed effectively use click data to correct for the regression mistakes of DM. It appears that this is especially the case on the Istella dataset, where in both top-5 settings there is a considerable performance difference between our DR and DM estimators; here Figure 1 shows the ECP reached by our DM when is reached by our DR when . Notably, DM appears to converge on suboptimal ECP in the full-ranking setting on Yahoo! and in both top-5 settings on MSLR, indicating that its unbiasedness criteria (Eq. 33) are not met in these situations. In stark contrast, our DR estimator reaches near-optimal ECP in all tested scenarios, which corresponds with its much more robust unbiasedness criteria. Overall, our results indicate that DR in the majority of cases significantly outperforms DM.
Our observations seem to confirm several of our expectations from our theoretical analysis: The inability of IPS to reach optimal ECP when in top-5 settings confirms that variance is its biggest obstacle. The large increase of DM over IPS seems to indicate that the usage of regression estimates provides a large reduction in variance. The cases of suboptimal convergence of DM show that its impractical unbiasedness criteria are infeasible in some of our experimental settings. Finally, in all settings and datasets, our DR estimator has significantly better or comparable ECP to DM and IPS, while always converging near optimal ECP. This observation shows that DR effectively combines the variance reduction of DM with the more feasible unbiasedness criteria of IPS, and clearly provides the most robust and highest performance across our tested settings and datasets.
Despite the large aforementioned advantages, we note that a downside of our DM and DR estimators is that they provide low ECP in some settings when . It appears that our early-stopping strategy, which is very effective for IPS, is not able to handle incorrect regression estimates very well. Future work could investigate whether this could be remedied with safe deployment strategies (Jagerman et al., 2020; Oosterhuis and de Rijke, 2021b), that prevent deploying models with uncertain performance. However, it seems doubtful to us that in a real-world setting such little data is available that . Nonetheless, our results show that DM and DR are less resilient to tiny amounts of training data than IPS.
8.3. Comparison with other Baselines
Finally, our comparison also includes other baseline methods: the naive estimator, RPS and DM from previous work. We note that all of these methods are biased in our setting: the naive estimator explicitly ignores position-bias, RPS trades bias for less variance and the DM from previous work ignores trust-bias. Unsurprisingly, Figure 1 and Table 7 show that they are all unable to converge at optimal ECP in any of the settings. The effect of trust-bias appears particularly large in the full-ranking setting, where none of these baselines are able to substantially improve ECP over the logging policy. The ECP of RPS appears very sensitive to propensity clipping: when and clipping no longer has effect its performance completely drops. Nevertheless, these baselines show that often a decrease in variance can be favourable over unbiasedness, as some of them provide higher ECP than the unbiased IPS estimator in the top-5 settings on Yahoo! and MSLR, especially when is small. Regardless, due their bias, they are unable to combine optimal convergence with low variance. It appears that our DR estimator is the only method that effectively combines these properties.
| Yahoo! Webscope | MSLR-WEB30k | Istella |
 |
 |
 |
| Number of Displayed Queries () | Number of Displayed Queries () | Number of Displayed Queries () |
|
|
||
| Yahoo! Webscope | MSLR-WEB30k | Istella |
 |
 |
 |
| Clipping Threshold () | Clipping Threshold () | Clipping Threshold () |
|
|
||
| Yahoo! Webscope | MSLR-WEB30k | Istella |
 |
 |
 |
| Number of Displayed Queries () | Number of Displayed Queries () | Number of Displayed Queries () |
|
|
||
| Yahoo! Webscope | MSLR-WEB30k | Istella |
 |
 |
 |
| Bias-Parameter Interpolation () | Bias-Parameter Interpolation () | Bias-Parameter Interpolation () |
|
|
||
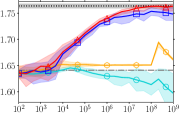
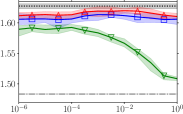
8.4. Correcting to Bias Introduced by the Clipping Strategy
As discussed in Section 6.3, one of the advantages of DR estimation is that, in contrast with IPS, it can potentially correct for some of the bias introduced by clipping. To experimentally verify whether these corrections can lead to observable advantages in practice, we ran additional experiments with varying clipping strategies applied to the IPS, DM and DR estimators in the top-5 setting with known bias parameters.
Figure 3 shows the learning curves of these estimators with our standard clipping strategy: (cf. Eq. 24), a strategy with 1000 times less clipping: , and a heavy clipping strategy: . In addition, the effect of individual threshold values are visualized in Figure 3, where ECP with is displayed for values of the clipping threshold ranging from to .
Clearly, IPS is the most sensitive to the clipping threshold as its ECP drops dramatically when heavy clipping is applied. In contrast, while there is a noticeable effect from varying on the DM and DR estimators, the differences between light, standard and heavy clipping are relatively small on the Yahoo! and MSLR datasets. On the Istella dataset, there is a larger decrease in ECP for the DM and DR with heavy clipping, but it is still much smaller than that of IPS. Importantly, we see that, regardless of what clipping is applied, DR always has a higher ECP than DM and IPS. This indicates that the performance advantage of DR over DM remains stable w.r.t. the clipping strategy, where the differences with IPS become especially large under heavy clipping.
Therefore, we conclude that the DM and DR are less sensitive to propensity clipping than IPS and can better correct for the bias introduced by clipping strategies. Where the performance of IPS considerably varies for different clipping strategies, DM and DR are only affected by very heavy clipping. We can thus infer that the use of regression by DM and DR makes them more robust to propensity clipping. Moreover, the advantage of DR over both DM and IPS is consistent across all our tested clipping strategies, indicating it is the optimal choice regardless of what clipping strategy is applied.
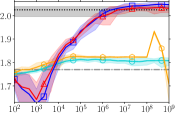
8.5. Robustness to Incorrect Bias Specification
The main results presented in Figure 1 and Table 7 reveal that there is very little difference in performance between the top-5 setting where the bias parameters are known and where they have to be estimated. While this shows that good performance is maintained when bias has to be estimated, it is unclear whether this also means that the estimators are robust to misspecified bias, since it is possible the estimated bias parameters are actually quite accurate. Furthermore, most of our theoretical results assume that bias is correctly estimated, it is thus valuable to empirically verify whether the advantages of the DR remain when its bias parameters are incorrect.
To better understand how robust the DR estimator is to bias misspecification, the ECP of the DR, DM and IPS estimators were measured in the top-5 setting with intentionally misspecified bias parameters. For the incorrect bias parameters, we choose the mean values across positions: and . These mean values represent a naive approach that ignores the effect of the position on the examination and trust of users, i.e. it assumes that any document that is displayed in the top-5 is treated equally by the user, regardless of its exact position.
Figure 5 displays the learning curves with these incorrect bias parameters. Clearly, the ECP reached with all three estimators drops dramatically when the bias is heavily misspecified. While IPS and DM converge on similar performance, DR provides noticeably higher ECP when on all three datasets. This strongly indicates that DR is more robust to heavily misspecified bias than DM and IPS.
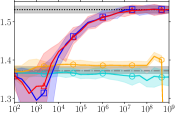
We further investigate how the degree of misspecification affects the estimators, by measuring ECP in the top-5 setting when and bias is interpolated between the true values and the mean with the parameter : and . The results are displayed in Figure 5.
In line with our previous observations, Figure 5 reveals IPS to have the lowest ECP, regardless of bias misspecification. Interestingly, the differences between DR and DM vary: on Istella, DR considerably outperforms DM, but on Yahoo! and MSLR, the difference is only clear when and . When the interpolation is more in between the extreme values, DM and DR have comparable ECP where sometimes DM has slightly higher performance. As a result, we cannot conclude whether DR better deals with bias misspecification than DM. Nevertheless, the differences between DR and DM are relatively small, thus the choice does not seem very consequential. Conversely, our results clearly indicate that IPS provides worse ECP than DR and DM whether bias is misspecified or not.
In summary, our results show that DR estimation is much more robust to bias misspecification than IPS. Moreover, it appears to outperform DM under heavy or light misspecification, but results are mixed when the misspecification is moderate. Overall, our results indicate that the advantages of DR over IPS and DM are mostly still applicable when bias is incorrectly estimated or misspecified.
9. Conclusion
This paper has introduced the first unbiased DR estimator that is specifically designed to correct for position-bias in click feedback. Our estimator differs from existing DR estimators by using the expected correlation between clicks and preference per rank, instead of the unobservable examination variable or corrections solely based on action probabilities. Additionally, we also proposed a novel DM estimator and a novel cross-entropy loss estimator. In terms of theory, this work has contributed the most robust estimator for LTR yet: our DR estimator is the only method that corrects for position-bias, trust-bias and item-selection bias and has less strict unbiasedness criteria than the prevalent IPS approach. Moreover, our experimental results show that it can provide enormous increases in data-efficiency compared to IPS and better overall performance w.r.t. other existing state-of-the-art approaches. Therefore, both our theoretical and empirical results indicate that our DR estimator is the most reliable and effective way to correct for position-bias. Consequently, we think there is large potential in replacing IPS with DR as the new basis for the unbiased LTR field.
Future work hopefully finds similar gains in related tasks, e.g. exposure-based ranking fairness (Singh and Joachims, 2018) or ranking display advertisements (Lagrée et al., 2016). Overall, we expect the improvements in efficiency and robustness to make unbiased LTR even more attractive for real-world applications.
Code, Resources and Data
To facilitate the reproducibility of the reported results, this work only made use of publicly available data and our experimental implementation is publicly available at https://github.com/HarrieO/2022-doubly-robust-LTR. Additionally, a video presentation with accompanying slides is available at https://harrieo.github.io//publication/2023-doubly-robust.
Acknowledgments
We thank the reviewers of previous versions of this work for their valuable comments and suggestions. This research was partially supported by the Google Research Scholar Program. All content represents the opinion of the author, which is not necessarily shared or endorsed by their respective employers and/or sponsors.
Appendices
Appendix A BIAS and Variance of IPS
Theorem A.1.
The IPS estimator (Eq. 25) has the following bias:
| (47) |
Lemma A.4.
Trivially, if the bias parameters are correct then:
| (52) |
Corollary A.5.
When and are correct IPS has the bias:
| (53) |
Theorem A.6.
The IPS estimator (Eq. 25) is unbiased when , and are correctly estimated and clipping has no effect:
| (54) |
Theorem A.7.
The IPS estimator (Eq. 25) has the variance:
| (55) |
Appendix B Bias of CV Estimator
Lemma B.1.
The CV estimator (Eq. 34) has the following expected value:
| (56) |
Proof.
Follows directly from Eq. 34. ∎
Theorem B.2.
Appendix C Bias and Variance of DR Estimator
Theorem C.1.
The DR estimator (Eq. 36) has the following bias:
| (59) |
Lemma C.2.
By the definition of (Eq. 23):
| (62) |
Corollary C.3.
The bias of the DR estimator (Eq. 36) can be simplified when and are correctly estimated:
| (63) |
Theorem C.4.
The DR estimator (Eq. 36) is unbiased if the and bias parameters are correctly estimated and per item either is correct and clipping has no effect or is correct:
| (64) |
Proof.
Theorem C.5.
Theorem C.6.
The DR estimator (Eq. 36) has the variance:
| (67) | ||||
Lemma C.7.
The covariance between clicks on an item and is:
| (68) |
Proof.
| (69) | ||||
∎
Corollary C.8.
If and are correct then the variance of the DR estimator (Eq. 36) is:
| (70) | |||
Theorem C.9.
Appendix D Bias of The Cross-Entropy Estimator
Theorem D.1.
The estimator (Eq. 45) has the following bias:
| (74) |
Proof.
Theorem D.3.
is unbiased when , and are correctly estimated and clipping has no effect:
| (77) |
Appendix E Main results evaluated with Discounted cumulative gain
The main results presented in Section 8 used ECP (Eq. 7) as the metric of performance. As argued in Section 3.2, we think ECP is the most appropriate metric as it is based on the actual user model in the simulation, i.e. it utilizes the true and values. Nevertheless, this makes it harder to compare our results with previous work that relies on more traditional metrics.
To better enable such comparisons, and to verify whether our conclusions translate to other metrics, Table E reports the same results as Table 7 but in terms of normalized discounted cumulative gain (NDCG) (Järvelin and Kekäläinen, 2002):
| (80) |
Comparing Table 7 with Table E reveals that both tables show the same trends and relative differences between the different methods. This confirms that the conclusions that were made from comparisons in Section 8 are still valid when measuring with NDCG instead of ECP. In other words, Table E shows that even when evaluating with NDCG, the performance improvements of DR and DM over IPS and other baselines remain very clear.
| Yahoo! Webscope | MSLR-WEB30k | Istella | |||||||
| Top-5 Setting with Known Bias Parameters | |||||||||
| Logging | 0.700 | 0.700 | 0.700 | 0.465 | 0.465 | 0.465 | 0.539 | 0.539 | 0.539 |
| Full-Info. | 0.767 (0.002)▲ | 0.767 (0.002)▲ | 0.767 (0.002)▲ | 0.541 (0.002)▲ | 0.541 (0.002)▲ | 0.541 (0.002) | 0.639 (0.007)▲ | 0.639 (0.007)▲ | 0.639 (0.007)▽ |
| Naive | 0.706 (0.004)▼ | 0.708 (0.001)▼ | 0.709 (0.001)▼ | 0.467 (0.003)▼ | 0.470 (0.003)▼ | 0.470 (0.002)▼ | 0.544 (0.006)▼ | 0.554 (0.002)▼ | 0.555 (0.001)▼ |
| DM (prev) | 0.716 (0.005)▼ | 0.727 (0.004)▼ | 0.740 (0.004)▼ | 0.475 (0.011)▽ | 0.510 (0.008)▼ | 0.506 (0.004)▼ | 0.493 (0.023)▼ | 0.543 (0.014)▼ | 0.609 (0.003)▼ |
| RPS | 0.727 (0.003) | 0.747 (0.002)▼ | 0.748 (0.003)▼ | 0.500 (0.004)▲ | 0.527 (0.003)▼ | 0.528 (0.003)▼ | 0.577 (0.002)▲ | 0.600 (0.003)▼ | 0.601 (0.003)▼ |
| IPS | 0.702 (0.004)▼ | 0.734 (0.003)▼ | 0.752 (0.002)▼ | 0.465 (0.002)▼ | 0.500 (0.003)▼ | 0.522 (0.004)▼ | 0.545 (0.011)▼ | 0.602 (0.004)▼ | 0.625 (0.004)▼ |
| DM (ours) | 0.727 (0.003) | 0.752 (0.002)▼ | 0.762 (0.001)▼ | 0.477 (0.016) | 0.529 (0.003)▼ | 0.536 (0.003)▼ | 0.551 (0.011)▼ | 0.609 (0.007)▼ | 0.630 (0.005)▼ |
| DR (ours) | 0.730 (0.005) | 0.755 (0.002) | 0.765 (0.001) | 0.484 (0.012) | 0.534 (0.003) | 0.541 (0.002) | 0.566 (0.012) | 0.626 (0.008) | 0.642 (0.003) |
| Top-5 Setting with Estimated Bias Parameters | |||||||||
| Logging | 0.700 | 0.700 | 0.700 | 0.465 | 0.465 | 0.465 | 0.539 | 0.539 | 0.539 |
| Full-Info. | 0.767 (0.002)▲ | 0.767 (0.002)▲ | 0.767 (0.002)▲ | 0.541 (0.002)▲ | 0.541 (0.002)▲ | 0.541 (0.002) | 0.639 (0.007)▲ | 0.639 (0.007)▲ | 0.639 (0.007) |
| Naive | 0.705 (0.003)▼ | 0.708 (0.001)▼ | 0.709 (0.001)▼ | 0.466 (0.003)▼ | 0.470 (0.003)▼ | 0.470 (0.002)▼ | 0.543 (0.006)▽ | 0.555 (0.002)▼ | 0.554 (0.004)▼ |
| DM (prev) | 0.727 (0.004)▽ | 0.742 (0.004)▼ | 0.737 (0.002)▼ | 0.481 (0.012) | 0.507 (0.009)▼ | 0.501 (0.005)▼ | 0.532 (0.013)▼ | 0.566 (0.016)▼ | 0.612 (0.005)▼ |
| RPS | 0.726 (0.003)▼ | 0.748 (0.002)▼ | 0.748 (0.003)▼ | 0.500 (0.004)▲ | 0.526 (0.003)▼ | 0.528 (0.003)▼ | 0.579 (0.003)▲ | 0.600 (0.002)▼ | 0.601 (0.003)▼ |
| IPS | 0.703 (0.004)▼ | 0.735 (0.003)▼ | 0.753 (0.001)▼ | 0.465 (0.002)▼ | 0.498 (0.004)▼ | 0.520 (0.004)▼ | 0.545 (0.011) | 0.600 (0.004)▼ | 0.623 (0.006)▼ |
| DM (ours) | 0.730 (0.004) | 0.750 (0.005)▼ | 0.763 (0.002)▽ | 0.473 (0.010) | 0.528 (0.006)▼ | 0.537 (0.003)▼ | 0.532 (0.015)▼ | 0.603 (0.014)▼ | 0.629 (0.003)▼ |
| DR (ours) | 0.730 (0.003) | 0.756 (0.001) | 0.765 (0.002) | 0.479 (0.012) | 0.532 (0.004) | 0.541 (0.002) | 0.552 (0.019) | 0.624 (0.005) | 0.640 (0.004) |
| Full-Ranking Setting with Known Bias Parameters | |||||||||
| Logging | 0.858 | 0.858 | 0.858 | 0.746 | 0.746 | 0.746 | 0.728 | 0.728 | 0.728 |
| Full-Info. | 0.888 (0.001)▲ | 0.888 (0.001)▲ | 0.888 (0.001) | 0.775 (0.002)▲ | 0.775 (0.002)▲ | 0.775 (0.002) | 0.785 (0.003)▲ | 0.785 (0.003)▲ | 0.785 (0.003)▽ |
| Naive | 0.859 (0.002)▼ | 0.859 (0.000)▼ | 0.859 (0.000)▼ | 0.745 (0.001)▼ | 0.746 (0.001)▼ | 0.746 (0.001)▼ | 0.724 (0.003)▼ | 0.729 (0.001)▼ | 0.729 (0.001)▼ |
| DM (prev) | 0.858 (0.001)▼ | 0.856 (0.001)▼ | 0.849 (0.008)▼ | 0.743 (0.002)▼ | 0.743 (0.002)▼ | 0.744 (0.002)▼ | 0.732 (0.001)▼ | 0.737 (0.001)▼ | 0.736 (0.002)▼ |
| RPS | 0.861 (0.001)▼ | 0.861 (0.000)▼ | 0.861 (0.000)▼ | 0.748 (0.002)▼ | 0.748 (0.001)▼ | 0.610 (0.001)▼ | 0.737 (0.004)▽ | 0.741 (0.000)▼ | 0.701 (0.014)▼ |
| IPS | 0.859 (0.003)▼ | 0.877 (0.001)▼ | 0.888 (0.001) | 0.745 (0.001)▼ | 0.762 (0.002)▼ | 0.774 (0.002) | 0.725 (0.005)▼ | 0.769 (0.004)▼ | 0.787 (0.003) |
| DM (ours) | 0.866 (0.002) | 0.881 (0.001)▼ | 0.885 (0.002)▼ | 0.752 (0.006)▽ | 0.772 (0.002) | 0.774 (0.002) | 0.738 (0.007) | 0.783 (0.003)▲ | 0.793 (0.002)▲ |
| DR (ours) | 0.866 (0.003) | 0.882 (0.001) | 0.888 (0.001) | 0.755 (0.004) | 0.771 (0.002) | 0.774 (0.002) | 0.741 (0.005) | 0.779 (0.004) | 0.787 (0.003) |
References
- (1)
- Agarwal et al. (2019a) Aman Agarwal, Kenta Takatsu, Ivan Zaitsev, and Thorsten Joachims. 2019a. A General Framework for Counterfactual Learning-to-Rank. In Proceedings of the 42nd International ACM SIGIR Conference on Research & Development in Information Retrieval. ACM, 5–14.
- Agarwal et al. (2019b) Aman Agarwal, Xuanhui Wang, Cheng Li, Michael Bendersky, and Marc Najork. 2019b. Addressing Trust Bias for Unbiased Learning-to-Rank. In The World Wide Web Conference. ACM, 4–14.
- Agarwal et al. (2019c) Aman Agarwal, Ivan Zaitsev, Xuanhui Wang, Cheng Li, Marc Najork, and Thorsten Joachims. 2019c. Estimating Position Bias without Intrusive Interventions. In Proceedings of the Twelfth ACM International Conference on Web Search and Data Mining. ACM, 474–482.
- Ai et al. (2021) Qingyao Ai, Tao Yang, Huazheng Wang, and Jiaxin Mao. 2021. Unbiased Learning to Rank: Online or Offline? ACM Transactions on Information Systems (TOIS) 39, 2 (2021), 1–29.
- Bekker et al. (2019) Jessa Bekker, Pieter Robberechts, and Jesse Davis. 2019. Beyond the Selected Completely at Random Assumption for Learning from Positive and Unlabeled Data. In Joint European Conference on Machine Learning and Knowledge Discovery in Databases. Springer, 71–85.
- Burges (2010) Christopher J.C. Burges. 2010. From RankNet to LambdaRank to LambdaMART: An Overview. Technical Report MSR-TR-2010-82. Microsoft.
- Chapelle and Chang (2011) Olivier Chapelle and Yi Chang. 2011. Yahoo! Learning to Rank Challenge Overview. Journal of Machine Learning Research 14 (2011), 1–24.
- Craswell et al. (2008) Nick Craswell, Onno Zoeter, Michael Taylor, and Bill Ramsey. 2008. An Experimental Comparison of Click Position-Bias Models. In Proceedings of the 2008 International Conference on Web Search and Data Mining. 87–94.
- Dato et al. (2016) Domenico Dato, Claudio Lucchese, Franco Maria Nardini, Salvatore Orlando, Raffaele Perego, Nicola Tonellotto, and Rossano Venturini. 2016. Fast Ranking with Additive Ensembles of Oblivious and Non-Oblivious Regression Trees. ACM Transactions on Information Systems (TOIS) 35, 2 (2016), Article 15.
- Dudík et al. (2014) Miroslav Dudík, Dumitru Erhan, John Langford, and Lihong Li. 2014. Doubly Robust Policy Evaluation and Optimization. Statist. Sci. 29, 4 (2014), 485–511.
- Fang et al. (2019) Zhichong Fang, Aman Agarwal, and Thorsten Joachims. 2019. Intervention Harvesting for Context-Dependent Examination-Bias estimation. In Proceedings of the 42nd International ACM SIGIR Conference on Research and Development in Information Retrieval. 825–834.
- Hofmann et al. (2013) Katja Hofmann, Anne Schuth, Shimon Whiteson, and Maarten de Rijke. 2013. Reusing Historical Interaction Data for Faster Online Learning to Rank for IR. In Proceedings of the Sixth ACM International Conference on Web Search and Data Mining. ACM, 183–192.
- Horvitz and Thompson (1952) Daniel G Horvitz and Donovan J Thompson. 1952. A Generalization of Sampling Without Replacement from a Finite Universe. Journal of the American statistical Association 47, 260 (1952), 663–685.
- Jagerman et al. (2020) Rolf Jagerman, Ilya Markov, and Maarten De Rijke. 2020. Safe Exploration for Optimizing Contextual Bandits. ACM Transactions on Information Systems (TOIS) 38, 3 (2020), 1–23.
- Järvelin and Kekäläinen (2002) Kalervo Järvelin and Jaana Kekäläinen. 2002. Cumulated Gain-Based Evaluation of IR Techniques. ACM Transactions on Information Systems (TOIS) 20, 4 (2002), 422–446.
- Joachims (2002) Thorsten Joachims. 2002. Optimizing Search Engines Using Clickthrough Data. In Proceedings of the Eighth ACM SIGKDD International Conference on Knowledge Discovery and Data Mining. ACM, 133–142.
- Joachims et al. (2017a) Thorsten Joachims, Laura Granka, Bing Pan, Helene Hembrooke, and Geri Gay. 2017a. Accurately Interpreting Clickthrough Data as Implicit Feedback. In ACM SIGIR Forum, Vol. 51. Acm New York, NY, USA, 4–11.
- Joachims et al. (2017b) Thorsten Joachims, Adith Swaminathan, and Tobias Schnabel. 2017b. Unbiased Learning-to-Rank with Biased Feedback. In Proceedings of the Tenth ACM International Conference on Web Search and Data Mining. ACM, 781–789.
- Kang et al. (2007) Joseph DY Kang, Joseph L Schafer, et al. 2007. Demystifying Double Robustness: A Comparison of Alternative Strategies for Estimating a Population Mean from Incomplete Data. Statistical science 22, 4 (2007), 523–539.
- Kiyohara et al. (2022) Haruka Kiyohara, Yuta Saito, Tatsuya Matsuhiro, Yusuke Narita, Nobuyuki Shimizu, and Yasuo Yamamoto. 2022. Doubly Robust Off-Policy Evaluation for Ranking Policies Under the Cascade Behavior Model. In Proceedings of the Fifteenth ACM International Conference on Web Search and Data Mining. 487–497.
- Komiyama et al. (2015) Junpei Komiyama, Junya Honda, and Hiroshi Nakagawa. 2015. Optimal Regret Analysis of Thompson Sampling in Stochastic Multi-armed Bandit Problem with Multiple Plays. In Proceedings of the 32Nd International Conference on International Conference on Machine Learning - Volume 37 (Lille, France) (ICML’15). JMLR.org, 1152–1161.
- Lagrée et al. (2016) Paul Lagrée, Claire Vernade, and Olivier Cappé. 2016. Multiple-Play Bandits in the Position-Based Model. In Advances in Neural Information Processing Systems. 1597–1605.
- Li et al. (2018) Shuai Li, Yasin Abbasi-Yadkori, Branislav Kveton, S Muthukrishnan, Vishwa Vinay, and Zheng Wen. 2018. Offline Evaluation of Ranking Policies with Click Models. In Proceedings of the 24th ACM SIGKDD International Conference on Knowledge Discovery & Data Mining. ACM, 1685–1694.
- Liu (2009) Tie-Yan Liu. 2009. Learning to Rank for Information Retrieval. Foundations and Trends in Information Retrieval 3, 3 (2009), 225–331.
- Oosterhuis (2021) Harrie Oosterhuis. 2021. Computationally Efficient Optimization of Plackett-Luce Ranking Models for Relevance and Fairness. In Proceedings of the 44th International ACM SIGIR Conference on Research and Development in Information Retrieval (Virtual Event, Canada) (SIGIR ’21). ACM, 1023–1032.
- Oosterhuis and de Rijke (2018) Harrie Oosterhuis and Maarten de Rijke. 2018. Differentiable Unbiased Online Learning to Rank. In Proceedings of the 27th ACM International Conference on Information and Knowledge Management. ACM, 1293–1302.
- Oosterhuis and de Rijke (2019) Harrie Oosterhuis and Maarten de Rijke. 2019. Optimizing Ranking Models in an Online Setting. In Advances in Information Retrieval. Springer International Publishing, Cham, 382–396.
- Oosterhuis and de Rijke (2020) Harrie Oosterhuis and Maarten de Rijke. 2020. Policy-Aware Unbiased Learning to Rank for Top-k Rankings. In Proceedings of the 43rd International ACM SIGIR Conference on Research and Development in Information Retrieval. ACM, 489–498.
- Oosterhuis and de Rijke (2021a) Harrie Oosterhuis and Maarten de Rijke. 2021a. Unifying Online and Counterfactual Learning to Rank. In Proceedings of the 14th ACM International Conference on Web Search and Data Mining (WSDM’21). ACM.
- Oosterhuis and de Rijke (2021b) Harrie Oosterhuis and Maarten de de Rijke. 2021b. Robust Generalization and Safe Query-Specialization in Counterfactual Learning to Rank. In Proceedings of the Web Conference 2021. 158–170.
- Ovaisi et al. (2020) Zohreh Ovaisi, Ragib Ahsan, Yifan Zhang, Kathryn Vasilaky, and Elena Zheleva. 2020. Correcting for Selection Bias in Learning-to-rank Systems. In Proceedings of The Web Conference 2020. 1863–1873.
- Qin and Liu (2013) Tao Qin and Tie-Yan Liu. 2013. Introducing LETOR 4.0 datasets. arXiv preprint arXiv:1306.2597 (2013).
- Radlinski et al. (2008) Filip Radlinski, Madhu Kurup, and Thorsten Joachims. 2008. How Does Clickthrough Data Reflect Retrieval Quality?. In Proceedings of the 17th ACM Conference on Information and Knowledge Management. ACM, 43–52.
- Richardson et al. (2007) Matthew Richardson, Ewa Dominowska, and Robert Ragno. 2007. Predicting Clicks: Estimating the Click-Through Rate for New Ads. In Proceedings of the 16th International Conference on World Wide Web. 521–530.
- Robins et al. (1994) James M Robins, Andrea Rotnitzky, and Lue Ping Zhao. 1994. Estimation of Regression Coefficients when Some Regressors are not Always Observed. Journal of the American statistical Association 89, 427 (1994), 846–866.
- Saito (2020) Yuta Saito. 2020. Doubly Robust Estimator for Ranking Metrics with Post-Click Conversions. In Fourteenth ACM Conference on Recommender Systems. 92–100.
- Saito and Joachims (2021) Yuta Saito and Thorsten Joachims. 2021. Counterfactual Learning and Evaluation for Recommender Systems: Foundations, Implementations, and Recent Advances. In Fifteenth ACM Conference on Recommender Systems. 828–830.
- Saito et al. (2020) Yuta Saito, Suguru Yaginuma, Yuta Nishino, Hayato Sakata, and Kazuhide Nakata. 2020. Unbiased Recommender Learning from Missing-not-at-Random Implicit Feedback. In Proceedings of the 13th International Conference on Web Search and Data Mining. 501–509.
- Schuth et al. (2016) Anne Schuth, Harrie Oosterhuis, Shimon Whiteson, and Maarten de Rijke. 2016. Multileave Gradient Descent for Fast Online Learning to Rank. In Proceedings of the Ninth ACM International Conference on Web Search and Data Mining. 457–466.
- Singh and Joachims (2018) Ashudeep Singh and Thorsten Joachims. 2018. Fairness of Exposure in Rankings. In Proceedings of the 24th ACM SIGKDD International Conference on Knowledge Discovery & Data Mining. 2219–2228.
- Singh and Joachims (2019) Ashudeep Singh and Thorsten Joachims. 2019. Policy Learning for Fairness in Ranking. In Advances in Neural Information Processing Systems. 5426–5436.
- Strehl et al. (2010) Alex Strehl, John Langford, Lihong Li, and Sham M Kakade. 2010. Learning from Logged Implicit Exploration Data. In Advances in Neural Information Processing Systems, J. Lafferty, C. Williams, J. Shawe-Taylor, R. Zemel, and A. Culotta (Eds.), Vol. 23. Curran Associates, Inc.
- Student (1908) Student. 1908. The Probable Error of a Mean. Biometrika (1908), 1–25.
- Sutton et al. (1998) Richard S Sutton, Andrew G Barto, et al. 1998. Introduction to Reinforcement Learning. Vol. 135. MIT press Cambridge.
- Ustimenko and Prokhorenkova (2020) Aleksei Ustimenko and Liudmila Prokhorenkova. 2020. StochasticRank: Global Optimization of Scale-Free Discrete Functions. In International Conference on Machine Learning. PMLR, 9669–9679.
- Vardasbi et al. (2020a) Ali Vardasbi, Maarten de Rijke, and Ilya Markov. 2020a. Cascade Model-Based Propensity Estimation for Counterfactual Learning to Rank. In Proceedings of the 43rd International ACM SIGIR Conference on Research and Development in Information Retrieval. 2089–2092.
- Vardasbi et al. (2020b) Ali Vardasbi, Harrie Oosterhuis, and Maarten de Rijke. 2020b. When Inverse Propensity Scoring does not Work: Affine Corrections for Unbiased Learning to Rank. In Proceedings of the 28th ACM International Conference on Information and Knowledge Management.
- Wang et al. (2021) Nan Wang, Zhen Qin, Xuanhui Wang, and Hongning Wang. 2021. Non-Clicks Mean Irrelevant? Propensity Ratio Scoring As a Correction. In Proceedings of the 14th ACM International Conference on Web Search and Data Mining. 481–489.
- Wang et al. (2016) Xuanhui Wang, Michael Bendersky, Donald Metzler, and Marc Najork. 2016. Learning to Rank with Selection Bias in Personal Search. In Proceedings of the 39th International ACM SIGIR conference on Research and Development in Information Retrieval. ACM, 115–124.
- Wang et al. (2018a) Xuanhui Wang, Nadav Golbandi, Michael Bendersky, Donald Metzler, and Marc Najork. 2018a. Position Bias Estimation for Unbiased Learning to Rank in Personal Search. In Proceedings of the Eleventh ACM International Conference on Web Search and Data Mining. ACM, 610–618.
- Wang et al. (2018b) Xuanhui Wang, Cheng Li, Nadav Golbandi, Michael Bendersky, and Marc Najork. 2018b. The LambdaLoss Framework for Ranking Metric Optimization. In Proceedings of the 27th ACM International Conference on Information and Knowledge Management. ACM, 1313–1322.
- Williams (1992) Ronald J Williams. 1992. Simple Statistical Gradient-Following Algorithms for Connectionist Reinforcement Learning. Machine Learning 8, 3-4 (1992), 229–256.
- Yan et al. (2022) Le Yan, Zhen Qin, Honglei Zhuang, Xuanhui Wang, Mike Bendersky, and Marc Najork. 2022. Revisiting Two Tower Models for Unbiased Learning to Rank. In Proceedings of the 45th International ACM SIGIR Conference on Research and Development in Information Retrieval (Madrid, Spain) (SIGIR ’22). ACM.
- Yuan et al. (2020) Bowen Yuan, Yaxu Liu, Jui-Yang Hsia, Zhenhua Dong, and Chih-Jen Lin. 2020. Unbiased Ad Click Prediction for Position-Aware Advertising Systems. In Fourteenth ACM Conference on Recommender Systems. 368–377.
- Yue and Joachims (2009) Yisong Yue and Thorsten Joachims. 2009. Interactively Optimizing Information Retrieval Systems as a Dueling Bandits Problem. In Proceedings of the 26th Annual International Conference on Machine Learning. ACM, 1201–1208.
- Zhuang et al. (2021) Honglei Zhuang, Zhen Qin, Xuanhui Wang, Michael Bendersky, Xinyu Qian, Po Hu, and Dan Chary Chen. 2021. Cross-Positional Attention for Debiasing Clicks. In Proceedings of the Web Conference 2021. 788–797.
- Zhuang and Zuccon (2020) Shengyao Zhuang and Guido Zuccon. 2020. Counterfactual Online Learning to Rank. In European Conference on Information Retrieval. Springer, 415–430.