Modelling the ionisation state of Type Ia supernovae in the nebular-phase
Abstract
The nebular spectra of Type Ia supernovae ( 100 days after explosion) consist mainly of emission lines from singly- and doubly-ionised Fe-group nuclei. However, theoretical models for many scenarios predict that non-thermal ionisation leads to multiply-ionised species whose recombination photons ionise and deplete Fe+, resulting in negligible [Fe ii] emission. We investigate a method to determine the collisional excitation conditions from [Fe ii] line ratios independently from the ionisation state and find that it cannot be applied to highly-ionised models due to the influence of recombination cascades on Fe+ level populations. When the ionisation state is artificially lowered, the line ratios (and excitation conditions) are too similar to distinguish between explosion scenarios. We investigate changes to the treatment of non-thermal energy deposition as a way to reconcile over-ionised theoretical models with observations and find that a simple work function approximation provides closer agreement with the data for sub- models than a detailed Spencer-Fano treatment with widely used cross section data. To quantify the magnitude of additional heating processes that would be required to sufficiently reduce ionisation from fast leptons, we artificially boost the rate of energy loss to free electrons. We find that the equivalent of as much as an eight times increase to the plasma loss rate would be needed to reconcile the sub- model with observed spectra. Future studies could distinguish between reductions in the non-thermal ionisation rates and increased recombination rates, such as by clumping.
keywords:
radiative transfer – supernovae: general – white dwarfs – line: formation – atomic processes – methods: numerical1 Introduction
Type Ia supernovae (SNe Ia) have been the subject of intense research for decades, which has often been motivated by their use as precise distance indicators for cosmology (Perlmutter et al., 1999; Riess et al., 1998) and their role in synthesising much of the present-day abundance of Fe-peak nuclei (Nomoto et al., 1984; Matteucci & Greggio, 1986).
While it has long been known that SNe Ia involve the thermonuclear explosion and subsequent unbinding of a carbon-oxygen white dwarf (Hoyle & Fowler, 1960; Bloom et al., 2012), an understanding of the mechanism of explosion, the mass of the white dwarf, and the possible role of a binary companion remain open problems to be solved. Multi-band observations have placed deep upper limits on the density of the surrounding medium and disfavour most scenarios involving a non-degenerate companion (Hancock et al., 2011; Pérez-Torres et al., 2014). Several other scenarios remain, and thanks to theoretical developments in the last decade, we now have a variety of 3D hydrodynamic explosion models available (Röpke & Sim, 2018). These explosion models can be post-processed with detailed nucleosynthesis calculations to obtain a snapshot of the nuclear densities seconds after explosion (Seitenzahl & Townsley, 2017). The simple time evolution of nuclear densities described by radioactive decays and homologous expansion can then be followed by radiative transfer calculations to produce synthetic light curves and spectra for comparison with observations.
1.1 SNe Ia Nebular Spectra
Within seconds of the thermonuclear explosion of a white dwarf, ejected material expands rapidly with velocities of several 103 km s-1, causing the optical depth of the ejecta layers to continuously decrease. Roughly half a year after the explosion, the optical depth in the continuum and in many lines (though there are exceptions, see e.g., Fransson & Jerkstrand, 2015; Wilk et al., 2020) have become so low that most optical and near-infrared photons can freely escape from the ejecta with few interactions. This phase is commonly referred to as the ‘nebular phase’.

During the transition into the nebular phase, the observed spectrum changes from one that is dominated by continuum emission and the superposition of absorption/scattering lines on the continuum to an almost purely line-emission dominated spectrum (see the example in Figure 1). The emission lines originate from regions within the ejecta that are still being heated at these late phases by radioactive decays and thus contain . The outer layers, which are rich in intermediate mass elements or unburnt material, contribute less to the emission, but do produce features of S, Ca, and Ar.
The emission features in nebular spectra are broadened by the expansion velocity of the iron core (maximum extent to km s-1) from which the corresponding lines originate. Emission features have been observed and studied both in the optical and the near-IR (NIR, 3000 Å to 2.5 m).
Singly- and doubly-ionised Fe is responsible for the majority of emission features in the optical and NIR (Figure 1). As the stable decay product of decaying to and, finally, to , Fe is readily abundant in the nebular phase. Its singly- and doubly-ionised ions have a large number of transitions that can be easily excited at the conditions (temperature and electron density) present during the nebular phase. In addition to Fe, Co and Ni are also seen in emission during the nebular phase.
The signature feature in the nebular phase spectrum of an SN Ia is located around 4,700 Å. The feature is created by emission from the 5D–3F multiplet of [Fe iii] (Axelrod, 1980; Kuchner et al., 1994), with a likely contribution from a multitude of weak lines of [Fe ii]. The strength of the 4700 Å [Fe iii] feature with respect to a [Co iii] feature near 5900 Å, originating from the a4F–a2G multiplet, has been used as evidence for radioactive decay of to being the power source of SNe Ia (Kuchner et al., 1994; Childress et al., 2015; Dessart et al., 2014). The feature near 7,200 Å is a blend of mostly [Fe ii] and [Ni ii], with an additional contribution at its blue end from [Co iii] a4F – a4P. A [Ca ii] contribution of 7291, 7324 to this feature was seen in some radiative transfer models but was excluded by observed data (Flörs et al., 2020).
In the NIR, the observed emission originates mostly from [Fe ii], [Co ii] and [Ni ii]. It has been shown that the emission of [Co ii] relative to that of [Fe ii] declines as is expected from radioactive decay of (Spyromilio et al., 2004; Flörs et al., 2018; Flörs et al., 2020). The relative strength of the [Ni ii] features in the optical and NIR is given just by the transition rates of the involved lines (see Flörs et al., 2020).
1.2 Theoretical challenges
One of the main candidates for Type Ia progenitors is a white dwarf with a mass well below the Chandrasekhar-mass limit, known as the sub- channel. The burning of a sub- white dwarf must proceed supersonically (by detonation) in order to synthesise the required abundances of intermediate-mass and Fe-peak nuclei (Shigeyama et al., 1992; Sim et al., 2010; Shen et al., 2018; Gronow et al., 2020). This channel is often contrasted with the near- (sometimes shortened to ) channel, in which a white dwarf accretes material until its mass approaches the Chandrasekhar-limit and carbon fusion is ignited.
Among promising evidence for sub- progenitors, Flörs et al. (2020) use a semi-empirical method to work backwards from time-series spectra and infer Ni/Fe ratios that favour sub- over near- explosion models. However, modern radiative transfer studies of the same or similar, sub- and near- explosion models do not clearly favour sub- channel on the basis of predicted nebular spectra. It is therefore a major challenge for theorists to reconcile the opposite conclusions arrived at by the different approaches.
The semi-empirical approaches tend to focus on emission line ratios, such as between optical and NIR lines of [Fe ii], or between an [Fe ii] line and a [Ni ii] line. These quantities are chosen since the unknown ionisation state either cancels out (for two lines of the same ion, e.g., Flörs et al., 2020) or is assumed to be the same for different Fe-group elements, Fe, Co, and Ni, (as in Maguire et al., 2018; Flörs et al., 2018; Flörs et al., 2020). These assumptions are supported by similar ionisation energies of the relevant ionisation states (but see Blondin et al. 2021 and our Figure 3 for differences between Ni+/Ni and Fe+/Fe) and spatially co-located Fe-group material, as is evident from the widths and shifts of the lines. These line ratio analyses favour sub- models mainly from abundance arguments: i.e., the relative strength of [Fe ii] to [Ni ii], and that is the main basis for their conclusions.
The forward-modelling approach, on the other hand, attempts to calculate a full spectrum from the conditions in the hydrodynamic explosion model, and that depends on the accurately modelling the full plasma state, such as the temperatures, ionisation and excitation conditions.
With the forward approach, the sub- models produce spectra that are clearly discrepant with the data. For example, Wilk et al. (2018) find that their model spectra exhibit [Fe iii] 4658 features that are too strong compared to other optical/NIR features, such as [Fe ii] lines. The main issue is that the relative strength of different ionisation states (e.g. [Fe iii] / [Fe ii]) is wrong. This issue is more problematic for the sub- models because the high abundance throughout the core means that they are relatively highly ionised throughout the Fe-rich regions.
The nebular radiative transfer simulations of Shingles et al. (2020) for sub- models are also discrepant with observations in a similar sense to Wilk et al. (2018), with relative weakness of [Fe ii] and [Ni ii] emission in the synthetic spectra.
To reduce the ionisation state of sub- models, Wilk et al. (2020) examine the use of a clumping factor. This increases the local density, and hence the rates of collisional processes, such as recombination. Clumping can reduce the [Fe iii]/[Fe ii] ratio toward the level of observations. However, the low abundance in their sub- model prevents a 1.939 m feature from forming, while for their near--models, the [Ca ii] 7291, 7324 feature becomes stronger than even the [Fe ii] , in conflict with observations.
The clumping result leads us to ask whether there could be any changes to the radiative transfer physics that would reduce the ionisation of the Fe-group in a targeted way without causing additional discrepancies. The fact that the ionisation and excitation states of distinct elements respond differently to clumping offers the hope of narrowing down possible causes of too-weak [Fe ii] emission by preferring candidates that improve the fit of spectral features from several different elements simultaneously. We justify this with the assumption that our models are approximately correct, and therefore the simplest solution to the discrepancy is more likely to be correct than a combination of several separate modelling problems.
Blondin et al. (2021) experiment with manually adjusting the Ni2+/Ni+ ratio to match observed [Ni ii] features, either by boosting the ratio for a near- model or reducing the ionisation state of a sub- model. As possible physical explanations for the ionisation state discrepancy, Blondin et al. (2021) consider clumping, as well as incorrect hydrodynamical model predictions of the densities and composition profiles.
The composition and densities of an explosion model affect the resulting ionisation state without changes to the radiation transfer method and ionisation treatment. Shingles et al. (2020) find a good agreement with Type Ia observations with the near- W7 spherically-symmetric fast-deflagration model, which produces strong emission by [Fe ii]. In this model, a core of stable 54,56Fe and 58Ni (i.e., no ) is heated non-locally, leading to the low ionisation state and moderate temperature needed for substantial [Fe ii] emission. However, while the fit to observations is interesting, the parameterised W7 model with a core devoid of radioactive material is unlike the predictions of sophisticated hydrodynamical simulations. In multi-dimensional delayed-detonation models, buoyancy mixing results in being co-located with stable Fe-group material (Seitenzahl et al., 2013, 2014). In the case of a gravitationally-confined detonation, stable material is produced but at high velocities rather than in the centre (Seitenzahl et al., 2016). In this work, we search for potential errors with the radiative transfer method that could cause the ionisation problem in the case that the most-sophisticated explosion models are approximately correct.
We explore the origin of the discrepancy between conclusions drawn from forward modelling of radiative transfer for a small set of multi-zone explosion models and those of semi-empirical analyses of observed spectra (e.g., Flörs et al., 2020). We aim to quantify the possibility that this discrepancy is mainly due to the sensitivity of synthetic spectra to the theoretically-predicted ionisation state and hence the rates of ionisation and recombination, while semi-empirical analyses concentrate on mass ratios that are inferred from singly-ionised line fluxes and statistical equilibrium solutions that neglect bound-free processes. We investigate the sensitivity of the observable line ratios and spectra to various treatments of the non-thermal deposition, and also test the validity of using one-zone approximations for modelling nebular emission lines, and the collisional-radiative approximation for calculating NLTE (Non-Local Thermodynamic Equilibrium) populations.
1.3 Non-thermal ionisation
In Type Ia supernovae at late times, the thermalisation of decay products (mostly gamma-rays and from decays) is no longer efficient due to the low density and ionisation state of the ejecta. This leads to a population of fast leptons (electrons and positrons) with non-thermally distributed energies. Importantly, the impact ionisation by the non-thermal leptons overtakes photoionisation for most ions in the nebular phase. However, impact ionisation competes with two other processes by which the leptons lose energy – exciting bound electrons and interacting with the slower thermally-distributed electrons. The thermal losses make up the vast majority (at least 85 per cent) of the non-thermal deposited energy.
Axelrod (1980) performed approximate calculations in the high-energy limit, estimating that about three per cent of the deposited energy contributes to ionisation in the conditions of nebular-phase Type Ia supernovae. However, using currently-available atomic data with the detailed treatment of non-thermal deposition by Kozma & Fransson (1992), in which the Spencer-Fano equation (Spencer & Fano, 1954) is solved numerically, leads to a significantly larger fraction of the deposited energy causing ionisation. For the models of Shingles et al. (2020), the ionisation fraction can be as high as 15 per cent. The increased non-thermal ionisation rates, and consequent increase in photoionisation due to recombination photons from highly-charged (Fe3+ and Fe4+) ions, have a dramatic affect on the predicted nebular spectra of sub- models (Shingles et al., 2020). Fe+ is efficiently ionised to Fe2+, which prevents formation of the strong [Fe ii] emission features that are observed in all nebular Type Ia spectra.
The large difference in the fraction of deposition going to ionisation between the two methods exists despite similar ionisation cross sections (<10 per cent difference at 1.0 keV) for Fe between the Lotz (1967) formula used by Axelrod (1980) and the Arnaud & Raymond (1992) formula fit (adopted by all known implementations of the Kozma & Fransson (1992) method).
Although the Axelrod (1980) calculations are approximate, and do not consider further ionisation by secondary electrons, another source of the ionisation fraction difference is the use of a total bound-electron loss rate, for which the Bethe approximation is used. The total bound-electron loss rate used by Axelrod (1980) is greater than the summation of impact ionisation and non-thermal excitation cross sections and their transition energies that we, and other groups, use. The rate of energy loss to bound electrons can be up to a factor of two to four times higher using some form of the Bethe equation compared to a calculation of impact ionisation cross sections of Fe+ and average energy loss of the primary electrons. See Appendix C for details.
The Axelrod (1980) method has no strict requirement that the sum of individual ionisation and excitation transitions are consistent with the total atomic loss rate. Any physical process that is implicitly counted in the total atomic loss rate, but not directly counted as an ionisation or excitation transition, contributes to the heating fraction. In contrast, a Spencer-Fano solution like Kozma & Fransson (1992) does not take a total bound-electron loss rate as input, so every physical processes must be individually accounted for with a cross section in order to affect the electron degradation outcome.
The Kozma & Fransson (1992) method has been successfully applied in the context of core-collapse supernova ejecta, which are mostly neutral with only a small fraction of singly-ionised material. The same implementation was also used by Jerkstrand et al. (2015) to obtain spectra in reasonable agreement with nebular SN Ia observations from the W7 model. However, this was achieved without the contribution from ions that are triply-ionised and above. While for W7 this makes a subtle difference to the spectrum (see figure 5 of Shingles et al., 2020), the consequences for sub- models are severe. The presence of recombination photons from Fe3+ and Fe4+ lead to a substantial increase in the photoionisation rate of Fe+ (Shingles et al., 2020).
A similar implementation of the Spencer-Fano solver in cmfgen (Li et al., 2012) with the same ionisation cross sections (Arnaud & Rothenflug, 1985; Arnaud & Raymond, 1992) results in over-ionised ejecta for sub- models (Wilk et al., 2018). Directly comparing cmfgen and artis with identical explosion models finds good agreement for both the nebular spectra and ion fractions (Blondin et al. in prep).
The Kozma & Fransson (1992) method is widely considered to be the best-available treatment of non-thermal deposition for Type Ia models. The synthetic Type Ia nebular spectra calculated with the Kozma & Fransson (1992) method have never been directly compared against those that use the Axelrod (1980) approximation with all other modelling details held constant, and little investigation has been done into the uncertainties of using the Kozma & Fransson (1992) method under Type Ia conditions with the widely-used electron-impact ionisation cross sections of Arnaud & Rothenflug (1985) and Arnaud & Raymond (1992).
The simple Axelrod (1980) method is rarely used in recent Type Ia models, but it is applied in recent models of kilonovae, which are the electromagnetic counterparts of Neutron-Star Mergers (NSM). For example, Hotokezaka et al. (2021) present NSM models and use the Axelrod (1980) method, stating that a Kozma & Fransson (1992) treatment would improve the accuracy of their results (presumably on the basis that the Kozma & Fransson (1992) method is widely used in Type Ia models).
The first kilonova model with a Kozma & Fransson (1992) treatment of non-thermal ionisation is that of Pognan et al. (2021). However, in the absence of exerimental data, their applied impact ionisation cross sections are merely approximated. Alternative non-thermal ionisation treatments are not directly compared, and the validity of the calculations made using a Spencer-Fano approach with theoretical cross-sections is not tested.
Other NSM models in the literature that do not apply the Axelrod (1980) or Kozma & Fransson (1992) methods depend on a total stopping power formula in order to model the thermalisation of fast electrons from -decays (e.g., Hotokezaka & Nakar, 2020). The thermalisation efficiency results of Barnes et al. (2016), and studies that apply these analytic fits (e.g., Kasen et al., 2017; Wollaeger et al., 2018) rely on a formula for the total energy loss rate (Heitler, 1954; Berger & Seltzer, 1964; Chan & Lingenfelter, 1993; Milne et al., 1999). Since the total stopping powers are either directly experimentally measured, or at least calibrated against stopping power measurements for other particles (e.g., NIST ESTAR database Berger et al., 2017), these quantities are expected to be reliably determined.
Future progress in producing accurate synthetic nebular spectra for kilonovae will require a detailed understanding of the non-thermal processes, and should be informed by studies into the accuracy of the Kozma & Fransson (1992) method when implemented with the widely-used atomic data and approximations.
In this study, we directly compare the predicted nebular spectra for Type Ia models that result from applying either the Axelrod (1980) limit, or the Kozma & Fransson (1992) detailed Spencer-Fano solution. We investigate the consequences of a possible underestimation of the heating contribution from fast leptons in a Spencer-Fano solution by artificially boosting the plasma loss rate. This provides a single parameter that can transfer energy from the fast lepton population to the (already-dominant) thermal heating and reduce the non-thermal ionisation rates.
2 Models and Method
In this section, we describe the numerical methods and numerical test cases used to investigate the sensitivity of the nebular spectra and spectral line ratios to the non-thermal ionisation treatment, NLTE method, and the one-zone assumption used in semi-empirical method.
2.1 Sub- detonation and W7 near- explosion models
We use the Shen et al. (2018) model of the detonation of a 1.0 white dwarf of Solar metallicity with an equal abundance of carbon and oxygen. This explosion model is very similar to the S0 model of Shingles et al. (2020), and therefore artis radiative transfer calculations produce similar optical and near-infrared spectra as for S0 (notably lacking [Fe ii] emission). For reference, we include results from the same radiative transfer simulation of the W7 explosion model (Nomoto et al., 1984; Iwamoto et al., 1999) that was published by Shingles et al. (2020).
| Synthesised mass | |||
| Model | |||
| W7 | 0.59 | 9.5 | 11.0 |
| sub- | 0.54 | 2.3 | 1.5 |
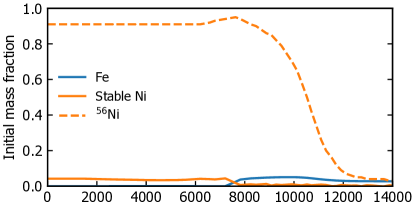
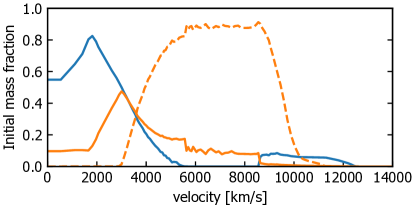
Figure 2 shows the post-explosion composition that is evolved by the artis code according to radioactive decay and homologous expansion for use in the spectral synthesis calculation.
2.2 Radiative transfer modelling
We model radiative transfer in SNe Ia using artis 111https://github.com/artis-mcrt/artis/, a Monte Carlo radiative transfer code that uses indivisible energy packets (Lucy, 2002). The code has been described by Sim (2007) and Kromer & Sim (2009) (see also Lucy, 2005, for a description of the method). We use the latest version with NLTE enhancements described by Shingles et al. (2020), which include deposition by non-thermal electrons, NLTE ionisation balance and level populations, detailed bound-free photoionisation estimators (using full packet trajectories as per equation 44 of Lucy, 2003) for all photoionisation transitions, and an NLTE binned radiation field model for excitation transitions.
2.3 Non-thermal ionisation test cases
As mentioned in Section 1.3, the Kozma & Fransson (1992) solution to the Spencer-Fano equation results in a lower heating fraction, and higher ionisation rates than the Axelrod (1980) high-energy limit approximation.
We directly compare the two methods with our ‘AxelrodNT’ models, which replace the Spencer-Fano solution with the Axelrod (1980) work function approximation for non-thermal ionisation rates, and contribute 97 per cent of the energy deposited from gamma rays and positrons to heating.
We also experiment with sub- models (heatboost4 and heatboost8) that have boost factors of four or eight applied to the plasma loss rate (Schunk & Hays, 1971; Kozma & Fransson, 1992) that accounts for Coulomb scattering of fast leptons by free (thermal) electrons. Increasing the assumed interaction strength between fast electrons and thermal electrons leaves less energy remaining for the collisional ionisation, shifting the Spencer-Fano solution in the direction toward the high (97 per cent) heating fraction of the Axelrod (1980) method. We stress that applying such a boost factor is not physically motivated but rather provides a convenient means to illustrate how changes in the deposition treatment affect the simulations.
2.4 Parameterised model
The empirical analysis of Flörs et al. (2018); Flörs et al. (2020) makes use of a simplified model for the emission of the ejecta. In order to test assumptions of this approach, we aim to compare its predictions for key atomic level populations and line ratios to the artis results.
The Flörs model does not explicitly solve for the plasma conditions of the ejecta (ionisation state, electron temperature and free electron density), but rather treats them as free parameters. By using the artis plasma state solution as input for the simplified model, we will compare the results of the two NLTE population solutions. The Flörs et al. (2020) NLTE solution includes only bound-bound collisional and bound-bound downward radiative rates, i.e., in contrast to artis, the Flörs model does not include radiative excitation, photoionisation or recombination transitions.
The energy source for excitation processes is characterised by a Boltzmann distribution of temperature and a free electron density . In the simplified model, radiative transfer effects apart from self-absorption in the line of interest are ignored. Furthermore, non-thermal effects from the slowing-down of high-energy electrons, charge exchange reactions, and time-dependent terms in the NLTE rate equations are not included. While sanity checks for the emitted radiation are included (e.g. the model cannot emit more radiation than is being produced through radioactive decay of ), the detailed energy deposition processes are not treated. As a result, the model is unable to provide the emitted radiation over all wavelengths, but only for certain lines in the optical and NIR.
To compute absolute level populations of the Fe-group ions, we use the ionisation balance from the artis code, since the empirical approach does not involve a direct estimation of the ion population. Level populations within each ion, however, are computed with the code presented by Flörs et al. (2018); Flörs et al. (2020).
To facilitate a comparison with the artis code we changed the atomic data from the sources given in Flörs et al. (2020) to the CMFGEN database that is used by the artis code. The same Fe+ atomic data of Nahar & Pradhan (1994) are used in all cases. As a result, we can exclude differences in the atomic data as the reason for any difference in findings between this simplified model and the full radiative transfer simulations. Overall, the use of different atomic data sources only leads to subtle differences in the extracted quantities.
3 Results
We present the results from our radiative transfer models for the W7 and sub- explosions with several test cases for the non-thermal ionisation treatment. Throughout this section, we compare results with those obtained from the simplified model approach of Section 2.4, and, where appropriate, also with observations of the normal Type Ia supernovae SN 2013ct.
In Section 3.1, we present the internal conditions of the sub- model and changes in the heatboost4 test case. We then look at changes to emission spectra of individual ions in Section 3.2. In Section 3.3, we compare the synthetic spectra of W7 and sub- models using various non-thermal ionisation treatments against observations. In Section 3.4, we measure the ratios between the [Fe ii] and , lines in our synthetic spectra for comparison to the semi-empirical trend line of Flörs et al. (2020). In Section 3.5, we check the accuracy of using line ratios to infer a single emitting plasma state by using the known emission conditions in our theoretical models.
3.1 Structure of the sub- model
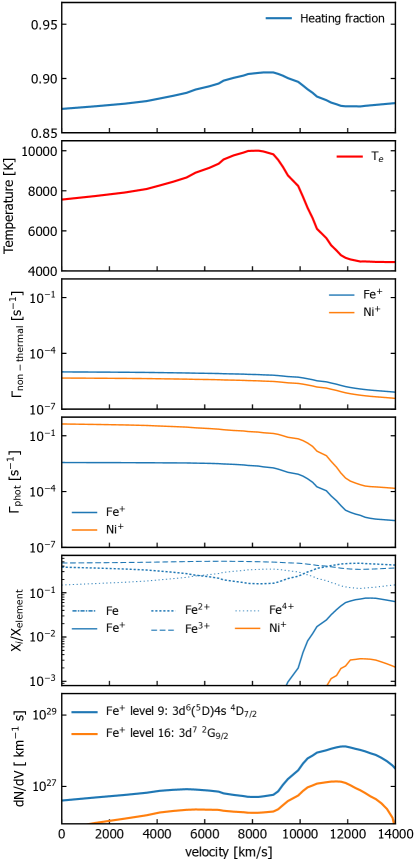
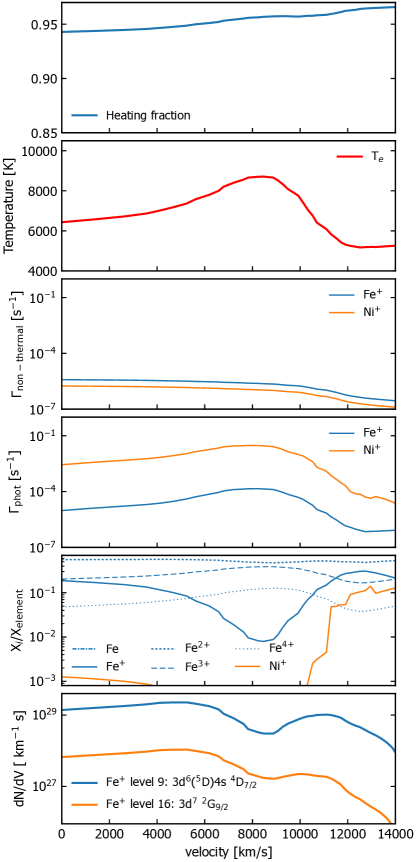
As shown in Figure 3, the standard artis calculation predicts that between 86 and 91 per cent of the energy deposited by non-thermal particles contributes to the heating of the thermal electrons throughout the model at a typical nebular phase (shown here for 247 days post explosion). In its dense inner regions, the thermal electron temperature of the sub- model is between 7000 and 10000 K and Fe is mainly ionised to the third and fourth stages (Fe2+ and Fe3+, see third panels in Figure 3). Some Fe+ is present, but only in the low-density outer layers, which are significantly cooler (approximately 4000 K).
Comparison of the left and right panels in Figure 3 shows that there are very important differences in the simulation if the electron-loss rate is boosted by a factor of four. First, as shown in the top panels, the fraction of energy that goes to heating increases, although only by per cent, which may seem relatively modest. The electron temperature (second row of Figure 3) also changes – typically by about 2000 K, and typically the electron temperature drops despite the heating rate having increased. The reason for this drop in temperature can be understood from consideration of the ionisation fractions, as shown in the fifth row of Figure 3. With the boosted electron-loss function, a substantial amount of Fe+ is present close to the centre and decreasing to a minimum of approximately one per cent at around 8500 km/s. This significantly increases the cooling rate in most of the model, leading to an overall reduction in temperature for most zones.
The reason for the increase in Fe+ abundance in the heatboost case with reduced non-thermal ionisation is not trivial and involves photoionisation. As found by Shingles et al. (2020) for a similar sub- model S0, we also find that the photoionisation rate of Fe+ far exceeds the non-thermal ionisation rate in our sub- model (see and in Figure 3). For example, at 247 days in the shell at 10,000 km/s, the photoionisation rate of Fe+ is more than one hundred times higher than its non-thermal ionisation rate. Therefore, decreasing only the non-thermal ionisation rate of Fe+ would have a negligible effect on the Fe+ fraction. Instead, a reduction in the non-thermal ionisation rates (by a factor of 2.9 for heatboost4 and 4.9 for heatboost8) affects ionisation of Fe2+ and Fe3+ (which are not photoionisation-dominated) and decreases the abundances of higher ionisation stages. With fewer Fe3+ and Fe4+ ions to recombine, there are fewer ionising photons captured by Fe+, which reduces the photoionisation rate and increases the abundance of Fe+.
The significant change in the ionisation conditions in the heatboost models naturally also affects the strength of the resulting spectral lines. To illustrate this, in the lower panels, we show the level densities (per velocity interval) of the upper levels of the [Fe ii] (a6Da4D7/2) and , (a4Fa2G9/2) lines. Here, we note that the factor of four change in the loss function has altered these populations by more than an order of magnitude in much of the model and also fundamentally changed the relative importance of different regions of the model for emission of the two lines.
3.2 Ion emission spectra
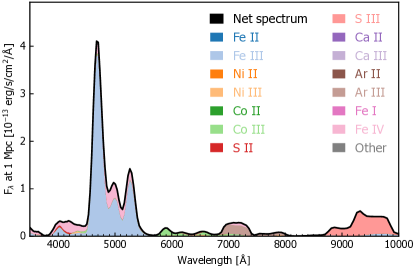
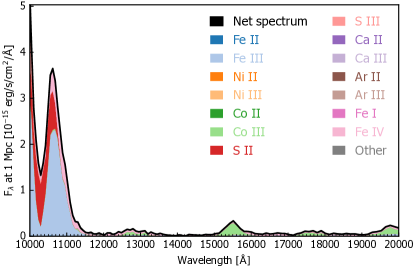
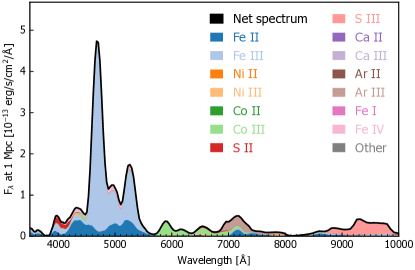
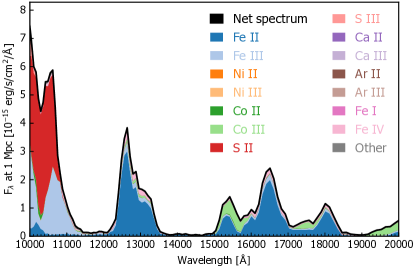
Figure 4 and Figure 5 show the nebular emission spectra coloured by the emitting ion for the sub- standard, and sub- heatboost4 models, respectively.
The sub- model produces virtually no [Fe ii] emission features, which is most apparent in the infrared region (wavelength above 12000 Å), where few other emission features are found in SNe Ia nebular spectra. The heatboost models increase the [Fe ii] line strengths to a comparable level to the W7 model (Shingles et al., 2020) due to the decrease in ionisation state. The increases in [Fe ii] line strengths are also seen in the optical region, but the difference is less clear there due to the presence of strong lines of other ions.
The [Ni ii] 1.939 m line is strong for the W7 model due to the high abundances of in the core, while very little is produced in the sub- explosion model, so the reduction in the ionisation state for the heatboost model is not sufficient to produce a detectable Ni ii feature.
3.3 Synthetic spectra and observations
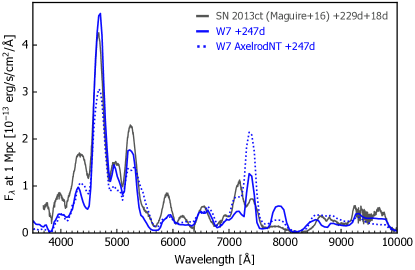
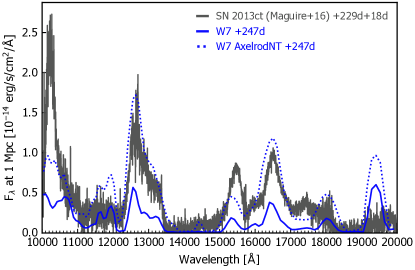
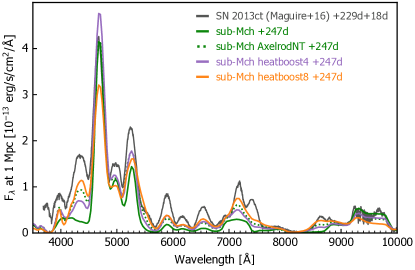
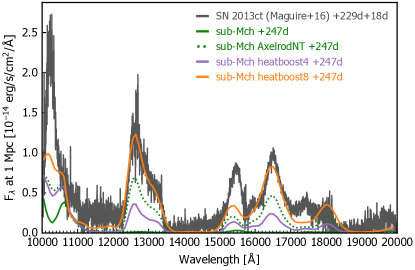
Figure 6 shows the optical and near-IR synthetic spectra at 247 days for the W7 (Nomoto et al., 1984; Iwamoto et al., 1999) and sub- (Shen et al., 2018) models, with observed spectra from the normal Type Ia SN 2013ct (Maguire et al., 2016).
In the upper panels of Figure 6, the W7 models with either the Spencer-Fano solution or Axelrod (1980) non-thermal treatments are shown with observations. As described by Shingles et al. (2020), the artis W7 model shows significant [Fe ii] emission that is still weaker than SN 2013ct, a comparison most easily made in the infrared. When the AxelrodNT treatment is applied, the [Fe ii] lines are brought up to a similar strength as the observed spectrum, while the optical [Fe ii] and [Fe iii] features become too weak (but possibly with a more accurate ratio between the two ion stages). An anomalous feature in the W7 model around 12000 Å is made further discrepant with the observed spectrum in the AxelrodNT case, and the too-strong [Ni ii] emission features are made even stronger. Overall, the AxelrodNT treatment makes the fit between the W7 and SN 2013ct slightly worse.
In the lower panels of Figure 6, the sub- models with Spencer-Fano standard case, AxelrodNT, heatboost4, and heatboost8 are compared with SN 2013ct. The most striking transition between the standard model and all other non-thermal cases is the emergence of detectable [Fe ii] emission. In order of decreasing ionisation state are the heatboost4, AxelrodNT, and heatboost8 models. All of these alternative cases dramatically improve the agreement with data, particularly in the infrared, as well as the optical feature around 4300 Å.
In summary, any of our methods to reduce the ionisation state of the sub- models dramatically improve the fit to the observed Type Ia spectrum in a similar way.
3.4 Line ratios and level populations
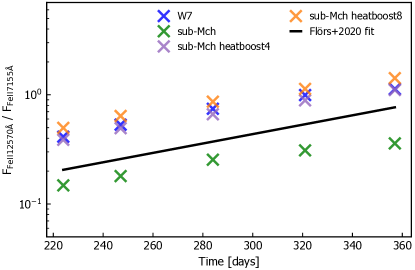
In the semi-empirical modelling approach of Flörs et al. (2020), the flux ratio between the [Fe ii] and lines is measured for a sample of normal Type Ia SNe at a range of epochs, which probes the evolution of excitation conditions over time. Here, we calculate the same line ratios from the artis synthetic spectra of our models to test the W7 and sub- models against observations.
In Figure 7, we show the [Fe ii] infrared-to-optical line ratios of our models, and the empirical fit relation of Flörs et al. (2020). All models are close to a factor of two either above or below the empirical ratio. We find that the flux ratios are low (less IR flux) for the sub- model, while the W7, sub- heatboost4, and sub- heatboost8 models are similar and above the empirical ratio. Aside from the offset, the slope of line ratio versus time is highly consistent with the empirical trend line.
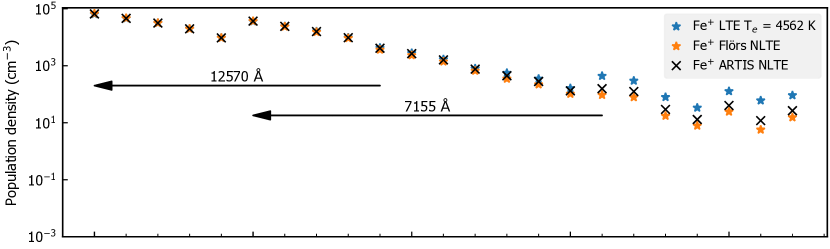
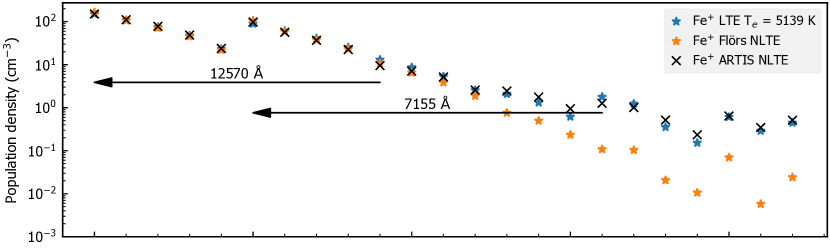
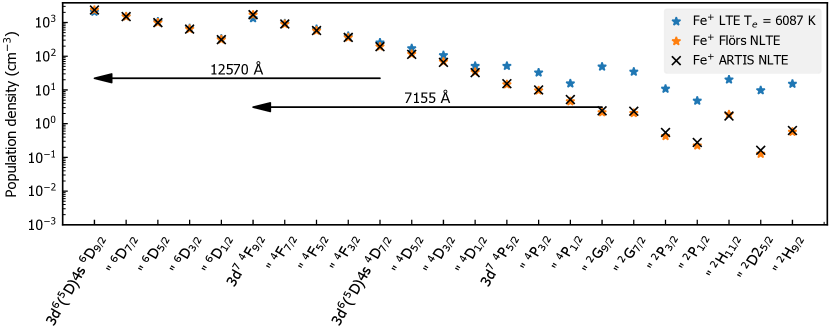
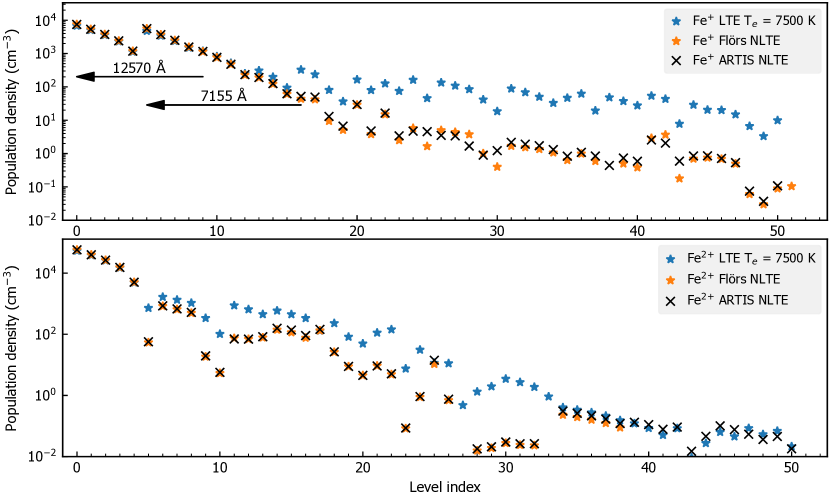
To explain why the line ratio of the sub- model falls below the empirical line, while the other models are very similar and above it, we look to the level populations of Fe+. Figure 8 shows the NLTE level populations of Fe+ at 247 days in a radial zone near the peak of [Fe ii] emission for the W7, sub-, and sub- heatboost8 models. We show the artis NLTE populations, LTE populations at the same temperature, and NLTE populations from the Flörs et al. (2020) code (described in Section 2.4) using the artis parameters for electron temperature, free electron density, and ion population.
For the W7 and sub- heatboost8 models, which produce significant emission from [Fe ii], the level populations agree to high precision (<10 per cent difference) between the artis and Flörs et al. (2020) calculations. This indicates that radiative excitation, photoionisation, and recombination are not important processes for setting the Fe+ level population ratios in those models.
For the sub- model without heatboost, the population of the upper level of [Fe ii] which is the 16th excited state, 3d7 a2G9/2, is roughly 100 times higher in the artis model than predicted from the simplified model of Flörs et al. (2020), and is close to the LTE population. When the Fe+/Fe2+ ratio is very small as it is in this model, the 16th excited level population becomes strongly affected by recombination cascades from Fe2+.
In the absence of these results, we might have expected that the [Fe ii] line ratios would be independent of the ionisation balance, since we are considering the conditions under which [Fe ii] lines are emitted, rather than the overall strength of the lines, which is weak in the case of sub- models with high ionisation states. However, using the line ratios as a diagnostic of time evolution of excitation conditions requires us to have enough Fe+ present that its bound-bound processes are much faster than the rate of recombination from Fe2+. The presence of strong [Fe ii] emission in observed nebular spectra for Type Ia SNe indicates that this regime is the one found in nature, but we are not able to factor out the ionisation state of the highly-ionised sub- model and still compare the Fe+ excitation conditions to the observations. Using sub- heatboost8 model, which has a similar temperature structure to the model with no heatboost, is one way to compare the sub- model to the observations by bringing the ionisation state toward a more realistic level and avoiding the recombination-cascade effects on the line ratios. However, neither the W7 and sub- heatboost8 model is favoured on the basis of their match to empirical infrared-to-optical line ratios because they are too high by a very similar factor (Figure 7). This shows that the semi-empirical method to understand the excitation state of Fe is not a strong discriminant between the different explosion models that do produce [Fe ii] emission features.
3.5 Line-emitting conditions and one-zone approximation
In the analysis of observed spectra, most studies adopt a one-zone approximation, assuming that the line emissions are well-characterised by some value for the electron density and the electron temperature. In contrast, sophisticated radiative transfer models form emission lines from the contributions of multiple zones. Here we test the validity of the one-zone assumption by measuring the range of conditions under which the [Fe ii] lines are formed in our models.
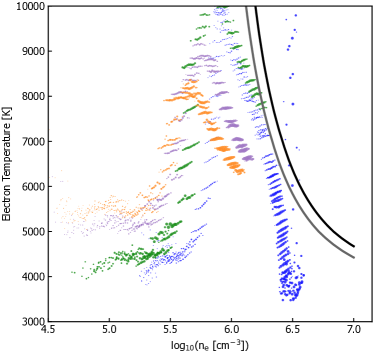
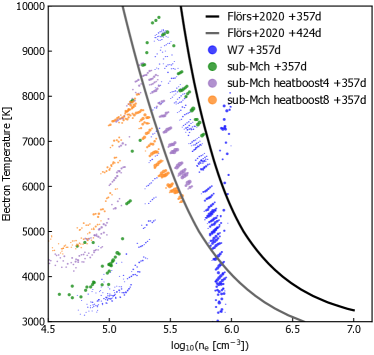
In Figure 9, we plot the model shells as points in the temperature versus electron density plane with an area proportional to the outgoing flux in the [Fe ii] and lines. For comparison to the models, Figure 9 also shows the empirically-derived Flörs et al. (2020) curve that would be required for a one-zone, collisional-radiative NLTE model to match the [Fe ii] infrared-to-optical line ratio. There is a degeneracy between the two parameters, because they both scale up or down the rates of collisional transitions. It can be seen by comparison to the Flörs et al. (2020) curves that the line-forming regions of our models are systematically either lower temperatures, lower densities, or both.
Even though Figure 7 suggests that the physical conditions in -T space can lie on either side of the empirical relation (see black line in Fig. 9), all of the models we investigated exhibit temperatures and electron densities below this curve. While in the case of the W7 and the heatboost sub- model, the temperature and free electron density are lower than what is expected from the analysis of observed SNe Ia. The result for the standard sub- model is a direct consequence of the fact that the Fe+ upper level of [Fe ii] is boosted by recombination of Fe2+, thus increasing the strength of this transition relative to the unaffected line.
4 Discussion and Conclusions
We have investigated the discrepancy between conclusions reached about the progenitors of Type Ia SNe from semi-empirical analyses of Type Ia nebular spectra, and forward modelling of theoretical explosion simulations.
We have showed that the ratios of [Fe ii] lines are not always completely independent from the overall flux of [Fe ii] and the ionisation balance. Specifically, when the Fe+/Fe2+ ratio is very small, the level populations of Fe+ become strongly affected by the recombination cascades. This fact prevents the line ratios of singly-ionised species from being used as an independent diagnostic of explosion models that are too highly ionised. Therefore, meaningfully constraining the progenitor problem of Type Ia SNe will require us to understand how to accurately model the ionisation state under the relevant ejecta conditions.
In agreement with Wilk et al. (2020), we have shown that the ionisation state is a major factor that determines the overall goodness-of-fit between synthetic nebular spectra from hydrodynamical explosion models and the observed data. Using what is widely-considered to be the most accurate treatment of non-thermal ionisation, solving the Spencer-Fano equation with the best-available cross sections, leads to the conclusion that sub- models are too highly ionised to reproduce the [Fe ii]-dominated spectra of observed Type Ia SNe at late times. Reducing the ionisation state by reducing the non-thermal ionisation rates leads to better agreement with the data for the sub- model, but no physical justification for reducing these rates has yet been found.
Our parameter exploration is not a physical explanation for the modelled ionisation state being too high. Our method is to alter one numerical parameter with the effect of decreasing the non-thermal ionisation rate by directing the non-thermal energy toward heating. A candidate physical process that could also have the effect of reducing the ionisation state is clumping, as discussed in the context of Type Ia SNe by Wilk et al. (2020). Clumping leads to increased recombination rates, which reduces the ionisation state. However, increased clumping can have secondary effects, such as causing anomalously high emission from [Ca ii] in near- models that assume a constant clumping factor throughout the ejecta (Wilk et al., 2020). It is unclear if reducing the non-thermal ionisation rates would avoid such anomalous features. It is plausible that reducing the non-thermal ionisation rates might lead to different spectra compared to effectively boosting the recombination rates, such as by clumping. This is because the ionisation rates of some ions are dominated by photoionisation, so they would be only weakly affected by changes to the non-thermal ionisation rate, while changes to recombination rate affect all ions. There are also consequences for the photoionisation rates that are difficult to predict in advance, because they are linked with the recombinations of other ions.
One strategy to disentangle reduced non-thermal ionisation rates from clumping would be to make a time-series analysis of ionisation state in comparison to observed SNe Ia. This is because the influence of non-thermal ionisation on the ionisation state only becomes important around several tens of days after explosion, as the rates of photoionisation decline with the expanding and cooling ejecta. In contrast, increasing the recombination rates, such as by clumping, would decrease the ionisation state at all times, including the very early times.
Further research into the effects of clumping and possible improvements to the non-thermal ionisation accuracy will be needed to see if a single model can accurately reproduce the ionisation state of all elements that affect the nebular spectra of Type Ia supernovae. This work will also contribute to advancements in kilonova modelling.
Acknowledgements
The authors thank D. John Hillier for making the cmfgen atomic data set publicly available.
SS and LS acknowledge support from STFC through grant, ST/P000312/1. LS and AF acknowledge support by the European Research Council (ERC) under the European Union’s Horizon 2020 research and innovation program (ERC Advanced Grant KILONOVA No. 885281). CC acknowledges support by the European Research Council (ERC) under the European Union’s Horizon 2020 research and innovation program under grant agreement No. 759253. KJS is supported by NASA through the Astrophysics Theory Program (NNX17AG28G).
The work was supported through computational resources at Forschungszentrum Jülich via project HMU14.
This research was undertaken with the assistance of resources, in particular the UNSW Merit Allocation Scheme and the Flagship Allocation Scheme, from the National Computational Infrastructure (NCI), which is supported by the Australian Government.
This work was performed using the Cambridge Service for Data Driven Discovery (CSD3), part of which is operated by the University of Cambridge Research Computing on behalf of the STFC DiRAC HPC Facility (www.dirac.ac.uk). The DiRAC component of CSD3 was funded by BEIS capital funding via STFC capital grants ST/P002307/1 and ST/R002452/1 and STFC operations grant ST/R00689X/1. DiRAC is part of the National e-Infrastructure.
This research has made use of NASA’s Astrophysics Data System. Figures in this work have been generated with the matplotlib package (Hunter, 2007) and artistools222https://github.com/artis-mcrt/artistools/.
Data availability
The data underlying this article will be shared on reasonable request to the corresponding author.
References
- Arnaud & Raymond (1992) Arnaud M., Raymond J., 1992, ApJ, 398, 394
- Arnaud & Rothenflug (1985) Arnaud M., Rothenflug R., 1985, A&AS, 60, 425
- Axelrod (1980) Axelrod T. S., 1980, PhD thesis, University of California, Santa Cruz
- Barnes et al. (2016) Barnes J., Kasen D., Wu M.-R., Martinez-Pinedo G., 2016, The Astrophysical Journal, 829, 110
- Berger & Seltzer (1964) Berger M. J., Seltzer S. M., 1964, NASA Special Publication, 3012
- Berger et al. (2017) Berger M. J., Coursey J. S., Zucker M. A., Chang J., 2017, Estar
- Blondin et al. (2021) Blondin S., Bravo E., Timmes F. X., Dessart L., Hillier D. J., 2021, arXiv, p. arXiv:2109.13840
- Bloom et al. (2012) Bloom J. S., et al., 2012, ApJL, 744, L17
- Chan & Lingenfelter (1993) Chan K.-W., Lingenfelter R. E., 1993, ApJ, 405, 614
- Childress et al. (2015) Childress M. J., et al., 2015, MNRAS, 454, 3816
- Dessart et al. (2014) Dessart L., Hillier D. J., Blondin S., Khokhlov A., 2014, MNRAS, 439, 3114
- Flörs et al. (2018) Flörs A., Spyromilio J., Maguire K., Taubenberger S., Kerzendorf W. E., Dhawan S., 2018, A&A, 620, A200
- Flörs et al. (2020) Flörs A., et al., 2020, Monthly Notices of the Royal Astronomical Society, 491, 2902
- Fransson & Jerkstrand (2015) Fransson C., Jerkstrand A., 2015, ApJL, 814, L2
- Ganeshalingam et al. (2011) Ganeshalingam M., Li W., Filippenko A. V., 2011, Monthly Notices of the Royal Astronomical Society, 416, 2607
- Gronow et al. (2020) Gronow S., Collins C., Ohlmann S. T., Pakmor R., Kromer M., Seitenzahl I. R., Sim S. A., Röpke F. K., 2020, A&A, 635, A169
- Hancock et al. (2011) Hancock P. J., Gaensler B. M., Murphy T., 2011, The Astrophysical Journal, 735, L35
- Heitler (1954) Heitler W., 1954, International Series of Monographs on Physics
- Hotokezaka & Nakar (2020) Hotokezaka K., Nakar E., 2020, The Astrophysical Journal, 891, 152
- Hotokezaka et al. (2021) Hotokezaka K., Tanaka M., Kato D., Gaigalas G., 2021, arXiv, p. arXiv:2102.07879
- Hoyle & Fowler (1960) Hoyle F., Fowler W. A., 1960, The Astrophysical Journal, 132, 565
- Hunter (2007) Hunter J. D., 2007, Comput. Sci. Eng., 9, 90
- Iwamoto et al. (1999) Iwamoto K., Brachwitz F., Nomoto K., Kishimoto N., Umeda H., Hix W. R., Thielemann F.-K., 1999, ApJS, 125, 439
- Jerkstrand et al. (2015) Jerkstrand A., Ergon M., Smartt S. J., Fransson C., Sollerman J., Taubenberger S., Bersten M., Spyromilio J., 2015, A&A, 573, A12
- Kasen et al. (2017) Kasen D., Metzger B., Barnes J., Quataert E., Ramirez-Ruiz E., 2017, Nature, 192, L145
- Kozma & Fransson (1992) Kozma C., Fransson C., 1992, ApJ, 390, 602
- Kromer & Sim (2009) Kromer M., Sim S. A., 2009, MNRAS, 398, 1809
- Kuchner et al. (1994) Kuchner M. J., Kirshner R. P., Pinto P. A., Leibundgut B., 1994, ApJ, 426, 89
- Li et al. (2012) Li C., Hillier D. J., Dessart L., 2012, MNRAS, 426, 1671
- Lotz (1967) Lotz W., 1967, Zeitschrift fur Physik, 206, 205
- Lucy (2002) Lucy L. B., 2002, A&A, 384, 725
- Lucy (2003) Lucy L. B., 2003, A&A, 403, 261
- Lucy (2005) Lucy L. B., 2005, A&A, 429, 19
- Maguire et al. (2016) Maguire K., Taubenberger S., Sullivan M., Mazzali P. A., 2016, MNRAS, 457, 3254
- Maguire et al. (2018) Maguire K., et al., 2018, MNRAS
- Matteucci & Greggio (1986) Matteucci F., Greggio L., 1986, Astronomy and Astrophysics (ISSN 0004-6361), 154, 279
- Milne et al. (1999) Milne P. A., The L.-S., Leising M. D., 1999, ApJS, 124, 503
- Nahar & Pradhan (1994) Nahar S. N., Pradhan A. K., 1994, Journal of Physics B: Atomic, 27, 429
- Nomoto et al. (1984) Nomoto K., Thielemann F.-K., Yokoi K., 1984, ApJ, 286, 644
- Pérez-Torres et al. (2014) Pérez-Torres M. A., et al., 2014, The Astrophysical Journal, 792, 38
- Perlmutter et al. (1999) Perlmutter S., et al., 1999, The Astrophysical Journal, 517, 565
- Pognan et al. (2021) Pognan Q., Jerkstrand A., Grumer J., 2021, arXiv, p. arXiv:2112.07484
- Riess et al. (1998) Riess A. G., et al., 1998, AJ, 116, 1009
- Röpke & Sim (2018) Röpke F. K., Sim S. A., 2018, Space Science Reviews, 214, 72
- Schunk & Hays (1971) Schunk R. W., Hays P. B., 1971, Planetary and Space Science, 19, 113
- Seitenzahl & Townsley (2017) Seitenzahl I. R., Townsley D. M., 2017, Handbook of Supernovae, 53, 1955
- Seitenzahl et al. (2013) Seitenzahl I. R., et al., 2013, MNRAS, 429, 1156
- Seitenzahl et al. (2014) Seitenzahl I. R., et al., 2014, Monthly Notices of the Royal Astronomical Society, 444, 350
- Seitenzahl et al. (2016) Seitenzahl I. R., et al., 2016, A&A, 592, A57
- Shen et al. (2018) Shen K. J., Kasen D., Miles B. J., Townsley D. M., 2018, The Astrophysical Journal, 854, 52
- Shigeyama et al. (1992) Shigeyama T., Nomoto K., Yamaoka H., Thielemann F.-K., 1992, ApJ, 386, L13
- Shingles et al. (2020) Shingles L. J., et al., 2020, Monthly Notices of the Royal Astronomical Society, 492, 2029
- Sim (2007) Sim S. A., 2007, MNRAS, 375, 154
- Sim et al. (2010) Sim S. A., Röpke F. K., Hillebrandt W., Kromer M., Pakmor R., Fink M., Ruiter A. J., Seitenzahl I. R., 2010, ApJL, 714, L52
- Spencer & Fano (1954) Spencer L. V., Fano U., 1954, Phys. Rev., 93, 1172
- Spyromilio et al. (2004) Spyromilio J., Gilmozzi R., Sollerman J., Leibundgut B., Fransson C., Cuby J. G., 2004, A&A, 426, 547
- Wilk et al. (2018) Wilk K. D., Hillier D. J., Dessart L., 2018, MNRAS, 474, 3187
- Wilk et al. (2020) Wilk K. D., Hillier D. J., Dessart L., 2020, Monthly Notices of the Royal Astronomical Society, 494, 2221
- Wollaeger et al. (2018) Wollaeger R. T., et al., 2018, Monthly Notices of the Royal Astronomical Society, 478, 3298
Appendix A NLTE populations
A NLTE population solver comparison for Fe ii and Fe iii is shown in Figure 10. NLTE points are the ARTIS calculations, which are shown to be identical to Flörs NLTE solution for Fe2+ and near-identical for Fe+. We include collisional excitation/de-excitation and radiative decays. The main point of difference is the presence of recombination transitions in ARTIS, as this method simultaneously solves the level populations for all included ionisation stages of the element. With similar populations in both ionisation stages, the recombination process does not significantly affect the level populations.
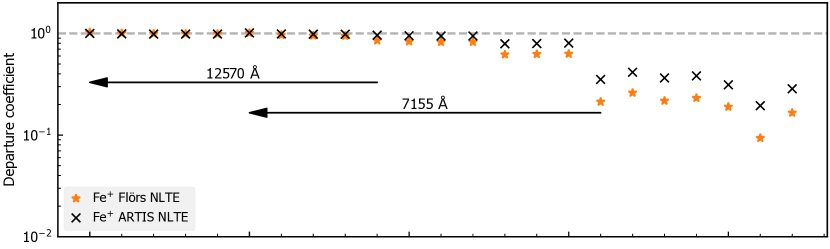
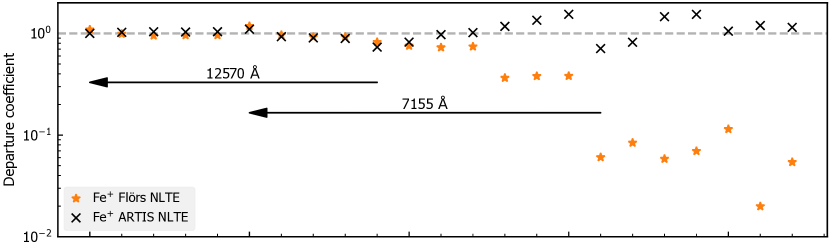
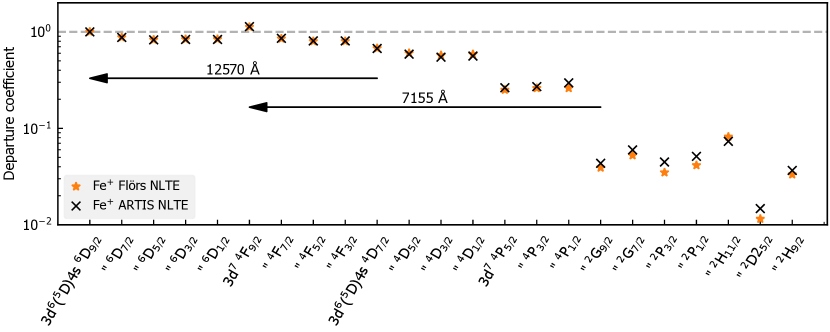
Appendix B Departure ratio plots
In Figure 11, we present the same data as Figure 8, except that each level population has been divided by its population under LTE conditions at the same local electron temperature and ion population.
Appendix C Bound electron loss rate
Here, we compare the experimentally-calibrated stopping power for high-energy electrons in a medium to the energy losses calculated from by our set of ionisation and excitation transitions. For a quantitative comparison, we use the example of a 100 keV electron in a neutral Fe gas with a number density of cm-3.
Using Barnes et al. (2016) equation 5 for the total loss rate (Heitler, 1954; Berger & Seltzer, 1964; Chan & Lingenfelter, 1993; Milne et al., 1999),
where , and eV as given by equation 7 of Barnes et al. (2016). The NIST ESTAR database (Berger et al., 2017) reports the stopping power in Fe of 2.83 MeV cm2/g, which when converted to a loss rate at our example density (0.434 eV/s), agrees very closely with the formula used by Barnes.
Using excitation and impact ionisation cross sections for neutral Fe and the average energy loss of the primary (with the same cross sections and secondary energy distribution function as Kozma & Fransson, 1992), the atomic loss rate is
This total is clearly too low compared to the total stopping power, suggesting some combination of missing physical processes or an underestimate of energy loss of the primary electron in each interaction.
For reference, the plasma loss rate (Schunk & Hays, 1971) for a 100 keV electron to the thermal free electrons (with number density cm-3) is: