∎
e1vladimir.khachatryan@duke.edu \thankstexte2michal@if.uj.edu.pl
Geometrical Scaling of Direct Photons in
Relativistic Heavy Ion and d+Au Collisions
Abstract
In this paper, we show that multiplicity spectra of direct photons in A+A and d+Au collisions at different centrality classes and different energies exhibit geometrical scaling, i.e., they depend on a specific combination of number of participants , collisions energy , and transverse momentum – called saturation scale – rather than on all these three variables separately. In particular, the dependence on the geometry of collisions encoded in the dependence on is in agreement with the expectations based on the Color Glass Condensate theory.
1 Introduction
Direct photons possibly originate from the entire space-time evolution of the matter produced in relativistic heavy ion collisions (HIC): from the pre-equilibrium initial stage, hot fireball of the Quark-Gluon Plasma (QGP), as well as the late hadronic phase. These photons are excellent probes for studying the properties and dynamics of the produced matter, and by definition do not originate from hadronic decays. Since they do not interact strongly while passing through the QGP environment, the information that they carry is not washed out by final state interactions. In p+p and p(d)+Au collisions, they are basically produced only from the initial state wave function. Therefore, one may expect qualitative differences in the photon transverse momentum () spectra (invariant yields) with the change of the sizes of colliding systems/species. Indeed, the thermal photon -spectra in HIC are enhanced with respect to a p+p reference at small , and show large anisotropy (elliptic flow) Adare:2015lcd – a phenomenon dubbed thermal photon puzzle. The photon puzzle is by now less surprising after the collaborations at LHC have measured elliptic flow of charged particles in p+p Sirunyan:2017uyl ; Aaboud:2018syf ; Acharya:2019vdf , suggesting a possibility of initial state correlations not associated with hydrodynamical evolution.
In this paper, we show that the direct photon -spectra exhibit geometrical scaling (GS), which is a property of initial state dynamics associated with over-occupation of gluons at small Bjorken , and even more so in large nuclei. GS has been first observed in the inclusive deep inelastic electron-proton scattering (DIS) Stasto:2000er , where the reduced cross section, essentially , which is in principle a function of two variables and , depends only on the scaling variable for small values of . In this regard, the saturation scale defined as
| (1) |
is proportional to the gluon density in the proton. In the case of DIS, and are fixed parameters of the order of and 1 GeV/c, respectively. The exponent is a nonperturbative dynamical quantity following from the properties of the (non-linear) QCD evolution BK ; Mueller:2002zm ; Munier:2003vc , with its numerical value fixed from the data (for review see Ref. McLerran:2010ub ; Praszalowicz:2018vfw ). GS has also been observed in the charged particle spectra in hadronic collisions McLerran:2010ex ; McLerran:2010wm ; Praszalowicz:2015dta . In HIC, is enhanced by the overlap of interacting nucleons in the colliding nuclei (see Sec. 2).
Physically, the saturation scale corresponds to the gluon density in colliding systems. However, the photons are produced from quarks (through annihilation and QCD Compton scattering), and therefore they do not probe directly the over-occupied gluonic cloud. To this end, one can employ the Color Glass Condensate (CGC) theory to describe the initial hadronic wave function, which evolves into an intermediate state called Glasma, being kind of a strongly interacting and not thermalized QGP McLerran:2010ub . The quarks are produced in the thermalization process, and – if there are no other mass scales around – their distribution should exhibit geometrical scaling111The detailed description of the photon production mechanism in Glasma is beyond the scope of this paper; we refer the reader to Refs. Chiu:2012ij ; McLerran:2015mda ; Khachatryan:2018ori for details. in terms of scaling variable :
| (2) |
Consequently, the direct photon -spectra should scale as well. Indeed, the analysis of Ref. Klein-Bosing:2014uaa showed the emergence of GS in direct photon production, where the authors assumed the functional form of the photon spectra to be (see also Refs. Chiu:2012ij ; McLerran:2015mda ; Khachatryan:2018ori ). In this paper we extend the analysis of Refs. Klein-Bosing:2014uaa ; Khachatryan:2019uqn ; Praszalowicz:2018vfw including later experimental data and employing a model-independent method to search for GS, rather than assuming an approximate functional shape of the scaling function. Preliminary results have been already presented by one of us in Ref. Praszalowicz:2018vfw .
Although the GS scenario has been postulated in Ref. Stasto:2000er following the idea of the saturation exemplified by the GBW model GolecBiernat:1998js for deep inelastic scattering, it in fact arises also in the kinematical regions beyond saturation Iancu:2002tr ; Kwiecinski:2002ep ; Caola:2008xr . Indeed, Iancu, Itacura and McLerran have shown in Ref. Iancu:2002tr that the BFKL evolution preserves GS beyond saturation when starting from the boundary conditions in the saturation region. Kwieciński and Staśto have in turn studied the DGLAP evolution in Ref. Kwiecinski:2002ep , showing that GS is stable for sufficiently large values of the parameter at low in the fixed coupling case. In the running coupling case, GS has been found to be only approximately preserved at small . These studies have been further extended by Caola and Forte in Ref. Caola:2008xr , where they have shown that an approximate GS is in fact a general property of the DGLAP evolution with general boundary conditions. The saturation scale emerges from a saddle point of the DGLAP kernel being a generic property of perturbative evolution. As such, it also generates GS for the BFKL evolution. For low and small , perturbative solutions violate GS, therefore its emergence provides genuine evidence for parton saturation.
Even though GS may not be a sufficient argument in favor of saturation, also in the case of hadronic collisions, it is hard to imagine that the scaling behaviour of direct photon -spectra that we observe in this paper (following from geometrical characteristics of the saturation scale) can be explained without invoking the saturation mechanism.
Our paper is organized as follows. In Sec. 2, we discuss the geometry of HIC, d+Au and p+p collisions222Note that throughout the paper we also use the expressions large systems (for HIC) and small systems (for d+Au and p+p collisions). and introduce pertinent scaling variables. In Sec. 3, we analyze available direct photon data concentrating on two aspects of GS: geometry and energy dependence. We summarize our findings in Sec. 4.
2 Saturation and scaling variables
The GS physics emerges when particles are produced in a kinematical region, where the only relevant intrinsic scale is the saturation momentum of a radiation source. Then, by dimensional analysis, the particle multiplicity is proportional to the overlap transverse area and a universal function of the scaling variable (2):
| (3) |
The energy dependence of is given by Eq. (1).
As far as the value of is concerned, we have to distinguish two geometrical setups corresponding to symmetric and asymmetric collisions Kharzeev:2000ph ; Kharzeev:2002ei . A photon with transverse momentum in the mid-rapidity region resolves, by uncertainty principle, partons of the characteristic transverse size . For symmetric A+A collisions, the interaction region approximately corresponds to a sphere of radius , as shown in Fig. 1. The number of all active sources of radiation, i.e., the number of participants , is proportional to . Therefore,
| (4) |
Here is centrality-dependent transverse overlap of the colliding nuclei. When the number of active partons reaches a critical value , where the whole transverse area is covered by resolved partons
| (5) |
then the number of partons cannot grow any more and the system reaches the saturation, . Consequently, the average transverse momentum, (related to the saturation scale) when this happens, calculated from (5) is equal to
| (6) |
This means, getting back to Eqs.(1) and (2), that for mid-rapidity photons we will have
| (7) |
Introducing the variable , we will further have
| (8) |
where is given in GeV and in TeV.
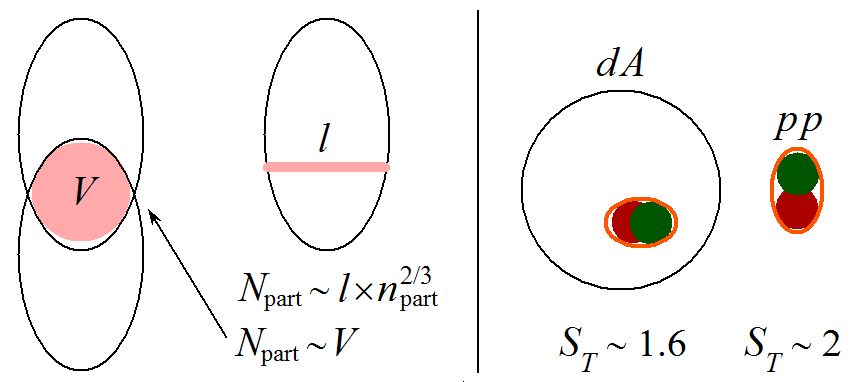
For asymmetric systems, the overlapping region is not spherical but rather one-dimensional (see Fig. 1). Therefore, we should have
| (9) |
where is a number of participants in a small system.
In this paper, we consider only d+Au asymmetric collisions, such that we take following Adare:2013nff . In order to estimate the length shown in Fig. 1 we take , following Ref. Klein-Bosing:2014uaa . Effectively, this means that for the minimum bias d+Au collisions, the number of participants in the Gold nucleus is , rather than the one determined in Ref. Adare:2013nff , where . Meanwhile, note that the volume of the cylinder shown in Fig. 1 (i.e., the total number of participants) is equal to
being quite close to in minimum bias d+Au, as shown in Adare:2013nff .
In view of the above-mentioned discussion, one can write that
| (10) |
Hence the saturation scale of a large nucleus probed by a small one is equal to:
| (11) |
For a small nucleus nothing changes with respect to the symmetric collisions, and
| (12) |
It has been argued in Ref. Dumitru:2001ux that in an asymmetric case the effective saturation scale takes the following form:
| (13) | |||||
In order to test the geometrical assumptions described hitherto, we will release the relation in what follows, treating the power of as a free parameter :
| (14) |
which leads to the scaling variables
| (15) |
and
| (16) |
for large-large and small-large collision systems, respectively. For p+p collisions there is no dependence. In this way we are able to test two distinct aspects of GS: the energy dependence by varying parameter , and dependence on geometry by varying . Note that in the limit when the small nucleus size increases, , the scaling variable (16) reduces to (15).
The exact coefficient linking and the number of participants may be of importance for small nuclei, i.e., for (9). We expect it to vary at most between 1 and . It is therefore of no numerical importance as far as the scaling variable is concerned, due to the power-like suppression with in (16). As a matter of fact, because of rather small exponent in the definition of in (16), rescaling by a factor of 2 has rather negligible effect: .
| [GeV] | System | Centrality | Experiment | References | ||
| 200 | Au+Au | c1 | 0–20 % | 277.5 | PHENIX | Adare:2008ab |
| c2 | 20–40 % | 135.6 | ||||
| mb | 0–92 % | 106.3 | ||||
| 200 | Au+Au | c1 | 0–20 % | 277.5 | PHENIX | Adare:2014fwh |
| c2 | 20–40 % | 135.6 | Afanasiev:2012dg | |||
| c3 | 40–60 % | 56.0 | ||||
| c4 | 60–92 % | 12.5 | ||||
| 62.4 | Au+Au | mb | 0–86 % | 114.5 | PHENIX | Adare:2018wgc |
| 200 | Cu+Cu | c1 | 0-40 % | 66.4 | PHENIX | Adare:2018jsz |
| mb | 0–94 % | 34.6 | ||||
| 2760 | Pb+Pb | c1 | 0–20 % | 308.0 | ALICE | Adam:2015lda |
| c2 | 20–40 % | 157.0 | ||||
| c3 | 40–80 % | 45.7 | ||||
| 200 | d+Au | PHENIX | Adare:2012vn | |||
| p+p | ||||||
On the contrary, the effect on in (3) due to the linear factor of is numerically important. It is instructive to have some intuition concerning the possible relation between and . Let us go back again to Fig. 1, where we schematically show the active transverse geometry in d+Au and p+p collisions. In d+Au collisions, the average of the deuteron related to the transverse size in (3) has been determined to be Adare:2013nff , due to a large asymmetry of the deuteron. The actual transverse size may be larger due to the corona effect. Here we shall neglect the corona effect in the d+Au case333The corona effect has been taken into account in Ref. Klein-Bosing:2014uaa , where the authors used .. On the other hand, in p+p collisions, due to rather a small probability of “central” collisions, the transverse size as shown in Fig. 1, is larger than the size of one proton, so that in this case we simply assume . We discuss the sensitivity of our results to these choices in the next section.
3 Geometrical scaling of direct photon -spectra
In our analysis, we have used direct photon data collected in Table 1 Adare:2008ab ; Adare:2014fwh ; Afanasiev:2012dg ; Adare:2018wgc ; Adare:2018jsz ; Adam:2015lda ; Adare:2012vn . These data sets cover rather large range of centrality classes, different beam energies ranging from 62.4 GeV to 2760 GeV, and different colliding systems/species. This variety gives us a unique opportunity to study the two distinct features of GS: (i) the centrality dependence encoded in the exponent , (ii) the energy dependence encoded in the exponent , both shown in Eqs. (15) and (16). In the first case we compare the data with different but at the same energy; initially carrying it out for the large systems only, and then also for d+Au, trying to assess the best value of . In the second case we take the data at different energies to study the GS dependence on .
Direct photon -spectra in Au+Au at 200 GeV have also been measured by the STAR Collaboration at RHIC STAR:2016use several years ago, but those data are not included in our analysis here444We would expect GS holding for the STAR data as well, in spite of the systematic difference between the direct photon invariant yields measured by STAR and PHENIX in Au+Au collisions.. There are also recent results on direct photon -spectra in p+p at 2760 GeV and 8000 GeV beam energies from the ALICE Collaboration at LHC, where upper bounds are given Acharya:2018dqe .
3.1 Centrality scaling
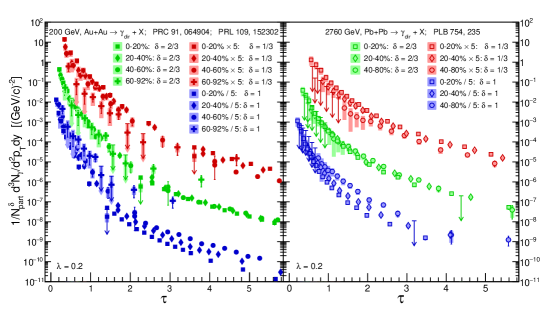
In Fig. 2, we plot different centrality-binned PHENIX 200 GeV Au+Au and 2760 GeV ALICE Pb+Pb direct photon invariant yield data, scaled by in terms of the scaling variable (15) for three choices of . We see that the data at lower initially form a wide spread band (upper red points), then come closer to each other overlapping at (middle green points), to disperse again at larger (lower blue points). The overlap occurs both for PHENIX and ALICE data at , which is expected on the basis of the GS arguments brought up in Sec. 2.
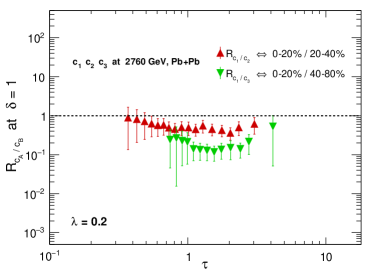
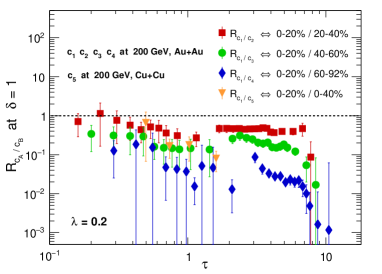
In order to see this with a better resolution, we plot ratios (in Fig. 3) of the most central scaled spectra to those in the other centrality classes at different values of (see also Appendix). These ratios should all be equal to unity if GS is present, and in fact this happens to a good accuracy at .
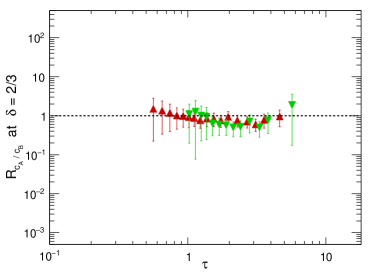
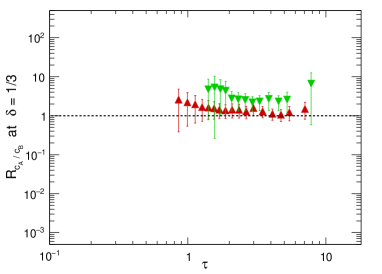
3.2 Centrality scaling for small systems
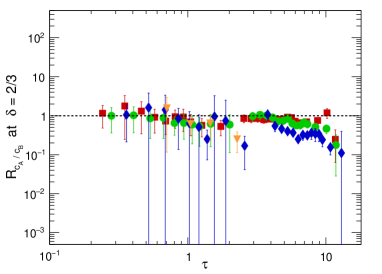
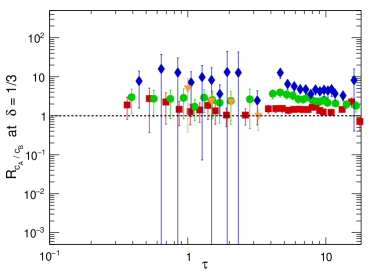
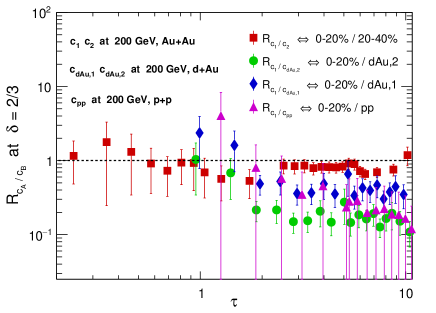
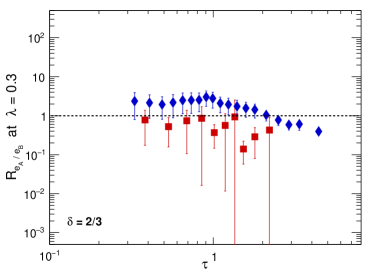
After there are new direct photon invariant yield data on small systems, for example, in p+p, p+Au, d+Au, 3He+Au collisions at RHIC, as well as in p+p, p+Pb collisions at LHC, then our analysis of direct photon GS in small systems will certainly be more complete. For now we have at our disposal only two data sets from PHENIX, both at 200 GeV (see Table 1). The p+p data do not scale, so the d+Au collisions render a more interesting case. Here, following the discussion of Sec. 2, we use the scaling variable given by Eq. (16), and also the transverse size entering the scaling function in Eq. (3) that is given by Eq. (9). This follows from the fact that in asymmetric collisions we have in fact two-saturation scales, and the effective saturation scale is taken as a square root of the two (see Eq. (13)). We need to have therefore two different number of participants, for which – as discussed after Eq. (9) – we take as the number of participants in deuteron, and as the number of participants in the Gold nucleus. For comparison, we also use the one-saturation scale formulae (4) and (15) for and , respectively, given . In both cases, we consider that the exponent is fixed to 2/3.
Thus, in Fig. 4 we show the ratios of scaled -spectra in Au+Au centrality to d+A, with the two-saturation scales (green circles) and the one-saturation scale (blue diamonds). Also, the ratio of two Au+Au centralities (red squares) is also given for comparison. Besides, we include the ratio of scaled -spectra in Au+Au to p+p (magenta triangles). At large values of , the d+A ratio behaves very much the same as the p+p ratio, irrespective whether we use the one- or two- saturation scales formulae. Interestingly enough, a difference appears at small . The d+Au ratio with the two-saturation scales follows approximately the ratio of Au+Au collisions. The one-saturation scale formula still shows a sign of GS, albeit within the limits of uncertainties.
We have also investigated the corona effect in d+A collisions discussed in Sec. 2, and we have established that it violates GS at small values of .
3.3 Energy scaling
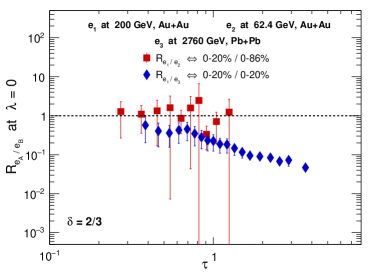
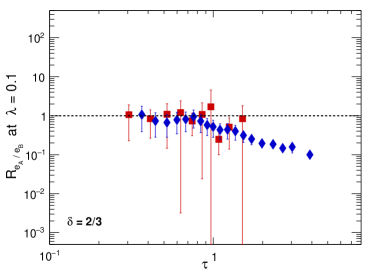
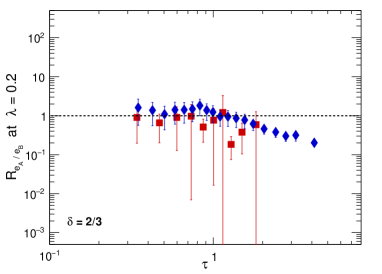
After having fixed , we can now study the GS dependence on the parameter . To this end, we choose one centrality class at different collision energies, namely the most central Au+Au collisions at 200 GeV (designated as ), minimum bias Au+Au collisions at 62.4 GeV ()555We have not used the Au+Au data a 39 GeV from Adare:2018wgc , as they have rather large uncertainties and the collisions energy is not that different from 62.4 GeV., and the most central Pb+Pb collisions at 2760 GeV (). We form two ratios, and , by plotting them for different values of . The result is shown in Fig. 5. We see that the best scaling is achieved for rather low value of , somewhere between 0.1 and 0.2. Certainly, the canonical value666Recall that GS in DIS Stasto:2000er and in the cross-sections in p+p collisions Praszalowicz:2015dta is achieved at . of is excluded. is already used in Fig. 2 and Fig. 3. Note that this value is not so far from the one used in the multiplicity scaling of the charged-particle -spectra in p+p collisions (i.e. ) Praszalowicz:2015dta .
4 Summary and Conclusions
In this paper, we have studied the geometrical scaling of direct photon -spectra (invariant yields) in relativistic heavy ion and d+Au collisions. We have followed the initial study of Ref. Klein-Bosing:2014uaa with, however, newer data and using a method, which does not rely on any specific parametrization of photon yields. If GS is present than all -scaled spectra should be aligned if plotted in terms of the scaling variable . If so, their ratios should be equal to unity (within experimental uncertainties) for some extended interval of the variable, regardless of the centrality class, collision energy, and the colliding nuclei type.
The forms of the scaling variables in (15) and (16), and the scaling function in (3) are dictated by the Color Glass Condensate theory McLerran:2010ub . The fact that we indeed observe GS in HIC, where the QGP is produced, means that the information encoded in the initial wave function of colliding systems is transferred to direct photons. This is a remarkable situation, because GS follows from the scaling properties of the initial wave function of gluons, whereas photons are produced from quarks.
GS has two distinct features: it depends on the collision geometry and on the energy behavior of the saturation scale. We have encoded these two dependencies in the parameter related to the geometry, and the parameter related to the collision energy. While these parameters are in principle fixed to and from simple geometrical arguments and the DIS studies respectively, we have allowed for their variation in order to asses the best values at which GS in HIC is achieved. We have found that the best value for the scaling with centrality is , whereas for the scaling with energy we need to take close to 0.2. The reason why is substantially lower than its expected value might be based on some scaling violations discussed by us in Ref. Khachatryan:2019uqn , and based also on possible other contributions in direct photon production that are not directly related to the initial state physics.
Note that our analysis is not anchored on a detailed study. One faces here three problems: (i) the accuracy of the alignment of different -spectra, (ii) how close this alignment is to unity (for the ratios of spectra), and (iii) how large is the interval. A good example where the ratios of spectra do align but below unity is the Au+Au ratio, and the Au+Au to d+Au ratio at small shown in Fig. 4. We see that both ratios are close to each other, but below one. One should, however, remember that in the small region (i.e., small ), mass scales other than the saturation scale come into play (particle masses, nonperturbative effects related to ) that spoil dimensional arguments on which GS is based. Further studies with possibly upcoming data on small-large collision systems will be of importance to establish GS for asymmetric collisions at low- region.
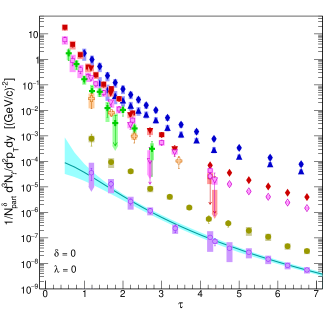
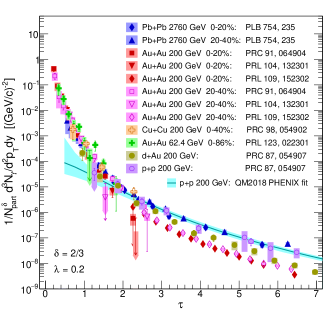
To summarize: we have established GS for direct photon invariant yield data in HIC and observed a GS sign in d+Au collisions. Our analysis of the p+p data is rather inconclusive, due to the large uncertainties of the corresponding ratio shown in Fig. 4. However, as seen in Fig. 6 (right panel), the yield from p+p overall has smaller slope than the yields from HIC. Our final conclusion is best demonstrated in Fig. 6, where we show all data sets – non-scaled ones (left panel) and scaled ones (right panel).
Acknowledgements
We are grateful to Axel Drees and Larry McLerran for many important and fruitful discussions. MP thanks the Institute for Nuclear Theory at the University of Washington for its kind hospitality and stimulating research environment. Research of MP was supported in part by the INT’s U.S. Department of Energy grant No. DE-FG02- 00ER41132.
Appendix
The data points describing direct photon invariant yield in different centrality classes are measured at the same bins. However, when we represent them in terms of the scaling variables, the values of of those points are different at each centrality, as they depend on . Therefore, if we wish to calculate the ratios of the -spectra in different centrality classes, we need to interpolate the data points of at least one centrality to the values, where we have data from another centrality. For example, we have selected the PHENIX Au+Au 200 GeV data set as the reference spectrum, which we divide by other data sets shown in Table 1. All this data has been published in Refs. Adare:2014fwh ; Afanasiev:2012dg for low and high ranges, respectively. They have one overlapping point at GeV, for which we take the data point from Ref. Afanasiev:2012dg , as it has substantially smaller error than that in Adare:2014fwh .
The interpolation is carried out in a simplistic way. For each data point at respective value, we find two adjacent data points, such that , and we fit the power law function to these two points, both for the yield and for the total uncertainty. We do not take into account any additional error coming from this procedure, as for rather densely distributed points such an error is much smaller than the experimental uncertainties.
References
- (1) A. Adare et al. [PHENIX Collaboration], Phys. Rev. C 94, 064901 (2016).
- (2) A. M. Sirunyan et al. [CMS Collaboration], Phys. Rev. Lett. 120, 092301 (2018).
- (3) M. Aaboud et al. [ATLAS Collaboration], Phys. Lett. B 789, 444 (2019).
- (4) S. Acharya et al. [ALICE Collaboration], arXiv:1903.01790 [nucl-ex].
- (5) A. M. Stasto, K. J. Golec-Biernat and J. Kwiecinski, Phys. Rev. Lett. 86, 596 (2001).
-
(6)
I. Balitsky,
Nucl. Phys. B 463, 99 (1996);
Y. V. Kovchegov, Phys. Rev. D 60, 034008 (1999) and Phys. Rev. D 61, 074018 (2000). - (7) A. H. Mueller and D. N. Triantafyllopoulos, Nucl. Phys. B 640, 331 (2002).
- (8) S. Munier, R. B. Peschanski, Phys. Rev. Lett. 91, 232001 (2003). and Phys. Rev. D 69, 034008 (2004).
- (9) L. McLerran, Acta Phys. Pol. B 41, 2799 (2010).
- (10) L. McLerran and M. Praszalowicz, Acta Phys. Pol. B 41, 1917 (2010)
- (11) L. McLerran and M. Praszalowicz, Acta Phys. Pol. B 42, 99 (2011).
- (12) M. Praszalowicz and A. Francuz, Phys. Rev. D 92, 074036 (2015).
- (13) M. Chiu, T. K. Hemmick, V. Khachatryan, A. Leonidov, J. Liao and L. McLerran, Nucl. Phys. A 900, 16 (2013).
- (14) L. McLerran and B. Schenke, Nucl. Phys. A 946, 158 (2016).
- (15) V. Khachatryan, B. Schenke, M. Chiu, A. Drees, T. K. Hemmick and N. Novitzky, Nucl. Phys. A 978, 123 (2018).
- (16) C. Klein-Bösing and L. McLerran, Phys. Lett. B 734, 282 (2014).
- (17) V. Khachatryan and M. Praszałowicz, Eur. Phys. J. C 80 (2020) no.7, 670.
- (18) M. Praszalowicz, EPJ Web Conf. 206, 02002 (2019).
- (19) V. Khachatryan [PHENIX], Nucl. Phys. A 982, 763-766 (2019).
- (20) K. J. Golec-Biernat and M. Wusthoff, Phys. Rev. D 59, 014017 (1998).
- (21) E. Iancu, K. Itakura and L. McLerran, Nucl. Phys. A 708, 327 (2002).
- (22) J. Kwiecinski and A. M. Stasto, Phys. Rev. D 66, 014013 (2002).
- (23) F. Caola and S. Forte, Phys. Rev. Lett. 101, 022001 (2008).
- (24) D. Kharzeev and M. Nardi, Phys. Lett. B 507, 121 (2001).
- (25) D. Kharzeev, E. Levin and M. Nardi, Nucl. Phys. A 730, 448 (2004) Erratum: [Nucl. Phys. A 743, 329 (2004)].
- (26) A. Dumitru and L. D. McLerran, Nucl. Phys. A 700, 492 (2002).
- (27) A. Adare et al. [PHENIX Collaboration], Phys. Rev. C 90,034902 (2014).
- (28) A. Adare et al. [PHENIX Collaboration], Phys. Rev. Lett. 104, 132301 (2010).
- (29) A. Adare et al. [PHENIX Collaboration], Phys. Rev. C 91, 064904 (2015).
- (30) S. Afanasiev et al. [PHENIX Collaboration], Phys. Rev. Lett. 109, 152302 (2012).
- (31) A. Adare et al. [PHENIX], Phys. Rev. Lett. 123, no.2, 022301 (2019).
- (32) A. Adare et al. [PHENIX Collaboration], Phys. Rev. C 98, no. 5, 054902 (2018).
- (33) J. Adam et al. [ALICE Collaboration], Phys. Lett. B 754, 235 (2016).
- (34) A. Adare et al. [PHENIX Collaboration], Phys. Rev. C 87, 054907 (2013).
- (35) L. Adamczyk et al. [STAR Collaboration], Phys. Lett. B 770, 451 (2017).
- (36) S. Acharya et al. [ALICE Collaboration], Phys. Rev. C 99, 024912 (2019).