11email: lzhu@shao.ac.cn 22institutetext: Department of Astrophysics, University of Vienna, Türkenschanzstraße 17, 1180 Vienna, Austria 33institutetext: Max Planck Institute for Astronomy, Königstuhl 17, 69117 Heidelberg, Germany 44institutetext: European Southern Observatory, Karl-Schwarzschild-Straße 2, 85748 Garching bei München, Germany 55institutetext: Instituto de Astrofísica de Canarias, Calle Via Láctea s/n, 38200 La Laguna, Tenerife, Spain66institutetext: Depto. Astrofísica, Universidad de La Laguna, Calle Astrofísico Francisco Sánchez s/n, 38206 La Laguna, Tenerife, Spain77institutetext: Dipartimento di Fisica e Astronomia ’G. Galilei’, Università di Padova, vicolo dell’Osservatorio 3, I-35122 Padova, Italy 88institutetext: INAF–Osservatorio Astronomico di Padova, vicolo dell’Osservatorio 5, I-35122 Padova, Italy 99institutetext: European Space Agency (ESA), European Space Research and Technology Centre (ESTEC), Keplerlaan 1, 2201 AZ Noordwijk, The Netherlands 1010institutetext: Department of Astronomy and Tsinghua Center for Astrophysics, Tsinghua University, Beijing 100084, China 1111institutetext: Department of Physics and Astronomy, Macquarie University, North Ryde, NSW 2109, Australia 1212institutetext: Armagh Observatory and Planetarium, College Hill, Armagh, BT61 9DG, Northern Ireland, UK 1313institutetext: Centre for Astrophysics Research, University of Hertfordshire, College Lane, Hatfield AL10 9AB, UK 1414institutetext: Sterrewacht Leiden, Leiden University, Postbus 9513, 2300 RA Leiden, The Netherlands 1515institutetext: Max-Planck-Institut für extraterrestrische Physik, Gießenbachstraße 1, 85748 Garching bei München, Germany.
The Fornax3D project: discovery of ancient massive merger events in the Fornax cluster galaxies NGC 1380 and NGC 1427
We report the discovery of ancient massive merger events in the early-type galaxies NGC 1380 and NGC 1427, members of the Fornax galaxy cluster. Both galaxies have been observed by the MUSE IFU instrument on the VLT, as part of the Fornax3D project. By fitting recently-developed population-orbital superposition models to the observed surface brightness as well as stellar kinematic, age, and metallicity maps, we obtain the stellar orbits, age and metallicity distributions of each galaxy. We then decompose each galaxy into multiple orbital-based components, including a dynamically hot inner stellar halo component which is identified as the relic of past massive mergers. By comparing to analogues from cosmological galaxy simulations, chiefly TNG50, we find that the formation of such a hot inner stellar halo requires the merger with a now-destroyed massive satellite galaxy of M⊙ (about of its current stellar mass) in the case of NGC 1380 and of M⊙ (about of its current stellar mass) in the case of NGC 1427. Moreover, we infer that the last massive merger in NGC 1380 happened Gyr ago based on the stellar age distribution of the re-grown dynamically cold disk, whereas the merger in NGC 1427 ended Gyr ago based on the stellar populations in its hot inner stellar halo. The major merger event in NGC 1380 is the first one with both merger mass and merger time quantitatively inferred in a galaxy beyond the Local Volume. Moreover, it is the oldest and most massive merger uncovered in nearby galaxies so far.
Key Words.:
galaxies: structure – galaxies: dynamics – galaxies:observations – galaxies: stellar kinematics1 Introduction
Driven by gravity, galaxies are expected to continuously grow through the merging of smaller systems. Deriving their past merger history is challenging, as the accreted stars disperse quickly. Uncovering the properties of past merger events was so far only possibly in the nearest few galaxies for which individual stars can be resolved in observations.
In our own galaxy, the Milky Way, motion and chemistry of individual stars are detected. Numerous streams and over-densities (e.g., Majewski et al., 2003; Helmi, 2020; Ibata et al., 2021) identified in the outer halo indicate the many minor mergers still on-going in the Milky Way. Debris from massive ancient mergers is spatially well-mixed, but fortunately still distinguishable in kinematics. Recently, stars on highly-radial orbits in the vicinity of the Sun have been associated to the Galaxy’s inner stellar halo – e.g. the so-called Gaia Enceladus or Gaia Sausage, which is thought to have originated from a single massive merger of M⊙ about Gyr ago (Helmi et al., 2018; Belokurov et al., 2018).
In our neighboring galaxy, the Andromeda giant spiral galaxy (M31), an inner stellar halo with a giant stream has been identified (Ibata et al., 2014), which could have been also induced by a single massive merger, called M32p, with M⊙ about Gyr ago (D’Souza & Bell, 2018a; Hammer et al., 2018). The satellite mass is inferred from the metallicity of M32, which is supposed to be the surviving core of the progenitor satellite galaxy. The merger time was inferred from stellar age distribution of stars in the giant streams and inner stellar halo.
In the nearest giant elliptical galaxy, NGC 5128 at distance of 3.8 Mpc, individual stars in the outer halo are resolved by deep HST photometry (Rejkuba et al., 2011) and analysis similar to that of M31 indicates a past massive merger of also M⊙ (D’Souza & Bell, 2018b).
In the above cases, the quantification of the satellite mass relies on the mass-metallicity relation, while the constraint on merger time relies on star formation histories obtained from individual stars. Similar studies are thus limited to the nearest few galaxies until 30-m telescopes become available and allow us to get resolved stellar populations for more distant galaxies. The past merger histories for a few galaxies at larger distances are partially uncovered using different techniques. Individual GCs in the halos are detected in nearby galaxies and are used as another tracer of the galaxy assembly history (Forbes et al., 2016; Beasley et al., 2018; Kruijssen et al., 2019). Deep images broadly characterize the light distribution of stellar halos in nearby galaxies and found varies substructures, like streams, in the halo (Merritt et al., 2016; Harmsen et al., 2017).
Over the last two decades, integral-field-unit (IFU) instruments have spectropscopically mapped thousands of galaxies across a wide range of masses and Hubble types (de Zeeuw et al., 2002; Cappellari et al., 2011; Sánchez et al., 2012; Bryant et al., 2015; Bundy et al., 2015). In principle, the information of stellar motions and chemical distributions of an external galaxy is included in these IFU data, though all mixed along the line-of-sight. Recent studies have attempted to constrain the global ex-situ fractions (Davison et al., 2021a, b; Boecker et al., 2020) or the mass of satellite mergers (Pinna et al., 2019b, a; Martig et al., 2021) based on age and metallicity distributions of stars in galaxies’ inner regions obtained from IFU data. These methods can identify minor mergers as their accreted stars have lower metallicity than in-situ stars, but they become insenstive to major mergers with overlapping metallicities. Also, the merger times remain largerly unconstrained with such approaches.
From a numerical perspective, recent and current cosmological hydrodynamical simulation projects, such as IllustrisTNG111www.tng-project.org and EAGLE222http://eagle.strw.leidenuniv.nl/, have been able to reproduce large numbers of galaxies across the morphological spectrum with well-resolved structures (Pillepich et al., 2019; Pulsoni et al., 2020; Rodriguez-Gomez et al., 2019; Du et al., 2019; Correa et al., 2017). Structures like Gaia-Enceladus in the Galactic inner stellar halo also arise in Milky Way-like simulated galaxies (e.g. Grand et al., 2020). In Zhu et al. (2021), a hot inner stellar halo, consisting of orbits which are dominated by random instead of ordered motion, is defined universally for all type of galaxies across a wide mass range. The mass of such a hot inner stellar halo is found to be strongly correlated with the stellar mass of the most massive merger as well as with the total ex-situ stellar mass. The correlations are consistent across the TNG50 (Pillepich et al., 2019; Nelson et al., 2019a), TNG100 (Pillepich et al., 2018; Nelson et al., 2018; Springel et al., 2018; Marinacci et al., 2018; Naiman et al., 2018) and EAGLE (Schaye et al., 2015; Crain et al., 2015) simulations for galaxies with stellar mass M⊙, regardless of the numerical resolution and galaxy formation model. The hot inner stellar halo is thus a promising way to quantify the past merger mass for all types of massive galaxies.
In parallel, we have been able to accurately infer the internal stellar orbit distribution of external galaxies by applying Schwarzschild’s orbit-superposition dynamical method to the stellar kinematic maps, extracted from IFU data (van den Bosch et al., 2008; Zhu et al., 2018c). The method has been applied to hundreds of galaxies across the Hubble sequence (Zhu et al., 2018b, a; Jin et al., 2020; Santucci et al., 2022). Stellar orbits in the model have been further colored with age and metallicities in a recently-developed population-orbit superposition method (Poci et al., 2019; Zhu et al., 2020). By fitting the stellar kinematic, age and metallicity maps simultaneously, we have been able to obtain the internal stellar orbit distribution as well as the age and metallicity distributions (Poci et al., 2021). With this novel method, chemo-dynamically identification of galactic structures as employed in the Milky Way, has become possible for external galaxies.
In this paper, we show that the mass of the hot inner stellar halo is a quantity that can be robustly obtained for external galaxies by applying our population-orbit superposition method to VLT/MUSE IFU data of two Fornax cluster galaxies, NGC 1380 and NGC 1427, observed as part of the Fornax3D project (Sarzi et al., 2018). We subsequently contrast these robust mass measurements with the correlations obtained from simulations as presented in Zhu et al. (2021) to infer the masses of the mergers that induced the hot inner stellar halos in both galaxies. Finally, we use the modelled age distributions of the different dynamical structures to also constrain the times of the last major mergers in NGC 1380 and NGC 1427.
The paper is organized as follows. In Section 2, we describe the observational data of NGC 1380 and NGC 1427. In Section 3, we present the population-orbit superposition models of the two galaxies and measure the mass of their hot inner stellar halos. In Section 4, we present the main results of the paper and after discussing effects due to the cluster environment in Section 5, we summarize in Section 6. Tests of our method and evaluation of model uncertainties are outlined in the Appendices A and B.
2 Deep imaging and spectroscopic data
2.1 NGC 1380 and NGC 1427 in the Fornax cluster
Astronomers have observed galaxies in the Fornax cluster in great detail in recent years. The Fornax Deep Survey (FDS) has observed all galaxies in the 9 square degrees around the core of the Fornax cluster with the VLT Survey Telescope down to 27 in -band (Iodice et al., 2019b). Then, the Fornax3D project (Sarzi et al., 2018), using the MUSE IFU instrument on the VLT, has observed all 23 early-type galaxies (ETGs) and 10 late-type galaxies (LTGs) within the virial radius of the cluster, down to 25 in the -band. NGC 1380 (FCC 167) and NGC 1427 (FCC276) are two galaxies in the Fornax cluster observed as part of the FDS (Iodice et al., 2019b) and Fornax3D survey (Sarzi et al., 2018).
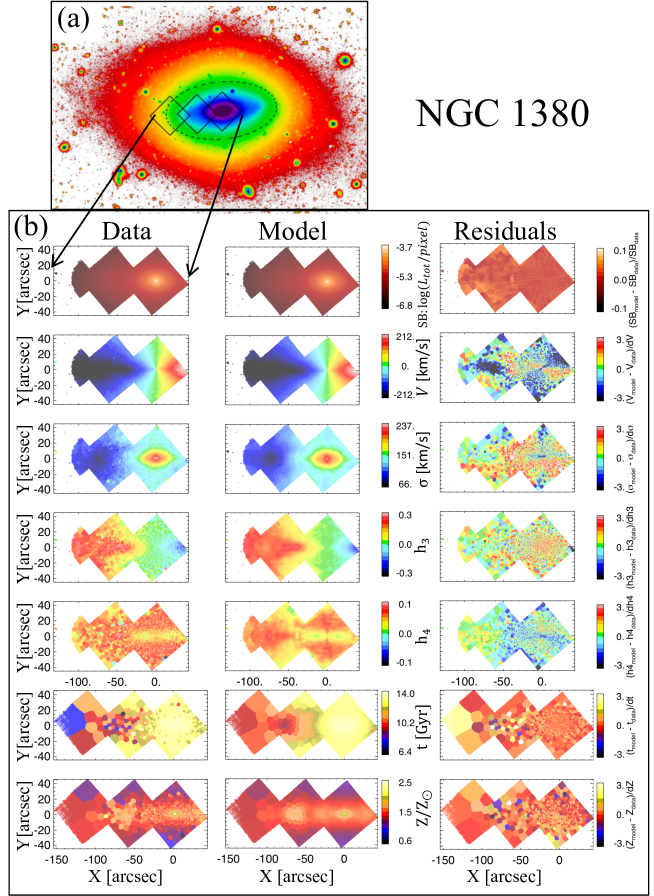
NGC 1380 is a lenticular galaxy located on the north-western side of the cluster at arcmin from the brightest central galaxy (BCG) NGC 1399, and at a distance of 21.2 Mpc from us (Blakeslee et al., 2009). NGC 1380 has a total -band magnitude of and a half-light radius of kpc. Deep imaging reveals an outer and fainter isophotoes at arcmin, which appear less flattened and twisted with respect to the inner and more disky regions (Iodice et al., 2019b). Through the Fornax3D project, NGC 1380 was observed with three MUSE pointings out to a galactocentric radius of along the major axis and up to along the minor axis (Figure 1). It is one of the most-studied objects within the cluster. Some initial dynamical modelling results have been included in Sarzi et al. (2018).
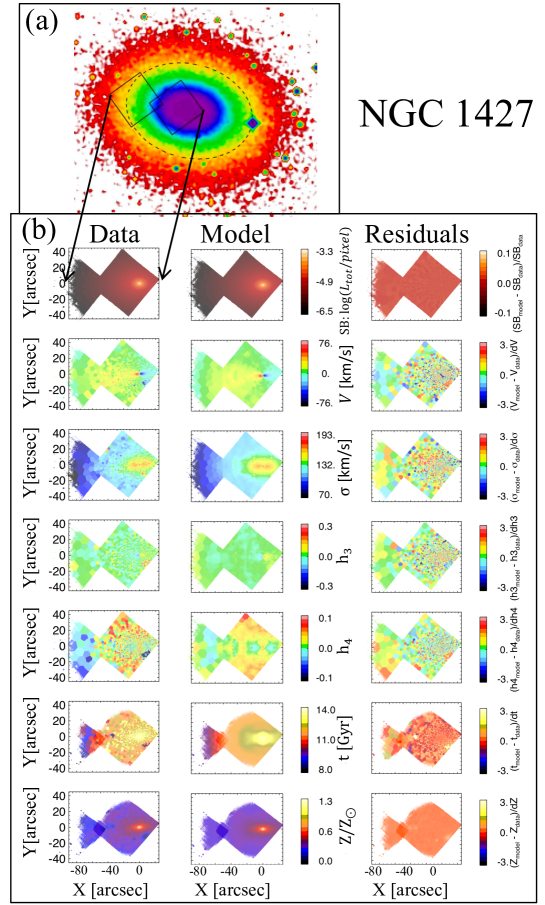
NGC 1427 is the brightest elliptical galaxy located on the eastern side of the cluster at arcmin from the BCG, and at a distance of 19.6 Mpc from us (Blakeslee et al., 2009). NGC 1427 has mag and kpc. This galaxy becomes bluer with increasing radius and in the outskirts, and its outer and fainter isophotes appear asymmetric at arcmin (Iodice et al., 2019b). NGC 1427 was observed with two MUSE pointings out to a radius of along the major axis and up to along the minor axis (Figure 2).
Both NGC 1380 and NGC 1477 are located beyond the visible extended stellar halo of the BCG NGC 1399, which is mapped out to 33 arcmin (Iodice et al., 2016).
2.2 Stellar kinematic, age and metallicity maps
The IFU spectra were spatially binned using a Voronoi tessellation(Cappellari & Copin, 2003) to reach a minimal signal-to-noise per bin, resulting in a total of 4300 bins for NGC 1380 and 3072 bins for NGC 1427. Following earlier analysis of NGC 1380 (Sarzi et al., 2018), the stellar kinematics were extracted by applying pPXF full-spectral fitting (Cappellari & Emsellem, 2004) to the wavelength range 4750-5500 Å. This yields high-quality maps of the stellar mean velocity , velocity dispersion , and higher order velocity moments parameterised through the Gauss-Hermite (GH) coefficients and .
To obtain high-quality maps of stellar age and metallicity, the spectra were spatially re-binned to reach for NGC 1380, resulting in a total of 974 bins. For NGC 1427, we kept the 3072 bins with target from above. Each binned spectrum was fitted with regularized pPXF (Cappellari, 2017) using the MILES single stellar population (SSP) models (Falcón-Barroso et al., 2011a) based on BaSTI isochrones (Vazdekis et al., 2015), and we assume a constant Milky Way-like Kroupa (Kroupa, 2002) stellar initial mass function. The models cover a wavelength range of 3540-7410 Å, and are sampled at a spectral resolution of 2.51 Å (Falcón-Barroso et al., 2011b). They include 8 values of total metallicity [M/H]=[-0.96, +0.40] dex (with a resolution between 0.14 and 0.48 dex), 33 values of age between 1.0 and 14.0 Gyr (with a resolution between 0.25 and 0.5 Gyr), and two values of [Mg/Fe]=0.0 (solar abundance) and 0.4 dex (supersolar). The templates with metallicity below -0.96 and age below 1.0 Gyr were excluded. We fitted the stellar kinematics and populations in the same run, using a multiplicative polynomial of 8th order and regularization parameter of 0.5. We generally followed the same approach as earlier work (Pinna et al., 2019b) but re-normalized the templates to get light-weighted stellar age and metallicity in each Voronoi bin.
3 Population-orbital superposition method
We fit population-orbit superposition models to the luminosity distribution, stellar kinematic, age, and metallicity maps for each galaxy. The major steps of constructing the model include:(1) construction of the gravitational potential, (2) calculation of an orbit library in the gravitational potential, (3) fitting to the luminosity density and kinematic maps by weighting the orbits, (4) fitting to the age and metallicity maps by coloring the orbits. Best-fitting models are obtained by exploring the free parameters in the gravitational potential and minimizing the difference between models and data. In the end, we obtain 3D models superposed by stellar orbits tagged with age and metallicity, which match all data well. We then decompose the galaxies based on the modelled stellar orbit distribution.
While our method was introduced and extensively verified in Zhu et al. (2020), we present the main steps below.
3.1 Gravitational potential
The gravitational potential is assumed to be generated by the stellar mass plus dark matter halo. Also a central black hole of M⊙ is added although it remains unresolved by the kinematic data and does not affect our results. To obtain the stellar mass distribution, we first fit the -band image from FDS by a Multiple Gaussian Expansion (MGE) model (Cappellari, 2002). Then by adopting a set of viewing angles (), we de-project toward a triaxial MGE model which represents the intrinsic stellar luminosity density. Finally, by multiplying with a constant stellar mass-to-light ratio , we arrive at the intrinsic stellar mass distribution. The effects of the constant stellar mass-to-light ratio on our results are discussed in Appendix B.
The three viewing angles relate directly to three axis ratios describing the intrinsic shape (van den Bosch et al., 2008). We leave the intrinsic intermediate-to-major and minor-to-major axis ratios free to vary, but limit in the range of . Moderate triaxiality is allowed in the model. The dark halo is throughout assumed to be spherical with a NFW (Navarro et al., 1997) radial profile with two free parameters: the halo (virial) mass , defined as the total mass enclosed within the virial radius within which the average density is 200 times the critical density, and the concentration , defined as the ratio between dark matter virial radius and the dark matter scale radius. We let free and for each dark matter halo we fix following the relation from Dutton & Macciò (2014). In total we thus have five free so-called hyper-parameters: , , , , and .
3.2 Fitting the data
3.2.1 Fitting to luminosity density and stellar kinematic maps
For each set of hyper-parameters, we compute tens of thousands of orbits in the corresponding gravitational potential. The orbit sampling and calculation follow what we described in Zhu et al. (2020). The weights of the orbits in the resulting orbit library are then determined from fitting simultaneously the orbit-superposition to the intrinsic and projected luminosity density and stellar kinematic maps.
We adopt a parameter grid with intervals of 0.2, 0.02, 0.02, 0.01 and 0.2 for , , , , and . Then we perform an iterative process searching for the best-fitting models generally following the process described in Zhu et al. (2018c). As the initial searching steps were already small, we did not refine the search grid around the minimum. At the end, we got 294 models for NGC 1380 and 465 models for NGC 1427 with different collections of the hyper-parameters. Once we have explored the hyper-parameter space, we select the best-fitting models with , where is the number of stellar kinematic moments and is the number of bins of each kinematic map. The criterion of is roughly the fluctuation of a single model when perturbing the kinematic data, it generally works well as the confidence level according to our test with mock data (Zhu et al., 2018c).
There are 55 models with different values of the hyper-parameters within this confidence level for NGC 1380. We obtain an inclination angle of , which is consistent with that estimated from the central dust ring (Viaene et al., 2019). Our dynamical model constrains the stellar mass of NGC 138 to be M⊙ within , with M⊙/L⊙. The mass outside the kinematic data coverage is not well constrained. Therefore, we just take two times of the mass within as NGC 1380’s total stellar mass, which gives M⊙.
There are 150 models within this confidence level for NGC 1427. Our dynamical model gives a total stellar mass of M⊙ within , with M⊙/L⊙, and an inclination angle of . Also in this case, the mass outside the kinematic data coverage is not well constrained, and so we take two times of the mass within as NGC 1427’s total stellar mass, which gives M⊙.
3.2.2 Fitting to the age and metallicity maps
Next, for each of the models within the confidence level, we applied Voronoi binning in the phase space of versus to group the orbits into bundles with comparable weight. Then we tagged each bundle with a single stellar age and metallicity and compared the superposition of the orbit bundles with the light-weighted age and metallicity maps extracted from the VLT/MUSE observations.
We use Bayesian statistical analysis (Python package pymc3) to estimate the best-fitting age and metallicity for each orbital bundle. To use Bayesian theorem to compute the posterior of a model, we require the prior and the data likelihood. We follow Zhu et al. (2020) in adopting bounded normal and log-normal distributions for the priors on and . While we adopt a student’s t-distribution for the data likelihood (Salvatier et al., 2016), which will allow some outliers in the data and results in a robust fitting. For each parameter (), we run a chain with 2000 steps and take the last 500 steps to calculate the mean and values of () for each orbit bundle. Metallicity is fitted separately from age without implementing an age-metallicity correlation. The combination of the best-fitting orbital weights with best-fitting age and metallicity of orbital bundles yields population-orbital models that fit in detail the observed stellar kinematic, age, and metallicity maps. The best-fitting models of NGC 1380 and NGC 1427 are shown in Figures 1 and 2, respectively.
3.3 Orbit-based decomposition of galaxies
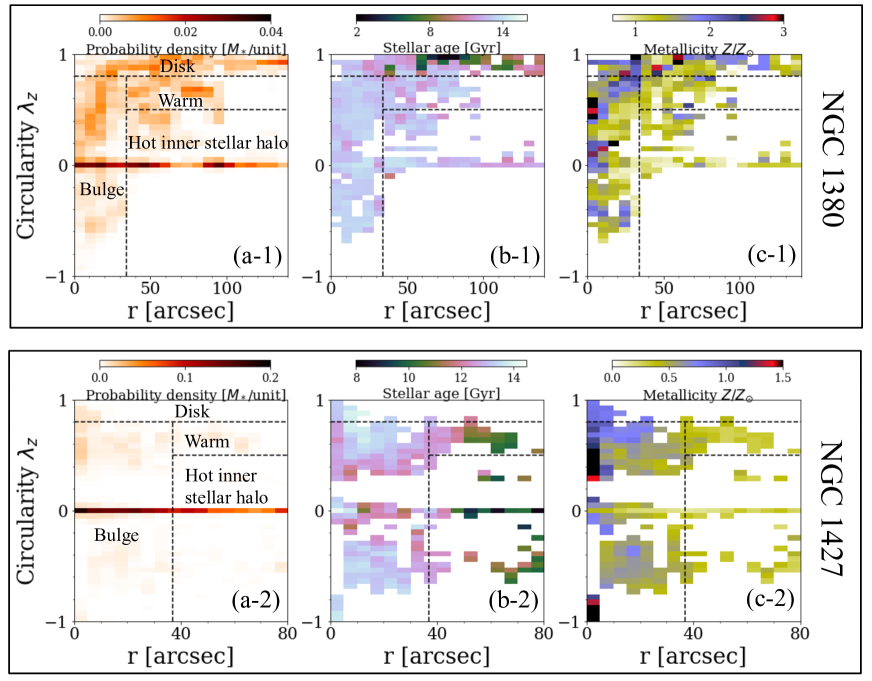
Our method yields the weights of the different stellar orbits that contribute to the best-fitting model as well as the average stellar age and metallicity of the stars represented by each orbit. We then characterize each stellar orbit with two main properties (Zhu et al., 2018c): the time-averaged radius, , which represents the extent of the orbit, and the circularity, , which represents the angular momentum of the orbit around the minor -axis normalized by the maximum of a circular orbit with the same binding energy . Whereas represents dynamically-cold orbits dominated by regular rotation, represents dynamically-hot orbits, which are dominated by radial random motions or long-axis tubes with regular rotation around the long axis. Negative values refer to orbits that counter-rotate with respect to the net (prograde) rotation. Figure 3 presents the resulting stellar-orbit distributions of NGC 1380 and NGC 1427, respectively, as probability-density distributions in the phase space of versus , as well as the age and metallicity distributions of the stellar orbits in the same phase space.
Considering the sub-structures in the stellar-orbit probability density and in the age and metallicity distributions in the phase space of versus , we separate each galaxy into four stellar components:
-
•
disk (),
-
•
bulge (, ),
-
•
warm (, ),
-
•
hot inner stellar halo (, ).
The latter is in fact a dynamically-hot component, separated from the bulge by kpc, which is generally associated with a transition in density and metallicity distributions of the dynamically-hot orbits.
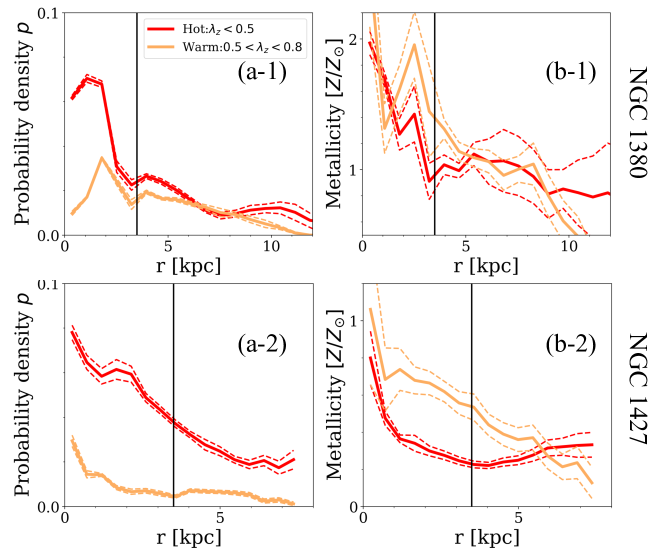
In Figure 4, we show the probability density and the average metallicity of the dynamical hot () and warm () orbits as a function of radius, for NGC 1380 (Panel (a-1) and (b-1)) and NGC 1427 (Panel (a-2) and (b-2)). For NGC 1380, both the probability density and metallicity of the hot orbits first decreases sharply from an inner peak, and then flatten beyond a transition radius at kpc. For NGC 1427, the transition is not so clear in the probability density, but there is a transition in the metallicity profile which flattens beyond kpc. A transition generally exists in probability density profile of the hot orbits at kpc for TNG50 galaxies, but especially those simulated galaxies with high ex-situ fractions do not show a sharp transition similarly to NGC 1427 (Zhu et al., 2021). To be able to apply the resulting correlations obtained in (Zhu et al., 2021) for simulated galaxies, we adopt the same kpc to separate the bulge and hot inner stellar halo.
The probability density and the average metallicity of the dynamical warm orbits are also shown for comparison. The warm orbits are more metal-rich than hot orbits in NGC 1427, while the difference is small in NGC 1380. In both galaxies, the warm orbits show negative metallicity gradients from the inner to outer regions, which are different from the flattening of metallicity distribution of the hot orbits.
The four components are defined in such a way as to highlight distinct structural, kinematic, and stellar population distributions, thus likely implying distinct formation pathways. According to previous observational and numerical studies, it would appear that, for galaxies with a quiescent merger history, stars that formed in-situ from the collapse of dense gas at high redshift constitute a compact spheroid (Du et al., 2021; Williams et al., 2013), which constitute a major part of our present-day “bulge” and part of the “warm component” (Yu et al., 2021). At lower redshift, in-situ stars form out of a gaseous disk that subsequently leads to a dynamical cold stellar disk with strong rotation (Du et al., 2021; Yu et al., 2021). No substantial hot inner stellar halo is expected in galaxies with a quiet merger history (Zhu et al., 2021). On the other hand, according to the results of state-of-the-art cosmological galaxy simulations, the hot inner stellar halo is the product of massive mergers (Zhu et al., 2021), and stars in it can have three origins: (1) stars accreted from a massive satellite typically favour highly-radial orbits with (Boylan-Kolchin et al., 2008; Fattahi et al., 2019) and hence partially settle into the bulge and partially stay at larger radii, becoming part of the hot inner stellar halo; (2) at the same time, a merger event can destroy the previously-existing disk and/or bulge of the main progenitor, inducing a fraction of the disk/bulge stars to be kicked to the phase-space regions of the hot inner stellar halo; (3) a merger can last for a few billion years until coalescence and new stars formed during the merger event also partially contribute to the hot inner stellar halo.
As tested with mock data created from cosmological galaxy simulations, the luminosity fractions of such four components can be recovered in observed galaxies to good accuracy by our modelling (see Appendix A). In the cases of the Fornax cluster galaxies NGC 1380 and NGC 1427, the hot inner stellar halo contributes 27 per cent and 34 per cent, respectively, to the total -band luminosity within . We estimate that the hot inner stellar halo mass is M⊙ and M⊙ for NGC 1380 and NGC 1427, respectively. The uncertainty includes contribution of systematically errors evaluated based on the rigorously tests with mock data, and statistical errors of the model, the details are included in the Appendix B.
4 Weighing and timing of past mergers
4.1 Stellar mass of the accreted satellite(s) by NGC 1380 and NGC 1427
Cosmological galaxy simulations show that the hot inner stellar halo is a smoking-gun evidence of massive mergers that a galaxy has experienced in its past history. In a companion paper (Zhu et al., 2021), we show that cosmological galaxy simulations return strong correlations between the hot inner stellar halo mass of galaxies and the stellar mass from the most massive galaxy they have ever merged with, . Combining all the stars from all accreted satellites and mergers, , makes the correlations even stronger. These results hold for a definition of the hot inner stellar halo that is identical to the one put forward above and applied to the case of NGC 1380 and NGC 1427 via our population-orbit superposition models. The hot inner stellar halo mass can thus be used to infer the mass of the most massive satellite (now destroyed) that a galaxy has ever merged with, as well as of the total accreted or ex-situ stellar mass of an observed galaxy. This can be done thanks to the fact that the hot inner stellar halo mass can be well recovered by our population-orbit based model for real galaxies, even long after the stars from the merger events are phase-mixed (see Appendix A).
4.1.1 Stellar mass of the most massive satellite
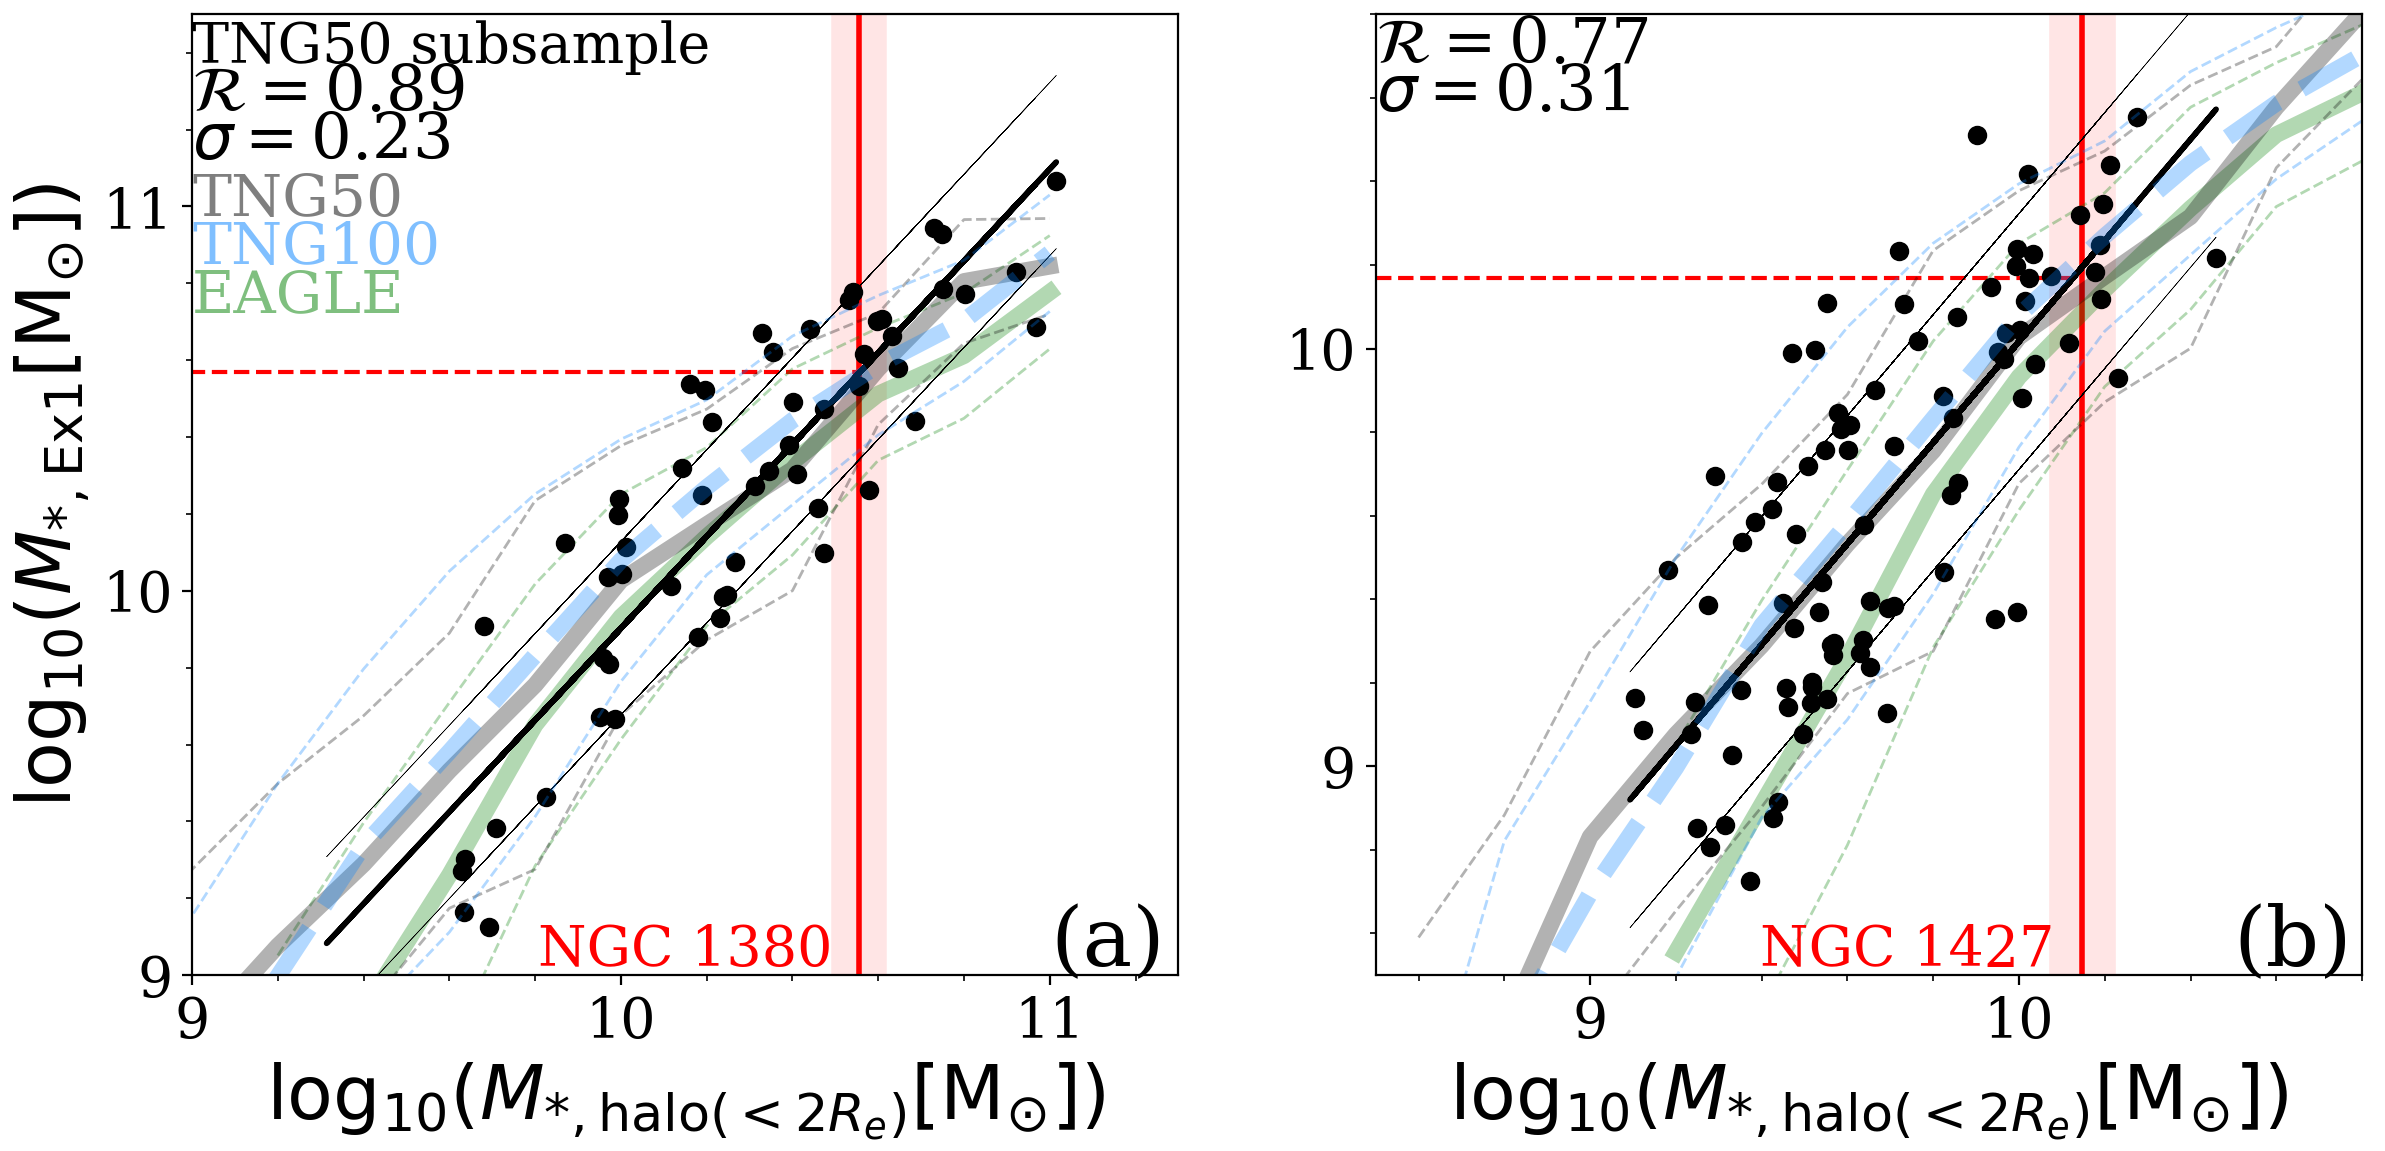
We infer the stellar mass of the most massive merger for NGC 1380 and NGC 1427 by using the scaling relations predicted by the cosmological simulation TNG50 (Pillepich et al., 2019; Nelson et al., 2019a) (see Figure 5). For NGC 1380 with M⊙ and kpc, we compare with the subsample of TNG50 galaxies with M⊙ and kpc. From these TNG50 galaxies, we obtain with a Pearson correlation coefficient , and a scatter against of the linear fit of . With M⊙ for NGC 1380, we obtain M⊙ ( M⊙), with a significant lower-limit of M⊙. The uncertainty of satellite mass is taken as , where is the uncertainty in the derivation of , while is the uncertainty caused by the scatter of the relation, i.e., .
In a similar fashion, for NGC 1427, with M⊙ and kpc, we compare with the subsample of TNG50 galaxies with M⊙ and kpc. From these TNG50 galaxies, we obtained with the Pearson correlation coefficient and . With M⊙ for NGC 1427, we infer M⊙ ( M⊙), with a significant lower-limit of M⊙.
4.1.2 Total accreted stellar masses
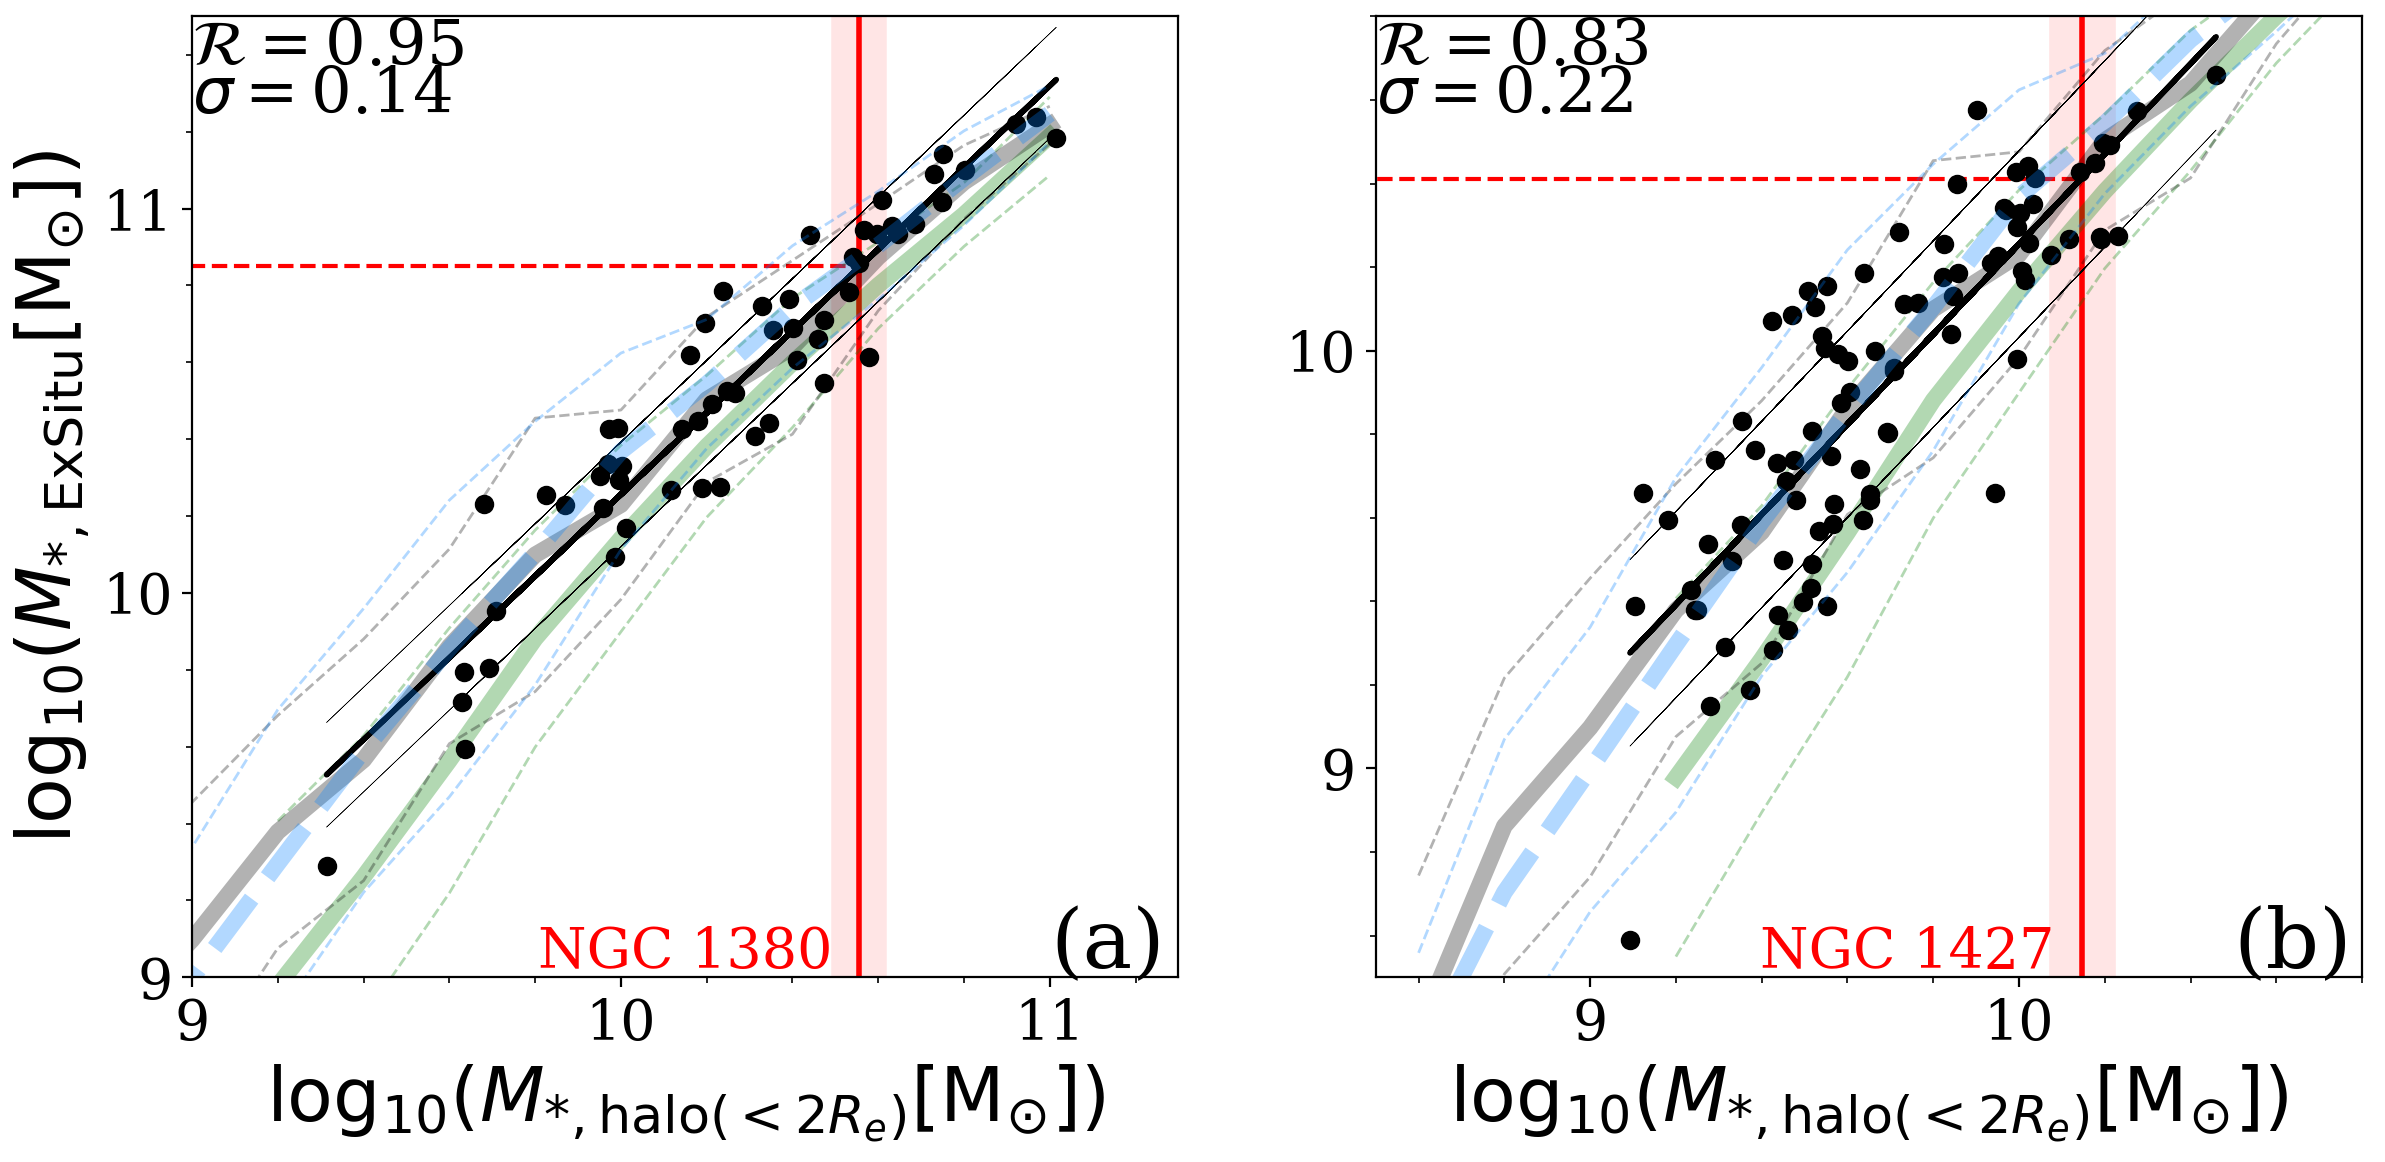
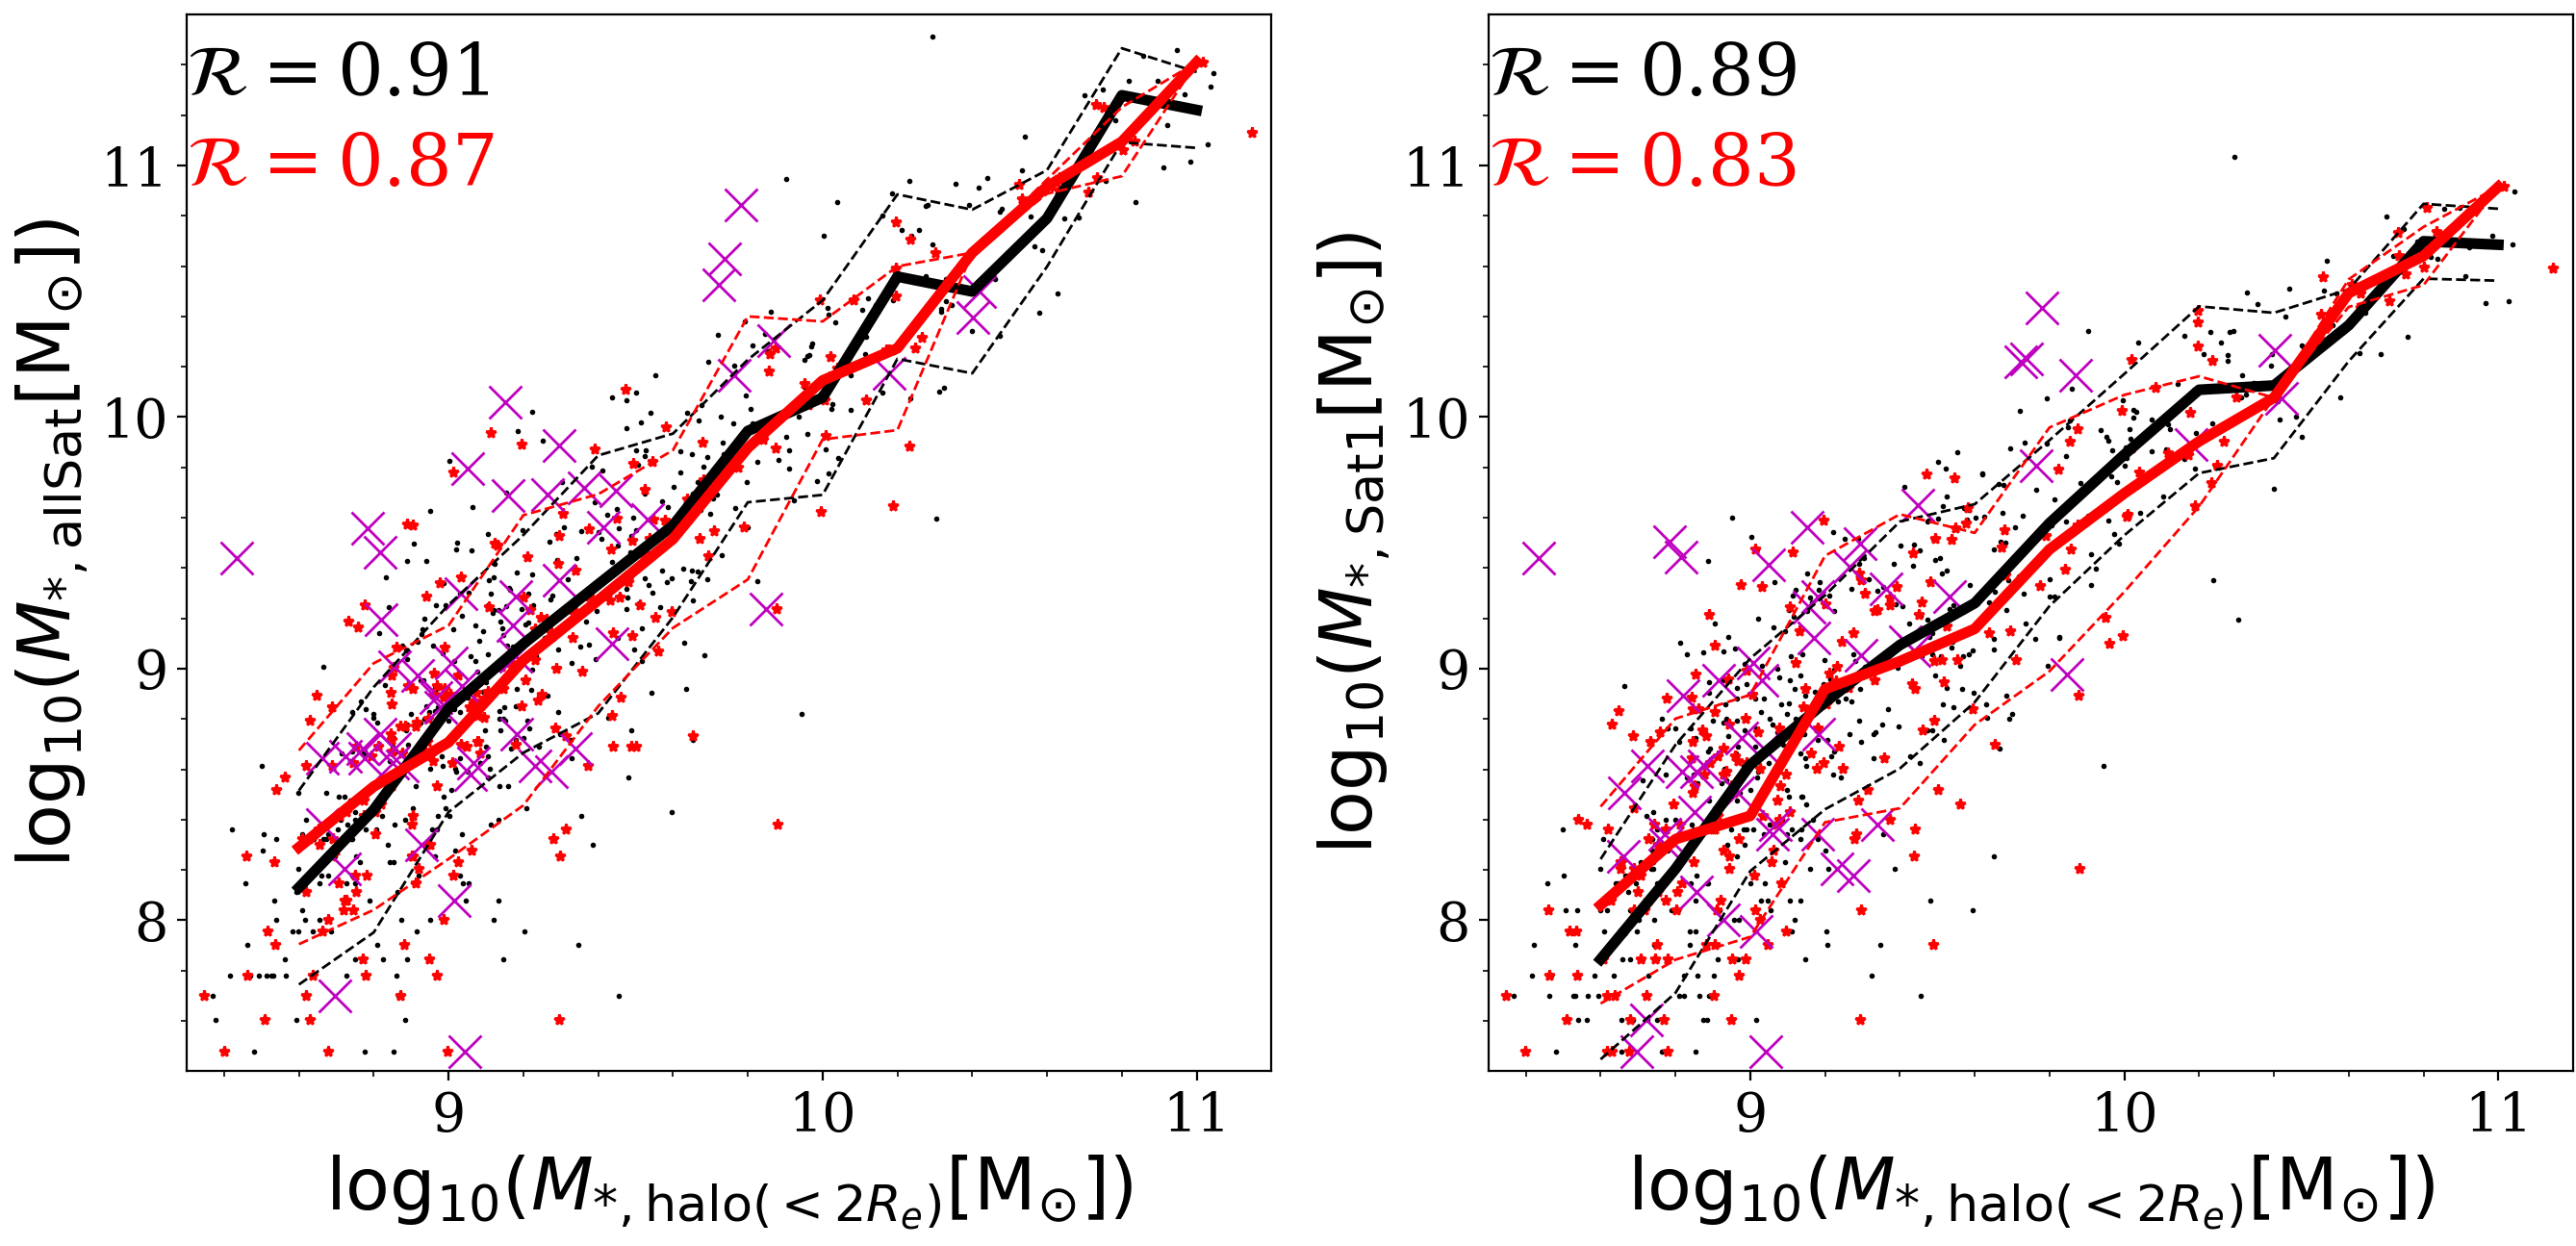
The correlations with are stronger when combing all the ever accreted stellar mass , as shown in Figure 6. The group of galaxies with similar mass and size of NGC 1380 gives with and . With M⊙ for NGC 1380, we obtain M⊙ ( M⊙) with a significant lower-limit of M⊙.
In a similar fashion, the set of galaxies with similar mass and size of NGC 1427 gives with and . With M⊙ for NGC 1427, we infer M⊙ ( M⊙) with a significant lower-limit of M⊙.
Our results depend insignificantly, within the reported errorbars, on the particular subset of simulated galaxies adopted for the inference and in fact do not depend either on the specific cosmological galaxy simulation that the relationships have been extracted from. The correlations fitted for the two subsamples of galaxies chosen for NGC 1380 and NGC 1427 are consistent with each other. In Figure 5 and Figure 6, we overlap the correlations (Zhu et al., 2021) inferred from all galaxies with M⊙ for three cosmological galaxy simulations whose data are publicly available and that we have analyzed in Zhu et al. (2021): TNG50 (Pillepich et al., 2019; Nelson et al., 2019a), TNG100 (Nelson et al., 2019b) and EAGLE (McAlpine et al., 2016). The median as well as the scatter of these correlations are almost identical in the regimes of NGC 1380 and NGC 1427: the difference of and inferred from these three sets of simulations are smaller than 0.1 dex.
4.2 Timing of the past major mergers
The time of the mergers in observed galaxies can be inferred from the stellar age distributions in the different dynamical components. A dynamically-cold disk made of stars with is usually, at least partially, destroyed during a massive merger, resulting in stars of similar age as the surviving disk but on dynamically-warmer orbits. Only after the merger, and in the presence of sufficient gas, new stars can form and re-grow a stellar disk: this structure can persist for a long time if not disrupted by subsequent massive merger events, whereas minor mergers are expected to only heat up the disk without markedly affecting its circularity distribution (Read et al., 2008). This scenario is supported, for example, by the analysis of data in our Milky Way (Belokurov et al., 2020).
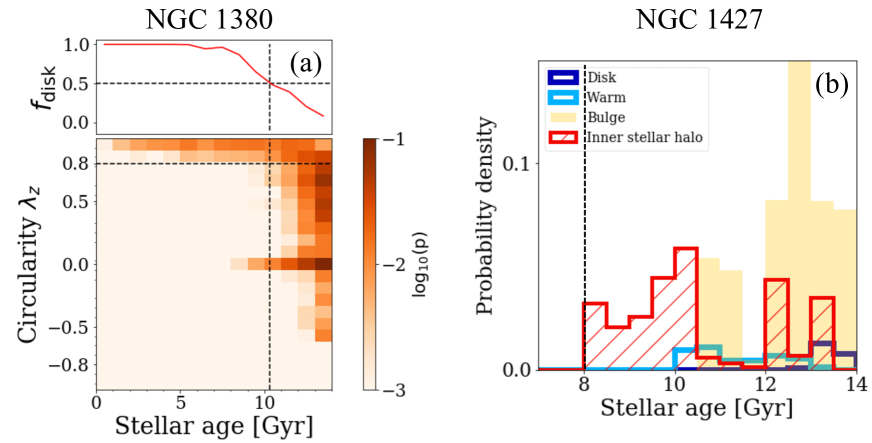
NGC 1380 has a massive dynamically-cold disk component. We study the distribution of stars in the circularity versus stellar age plane, , illustrated by Panel (a) of Figure 7 for our model of NGC 1380. At any given stellar age , we can calculate the fraction of disk-like orbits . Adopting as the transition from spheroid-dominated to disk-dominated regions, the transition time can be associated with the end of the last massive merger. This transition time can be well recovered by our model for the galaxies with a massive cold disk at the time of inspection, as is the case for NGC 1380 (see Appendix A). We find such a transition in our model of NGC 1380, as shown in Figure 7: for ages younger than Gyr, suddenly stars are only on cold orbits with , i.e., approaches unity, with the transition time of Gyr. We thus infer that the massive merger responsible for the build up of NGC 1380’s hot inner stellar halo ended Gyr ago. Note that the pre-existing cold disk of NGC 1380 was not fully destroyed by the merger, and the surviving disk mainly locates in the inner regions of the galaxy (see also panel b-1 of Figure 3).
NGC 1427 does not have a massive cold disk today, and so possibly it has not re-grown a massive disk after its most massive merger event. Instead, we find that the stars in its hot inner stellar halo are younger than most stars in the bulge; moreover, the hot inner stellar halo holds the youngest stars of the galaxy. According to our understanding of galaxy evolution, see above, inner-halo stars should have formed before the massive merger ended, either in a pre-existing disk of the main progenitor or in the merging companion before and during the merger, because of the triggering of star formation. The youngest stars in the hot inner stellar halo therefore set an upper-limit to the end time of the massive merger. Such a scenario is illustrated by a NGC 1427-like galaxy from TNG50 in the Appendix. From the stellar age distribution of the hot inner stellar halo of NGC 1427 we obtain (see Panel b of Figure 7) that the massive merger of NGC 1427 has likely ended Gyr ago.
NGC 1380 is located in the so-called north-south clump of the Fornax cluster (Iodice et al., 2019a; Nasonova et al., 2011), comprised of a group of galaxies. NGC 1427 is the brightest elliptical galaxy on the eastern side of the Fornax cluster. Both galaxies are thought to be accreted into the potential well of the massive cluster core more than 8 Gyr ago (Iodice et al., 2019a). The galaxy-galaxy merger frequency in cluster environments is expected to be low because of the high relative velocity of their members (Makino & Hut, 1997; De Lucia et al., 2004): it is therefore expected that most Fornax galaxies underwent their massive mergers before they fell into the Fornax cluster. The merger of NGC 1380 with its most massive satellite occurring Gyr ago is consistent with this scenario. Two other early-type galaxies in the same clump, NGC 1380A (FCC 177) and NGC 1381 (FCC 170), have also been suggested to have accreted a substantial fraction of stars Gyr ago (Pinna et al., 2019b, a; Poci et al., 2021). On the other hand, for NGC 1427 and considering that the merger process could last for Gyr, the constraint from the stellar age distribution of its hot inner stellar halo does allow the inferred merger event to have started before infall. Whereas we cannot set a strong lower-limit on the time of the ending of the most massive merger of NGC 1427, we notice that mergers in a cluster may still happen if two galaxies fell into the cluster within the same group (Tran et al., 2005; Delahaye et al., 2017; Watson et al., 2019).

5 Effects of cluster environment
Since both NGC 1380 and NGC 1427 are in the Fornax cluster, their internal structures might be altered by physical processes like ‘harassment’ or ‘tidal shocking’ in the cluster gravitational potential (e.g., Joshi et al., 2020). TNG50 covers a large variety of group/cluster environments, including ten clusters within the mass range of M⊙, similar to the Fornax cluster. We can hence directly check with TNG50 whether, and by how much, high-density environments affect the inner stellar halos of satellite galaxies.
In particular, we inspected all the satellite galaxies with M⊙ in the second most massive halo of TNG50, which has M⊙. By comparing the stellar orbit distribution of each galaxy at the time it fell into the cluster to its distribution at , we find that for of the galaxies, the hot inner stellar halo mass remains almost unchanged, with differences smaller than 0.1 dex. For the remaining of the galaxies, with relatively low mass and that fell into the cluster early, decreases significantly as these galaxies get strongly stripped by the cluster. There are a few galaxies whose slightly increases, mostly within 0.1 dex. For these systems, their pre-existing cold disks were heated up, possibly by harassment, with most of the stars becoming dynamically warm and a small fraction of them becoming hot. There are no satellite galaxies with a significantly hot inner stellar halo component induced after falling into the cluster, due to the fact that no massive mergers happen for these galaxies after falling into the cluster. The massive hot inner stellar halos of the two galaxies studied in this work are thus unlikely to be induced by either ‘harassment’ or ‘tidal shocking’ in the cluster environment.
To further illustrate the possible effects of cluster environments on our results, we show the correlations of the hot inner stellar halo mass vs. accreted stellar masses and for the central and satellite galaxies from TNG50 separately. We use all TNG50 galaxies with M⊙, except 37 with ongoing mergers – the same sample as used in Zhu et al. (2021). We quantify the stripped mass of a galaxy by comparing its present-day stellar mass with the maximum stellar mass it has ever reached . All satellite galaxies with are considered to be strongly stripped. In Figure 8, we can see that the correlations are almost the same for central and satellite galaxies except the strongly stripped ones. Most of the strongly stripped galaxies have M⊙, they tend to be located below the median of the correlations, and some of them are located significantly below the lower ’’ curves.
Instead of and , we can quantify a merger by the secondary progenitor mass defined as the maximum of the stellar mass it has ever reached before the merger ended (Rodriguez-Gomez et al., 2016). We use to indicate the stellar mass of the most massive secondary progenitor a galaxy has ever accreted, and to indicate the sum of all the secondary progenitors more massive than stellar mass of the current galaxy. is highly correlated and larger than by a factor of for all the central galaxies and for all the satellite galaxies that are not strongly stripped333A merger could last for 1-2 Gyr during which star formation and disruption can continue. Thus stars accreted from the secondary progenitor are more than it has had at any moment.. On the other hand, for the strongly stripped galaxies, calculated from the current galaxy are significantly smaller than the original accreted stellar mass, and also smaller than . In Figure 9, we show the correlations by using and instead of and . The strongly stripped galaxies, which were located below the curves in Figure 8, move upward, and tend to follow the relations in Figure 9. Some of the strongly stripped galaxies become outliers above the upper ’’ curves.
In summary, for all central and most satellite galaxies, and are equally valid to quantify their past merger events, while defined in the current galaxy is a good indicator for the merger mass. However, if a satellite galaxy is strongly stripped, then both and can be affected, and the former more than the latter. The accreted stellar mass inferred from the median correlation in Figure 8 could be higher than it has in the current galaxy, but lower than the original it once had. Similarly, inferred from the median correlation in Figure 9 is likely to be under-estimated if the hot inner stellar halo was strongly stripped.
For our two galaxies in the Fornax cluster, NGC 1380 is a massive lenticular galaxy with , with median size for its stellar mass, and with an extended disk. Its outer isophotoes at arcmin appear twisted with respect to the inner more disky regions (Iodice et al., 2019b), which could be the result of the major merger. All these features suggest that NGC 1380 is unlikely to be strongly stripped and the results presented above should not be affected by environmental effects. NGC 1427 is a massive elliptical galaxy with , also with median size for its stellar mass, and with a massive hot inner stellar halos with . The outer isophotes of NGC 1427 appear asymmetric, suggesting it could be partly stripped. However, its inner regions – and thus also the hot inner stellar halo – are unlikely to be significantly affected. We expect that is still a good indicator for its past merger mass, although the ex-situ stellar mass in the current galaxy might actually be lower.
| Galaxy name | Time of Merger | Redshift | |||
|---|---|---|---|---|---|
| Milky Way | M⊙ | M⊙ | Gyr ago | - | |
| Andromeda | M⊙ | M⊙ | Gyr ago | - | |
| NGC 1380 | M⊙ | M⊙ | Gyr ago | M⊙ | |
| NGC 1427 | M⊙ | M⊙ | Gyr ago | M⊙ |
6 Summary
We discovered that the two early-type galaxies NGC 1380 and NGC 1427 in the Fornax cluster both underwent an ancient massive merger, and constrained the merger mass and time.
By applying our recently-developed population-orbit superposition method to the observed luminosity density, stellar kinematic, age and metallicity maps, we obtained the stellar orbits, age and metallicity distribution of each galaxy. We then decomposed each galaxy into four components, which included a dynamically hot inner stellar halo as a relic of past massive mergers. By comparing to analogues from cosmological galaxy simulations, chiefly TNG50, we used the robustly measured mass of the hot inner stellar halo to infer the stellar mass from the ever-accreted most massive satellite , as well as the total ex-situ stellar mass for these two galaxies. We further found that the last merger of NGC 1380 ended Gyr ago based on the stellar age distribution of its re-grown dynamically cold disk, in a way comparable to how the last massive merger time of the Milky Way could be inferred (Belokurov et al., 2020). The merger in NGC 1427 ended at Gyr ago based on the stellar populations in its hot inner stellar halo, in a way comparable to how the merger time in M31 was estimated (D’Souza & Bell, 2018b). While the quantification of the satellite masses and merger times in both the Milky Way and M31 rely on observations of individual stars, we have overcome these limitations by applying our new population-orbit superposition method to IFU data.
In Table 1, we list the mass and time of the most massive merger events of NGC 1380 and NGC 1427 in comparison with those of the Milky Way and M31. The Milky Way, M31 and NGC 1380 are the only three galaxies for which both the merger mass and time have been quantitatively uncovered so far. The mass of the most massive merger of NGC 1427 is comparable to that of M31, while the mass of the most massive merger of NGC 1380 is twice as large. However, the mergers in NGC 1380 and NGC 1427 happened much earlier than in M31. Given the subsequent evolution in the cluster environment, the high encounter velocities and long relaxation times have resulted in smoother structural distributions in NGC 1380 and NGC 1427 than in M31. The most massive merger in the Milky Way is similarly old, but is smaller with stellar mass of M⊙, which is only about per cent of NGC 1380’s and per cent of NGC 1427’s progenitor satellite stellar mass. The merger event in NGC 1380 is the oldest and most massive one uncovered in nearby galaxies so far.
Similar IFU data as we used for NGC 1380 and NGC 1427 could be obtained for hundreds of nearby galaxies through observations with instruments like MUSE. Our discovery thus opens a new way to quantify the merger history of nearby galaxies and so place important constraints on the assembly of galaxies as a function of environment and in a cosmological context.
Acknowledgements.
We are grateful for discussions with Illustris TNG team members Dylan Nelson, Lars Hernquist, Ruediger Pakmor and Mark Vogelsberger. LZ acknowledges the support from the National Key RD Program of China under grant No. 2018YFA0404501 and National Natural Science Foundation of China under grant No. Y945271001. GvdV acknowledges funding from the European Research Council (ERC) under the European Union’s Horizon 2020 research and innovation programme under grant agreement No 724857 (Consolidator Grant ArcheoDyn). EMC is supported by MIUR grant PRIN 2017 20173ML3WW001 and Padua University grants DOR1885254/18, DOR1935272/19, and DOR2013080/20. FP, IMN, and JFB acknowledge support through the RAVET project by the grant PID2019-107427GB-C32 from the Spanish Ministry of Science, Innovation and Universities (MCIU), and through the IAC project TRACES which is partially supported through the state budget and the regional budget of the Consejería de Economía, Industria, Comercio y Conocimiento of the Canary Islands Autonomous Community. TNG50 was realised with compute time granted by the Gauss Centre for Super-computing (GCS), under the GCS Large-Scale Project GCS-DWAR (2016; PIs Nelson/Pillepich).References
- Beasley et al. (2018) Beasley, M. A., Trujillo, I., Leaman, R., & Montes, M. 2018, Nature, 555, 483
- Belokurov et al. (2018) Belokurov, V., Erkal, D., Evans, N. W., Koposov, S. E., & Deason, A. J. 2018, MNRAS, 478, 611
- Belokurov et al. (2020) Belokurov, V., Sanders, J. L., Fattahi, A., et al. 2020, MNRAS, 494, 3880
- Blakeslee et al. (2009) Blakeslee, J. P., Jordán, A., Mei, S., et al. 2009, ApJ, 694, 556
- Bland-Hawthorn & Gerhard (2016) Bland-Hawthorn, J. & Gerhard, O. 2016, ARA&A, 54, 529
- Boecker et al. (2020) Boecker, A., Leaman, R., van de Ven, G., et al. 2020, MNRAS, 491, 823
- Boylan-Kolchin et al. (2008) Boylan-Kolchin, M., Ma, C.-P., & Quataert, E. 2008, MNRAS, 383, 93
- Bryant et al. (2015) Bryant, J. J., Owers, M. S., Robotham, A. S. G., et al. 2015, MNRAS, 447, 2857
- Bundy et al. (2015) Bundy, K., Bershady, M. A., Law, D. R., et al. 2015, ApJ, 798, 7
- Cappellari (2002) Cappellari, M. 2002, MNRAS, 333, 400
- Cappellari (2017) Cappellari, M. 2017, MNRAS, 466, 798
- Cappellari & Copin (2003) Cappellari, M. & Copin, Y. 2003, MNRAS, 342, 345
- Cappellari & Emsellem (2004) Cappellari, M. & Emsellem, E. 2004, PASP, 116, 138
- Cappellari et al. (2011) Cappellari, M., Emsellem, E., Krajnović, D., et al. 2011, MNRAS, 413, 813
- Corbelli et al. (2010) Corbelli, E., Lorenzoni, S., Walterbos, R., Braun, R., & Thilker, D. 2010, A&A, 511, A89
- Correa et al. (2017) Correa, C. A., Schaye, J., Clauwens, B., et al. 2017, MNRAS, 472, L45
- Crain et al. (2015) Crain, R. A., Schaye, J., Bower, R. G., et al. 2015, MNRAS, 450, 1937
- Davison et al. (2021a) Davison, T. A., Kuntschner, H., Husemann, B., et al. 2021a, MNRAS, 502, 2296
- Davison et al. (2021b) Davison, T. A., Norris, M. A., Leaman, R., et al. 2021b, MNRAS, 507, 3089
- De Lucia et al. (2004) De Lucia, G., Kauffmann, G., Springel, V., et al. 2004, MNRAS, 348, 333
- de Zeeuw et al. (2002) de Zeeuw, P. T., Bureau, M., Emsellem, E., et al. 2002, MNRAS, 329, 513
- Delahaye et al. (2017) Delahaye, A. G., Webb, T. M. A., Nantais, J., et al. 2017, ApJ, 843, 126
- D’Souza & Bell (2018a) D’Souza, R. & Bell, E. F. 2018a, Nature Astronomy, 2, 737
- D’Souza & Bell (2018b) D’Souza, R. & Bell, E. F. 2018b, MNRAS, 474, 5300
- Du et al. (2021) Du, M., Ho, L. C., Debattista, V. P., et al. 2021, ApJ, 919, 135
- Du et al. (2019) Du, M., Ho, L. C., Zhao, D., et al. 2019, ApJ, 884, 129
- Dutton & Macciò (2014) Dutton, A. A. & Macciò, A. V. 2014, MNRAS, 441, 3359
- Falcón-Barroso et al. (2011a) Falcón-Barroso, J., Sánchez-Blázquez, P., Vazdekis, A., et al. 2011a, A&A, 532, A95
- Falcón-Barroso et al. (2011b) Falcón-Barroso, J., Sánchez-Blázquez, P., Vazdekis, A., et al. 2011b, A&A, 532, A95
- Fattahi et al. (2019) Fattahi, A., Belokurov, V., Deason, A. J., et al. 2019, MNRAS, 484, 4471
- Forbes et al. (2016) Forbes, D. A., Romanowsky, A. J., Pastorello, N., et al. 2016, MNRAS, 457, 1242
- Grand et al. (2020) Grand, R. J. J., Kawata, D., Belokurov, V., et al. 2020, Monthly Notices of the Royal Astronomical Society, 497, 1603
- Hammer et al. (2018) Hammer, F., Yang, Y. B., Wang, J. L., et al. 2018, MNRAS, 475, 2754
- Harmsen et al. (2017) Harmsen, B., Monachesi, A., Bell, E. F., et al. 2017, MNRAS, 466, 1491
- Helmi (2020) Helmi, A. 2020, ARA&A, 58, 205
- Helmi et al. (2018) Helmi, A., Babusiaux, C., Koppelman, H. H., et al. 2018, Nature, 563, 85
- Ibata et al. (2021) Ibata, R., Malhan, K., Martin, N., et al. 2021, ApJ, 914, 123
- Ibata et al. (2014) Ibata, R. A., Lewis, G. F., McConnachie, A. W., et al. 2014, ApJ, 780, 128
- Iodice et al. (2016) Iodice, E., Capaccioli, M., Grado, A., et al. 2016, ApJ, 820, 42
- Iodice et al. (2019a) Iodice, E., Sarzi, M., Bittner, A., et al. 2019a, A&A, 627, A136
- Iodice et al. (2019b) Iodice, E., Spavone, M., Capaccioli, M., et al. 2019b, A&A, 623, A1
- Jin et al. (2020) Jin, Y., Zhu, L., Long, R. J., et al. 2020, MNRAS, 491, 1690
- Joshi et al. (2020) Joshi, G. D., Pillepich, A., Nelson, D., et al. 2020, MNRAS, 496, 2673
- Kroupa (2002) Kroupa, P. 2002, Science, 295, 82
- Kruijssen et al. (2019) Kruijssen, J. M. D., Pfeffer, J. L., Reina-Campos, M., Crain, R. A., & Bastian, N. 2019, MNRAS, 486, 3180
- Majewski et al. (2003) Majewski, S. R., Skrutskie, M. F., Weinberg, M. D., & Ostheimer, J. C. 2003, ApJ, 599, 1082
- Makino & Hut (1997) Makino, J. & Hut, P. 1997, The Astrophysical Journal, 481, 83
- Marinacci et al. (2018) Marinacci, F., Vogelsberger, M., Pakmor, R., et al. 2018, MNRAS, 480, 5113
- Martig et al. (2021) Martig, M., Pinna, F., Falcón-Barroso, J., et al. 2021, MNRAS, 508, 2458
- Martín-Navarro et al. (2019) Martín-Navarro, I., Lyubenova, M., van de Ven, G., et al. 2019, A&A, 626, A124
- McAlpine et al. (2016) McAlpine, S., Helly, J. C., Schaller, M., et al. 2016, Astronomy and Computing, 15, 72
- Merritt et al. (2016) Merritt, A., van Dokkum, P., Abraham, R., & Zhang, J. 2016, ApJ, 830, 62
- Naiman et al. (2018) Naiman, J. P., Pillepich, A., Springel, V., et al. 2018, MNRAS, 477, 1206
- Nasonova et al. (2011) Nasonova, O. G., de Freitas Pacheco, J. A., & Karachentsev, I. D. 2011, A&A, 532, A104
- Navarro et al. (1997) Navarro, J. F., Frenk, C. S., & White, S. D. M. 1997, ApJ, 490, 493
- Nelson et al. (2019a) Nelson, D., Pillepich, A., Springel, V., et al. 2019a, MNRAS, 490, 3234
- Nelson et al. (2018) Nelson, D., Pillepich, A., Springel, V., et al. 2018, MNRAS, 475, 624
- Nelson et al. (2019b) Nelson, D., Springel, V., Pillepich, A., et al. 2019b, Computational Astrophysics and Cosmology, 6, 2
- Pillepich et al. (2018) Pillepich, A., Nelson, D., Hernquist, L., et al. 2018, MNRAS, 475, 648
- Pillepich et al. (2019) Pillepich, A., Nelson, D., Springel, V., et al. 2019, MNRAS, 490, 3196
- Pinna et al. (2019a) Pinna, F., Falcón-Barroso, J., Martig, M., et al. 2019a, A&A, 625, A95
- Pinna et al. (2019b) Pinna, F., Falcón-Barroso, J., Martig, M., et al. 2019b, A&A, 623, A19
- Poci et al. (2021) Poci, A., McDermid, R. M., Lyubenova, M., et al. 2021, arXiv e-prints, arXiv:2102.02449
- Poci et al. (2019) Poci, A., McDermid, R. M., Zhu, L., & van de Ven, G. 2019, MNRAS, 487, 3776
- Pulsoni et al. (2020) Pulsoni, C., Gerhard, O., Arnaboldi, M., et al. 2020, A&A, 641, A60
- Read et al. (2008) Read, J. I., Lake, G., Agertz, O., & Debattista, V. P. 2008, MNRAS, 389, 1041
- Rejkuba et al. (2011) Rejkuba, M., Harris, W. E., Greggio, L., & Harris, G. L. H. 2011, A&A, 526, A123
- Rodriguez-Gomez et al. (2016) Rodriguez-Gomez, V., Pillepich, A., Sales, L. V., et al. 2016, MNRAS, 458, 2371
- Rodriguez-Gomez et al. (2019) Rodriguez-Gomez, V., Snyder, G. F., Lotz, J. M., et al. 2019, MNRAS, 483, 4140
- Salvatier et al. (2016) Salvatier, J., WieckiaAA, T. V., & Fonnesbeck, C. 2016, PyMC3: Python probabilistic programming framework, Astrophysics Source Code Library, record ascl:1610.016
- Sánchez et al. (2012) Sánchez, S. F., Kennicutt, R. C., Gil de Paz, A., et al. 2012, A&A, 538, A8
- Santucci et al. (2022) Santucci, G., Brough, S., van de Sande, J., et al. 2022, arXiv e-prints, arXiv:2203.03648
- Sarzi et al. (2018) Sarzi, M., Iodice, E., Coccato, L., et al. 2018, A&A, 616, A121
- Schaye et al. (2015) Schaye, J., Crain, R. A., Bower, R. G., et al. 2015, MNRAS, 446, 521
- Springel et al. (2018) Springel, V., Pakmor, R., Pillepich, A., et al. 2018, MNRAS, 475, 676
- Tran et al. (2005) Tran, K.-V. H., van Dokkum, P., Franx, M., et al. 2005, ApJ, 627, L25
- Tsatsi et al. (2015) Tsatsi, A., Macciò, A. V., van de Ven, G., & Moster, B. P. 2015, ApJ, 802, L3
- van den Bosch et al. (2008) van den Bosch, R. C. E., van de Ven, G., Verolme, E. K., Cappellari, M., & de Zeeuw, P. T. 2008, MNRAS, 385, 647
- van der Marel & Franx (1993) van der Marel, R. P. & Franx, M. 1993, ApJ, 407, 525
- Vazdekis et al. (2015) Vazdekis, A., Coelho, P., Cassisi, S., et al. 2015, MNRAS, 449, 1177
- Viaene et al. (2019) Viaene, S., Sarzi, M., Zabel, N., et al. 2019, A&A, 622, A89
- Watson et al. (2019) Watson, C., Tran, K.-V., Tomczak, A., et al. 2019, ApJ, 874, 63
- Williams et al. (2013) Williams, C. C., Giavalisco, M., Cassata, P., et al. 2013, The Astrophysical Journal, 780, 1
- Yu et al. (2021) Yu, S., Bullock, J. S., Klein, C., et al. 2021, MNRAS, 505, 889
- Zhu et al. (2021) Zhu, L., Pillepich, A., van de Ven, G., et al. 2021, arXiv e-prints, arXiv:2110.13172
- Zhu et al. (2020) Zhu, L., van de Ven, G., Leaman, R., et al. 2020, MNRAS, 496, 1579
- Zhu et al. (2018a) Zhu, L., van de Ven, G., Méndez-Abreu, J., & Obreja, A. 2018a, MNRAS, 479, 945
- Zhu et al. (2018b) Zhu, L., van de Ven, G., van den Bosch, R., et al. 2018b, Nature Astronomy, 2, 233
- Zhu et al. (2018c) Zhu, L., van den Bosch, R., van de Ven, G., et al. 2018c, MNRAS, 473, 3000
Appendix A Method validation
We previously tested the ability of our population-orbit method to recover the age and metallicity properties of different orbital components (Zhu et al. 2020). However, there we did so only for simulated spiral galaxies that do not have without a significant hot inner stellar halo within the data coverage. In this Appendix, we extend such tests.
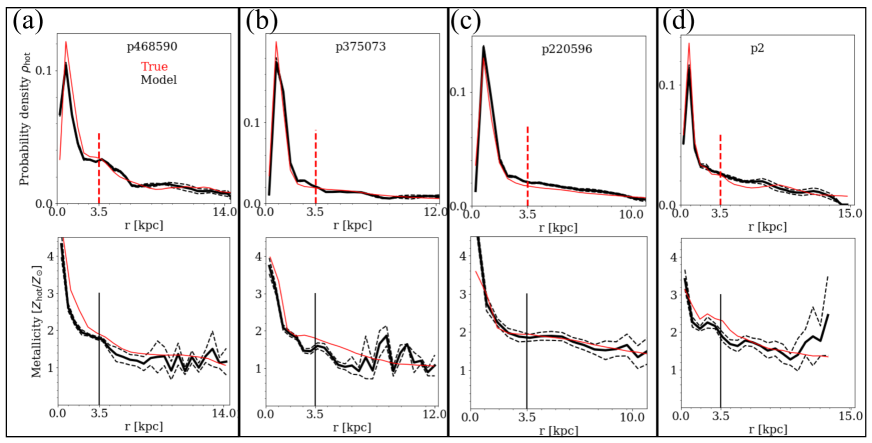
The major degeneracy that our model could present is between the disk and the halo, as a face-on disk might look similar to a halo in the kinematic maps. NGC 1427 has a small disk in the inner regions with . The disk fraction in the outer regions is very small. Therefore, the disk-halo degeneracy should not be a problem for NGC 1427. For NGC 1380, on the other hand, we have performed a series of tests using mock data from four simulated galaxies from TNG50: TNG50 468590, TNG50 375073, TNG50 2, TNG50 220596, which are chosen to have similar hot inner stellar halo mass and disk mass as NGC 1380.
The mock data are created in a similar way as done before (Zhu et al. 2020), but restricted to have the same inclination angle , similar data coverage and data quality as for NGC 1380. We first project a simulated galaxies into the observational plane with inclination angle , place it at a distance of Mpc, and observe it with a pixel size of 1″. Then we sum up the mass of the stellar particles within each pixel to obtain a surface mass density map (i.e., a mock image of the galaxy), by assuming that light equals mass.
We choose the area with ″ and ″ to create the kinematic maps. This data coverage is chosen to be similar to the observed kinematic maps of NGC 1380, where is along the major axis and is along the minor axis of the galaxy. According to the number of stellar particles in each pixel, we perform a Voronoi binning process to reach a target , assuming Poission noise . Given all the particles in each Voronoi bin, we derive the mass-weighted mean velocity, velocity dispersion, , and by fitting a GH function (van der Marel & Franx 1993) to the stellar line-of-sight velocity distribution (LOSVD), as well as we calculate mass-weighted average age () and metallicity (). Note that here the mean velocity and velocity dispersion are not directly calculated from the LOSVD, but they are actually the parameters of the base Gaussian in the GH function.
After the Voronoi binning, the spatial resolution of our mock data is pc, which is comparable to that of the kinematic data (binned with target ) from the Fornax 3D project (Sarzi et al. 2018). We use a simple function inferred from the CALIFA data to construct the errors for kinematic maps (Tsatsi et al. 2015), with the errors proportional to , where , and is the number of pixels in a Voronoi bin. We have larger errors for kinematics in the area with lower surface density, where more pixels are included in each bin in order to reach the target . For age and metallicity, the tests on the full-spectrum fitting to mock spectra of return random errors of (Pinna et al. 2019b). The errors could be lower for spectra with higher , while it could be higher for real spectra due to possible systematic effects. As proof-of-concept, we adopt relative errors of for age and metallicity. So, to include the noise, the kinematics, age and metallicity maps are perturbed by random numbers, normally distributed with dispersions equal to the observational errors. We find that the error maps of the mock data are similar to the data of MUSE observations for galaxies in the Fornax 3D project (Sarzi et al. 2018).
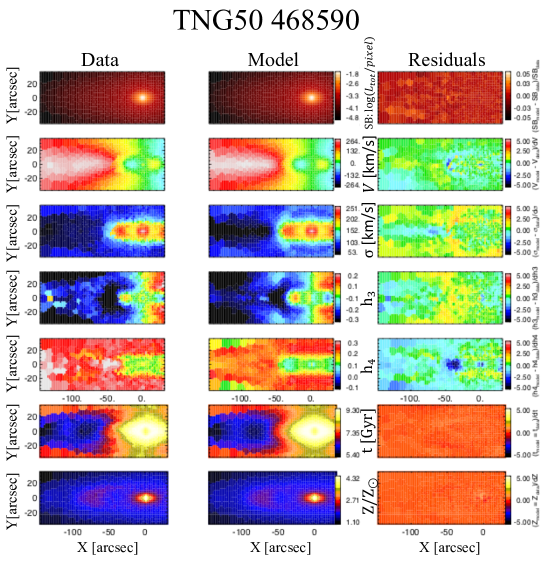
We take each mock data set as a real observed galaxy and apply the population-orbit superposition model to it. In Figure 10, we show the mock data created from TNG50 468590 and our best-fitting population-orbit model to it. The model fits well the data in great detail.
A.1 Recovery of the four components.
| Disk | Warm | Bulge | hot inner stellar halo | |
|---|---|---|---|---|
| TNG50 468590 | ||||
| Luminosity fraction | ||||
| Stellar age [Gyr] | ||||
| Metallicity [] | ||||
| TNG50 375073 | ||||
| Luminosity fraction | ||||
| Stellar age [Gyr] | ||||
| Metallicity [] | ||||
| TNG50 220596 | ||||
| Luminosity fraction | ||||
| Stellar age [Gyr] | ||||
| Metallicity [] | ||||
| TNG50 2 | ||||
| Luminosity fraction | ||||
| Stellar age [Gyr] | ||||
| Metallicity [] |
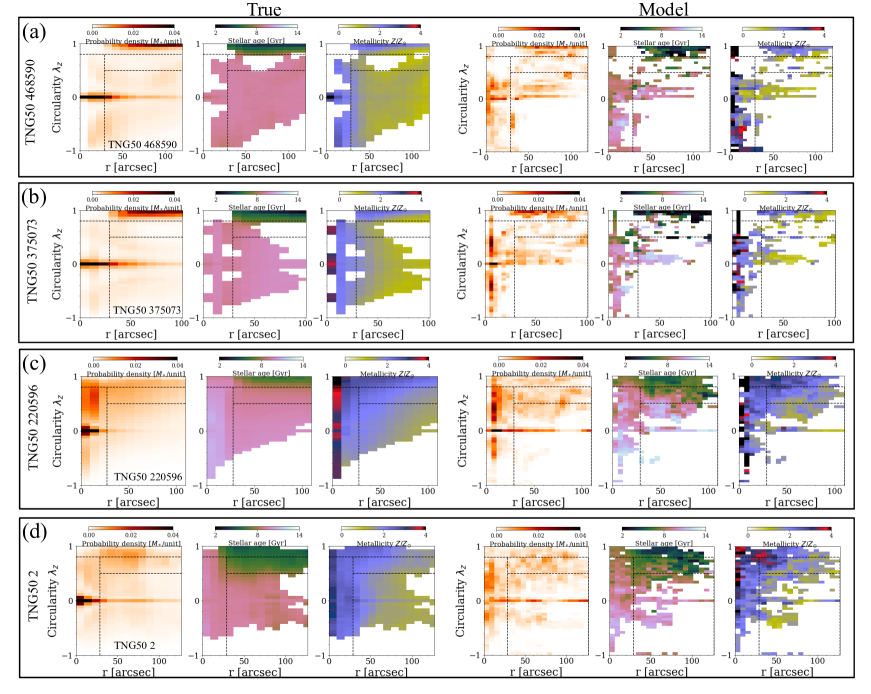
In Figure 11, we show that the probability density distribution , age distribution , and metallicity distribution directly measured from the simulations are well matched by those extracted from the best-fitting population-orbit models. There is a discrepancy in the inner parts, where the bulge in the simulated galaxies is dominated by box orbits with whereas part of the box orbits in the model are represented actually by tube orbits with non-zero but opposite values of . The latter, however, does not affect our division into four components: disk (), bulge (, ), warm component (, ), and hot inner stellar halo (, ), where kpc is chosen for all cases. The mass fraction, average age and metallicity of the disk, bulge, warm component, and hot inner stellar halo within a radius for the four simulated galaxies are given in Table 2. Our model excellently recovers the mass fraction, age and metallicity of the hot inner stellar halo, even though the statistical errors obtained from the scatter of the best-fitting models are too small to cover the true values in some cases. The absolute difference between the true values and our model recovered mean values are still small.
In Figure 12, we display the probability density distribution and average metallicity as a function of radius by summing all the hot orbits with . The red curves are directly calculated from the simulations, while the thick and dashed black curves are the mean and scatter from our best-fitting models. The model generally matches the radial profiles for both the probability density and metallicity. Both and sharply decrease from an inner peak, and flatten at larger radii.
From the above analysis, we find that, although our data have limited extension along the galaxy minor axis, we still are able to uncover the intrinsic stellar orbit distributions quite well. This is thanks to the high data quality that provide reliable high-order GH coefficients and , which in turn encode the information of the combination of disk and hot inner stellar halo. The age and metallicity of stellar orbits in the hot inner stellar halo from our model still have relatively large fluctuations. Having data extending more along the galaxy minor axis should improve the constraints on the stellar age and metallicity distribution of the hot inner stellar halo.
A.2 Recovery of the merger’s end time.
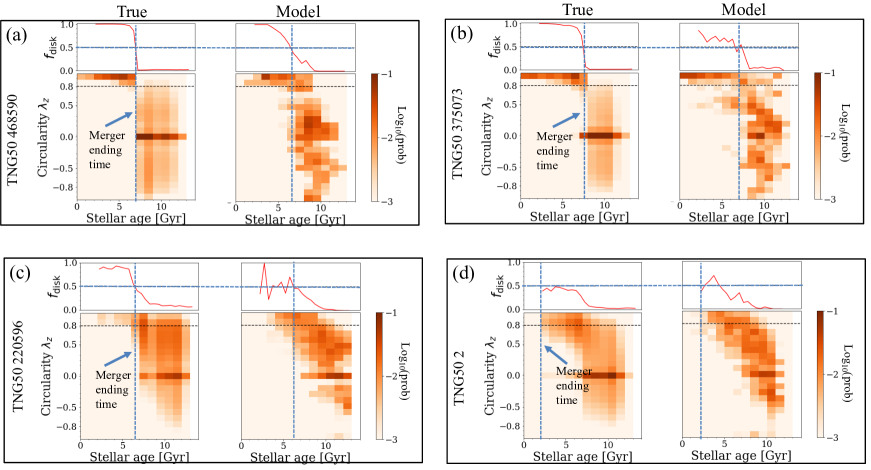
We further check how well we can recover the correlation between stellar age and circularity . In Figure 13, we show the probability density of orbits in the circularity versus stellar age , , of the four simulated galaxies elected for the testing (panels a-d). In each panel, the left plot gives the true distribution from the simulation and the right plot shows our best-fitting model. We know every aspect of the merger history of the simulated galaxies: the real end time of the last massive merger of each simulated galaxy is marked in Figure 13. In three of the four galaxies, i.e., TNG50 468590, TNG50 375073, TNG50 220596, there is substantial star formation after the last massive merger. Stars formed after the last massive mergers rarely ended on non-disk orbits. In all these cases, a sharp transition of stars from non-disk dominated orbits to disk dominated orbits can be clearly identified: therefore we can confidently associate this transition to the last massive merger end time. The time of is a good proxy for the merger end time.
In practise, is well recovered by our model in TNG50 468590 and TNG50 375073, which have massive cold disks formed after the last massive merger, although it is not as sharp as in the simulation data due to uncertainties of the stellar age of orbits in our model. In TNG50 220596, only a small fraction of disk formed after the merger: even though our model generally matches the distribution , the transition time is hard to recover. In TNG50 2, there is no disk formed after the last merger: throughout the stellar age range, the cold disk never becomes dominating. The merger end time is consistent with the star formation end time. Our model generally recovers the distribution , and the star formation end time. In both TNG50 220596 and TNG50 2, a massive merger occurring at low redshift partially heated up the previous cold disk and produced a significant warm component. The stars in such a warm component exhibit a wide range of stellar ages, similar to that of the remnant cold orbits (Figure 13). However they are on average younger than the stars on dynamical hot orbits with . While NGC 1380 has a massive cold disk, which is younger than any other component, the warm component in NGC 1380 is as old as the stars on hot orbits, like those in TNG50 468590 and 375073.
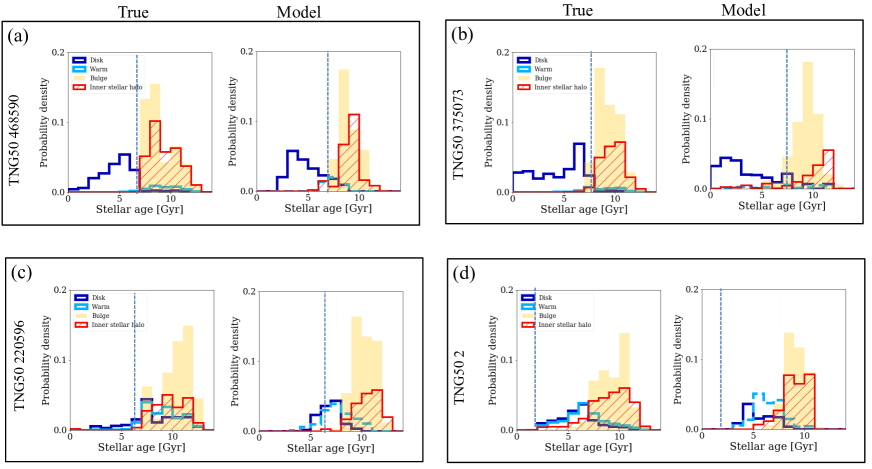
In Figure 14, we analyse the recovery of age distribution of the four components. In the left plot of each galaxy, we show the stellar age distribution of particles belonging to each of the four components in the simulation. In the right plot, we show the stellar age distribution of orbital bundles belonging to each component from our best-fitting models. Our model is able to roughly recover the true age distribution of each component.
In these four simulated galaxies, inner-halo stars are old and disk stars are young: in some cases, e.g., TNG50 468590 and TNG50 375093, our model introduces some young stars in the inner-halo due to the degeneracy with disk. Similarly for NGC 1380, we get a small fraction of inner-halo stars with Gyr, which are likely induced by such degeneracy. NGC 1380 is thus still consistent with the scenario that the inner-halo stars are formed before the merger end time of Gyr.
In these four simulated galaxies, disk is the youngest component, the youngest stars in the disk being 0, 0, 2, and 2 Gyr old in TNG50 468590, TNG50 375073, TNG50 220596, TNG50 2, respectively: from the best-fitting model, we obtain 2, 0, 4, and 3 Gyr. The declination of probability density toward younger ages is sharper in our model than in the real distribution from the simulation. Similarly for the hot inner stellar halo in NGC 1427, which is the youngest component in that galaxy. The star formation end time of 8 Gyr obtained by our model is likely an upper limit, and the real star formation end time could be 1-2 Gyr younger. So the merger end time of Gyr is a relaxed upper limit.
Appendix B Uncertainties on the stellar mass of the hot inner stellar halo
We have shown that the mass fraction of the hot inner stellar halo is well recovered by our population-orbit superposition model fitted to the mock data of NGC 1380-like simulated galaxies from TNG50. The mass fractions of the hot inner stellar halo of the four TNG50 test galaxies is 0.333, 0.221, 0.214, and 0.30, respectively: we get , , and from the best-fitting models. Here the error is the statistical error taken scatter of the best-fitting models. The statistical error is very small, and the true value is not always covered within the statistical error. As the absolute difference between the true and model-estimated values is 0.018, 0.007, 0.01, and 0.03 for the four simulated galaxies, we consider the average of these four values as a systematic error, which gives 0.016. For NGC 1380, we obtained the luminosity fraction of hot inner stellar halo within as : considering a systematic error of 0.016, we have . The error of 0.017 is determined by , where is the statistical error and is the systematic error. For NGC 1427, we obtained the luminosity fraction of hot inner stellar halo within as , and considering a systematic error of 0.016, we have .
Whereas orbit probabilities in the simulated galaxies are mass-weighted, those for NGC 1380 and NGC 1427 are -band luminosity weighted. For NGC 1380, under the simplest assumption of best-fitting constant stellar mass-to-light ratio M⊙/L⊙ from our dynamical models, we estimate M⊙. The uncertainty is calculated by the error propagation formula considering the uncertainties in and . Similarly for NGC 1427, we arrive at M⊙ with given by our dynamical model. will be used throughout to infer the masses of the mergers.
In NGC 1380, we know from a previous study on stellar population synthesis that varies from M⊙/L⊙ in the bulge-dominated inner regions to M⊙/L⊙ in the inner-stellar-halo-dominated outer regions by considering a variable IMF (Martín-Navarro et al. 2019). The adopted error is the scatter of in the corresponding regions. We tested in previous work (Zhu et al. 2018c) that assuming a constant mass-to-light ratio (even if it actually varies) to infer the gravitational potential does not affect the stellar orbit distribution in the dynamical model (Zhu et al. 2018c; Poci et al. 2019), and thus does not affect the luminosity fraction of hot inner stellar halo . Furthermore, the ratios from stellar population synthesis in the halo-dominated outer regions are roughly consistent with the ratios inferred from our dynamical model. With M⊙/L⊙, we have M⊙, which is still within of our quoted reference value.
Appendix C A NGC 1427-like galaxy in TNG50
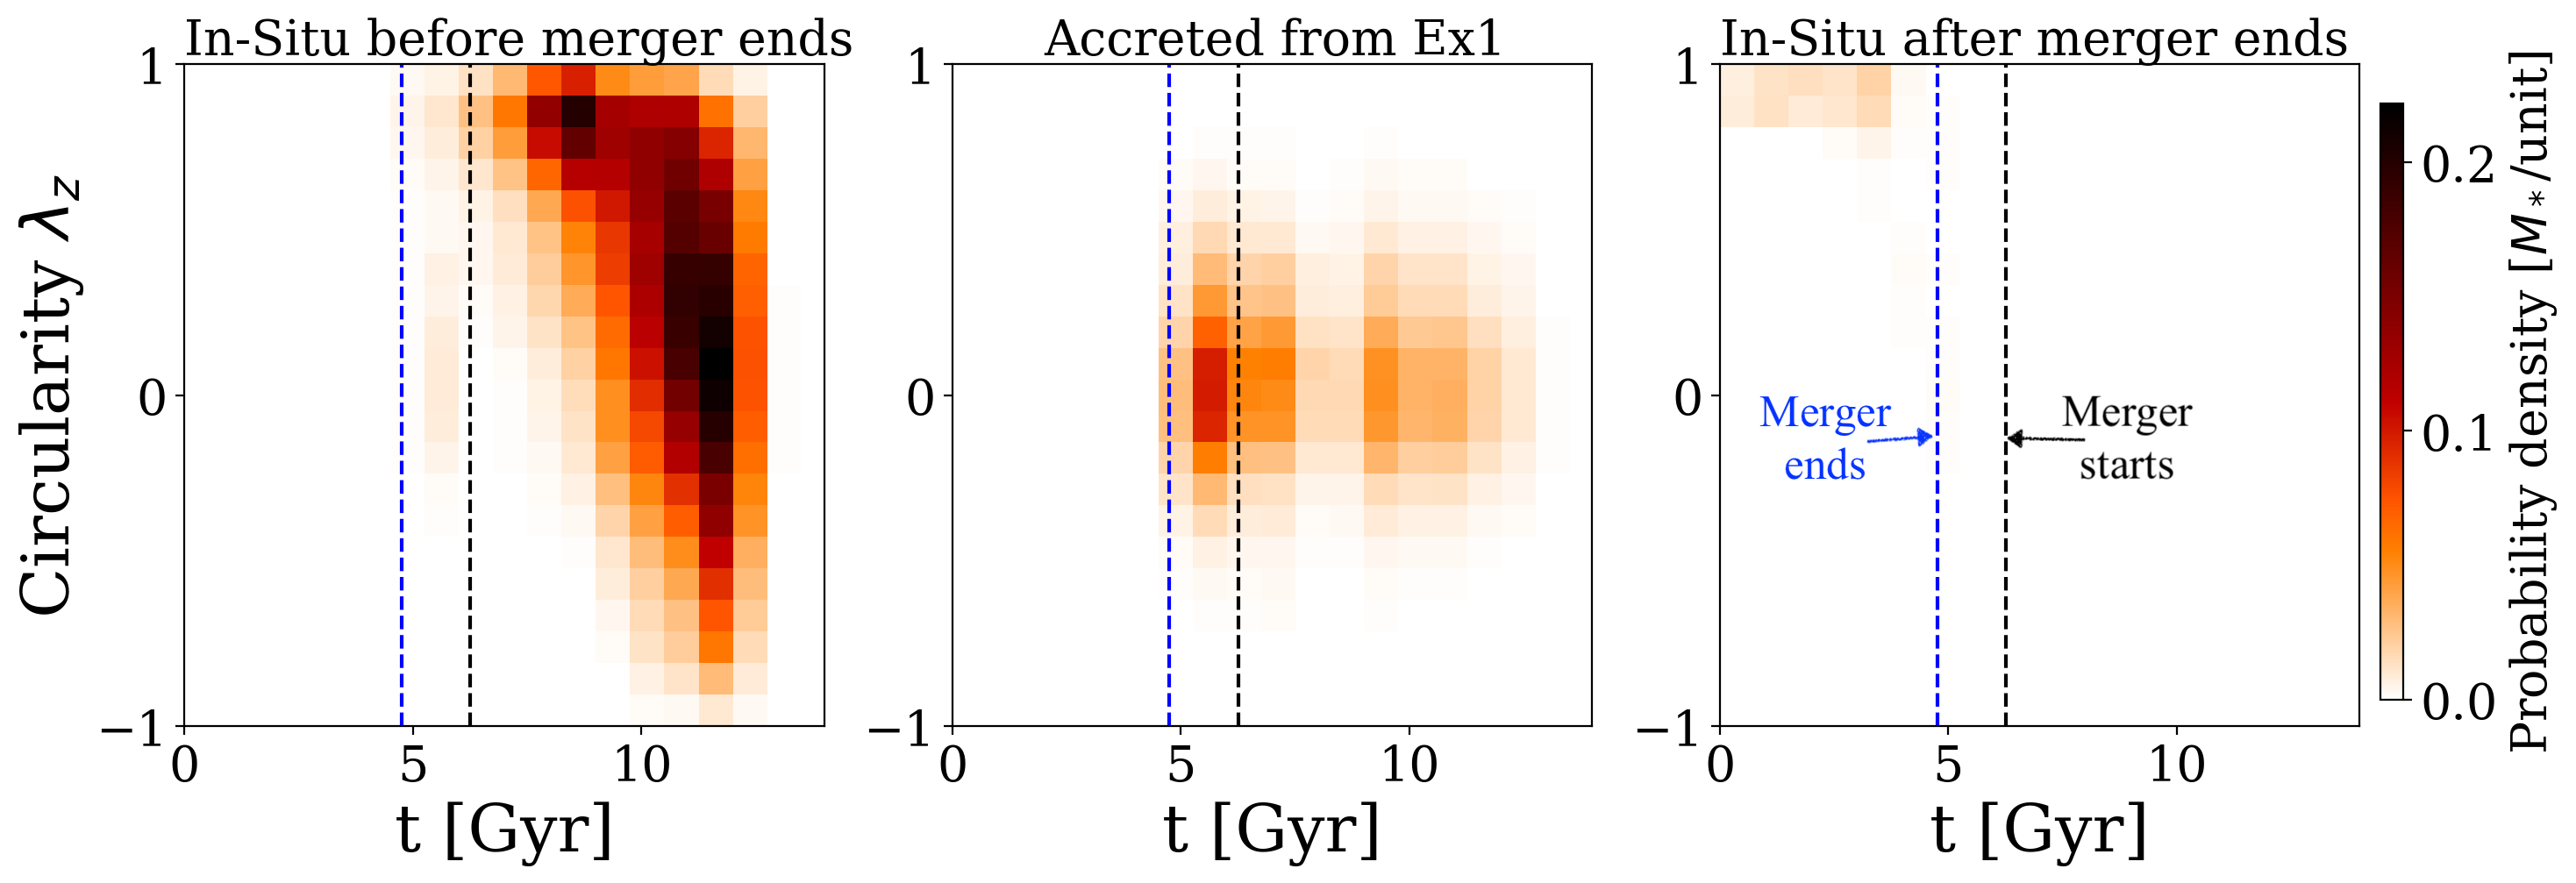
NGC 1427 does not have a significant cold disk and its hot inner stellar halo is younger than the bulge, which is different from NGC 1380. While the galaxies we chose for case studies in Zhu et al. (2021) are all NGC 1380 analogues, here we present a NGC 1427-like galaxy taken from TNG50. About of TNG50 galaxies have hot inner stellar halos younger than bulges. One of these is TNG50 465255 with M⊙ , kpc, and a hot inner stellar halo mass of M⊙. The galaxy has experienced a massive merger started at Gyr and ended at Gyr with a stellar mass accreted from the secondary progenitor of M⊙. No other merger more massive than happened after that. The total ex-situ stellar mass is M⊙.
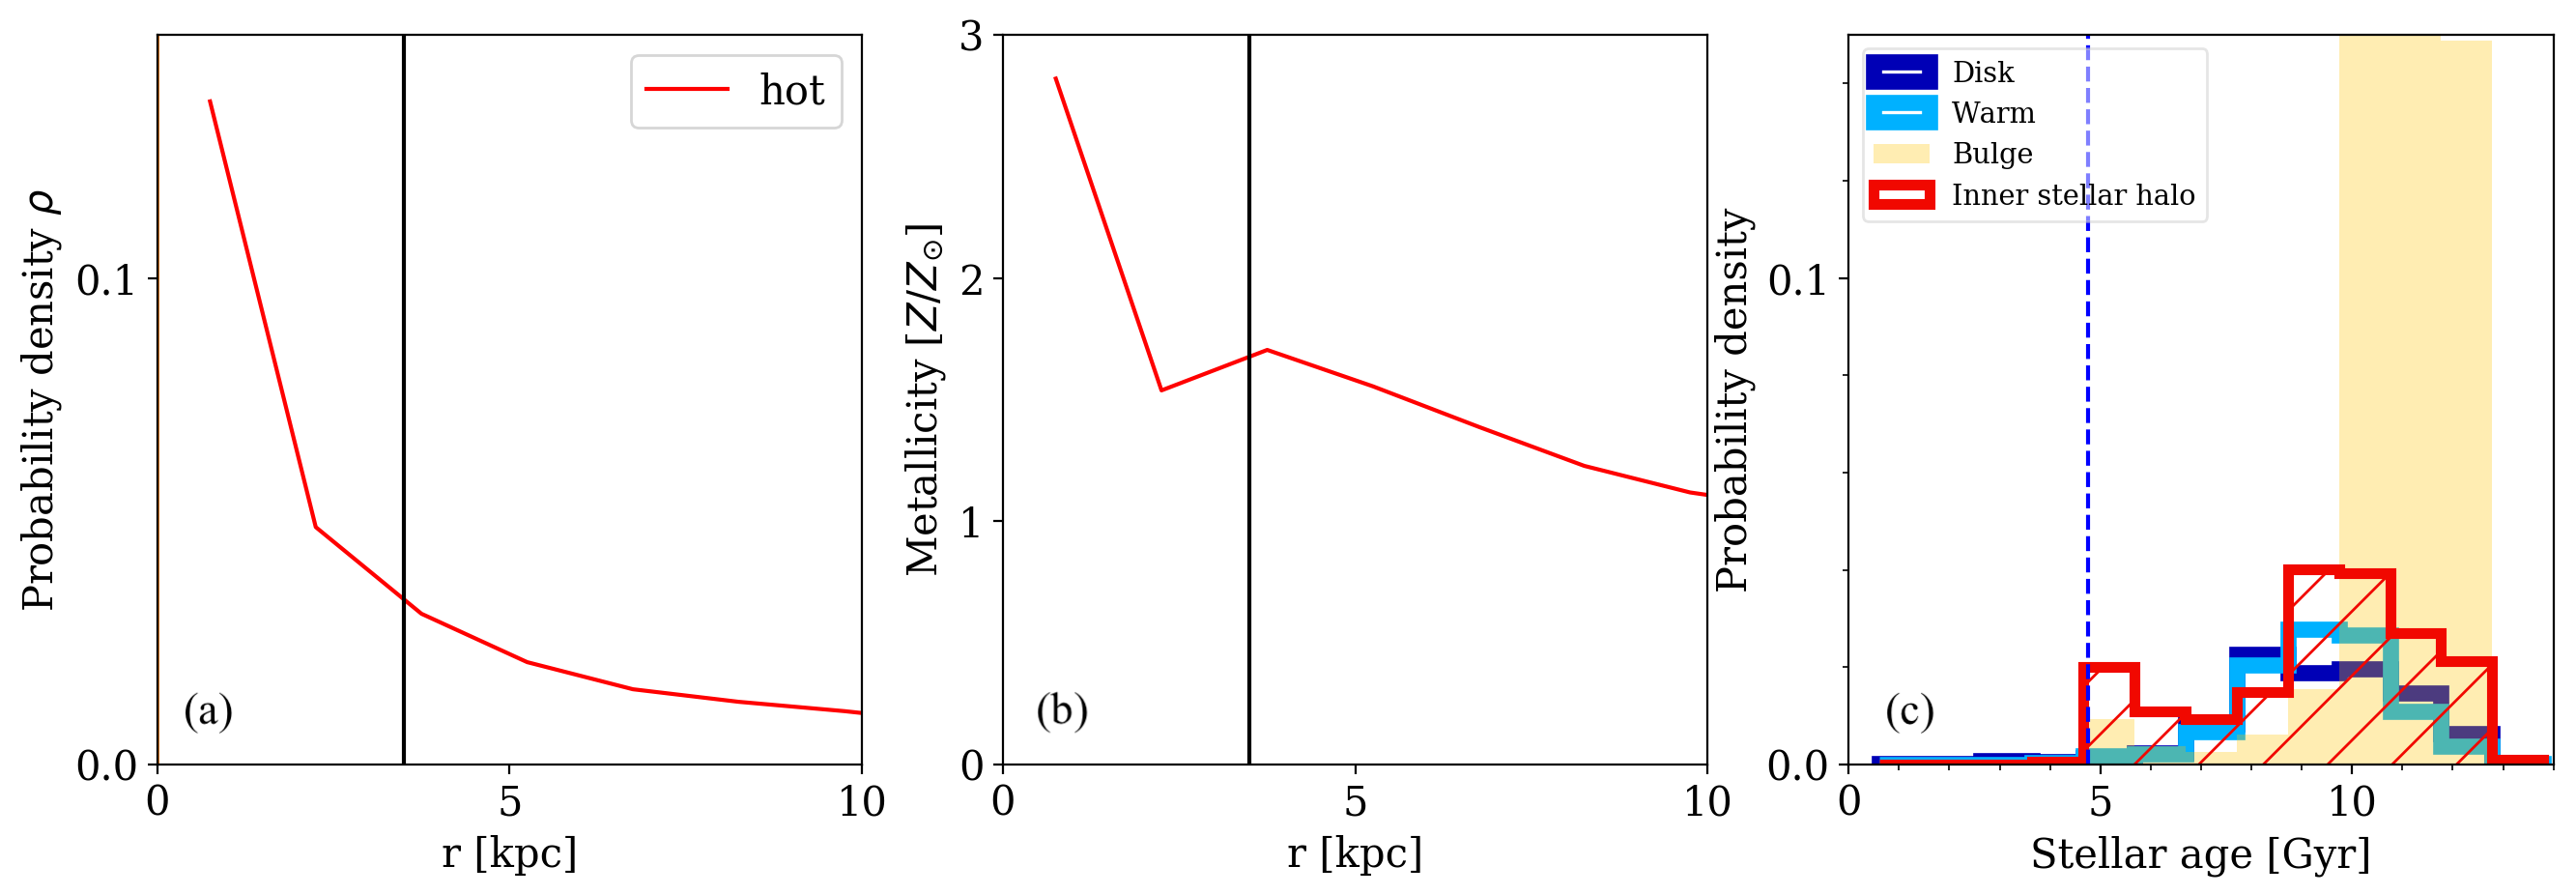
We split the stars in the galaxy at into three categories according to their origins: (1) stars formed in situ before the merger ended, (2) stars accreted from the secondary progenitor, and (3) stars formed in situ after the merger ended. In Figure 15, we show the probability density distributions in phase space of stellar age versus circularity for each part. The in situ stars formed before the merger ended have a wide range of in the galaxy at . The dynamical hot stars contribute mostly to the bulge and they are very old. The stars accreted from the secondary progenitor are younger and mostly contribute to the hot inner stellar halo. After the merger ended, only very few stars formed on dynamically cold orbits with little gas left after the merger. At the end, TNG50 465255 is an elliptical galaxy.
We separate the galaxy into four components: cold disk, warm component, bulge and hot inner stellar halo in the same way as we did for NGC 1427. In the left panels of Figure 16, we show the probability density and metallicity distribution of the hot orbits (with ) as a function of radius. Here we use radial bin size of kpc to avoid the dip of probability density at the inner-most bin. We separate the bulge and hot inner stellar halo at kpc as we did for all the galaxies (Zhu et al. 2021), although the transition in density is not sharp and the metallicity has already flatten at smaller radius, similarly to NGC 1427. The stellar age distribution of the four components is shown in the right panel of Figure 16. Similar to NGC 1427, TNG50 465255 has a younger inner hot stellar halo than the bulge. For this galaxy, the age of the youngest star in the hot inner stellar halo indicates the merger ending time.