Kiloparsec-scale imaging of the CO(1-0)-traced cold molecular gas reservoir in a z3.4 submillimeter galaxy
Abstract
We present a high-resolution study of the cold molecular gas as traced by CO(1-0) in the unlensed z3.4 submillimeter galaxy SMM J13120+4242, using multi-configuration observations with the Karl G. Jansky Very Large Array (JVLA). The gas reservoir, imaged on 0.39 (3 kpc) scales, is resolved into two components separated by 11 kpc with a total extent of 163 kpc. Despite the large spatial extent of the reservoir, the observations show a CO(1-0) FWHM linewidth of only 26764 km s-1. We derive a revised line luminosity of L(10 3) 10K km spc2 and a molecular gas mass of M(13 3)1010 ( M⊙. Despite the presence of a velocity gradient (consistent with previous resolved CO(6-5) imaging), the CO(1-0) imaging shows evidence for significant turbulent motions which are preventing the gas from fully settling into a disk. The system likely represents a merger in an advanced stage. Although the dynamical mass is highly uncertain, we use it to place an upper limit on the CO–to–H2 mass conversion factor of 1.4. We revisit the SED fitting, finding that this galaxy lies on the very massive end of the main sequence at z3.4. Based on the low gas fraction, short gas depletion time and evidence for a central AGN, we propose that SMM J13120 is in a rapid transitional phase between a merger-driven starburst and an unobscured quasar. The case of SMM J13120 highlights the how mergers may drive important physical changes in galaxies without pushing them off the main sequence.
1 Introduction
The evolution of the cosmic star formation rate density (SFRD) has now been well characterised as far back as the epoch of reionisation. It increased from the early stages of the Universe until it peaked at z , and then decreased until the present day (Madau & Dickinson, 2014). Parallel to these optical and near-IR studies, powerful radio and submillimeter interferometers such as the Karl G. Jansky Very large Array (VLA), the Atacama Large Millimeter/submillimeter Array (ALMA) or the NOrthern Extended Millimeter Array (NOEMA) have enabled the first deep blind emission line surveys (ASPECS, at z, Walter et al. 2016, COLDz, at z , Pavesi et al. 2018). These have begun to unveil the evolution of the cosmic molecular gas mass density out to z 6, revealing a very good agreement with the cosmic SFRD. Along with progress in state-of-the-art hydrodynamical simulations (e.g., SIMBA, Davé et al. 2019; IllustrisTNG, Diemer et al. 2019; Popping et al. 2019), these studies add to the growing consensus that the molecular gas reservoirs of galaxies are key drivers of the observed cosmic SFRD evolution, rather than changes in star forming efficiency (Scoville et al., 2016; Tacconi et al., 2018; Riechers et al., 2019; Decarli et al., 2020; Walter et al., 2020). Understanding the molecular gas properties of galaxies over cosmic time is therefore crucial for obtaining a complete picture of how galaxies form and evolve (Kennicutt & Evans, 2012; Carilli & Walter, 2013; Hodge & da Cunha, 2020; Tacconi et al., 2020).
12CO (hereafter CO), the second most abundant molecule in galaxies after molecular hydrogen (H2), has been traditionally used to trace the total molecular gas content of galaxies. The low excitation temperature Tex = 5.5 K of the rotational ground state () of CO means that this molecule is easily excited in a variety of galactic environments, tracing the bulk of the cold molecular gas. The CO(1-0) luminosity can be directly related to the cold molecular gas mass via a conversion factor (see Bolatto et al., 2013, for a review). Due to the intrinsic faintness of the line and the great distances involved, large time investments are needed to detect this transition at high redshift, so mid- and high-J CO transitions such as and are often used instead. These transitions trace denser, actively star-forming gas, and are typically brighter and thus easier to detect than the ground state transition. Relating their line luminosities to the CO(1-0) line luminosity, however, requires additional assumptions about line excitation, with conversion factors spanning a wide range of values over the high-z galaxy population (Carilli & Walter, 2013; Narayanan & Krumholz, 2014; Sharon et al., 2016; Yang et al., 2017; Riechers et al., 2020). Furthermore, higher-J CO transitions have been shown to miss a significant fraction of the lower-excitation gas, and might therefore not be representative of the total molecular gas content of the galaxies. This would in turn lead to an underestimation of the dynamical mass and gas fraction, among other properties (Ivison et al., 2011; Riechers et al., 2011; Cañameras et al., 2018).
Submillimeter galaxies (SMGs) are one of the main sites of star formation in the high-z Universe (Casey et al., 2014; Hodge & da Cunha, 2020). These dusty, high infrared luminosity (L 1012 L⊙; Magnelli et al. 2012a) systems are found predominantly at high redshift (Chapman et al., 2005; Danielson et al., 2017). They have star formation rates up to, and even in excess of, 1000 M⊙ yr-1, fed by large molecular gas reservoirs of 1010-11 M⊙ (Greve et al., 2005; Tacconi et al., 2008; Bothwell et al., 2013; Birkin et al., 2021). Such intense starburst episodes are thought to be mainly triggered by major mergers, interactions with neighbouring galaxies or through accretion of cold gas from the intergalactic medium. Obtaining a clear picture of the physical conditions and structure of their interstellar medium (ISM), as well as the processes regulating their star formation, is critical to our understanding of the history of cosmic star formation. However, despite their extreme properties, resolved studies of the low-J CO emission in high-redshift SMGs on kpc/sub-kpc scales remain a technical challenge, even for the few extremely bright (e.g., GN20, Hodge et al., 2012) and/or strongly lensed systems (e.g., HLSJ091828.6+514223; Rawle et al. 2014; SDSS J0901+1814; Sharon et al. 2019) in which they have been carried out. In this paper we extend these to SMM J13120+4242 (hereafter SMM J13120).
SMM J13120 is a z , non-lensed SMG that was first detected in the Hawaii Deep Field SSA 13. This SMG has an active galactic nucleus (AGN), revealed by optical emission lines (Si IV, C IV, O III, Chapman et al., 2005), point-like X-ray imaging (Wang et al., 2016) and the need to include an AGN component to accurately fit the SED (Section 3). CO(1-0) observations with the GBT by Hainline et al. (2006) originally suggested a very broad line of FWHM 1000 km s-1, implying an ongoing merger. This scenario was further supported by resolved observations of CO(6-5) showing a disturbed structure and velocity distribution (Engel et al., 2010). Subsequent CO(1-0) imaging with the VLA revealed a very massive (Mgas = 1.9-6.91011 M⊙), extended (15 kpc) low excitation gas reservoir (Riechers et al. 2011, hereafter R11). In this work we present high-resolution (0.39) JVLA CO(1-0) imaging of J13120, spatially and kinematically resolving the cold molecular gas reservoir in this unlensed galaxy.
This paper is organised as follows. In Section 2, we describe the observations and data reduction. The main results are presented in Section 3, where we include a reevaluation of the evidence for a broad CO(1-0) linewidth, source size estimation and revisit the SED fitting. In Section 4 we present the analysis of this data, including estimates of the gas fraction and gas depletion time (Section 4.1), the dynamical mass and CO-to-H2 conversion factor (Section 4.2) and the revised gas excitation modeling (Section 4.3). In Section 5 we place the extended gas reservoir seen in SMM J13120 in context with the literature (Section 5.1) and we further discuss the fate of this galaxy given the analysis presented here (Section 5.2). We end with our conclusion in Section 6.
A cosmology of H0= 67.4 km s-1 Mpc-1, = 0.315, and = 0.685 is assumed throughout this paper (Planck Collaboration et al., 2020). At a redshift of z = 3.408, this corresponds to an angular scale of 7.56 kpc arcsec-1 and a luminosity distance of 30.3 Gpc.
2 Observations and data reduction
2.1 JVLA K-Band
We used the JVLA to observe the CO(J = 1-0) emission (rest-frame frequency: = 115.27 GHz) from SMM J13120 (VLA program ID: 15A-405 and 17B-108, PI: Hodge). At z = 3.408, the line is redshifted to 26.15 GHz. We used the K band receivers in combination with the WIDAR correlator configured to 8 bit sampling mode to observe a contiguous bandwidth of 2.048 GHz (full polarization) covering the 24.446 - 26.342 GHz frequency range at 2 MHz spectral resolution (23 km s-1 at 26.15 GHz). Four of the allocated 50 hours were observed in 2015 March (B configuration). The remaining 46 hrs were observed between 2018 October and December (B and C configurations). In total, 39.9 hours were spent in B configuration and 9.96 hours in C configuration. The data were combined with previous observations taken between 2010 May (C and D configurations) and 2011 January (CnB configuration) (Program ID: AR708, PI: Riechers). This resulted in a combined integration time of 57.6 hrs. After accounting for calibration overheads and flagging, the total on-source integration time was 30.9 hrs.
The quasar 3C 286 was used to determine the absolute flux density and for bandpass calibration. The VLA calibrator J1242+3751 was observed every 3.5 minutes for phase and amplitude calibration. Observations were taken in full polarization mode.
All data was reduced using the Common Astronomy Software Application (CASA) package version 5.6.0-60 (McMullin et al., 2007). Several antennas and two spectral windows were manually flagged after inspecting the calibration output. In K-band, the largest angular scale is 7.9” (59.5 kpc at z3.4) for B configuration and 66” (497.6 kpc) for C and D configurations at 22GHz, the center of the band.
We imaged the data using the CLEAN algorithm, and cleaned down to 2 in a 5.0” 4.3” clean box around SMM J13120+4242. We used natural weighting, which resulted in a synthesised beam FWHM of 0.39” 0.34” at a PA = -81. We further performed synthesis imaging of the data using the multi-scale version of the WS-Clean algorithm introduced by Offringa et al. (2014); Offringa & Smirnov (2017), but found no quantitative or qualitative improvement over the imaging performed with CASA. The resulting rms value achieved was 27.2 Jy beam-1 channel-1, with channels of width 46 km s-1. At a tapered resolution of 0.9, we achieve an rms of 35 Jy beam-1 channel-1, in comparison to the 70 Jy beam-1 channel-1 depth of R11 for an equal channel width and spatial resolution.
2.2 Plateau de Bure Interferometer
Observations of the CO J = 6-5 transition were carried out in winter 2007/2008 with the IRAM Plateau de Bure interferometer in the extended A configuration. At z=3.4, the CO(6-5) transition is redshifted into the 2mm band. The data were presented in Engel et al. (2010). We reuse the imaging products created in the MAPPING environment of GILDAS (Engel, Davies, priv.comm.). The rms value is 0.64 mJy beam-1 channel-1 (channel width of 20 km s-1), with a beam size of 0.59 0.47 at a P.A. = 50.9.
3 Results
3.1 CO(1-0) Line Detection
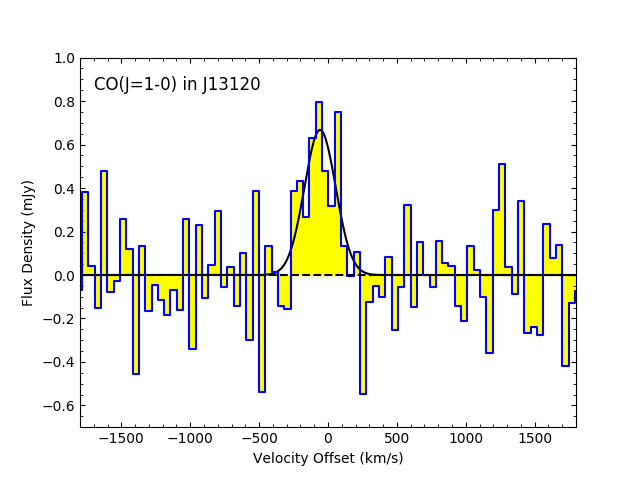
The CO(1-0) spectrum of SMM J13120 is shown in Fig. 1. The spectrum was extracted using a circular aperture of 1.75 diameter centered on the source, chosen to maximise the recovered flux. We fit the line with a single Gaussian profile that yields a peak flux density of 0.67 0.14 mJy, with a FWHM of 267 64 km s-1 and integrated flux of 0.19 0.06 Jy km s-1. The line is consistent with the central peak that was detected at a 4 level in the earlier VLA observations by R11 (see their Figure 2, bottom), which we use as our short spacings here.
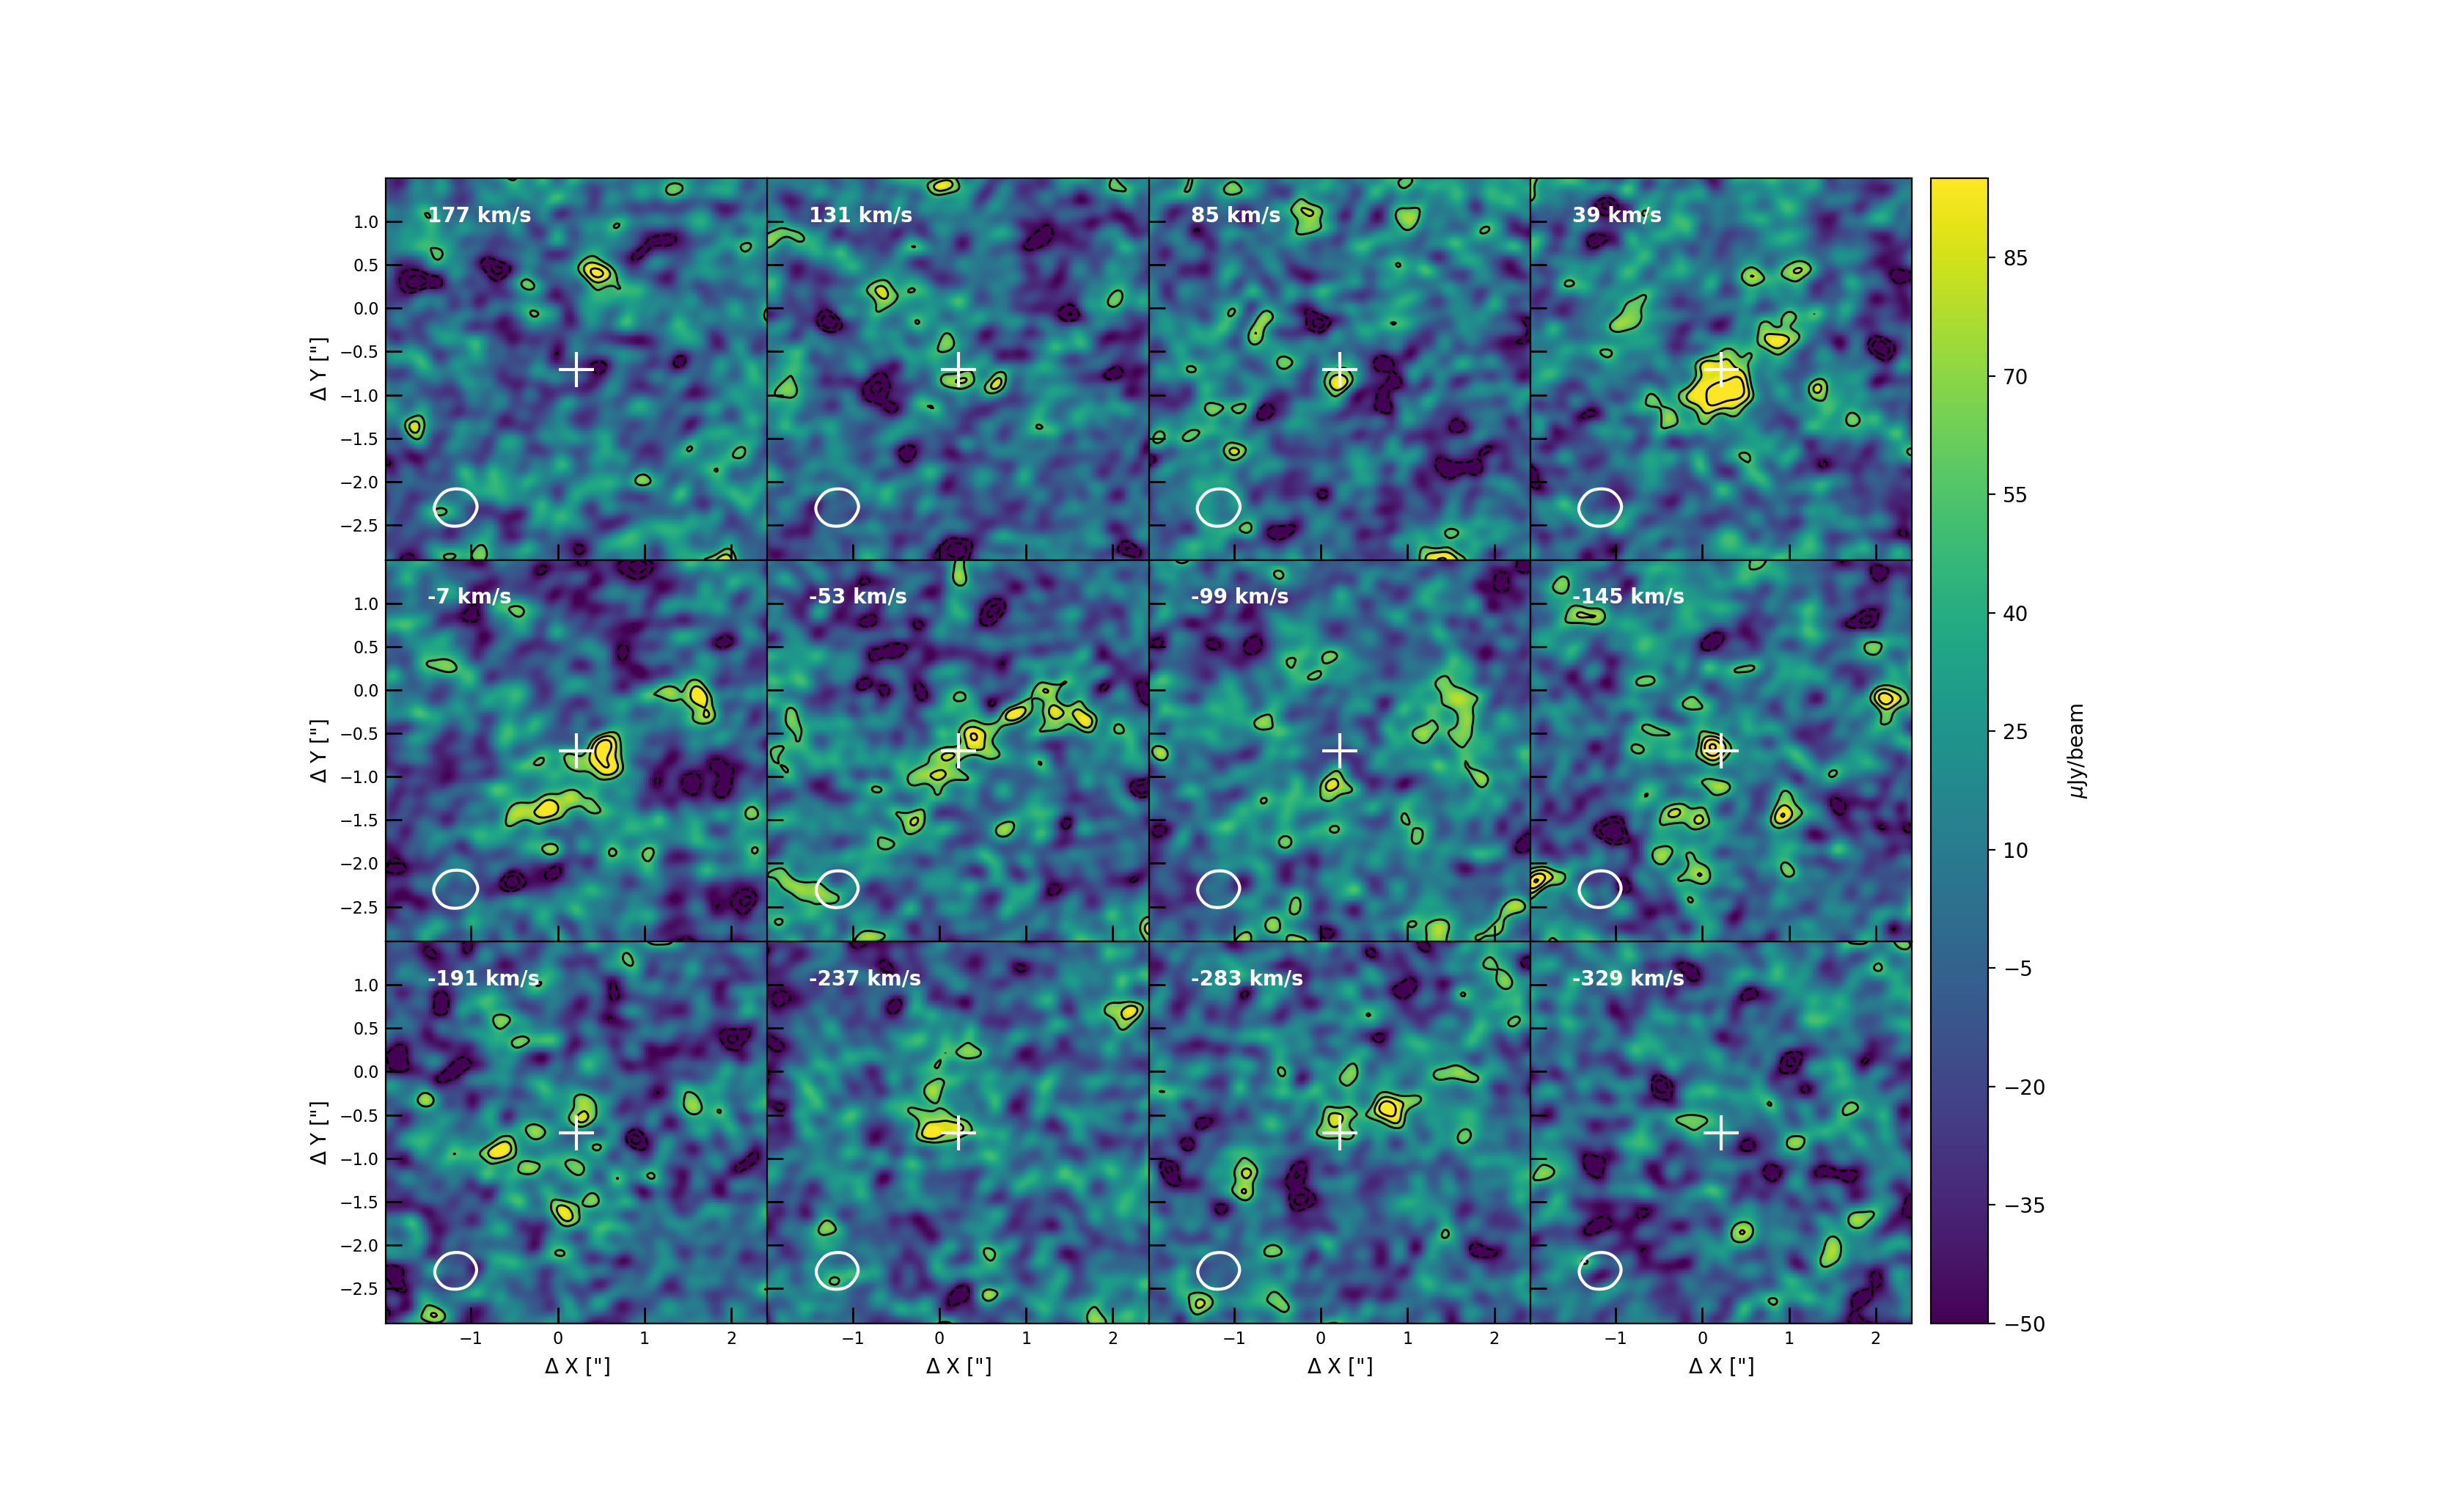
Channel maps of 46 km s-1 width are shown in Figure 2. Emission first appears at 131 km s-1, and disappears at -283 km s-1. The data cube was tapered to 0.6 and 0.9 to search for additional extended emission that might be resolved out at native resolution (see Appendix), but no significant difference in total flux density was found.
Ancillary data for SMM J13120 previously suggested a broader CO line FWHM. Greve et al. (2005) detected unresolved CO(4–3) emission with PdBI with a velocity width of 530 50 km s-1. Engel et al. (2010) reported a broad 900 km s-1 FWHM for the CO(6-5) emission. Upon examination of the CO(6-5) data cube (Engel et al. 2010, priv. comm.; see Figure 7.), we found that the SNR of the data and the narrow total bandwidth of the cube (1800 km s-1) does not allow a robust continuum subtraction, so it is possible that continuum emission is causing an artificial widening of this line.
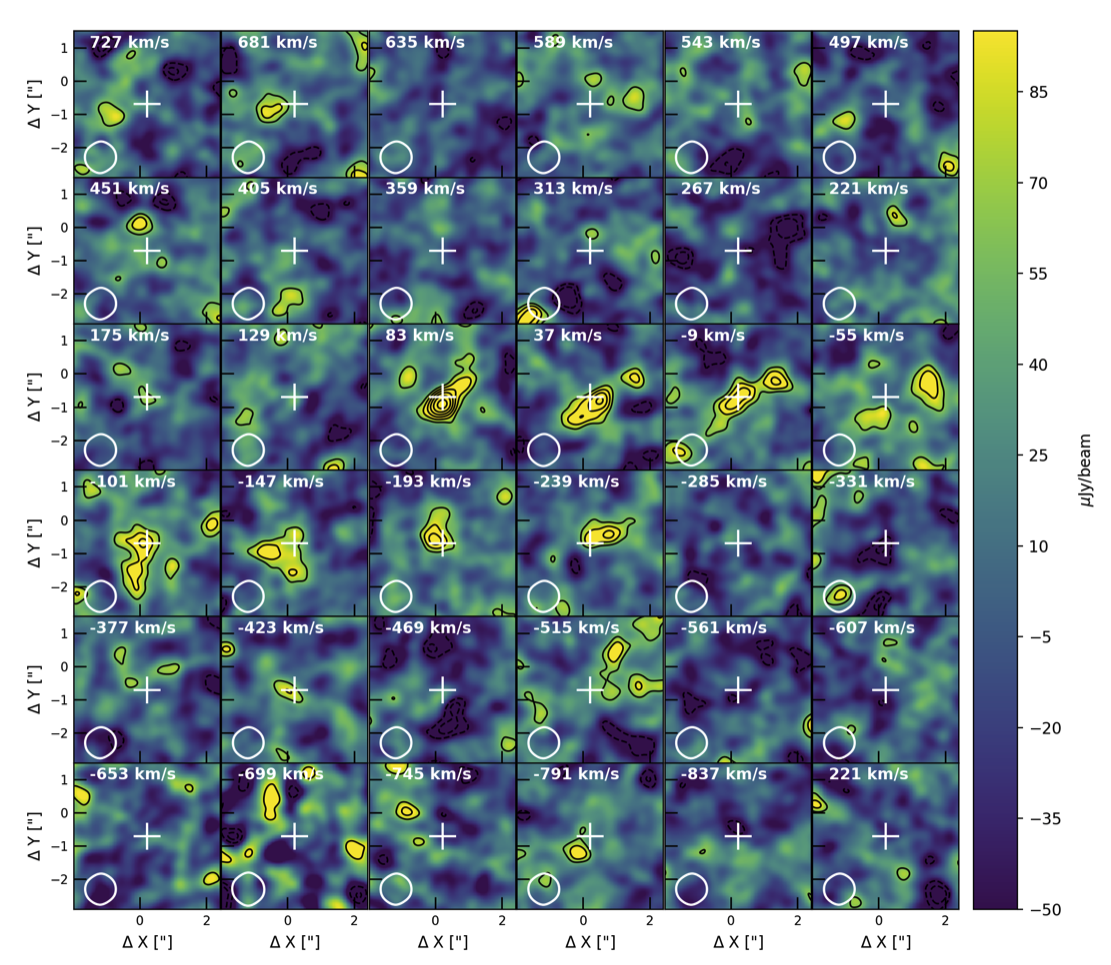
The earlier spectra of SMM J13120 from the GBT (using the Autocorrelation Spectrometer; Hainline et al., 2006) and VLA (R11) appeared to show evidence for CO(1-0) emission as well across a broader, 1000 km s-1 velocity range, albeit at limited SNR for both instruments. This naturally raises a question about whether the new high-resolution VLA data are missing more extended emission at large velocities, such as has been reported in some follow-up studies of high-redshift sources with the GBT (e.g., Frayer et al., 2018). However, the new data disfavour the presence of such a broad component at a flux level consistent with the uncertainties on the earlier VLA data (see Appendix). Moreover, despite the two times improved sensitivity of the combined dataset even when tapering to the resolution of the initial data set, we do not find evidence for emission above 2 significance beyond the central emission component. We note that, despite the narrow linewidth we find here, we still find evidence for a spatially extended CO(1-0) reservoir (Section 3.2) and a diffuse low-excitation gas component (Section 4.3). A deep integration with a single-dish telescope would be required to investigate if an even lower surface brightness extended component is present in this source.
| Parameter | Value |
|---|---|
| Position (J2000) | 13h12m01.182s +4242′08.276 |
| za | 3.4078 0.0014 |
| SCO(1-0) | 0.67 0.14 mJy |
| FWHMCO(1-0) | 267 64 km s-1 |
| FWHMCO(6-5)b | 911 140 km s-1 |
| ICO(1-0) | 0.19 0.06 Jy km s-1 |
| ICO(6-5)b | 2.54 0.1 Jy km s-1 |
| L | (10 3) 1010 K km s-1 pc2 |
| LCO(1-0) | (4.7 1.5) 106 L⊙ |
| R | 8 2 kpc |
| Mgas | (13 3) 1010 M⊙ |
| Mdyn | (1.6 0.9) 1011 M⊙ |
| LFIR | (6.4 2.8) 1012 L⊙ |
| SFRIR | 948 M⊙/yr |
| M∗ | 6.45 1011 M⊙ |
| a Riechers et al. (2011) | |
| b Engel et al. (2010) |
3.2 Moment Maps
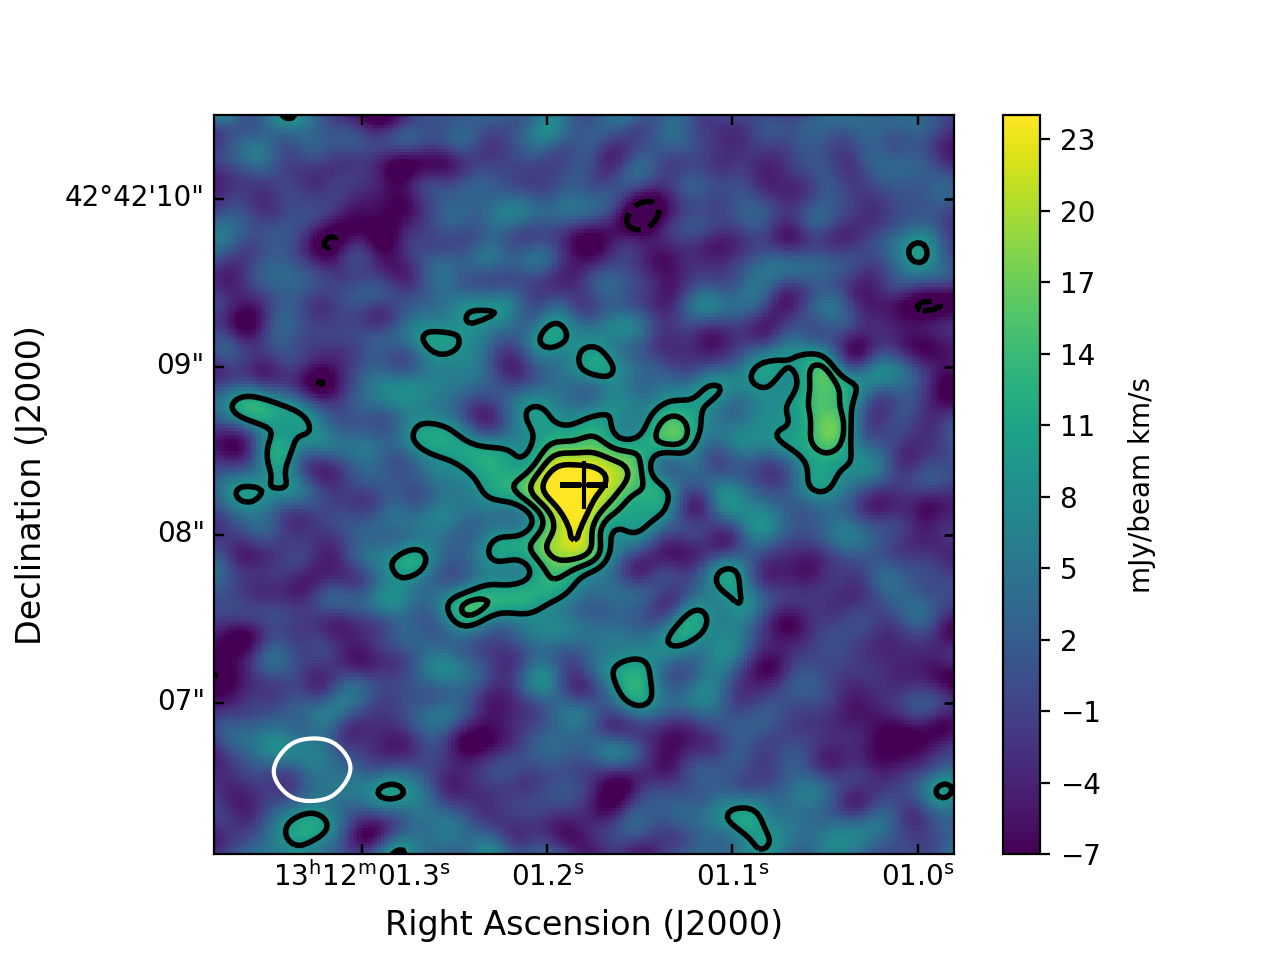
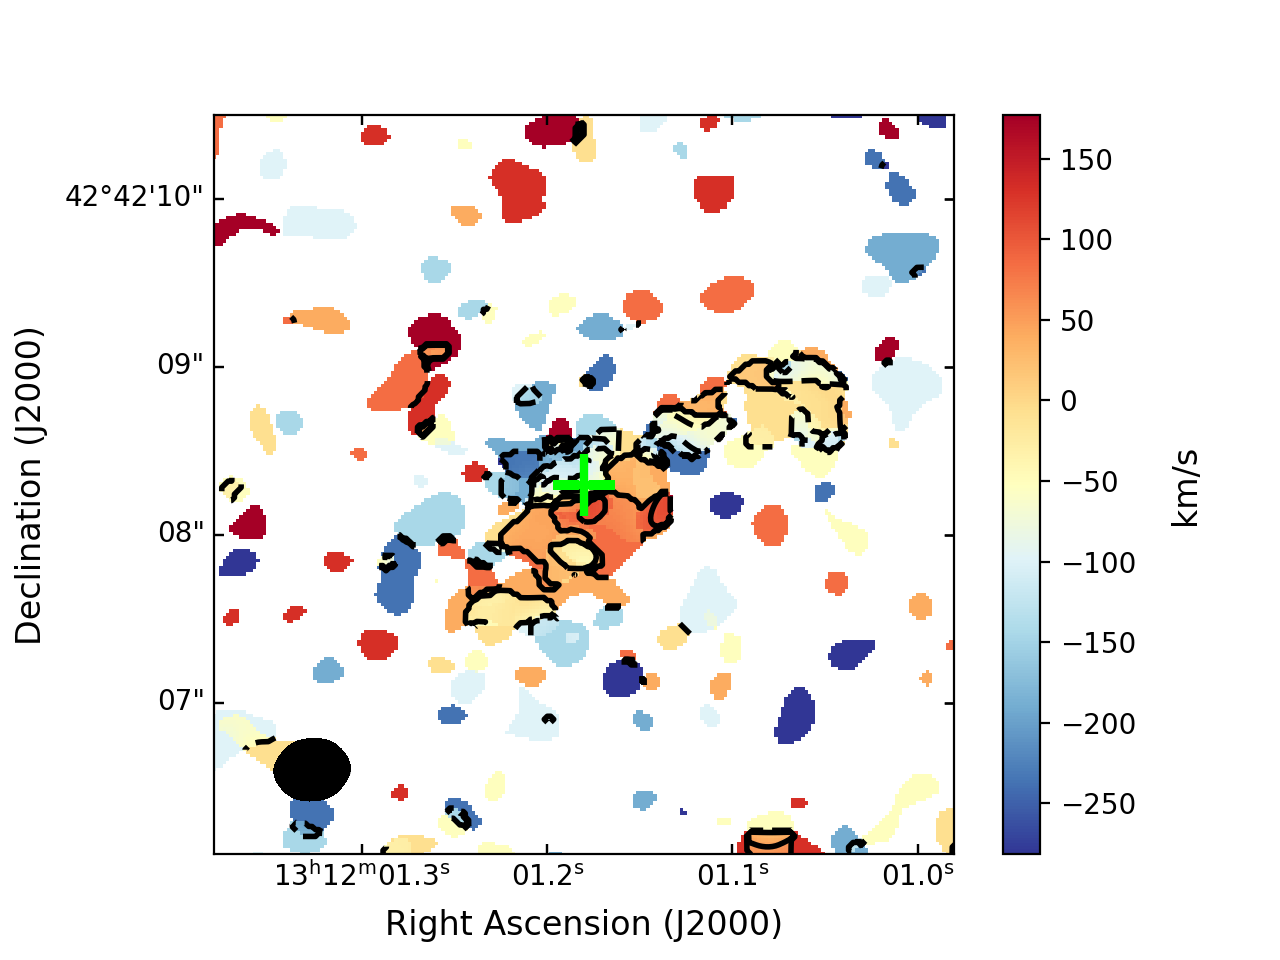
The task IMMOMENTS in CASA was used to obtain the integrated-intensity map (moment 0) and intensity-weighted velocity field (moment 1). Both moment maps were extracted by collapsing the data cube over the channels where emission is present, and the moment 1 map was further clipped at 2 times the rms noise per channel. The maps are shown in Figure 3. The moment 0 map reveals a source elongated in the SE to NW direction, at a PA of 127. We detect two different components separated by 1.5 (11 kpc). The central component carries most of the CO emission, with a luminosity ratio of 5:1. The secondary (NW) component is located at RA = -0.125 (-0.9kpc) and Dec = 0.4 (3kpc) with respect to the main component.
The moment 1 map shows a complex velocity field, with most of the emission arising at the systemic velocity. There is no apparent structure in the velocity field of the NW component. No significant emission is seen outside this velocity range, which is consistent with the line profile discussed below. We do not detect any rest-frame 2.6mm continuum emission from either component down to a 3 limit of 10.6 Jy beam-1.
3.3 Source Size Estimation
We fit a 2D Gaussian to the 0th moment map using the task IMFIT in CASA, finding a deconvolved size of 2.1 0.5 1.0 0.2 (16 3 8 2 kpc). For the two spatially resolved components seen in the moment 1 map, we find a size of 1.3 0.3 0.7 0.2 (10 2 5 1 kpc) and 0.6 0.2 0.3 0.2 (5 1 2 2 kpc) for the central and the NW component respectively.
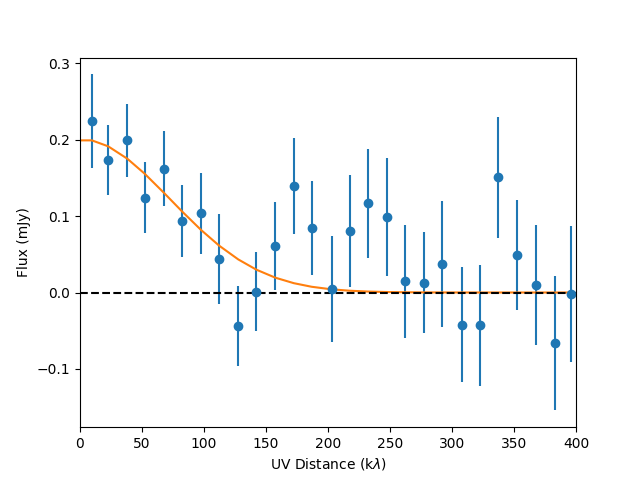
We further derived the size of the molecular gas reservoir from the uv-data directly to avoid possible biases introduced by the imaging process. We extract the visibilities corresponding to the channels within the full width at zero intensity of the line from the cube. We then average the data in radial bins of 15 k and fit a Gaussian profile to the data, as shown in Figure 4. The resulting half-light radius is 1.20 0.15 (9.1 1.1 kpc), consistent with our estimation from the moment 0 map fitting. At 150k there is tentative evidence which may indicate the presence of unresolved structure not captured by our Gaussian model.
3.4 SED Fitting
In order to perform a consistent analysis of SMM J13120, we re-examine the physical properties of the galaxy derived through SED fitting. Although previous estimates were reported in the literature (Hainline et al., 2006; Michałowski et al., 2010), we have included new photometric data available from the radio to the X-rays (see Table 2). In particular, a Chandra detection of this source (Wang et al., 2016) reported an X-ray luminosity of log(L0.5-8keV) 44, associated with an AGN (an unphysical SFR M∗ yr-1 would be required to explain this emission from star formation, according to the LX-ray-SFR relation by Mineo et al. 2014), which is furthermore supported by emission line properties characteristic of AGN (Chapman et al., 2005).
To account for the contribution of the AGN to the multi-wavelength SED we use the most recent version of the MCMC-based code AGNfitter (Calistro Rivera et al., 2016). Given the unique data coverage for this source, we use the updated version of the code, AGNfitter-rX (Martinez-Ramirez in prep.), which is the first Bayesian SED-fitting routine which consistently models the SEDs of the host galaxy and the AGN emission, from the radio to the X-rays. The AGNfitter model we used here consists of six different physical components: the X-ray corona, the accretion disk emission (Richards et al., 2006), the hot dust torus emission (Stalevski et al., 2016), the stellar populations (Bruzual & Charlot, 2003, with a Chabrier IMF and exponentially declining star-formation history), the cooler dust heated by star formation (Schreiber et al., 2016), and the radio emission component (see Figure 5). Our SED modelling approach yields a SFRIR= M∗ yr-1 and a stellar mass of . These estimates differ from those reported in the literature: Hainline (2008) found log(M∗) = 10.96±0.04 and SFRIR=890 M∗ yr-1; whereas Michałowski et al. (2010) found log(M∗)=11.36 (no uncertainties were reported) and 3700 M∗ yr-1. The advantage of the new estimates lies on the improved modelling approach used, and the inclusion of the most recent additional data points in the fit (HST-WFC3 F160W and Chandra). Several tests were completed to assess the robustness of the derived values. Included within these were the use of restrictive and flexible energy balance (in which the luminosity of the cold dust is equal or allowed to be greater than the total luminosity attenuated by dust, respectively), setting the AGN component to 0 and deactivating all the priors. All the tests which allow an AGN component return stellar masses agreeing within the error bars. We note that the stellar masses inferred were not directly affected by the AGN component but rather by the additional photometric data points and different SFH models chosen. For the SFRIR, our estimate is consistent with the Hainline et al. (2006) estimate, while it differs from Michałowski et al. (2010), which predicts an extremely large value that may be unrealistic given SMG statistics (da Cunha et al., 2015). We note that a further significant advantage of the current method is its probabilistic Bayesian approach. The poor photometric coverage of the FIR-MIR SED directly translates into an uncertain SFR from the IR and an uncertain AGN torus contribution to the total IR emission (12% from our fit), therefore highlighting the need of a Bayesian approach that robustly recovers the uncertainties of the inferred quantities. With these uncertainties in mind, these revised estimates place SMM J13120 on the massive end of the main sequence at z = 3.4 (using the definition from Speagle et al. 2014; see Hodge & da Cunha 2020 for a discussion of further systematic uncertainties).

| Wavelength (m) | Flux (Jy) |
|---|---|
| (0.15 - 4) 10-3 a | 0.00029 0.000043 |
| 0.428b | 0.302 0.027 |
| 0.630c | 0.649 0.057 |
| 0.656b | 0.912 0.08 |
| 0.767d | 1.4 0.075 |
| 0.92c | 1.535 0.135 |
| 1.25d | 2.138 0.455 |
| 1.60e | 2.58 0.19 |
| 2.17d | 4.258 0.749 |
| 3.6f | 10.6 1.1 |
| 4.5f | 15.1 1.6 |
| 5.8f | 24.1 3.7 |
| 8.0f | 29.3 4.1 |
| 350g | 21100 7700 |
| 850b | 6200 1200 |
| 214000 b | 49.1 6 |
4 Analysis
4.1 Molecular Gas Mass, Gas Fraction and Depletion Time
The line flux was converted into line luminosity following Solomon & Vanden Bout (2005):
| (1) |
where is the integrated line flux from the Gaussian fit in Jy km s-1, is the observed frequency of the line and is the luminosity distance in Mpc. We obtain a line luminosity of = (10 3) 1010 K km s-1 pc2. This value falls within the scatter of the correlation between L and FWHM found for high-redshift (z 1-6) SMGs both with direct CO(1-0) detections and based on high-J CO transitions (Wu et al., 2019; Birkin et al., 2021).
The line luminosity can be transformed into a molecular gas mass through the conversion factor:
| (2) |
It is common to apply different values for , depending on the galaxy type (see Bolatto et al. 2013 for a review). Normal star-forming galaxies show the standard Milky Way value = 4.3 M⊙ K-1 km-1 s pc-2, while studies of local ULIRGS and high redshift starburst galaxies often assume = 0.8 M⊙ K-1 km-1 s pc-2. Theoretical studies have shown that the value of depends on a range of ISM conditions, such as metallicity and dust temperature (Narayanan et al., 2012; Magnelli et al., 2012b; Gong et al., 2020).
There are a growing number of studies in high-z SMGs that point towards the use of 1 (e.g., Hodge et al. 2012; Calistro Rivera et al. 2018; Birkin et al. 2021; Riechers et al. 2021), so we adopt this value to estimate the molecular gas mass of SMM J13120 (as we show in Section 4.2, our data excludes 1.4). Multiplying by 1.36 to account for Helium, we obtain Mgas = (13 3) 1010 (/1.0) M⊙, a factor of two higher than the median value obtained for the latest compilation of SMGs in Birkin et al. (2021) of Mgas = (6.7 0.5) 1010 M⊙. Our gas mass estimate is also several times higher than those of the ALESS sample (Swinbank et al., 2013) and the compilation of more than 700 SMGs selected from the AS2UDS survey (Dudzevičiūtė et al., 2020), although we point out that these were derived from dust masses assuming a fixed gas-to-dust ratio , , of 90 and 100, respectively, instead of CO observations.
With our gas and stellar mass estimates, the resulting baryonic gas mass fraction is f = M/(M + M∗) = 0.17 0.03. This value is over a factor of two lower than the compilations of SMGs at z 2.8 - 3, which have a median f 0.4 (Dudzevičiūtė et al., 2020), as well as other star forming galaxies at z 3.3 (Suzuki et al., 2020) and main sequence galaxies at z 2.5 (Saintonge et al., 2013; Tacconi et al., 2018).
Using our revised estimate of the total molecular gas reservoir and SFR, we can calculate the time that it would take for the system to deplete the current gas supply at its current SFR, tdep = 137 69 (/1) Myr. This indicates a phase of rapid star formation seen also in some other high-z SMGs and starburst galaxies (Tacconi et al., 2008; Hodge et al., 2013; Riechers et al., 2013; Aravena et al., 2016; Oteo et al., 2016; Nayyeri et al., 2017), or local ULIRGs (Solomon et al., 1997; Combes et al., 2013), and is shorter than the estimates for the average SMG population at this redshift (e.g., Birkin et al. 2021; Dudzevičiūtė et al. 2020) or predictions from simulations (McAlpine et al., 2019), which favour depletion timescales of the order of several hundred million years. We note here that, due to its large M∗ and SFR, SMM J13120 is a rare, extremely massive galaxy that will likely not be captured in most hydrodynamical simulations.
4.2 Dynamical Modeling and CO-H2 Conversion Factor
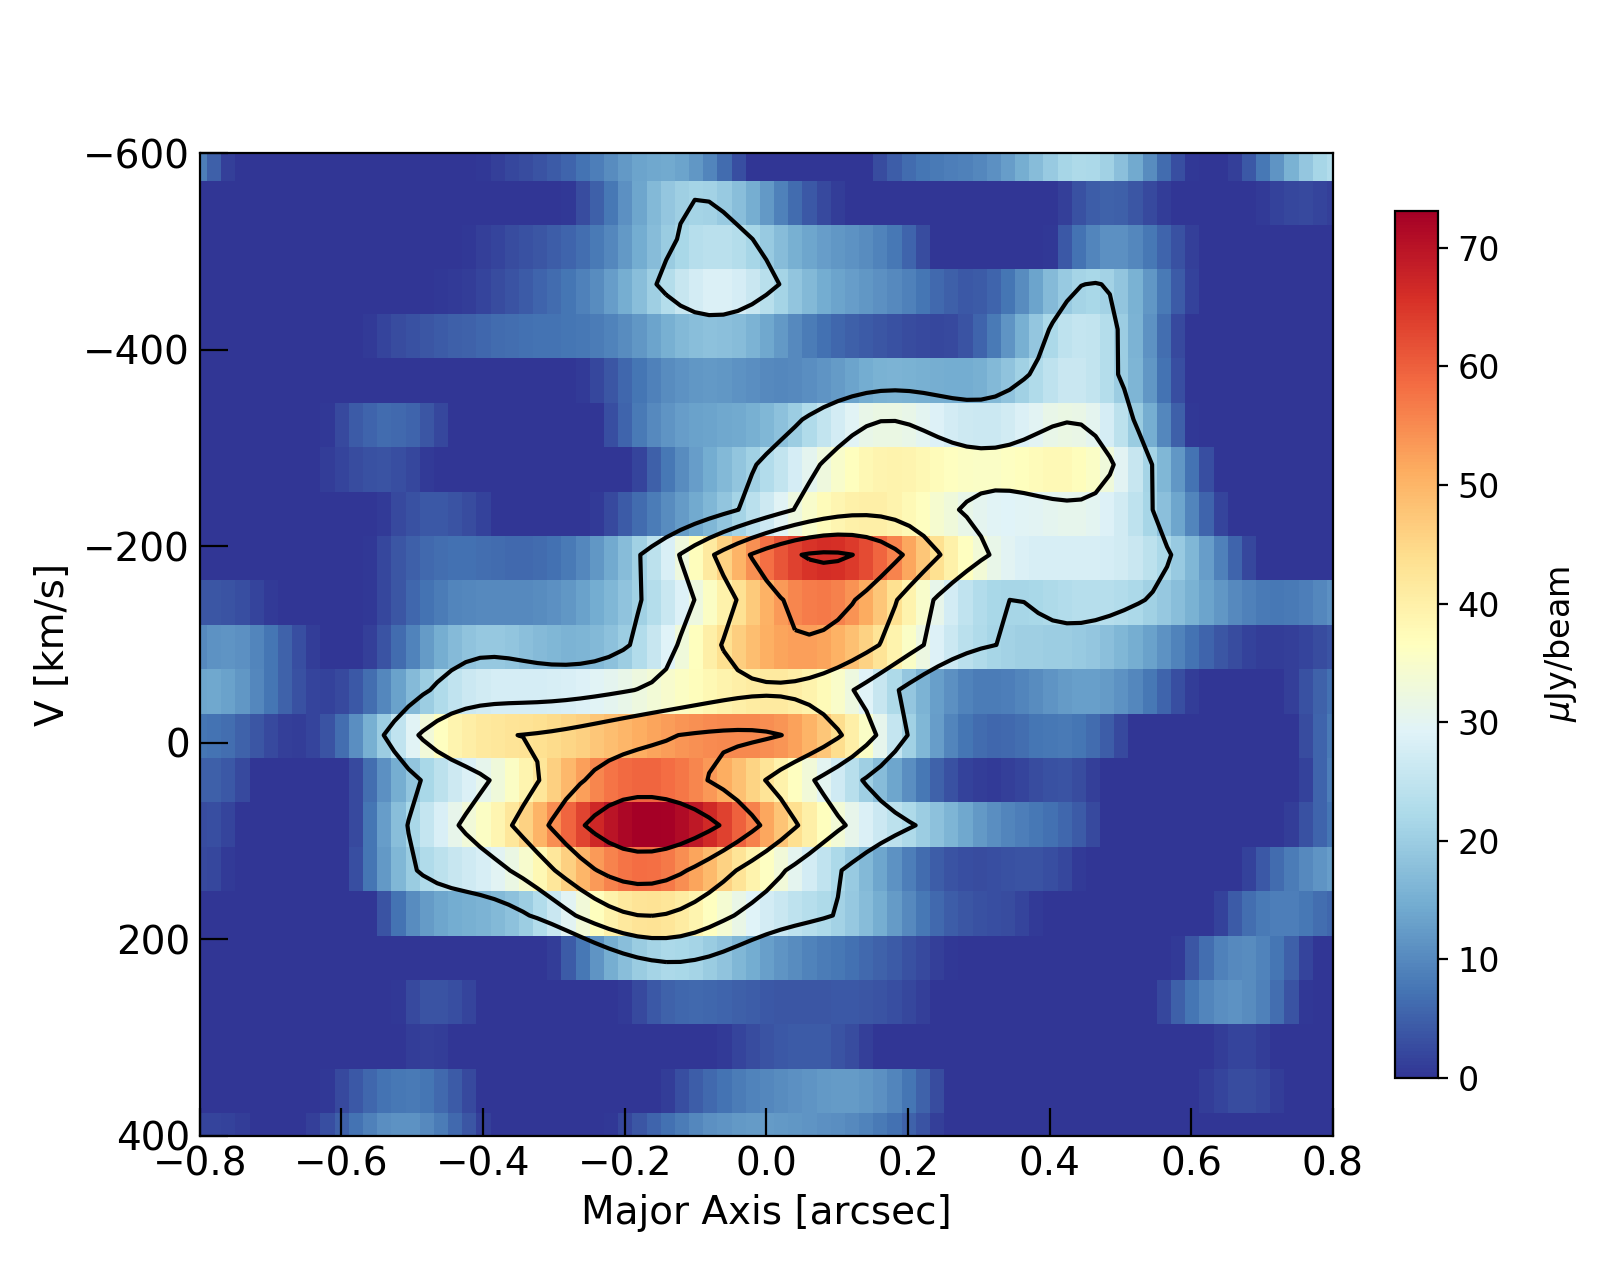
We extracted position-velocity (PV) diagrams of the CO(1-0) and CO(6-5) emission along an axis at PA = 47.3°, chosen to maximise the observed velocity gradient. For comparison, the minor axis of the source has a PA = 37. The resulting CO(1-0) PV diagram is shown in Figure 6. A velocity gradient can be observed aligned with the minor axis of SMM J13120. In Fig. 7 we also show the PV diagram extracted from the CO(6-5) cube along the same axis as before. Despite the perturbed structure of the velocity field seen in the CO(1-0) 1st moment map (Figure 3, bottom), a remarkably similar velocity gradient is present in both line transitions.
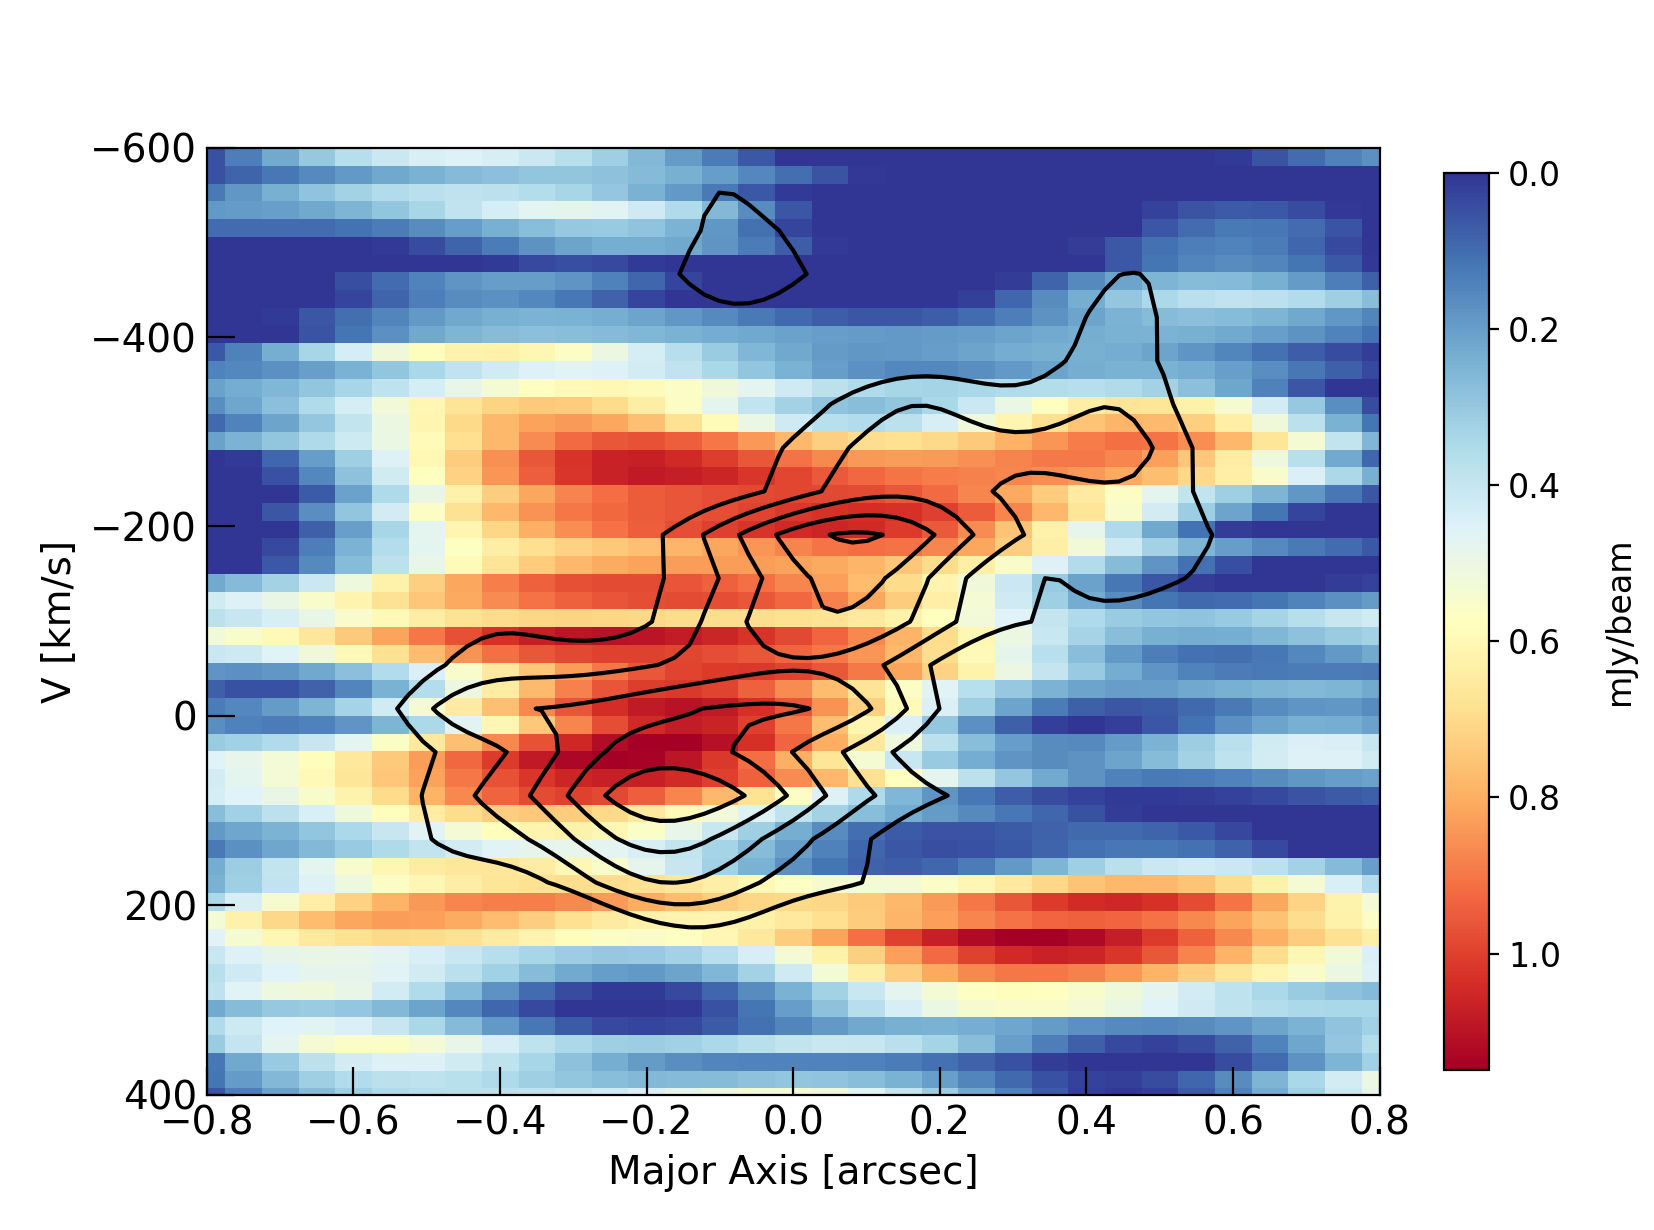
We attempted to model the kinematics of SMM J13120 using the Bayesian Markov Chain Monte Carlo tools GaLPaK3D (Bouché et al., 2015) and qubefit (mneeleman & Prochaska, 2021). As noted above, however, the velocity gradient is aligned with the minor axis rather than the major axis. Together with the disturbed global morphology and limited SNR per channel, this precluded dynamically modelling the data as a rotating disk.
Instead we estimate the enclosed dynamical mass of SMM J13120 within the half-light radius through the measured CO(1-0) linewidth. We adopt the virial estimator (Tacconi et al., 2008; Engel et al., 2010), which relates the linewidth, radii and mass of the system through the equation:
| (3) |
where is the line FWHM in km s-1 and R1/2 is the gas half-light radius in kpc. The scaling factor adopted assumes the gas to be dispersion dominated and is consistent with results derived from detailed Jeans modeling for high-z galaxies (Cappellari et al., 2009). We consider this assumption to be appropriate given the chaotic velocity field in SMM J13120. We note that the scaling factor for a rotating disk at an average inclination would be a factor of 1.5 smaller. Taking the half-light radius as half of the semi-major axis FWHM (8 kpc, see Section 3), we derive a value of M = (1.6 0.9) 1011 M⊙. This value is hard to reconcile with the stellar and gas mass estimates (6.45 1011 M⊙ and 1.3 1011 M⊙, respectively), highlighting the highly uncertain nature of the dynamical mass estimate due to the clear presence of non-gravitationally supported motions. Evidence of this comes from our inability to dynamically model the system, which suggests the CO(1-0) is dominated by turbulent motions which prevent the gas from settling into a disk. Nevertheless, we can attempt to put constraints on the conversion factor by taking the 2 values of the quantities considered and assuming no dark matter. Taking the 2 values of M and M∗, 3.41011 and 1.51011 respectively, we find 1.4. If we instead consider M = 2.51011 (+1), we find 0.7. Even when making these liberal assumptions, we find that cannot be higher than 1.4, consistent with recent work on SMGs at high redshift (Calistro Rivera et al., 2018; Birkin et al., 2021). This supports the choice of a low, ULIRG-like value as discussed in Section 4.1.
4.3 Gas Excitation
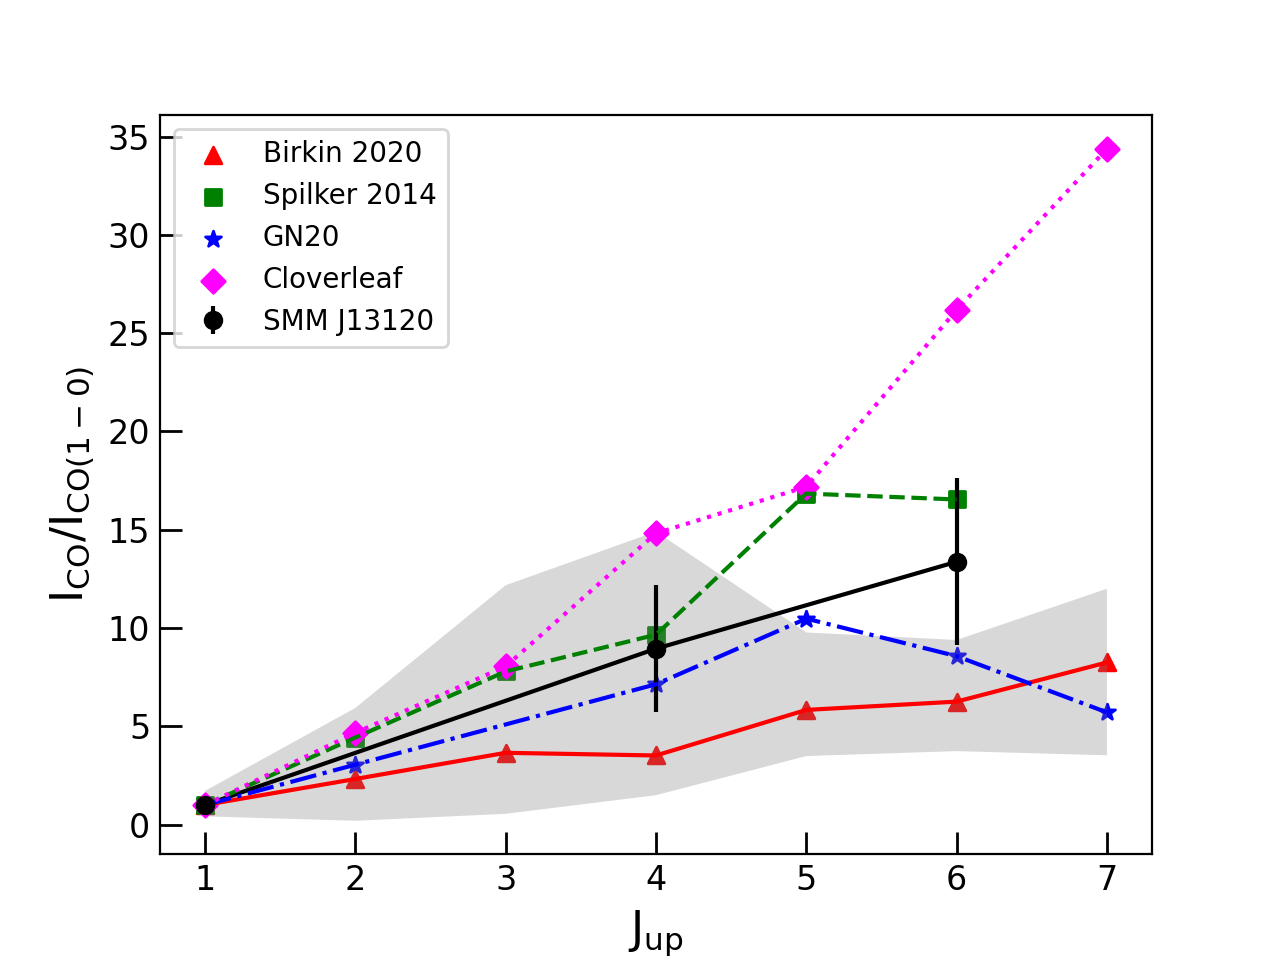
We can build the CO SLED of SMM J13120 using the CO(4-3) and CO(6-5) line luminosities (Greve et al., 2005; Engel et al., 2010). We obtain line luminosity ratios of r43/10 = 0.56 0.20 and r65/10 = 0.37 0.12. Fig. 8, top, shows the CO SLED in comparison with high-redshift systems GN20 (Carilli et al., 2010) and the QSO Cloverleaf (Bradford et al., 2009). We also show the statistical SLEDs derived for high-z SMGs in Birkin et al. (2021) and for 1.4 mm-selected dusty star-forming galaxies in Spilker et al. (2014). The excitation in SMM J13120 agrees well with the general SMG population up to J = 4, with r43/10,SMG = 0.32 0.05, and displays a slightly higher excitation at J = 6, although still consistent with the average r65/10,SMG = 0.3 0.09 (Birkin et al., 2021).
The shape of the CO SLED can give us information on the gas density and temperature distributions. Therefore, we redo the Large Velocity Gradient (LVG) modeling of R11 with the new CO(1-0) line flux. We calculate the brightness temperatures for the observed CO transitions on a grid of kinetic temperature and H2 density spanning 10-200 K and 102.6 - 106.1 cm-3. We fix the H2 ortho-to-para ratio at 3:1 and set the CMB temperature to 12.03 K. We adopt a CO-H2 abundance ratio per velocity gradient of 1 10-5 pc (km s-1)-1 and use the Flower (2001) CO collision rates. We then convert the Rayleigh-Jeans temperature to line intensities and run an MCMC code to obtain the optimal values with uncertainties for the gas kinetic temperature, H2 density and source filling factor. We find that the data is well fit by a two-component LVG model, represented by a diffuse, low-excitation component with a kinetic temperature of Tkin = 255 K and a gas density of = 102.5±0.1 cm-3, and a high-excitation component with Tkin = 405 K and = 104.1±0.3 cm-3 (comparable to the dust temperature of 40 K found by Kovács et al. 2006)111We explored the case where the CO(6-5) line luminosity is contaminated by continuum emission by up to 50%. In the most extreme case, both the Akaike and Bayesian information criteria favour a one-component model.. Despite the significantly revised CO(1-0) luminosity and linewidth, these parameters are almost identical to those found by R11, with the only difference being the density of the warm component, where we find 104.1 cm-3 compared to 104.3 cm-3 in R11.

5 Discussion
5.1 Comparison with the literature
CO lines from levels higher than J=2 are poor tracers of the total molecular gas content in galaxies due to their excitation requirements. Some studies of SMGs (including SMM J13120) have found evidence for very extended CO(1-0) reservoirs and/or broad linewidths in some cases (Ivison et al. 2011, R11) which are not observed in the higher-J CO transitions. Meanwhile, observations sensitive to low-surface-brightness emission on even larger angular scales have uncovered such massive gas reservoirs with radii of tens of kiloparsecs in a range of systems at high-z, from the Spiderweb Galaxy (Emonts et al., 2016) to dusty star forming galaxies and hyper-LIRGs (Frayer et al., 2018; Emonts et al., 2019). These studies suggest the existence of a diffuse, low excitation gas component that is not apparent from mid/high-J observations.
Despite its narrow linewidth, the total cold gas reservoir inferred from the CO(1-0) emission in SMM J13120 has a mass of (13 3) 1010 M⊙, and is extended over 16 kpc in diameter. Although the revised CO(1-0) luminosity is significantly lower than previous estimates (R11), we additionally find that the CO SLED still suggests the presence of two gas components to account for all the recovered CO(1-0) emission, including a diffuse component with Tkin = 255 K and a warmer, denser component with Tkin = 405 K. These findings are in line with other studies of high-z systems with available low-J CO detections (see e.g., Ivison et al. 2011, for unlensed galaxies; Riechers et al. 2011, for unlensed galaxies; Hodge et al. 2013, for unlensed galaxies, and Yang et al. 2017, for lensed sources; Cañameras et al. 2018, for lensed sources; Harrington et al. 2020, for lensed sources), reinforcing the importance of low-J CO observations for establishing the nature of the molecular gas reservoirs in high- systems and their role in early galaxy evolution.
Due to the difficulty of detecting and spatially resolving CO(1-0) at high redshift, there are few other resolved observations of low-J CO transitions in SMGs in the literature. The most direct comparison can be made with GN20 (Carilli et al., 2010; Hodge et al., 2012, 2015), an unlensed, z = 4.05 SMG, and the only other such source with kpc-scale low-J CO imaging. In particular, extensive high-resolution (0.2′′/1.3kpc) observations with the JVLA in CO(2-1) revealed a clumpy, almost equally-extended cold molecular gas reservoir (14 kpc in diameter; Hodge et al., 2012). However, contrary to the study presented here, a dynamical analysis of GN20 found evidence of ordered disk rotation. We note that wet mergers have been shown to rapidly relax into smoothly rotating disks and/or be observationally indistinguishable from rotationally supported disks (e.g., Robertson et al., 2006; Robertson & Bullock, 2008; Bournaud et al., 2009) and thus the presence of ordered rotation alone does not automatically preclude a major merger origin. Nevertheless, the present high-resolution CO(1-0) observations of SMM J13120 stand in stark contrast to the disk-like rotation revealed by the high-resolution CO(2-1) imaging of GN20, implying that we may have caught SMM J13120 in a distinct and potentially short-lived evolutionary stage, as discussed further in the following Section.
5.2 The fate of SMM J13120
With the wealth of data available for SMM J13120, we are now able to speculate about the evolutionary state of this massive, gas-rich galaxy. Previous authors suggested that a late-stage merger could be the most likely explanation for the morphology and velocity field structure in SMM J13120 (Hainline et al., 2006; Engel et al., 2010; Riechers et al., 2011). In the light of our data, we reexamine the evidence supporting this scenario.
SMM J13120 shows a complex and discrepant morphology in CO(1-0) and CO(6-5) emission. The CO(1-0) 0th moment map (Figure 3, top) shows two distinct components separated by 11 kpc. The elongated shape of the main component could be indicative of molecular gas being redistributed around a central potential well. The CO(6-5) emission shows flattening almost perpendicular to CO(1-0), indicating a significant difference in the distribution of diffuse and dense molecular gas.
The narrow linewidth seems at odds with other mergers, which report FWHM 1000 km s-1 (e.g., Oteo et al., 2016), and might be a priori taken as a signature of a dynamically cold, ordered system. However, the PV diagram (Figure 6) and the resolved velocity maps (Figure 3), as well as the low dynamical mass estimate, indicate that the source is viewed close to face-on. In particular, the 1st moment maps show that the velocity gradient follows the minor axis of CO(1-0) emission. The velocity gradient can also be observed in the PV diagram of the CO(6-5) emission. This kinematic structure in the CO(1-0) emission rules out a circular, regularly rotating disk model for the cold molecular gas reservoir, and lends further support to the merger scenario.
These velocity gradients could indicate, however, that the molecular gas, which is at this point mostly concentrated in the main component, is starting to settle into a rotating disc. Simulations have shown that rotating discs of molecular gas can reform on very short timescales after a merger (Robertson et al., 2004; Springel & Hernquist, 2005; Robertson et al., 2006; Hopkins et al., 2009). If SMM J13120 is indeed a late-stage merger, the process of resettling could have already started. The fact that the velocity gradient is aligned with the minor axis is harder to explain. However, CO(6-5) emission is rotated 70 with respect to CO(1-0), such that the observed velocity gradient (pictured at 47) more closely corresponds to the major axis of the CO(6-5) emission. This suggests that the disturbed global CO(1-0) morphology may be due to gas that is still being redistributed, which affected the derivation of the major and minor axis beyond what would be expected from a classical disk.
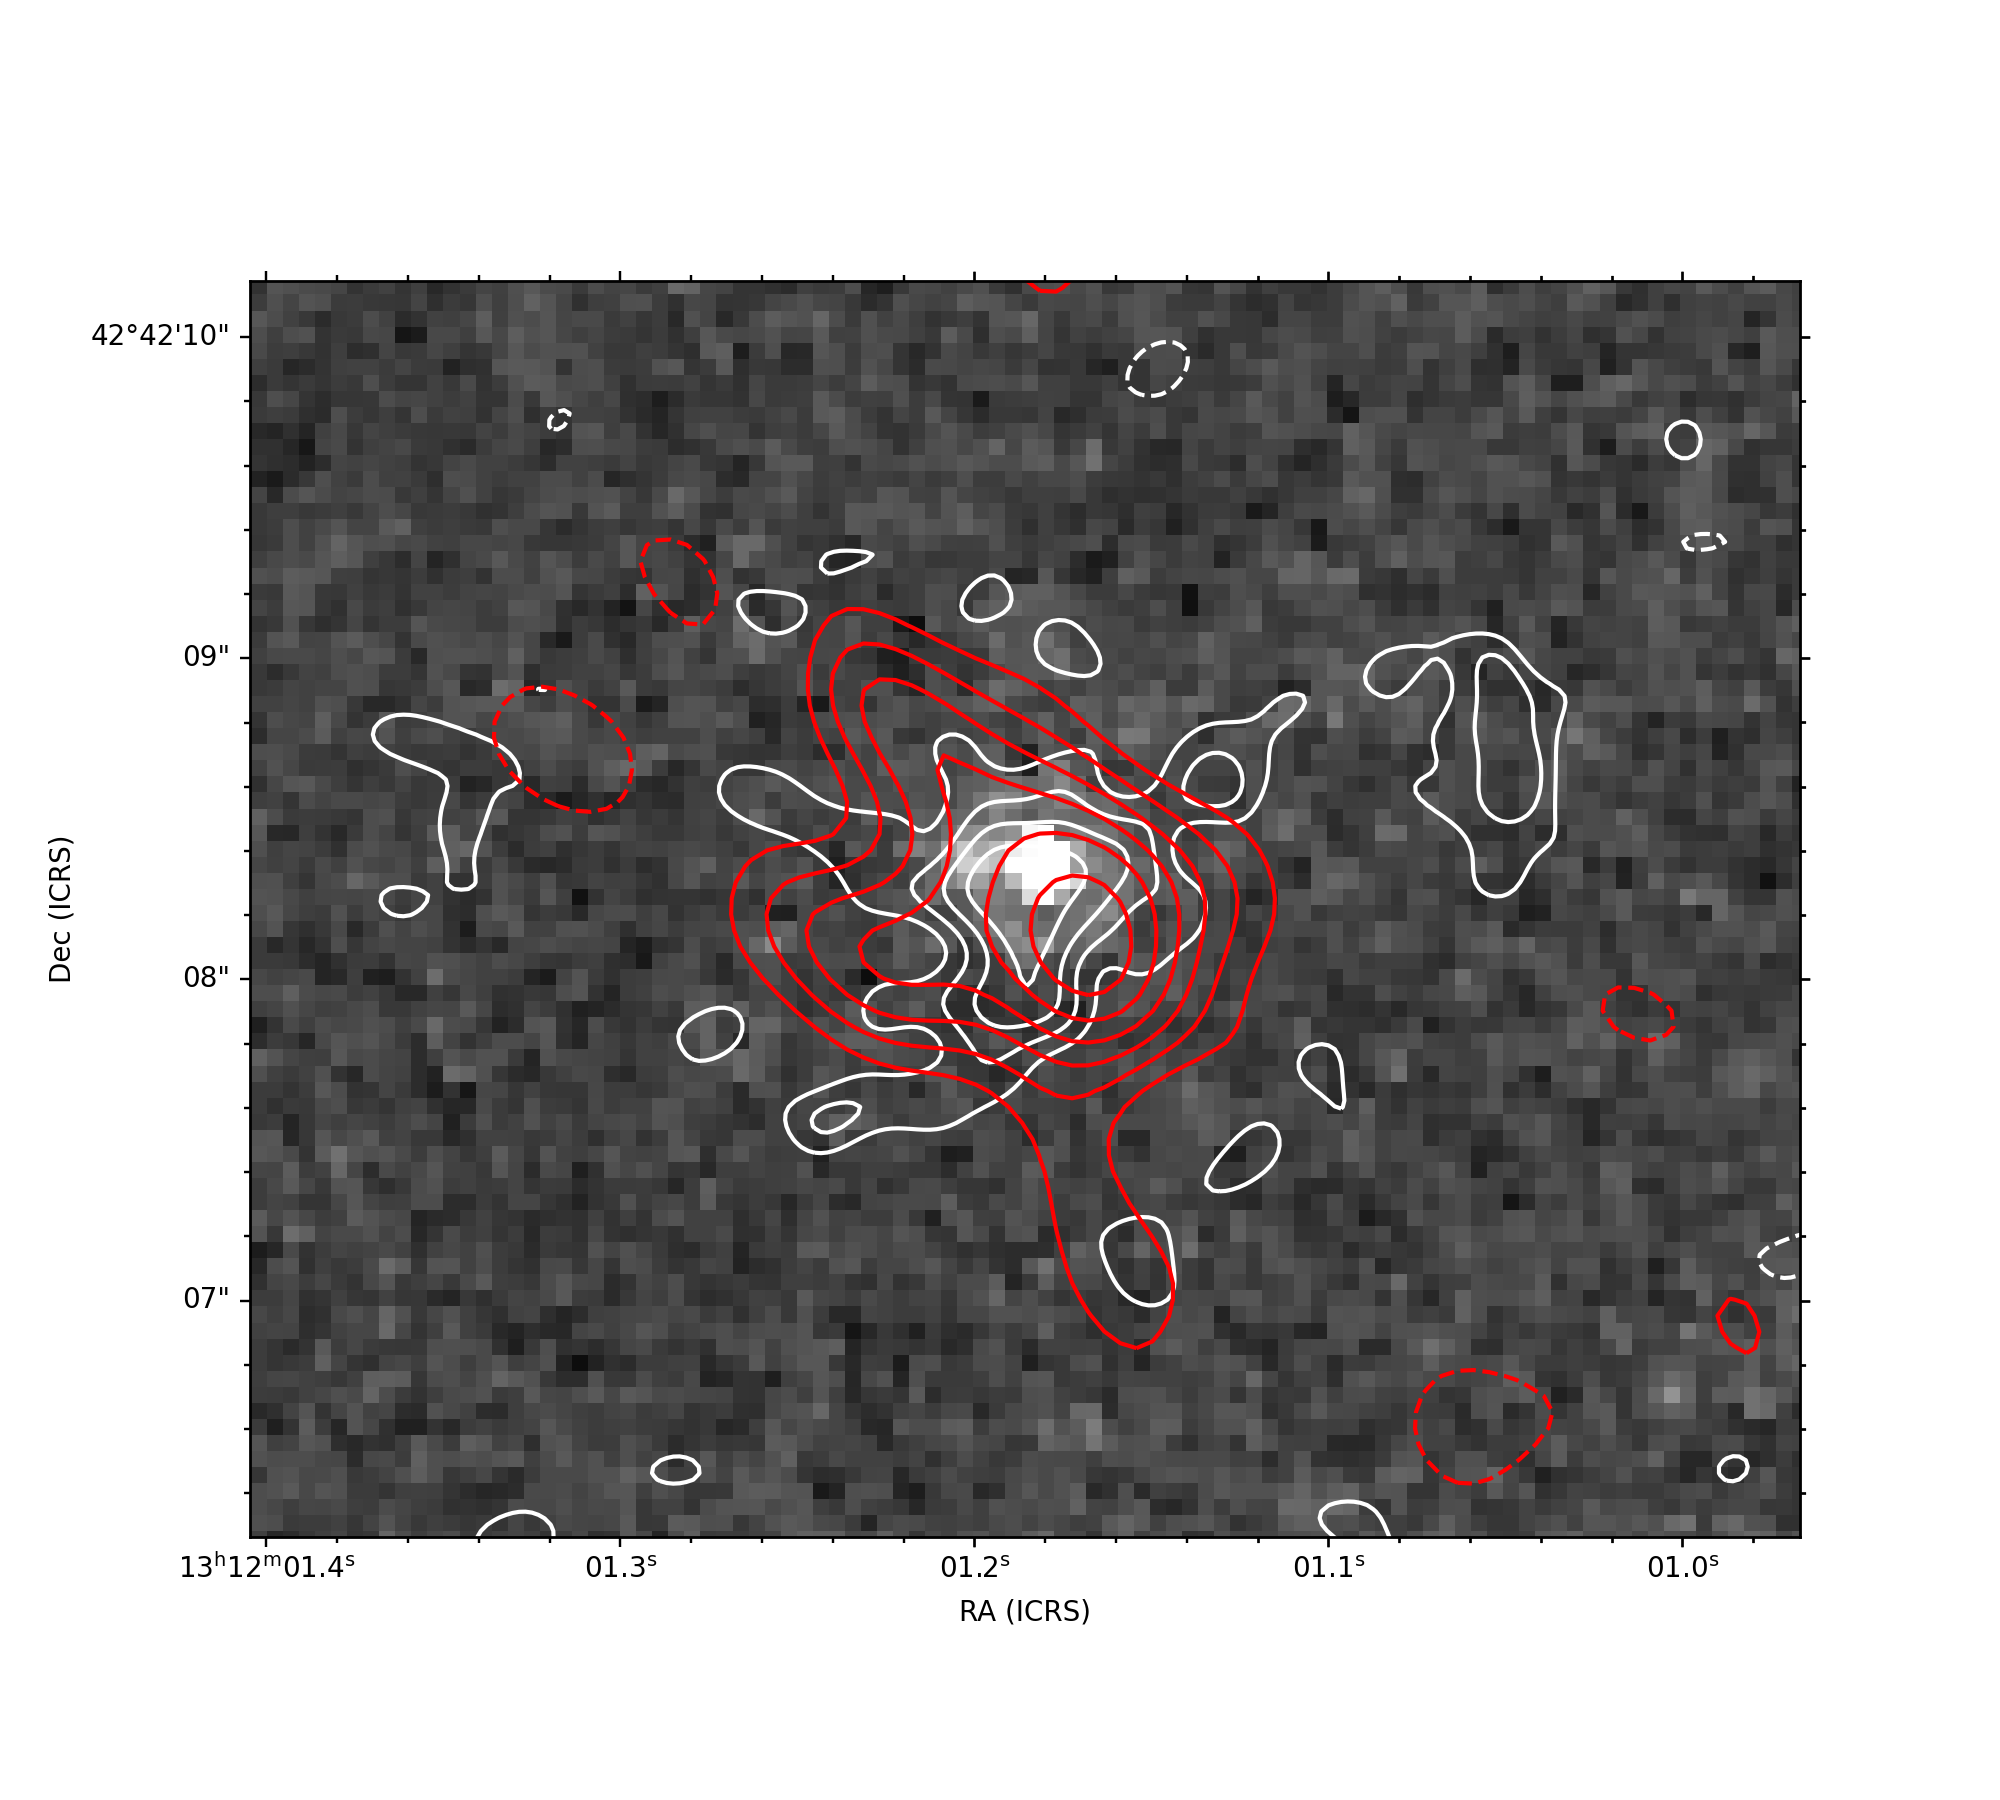
Finally, the merger scenario is supported by a comparison between the CO(1-0) and CO(6-5) line emission and near-IR imaging. Figure 9 shows the near-IR HST/ACS F160W (rest-frame 0.4m) image of SMM J13120. We updated the astrometry of the F160W image by fitting the sources detected in the same field with elliptical Gaussians and matching the peak flux positions with those listed in the Hubble Source Catalogue 222https://catalogs.mast.stsci.edu/hsc/. The CO(6-5) emission is extended on similar scales as CO(1-0), and the peak emission of both lines is coincident with the stellar emission in SMM J13120. The NW component seen in CO(1-0) is not detected in CO(6-5) and near-IR. The compact stellar distribution (r = 1.30.4 kpc, Swinbank et al., 2010) suggests that the merger is in a late stage.
In addition to its large submillimiter flux and extended cold gas reservoir, SMM J13120 shows emission lines in the optical spectrum indicative of the presence of an AGN (Chapman et al., 2005). This system appears thus to present characteristics of both the SMG and AGN populations. According to the current paradigm of galaxy evolution (Sanders et al., 1988; Hopkins et al., 2008; Stacey et al., 2018), a fraction of the AGN population at high-z is transitioning from merger-driven SMGs to unobscured quasars. This transitioning population would retain high rates of dust-obscured star formation, thus being luminous in the far-infrared to mm regime. SMM J13120 presents all the characteristics expected for this population. It is thus possible that SMM J13120 is currently transitioning between an SMG and unobscured QSO. The low depletion timescale suggests a phase of rapid star formation that will quickly deplete its gas reservoir, leaving the SMG phase and becoming an AGN. Our SED fitting reveals that, with SFR = 948 M⊙ yr-1 and M∗ = 6.51011 M⊙, SMM J13120 sits on the massive end of the main sequence at z=3.4 (Speagle et al., 2014). However, the depletion time of 137 Myr is a factor of 2-3 lower than those observed in the general SMG population at this redshift (200-300 Myr, Bothwell et al. 2013; Tacconi et al. 2018; Dudzevičiūtė et al. 2020; Birkin et al. 2021). With a gas fraction also four times lower than expected from empirical scaling relations (Tacconi et al., 2018), this main-sequence galaxy presents characteristics typical of starbursts. Elbaz et al. (2018) found four z2 Herschel-selected MS galaxies to be starbursts ‘hidden’ in the main sequence, with short depletion times, low gas fractions and a spheroid-like morphology in the H-band, attributes we also find in SMM J13120.
The case of SMM J13120 therefore raises two important, connected points. First, it reinforces previous findings that mergers may drive important physical transformations of galaxies without pushing them off the main sequence, although most of the currently available work has been done on the most massive galaxies of the main sequence (M∗ 1011 M⊙; Fensch et al., 2017; Silva et al., 2018; Cibinel et al., 2019; Puglisi et al., 2019; Drew et al., 2020). Second, it demonstrates that the massive end of the main sequence hosts a variety of star formation modes, rather than solely ‘typical star-forming galaxies’ driven by secular evolution.
6 Conclusion
We have presented high-resolution () multi-configuration VLA observations of the z=3.4 SMG SMM J13120+4242 in the CO(1-0) emission line. We derive a gas mass of M= (13 3) 1010 (/1.0) M⊙. The molecular gas reservoir, imaged on 3 kpc scales, extends over 16 kpc, in agreement with previous measurements. The spectral line profile reveals a FWHM of 267 64 km s-1. The deeper data presented in this study are quantitatively consistent with previous, less sensitive VLA CO(1-0) observations, and rule out the presence of a broader linewidth component which appeared previously at low SNR.
We use a virial estimator to estimate a dynamical mass of M = (1.6 0.9) 1011 M⊙. This value is lower than the stellar mass derived from SED fitting (6.45 1011 M⊙), highlighting the impact of the non-gravitationally supported motions seen here on the derivation of the dynamical mass estimate. We thus treat it as a lower limit and use it in combination with the stellar mass to put an upper limit on the CO-to-H2 mass conversion factor, 1.4 M⊙ K-1 km-1 s pc-2, consistent with a ULIRG-like value and comparable with the values derived for other high-z SMGs.
The massive, extended molecular gas reservoir, with 16 kpc diameter, shows a complex velocity field with evidence for a velocity gradient. However, the velocity gradient aligns approximately with the minor axis of the CO(1-0) reservoir, precluding the modelling of the velocity field as a circular rotating disk. Using previous observations of CO(6-5), we confirm that the observed velocity gradient is seen in both transitions, but appears to align with the major axis of the CO(6-5) emission. This suggests that the perturbed gas may have already started settling into a disk but has not yet circularised. A late-stage intermediate (5:1) merger is the most likely cause for the disturbed morphology, chaotic velocity field and intense burst of star formation taking place in SMM J13120.
The CO excitation ladder of the system is well fit by a two component ISM model, with a cold, diffuse component and a warm, denser component, as is characteristic of the average SMG population. The properties presented in this paper suggest that SMM J13120 could be in a transitioning phase between a merger-driven starburst and an unobscured QSO. Given its low depletion timescale (100 Myr), SMM J13120 is expected to quickly deplete its gas reservoir, eventually turning into an unobscured, gas-poor QSO.
We highlight the importance of high-resolution, low-J CO studies for characterising the ISM in high-z SMGs. Although resolved imaging of CO(1-0) at high-z requires significant time investments, our case study of SMM J13120 demonstrates that CO(1-0) is key to accurately characterise the dynamical state of the cold molecular gas. High-resolution kinematic studies like this one are also crucial to better understand differences between gas phases of different excitation. Future surveys of the CO(1-0) gas in larger samples of SMGs and their high-resolution follow-up will shed light on the typical molecular gas conditions in these sources.
References
- Aravena et al. (2016) Aravena, M., Spilker, J. S., Bethermin, M., et al. 2016, MNRAS, 457, 4406, doi: 10.1093/mnras/stw275
- Birkin et al. (2021) Birkin, J. E., Weiss, A., Wardlow, J. L., et al. 2021, MNRAS, 501, 3926, doi: 10.1093/mnras/staa3862
- Bolatto et al. (2013) Bolatto, A. D., Wolfire, M., & Leroy, A. K. 2013, ARA&A, 51, 207, doi: 10.1146/annurev-astro-082812-140944
- Bothwell et al. (2013) Bothwell, M. S., Smail, I., Chapman, S. C., et al. 2013, MNRAS, 429, 3047, doi: 10.1093/mnras/sts562
- Bouché et al. (2015) Bouché, N., Carfantan, H., Schroetter, I., Michel-Dansac, L., & Contini, T. 2015, AJ, 150, 92, doi: 10.1088/0004-6256/150/3/92
- Bournaud et al. (2009) Bournaud, F., Elmegreen, B. G., & Martig, M. 2009, ApJ, 707, L1, doi: 10.1088/0004-637X/707/1/L1
- Bradford et al. (2009) Bradford, C. M., Aguirre, J. E., Aikin, R., et al. 2009, ApJ, 705, 112, doi: 10.1088/0004-637X/705/1/112
- Bruzual & Charlot (2003) Bruzual, G., & Charlot, S. 2003, MNRAS, 344, 1000, doi: 10.1046/j.1365-8711.2003.06897.x
- Cañameras et al. (2018) Cañameras, R., Yang, C., Nesvadba, N. P. H., et al. 2018, A&A, 620, A61, doi: 10.1051/0004-6361/201833625
- Calistro Rivera et al. (2016) Calistro Rivera, G., Lusso, E., Hennawi, J. F., & Hogg, D. W. 2016, ApJ, 833, 98, doi: 10.3847/1538-4357/833/1/98
- Calistro Rivera et al. (2018) Calistro Rivera, G., Hodge, J. A., Smail, I., et al. 2018, The Astrophysical Journal, 863, 56, doi: 10.3847/1538-4357/aacffa
- Cappellari et al. (2009) Cappellari, M., di Serego Alighieri, S., Cimatti, A., et al. 2009, ApJ, 704, L34, doi: 10.1088/0004-637X/704/1/L34
- Carilli & Walter (2013) Carilli, C. L., & Walter, F. 2013, ARA&A, 51, 105, doi: 10.1146/annurev-astro-082812-140953
- Carilli et al. (2010) Carilli, C. L., Daddi, E., Riechers, D., et al. 2010, ApJ, 714, 1407, doi: 10.1088/0004-637X/714/2/1407
- Casey et al. (2014) Casey, C. M., Narayanan, D., & Cooray, A. 2014, Phys. Rep., 541, 45, doi: 10.1016/j.physrep.2014.02.009
- Chapman et al. (2005) Chapman, S. C., Blain, A. W., Smail, I., & Ivison, R. J. 2005, ApJ, 622, 772, doi: 10.1086/428082
- Cibinel et al. (2019) Cibinel, A., Daddi, E., Sargent, M. T., et al. 2019, MNRAS, 485, 5631, doi: 10.1093/mnras/stz690
- Combes et al. (2013) Combes, F., García-Burillo, S., Braine, J., et al. 2013, A&A, 550, A41, doi: 10.1051/0004-6361/201220392
- da Cunha et al. (2015) da Cunha, E., Walter, F., Smail, I. R., et al. 2015, ApJ, 806, 110, doi: 10.1088/0004-637X/806/1/110
- Danielson et al. (2017) Danielson, A. L. R., Swinbank, A. M., Smail, I., et al. 2017, ApJ, 840, 78, doi: 10.3847/1538-4357/aa6caf
- Davé et al. (2019) Davé, R., Anglés-Alcázar, D., Narayanan, D., et al. 2019, MNRAS, 486, 2827, doi: 10.1093/mnras/stz937
- Decarli et al. (2020) Decarli, R., Aravena, M., Boogaard, L., et al. 2020, ApJ, 902, 110, doi: 10.3847/1538-4357/abaa3b
- Diemer et al. (2019) Diemer, B., Stevens, A. R. H., Lagos, C. d. P., et al. 2019, MNRAS, 487, 1529, doi: 10.1093/mnras/stz1323
- Drew et al. (2020) Drew, P. M., Casey, C. M., Cooray, A., & Whitaker, K. E. 2020, ApJ, 892, 104, doi: 10.3847/1538-4357/ab7939
- Dudzevičiūtė et al. (2020) Dudzevičiūtė, U., Smail, I., Swinbank, A. M., et al. 2020, Monthly Notices of the Royal Astronomical Society, 494, 3828–3860, doi: 10.1093/mnras/staa769
- Elbaz et al. (2018) Elbaz, D., Leiton, R., Nagar, N., et al. 2018, A&A, 616, A110, doi: 10.1051/0004-6361/201732370
- Emonts et al. (2019) Emonts, B. H. C., Cai, Z., Prochaska, J. X., Li, Q., & Lehnert, M. D. 2019, ApJ, 887, 86, doi: 10.3847/1538-4357/ab45f4
- Emonts et al. (2016) Emonts, B. H. C., Lehnert, M. D., Villar-Martín, M., et al. 2016, Science, 354, 1128, doi: 10.1126/science.aag0512
- Engel et al. (2010) Engel, H., Tacconi, L. J., Davies, R. I., et al. 2010, ApJ, 724, 233, doi: 10.1088/0004-637X/724/1/233
- Fensch et al. (2017) Fensch, J., Renaud, F., Bournaud, F., et al. 2017, MNRAS, 465, 1934, doi: 10.1093/mnras/stw2920
- Flower (2001) Flower, D. R. 2001, Journal of Physics B Atomic Molecular Physics, 34, 2731, doi: 10.1088/0953-4075/34/13/315
- Fomalont et al. (2006) Fomalont, E. B., Kellermann, K. I., Cowie, L. L., et al. 2006, ApJS, 167, 103, doi: 10.1086/508169
- Frayer et al. (2018) Frayer, D. T., Maddalena, R. J., Ivison, R. J., et al. 2018, ApJ, 860, 87, doi: 10.3847/1538-4357/aac49a
- Gong et al. (2020) Gong, M., Ostriker, E. C., Kim, C.-G., & Kim, J.-G. 2020, ApJ, 903, 142, doi: 10.3847/1538-4357/abbdab
- Greve et al. (2005) Greve, T. R., Bertoldi, F., Smail, I., et al. 2005, MNRAS, 359, 1165, doi: 10.1111/j.1365-2966.2005.08979.x
- Hainline (2008) Hainline, L. J. 2008, PhD thesis, California Institute of Technology
- Hainline et al. (2006) Hainline, L. J., Blain, A. W., Greve, T. R., et al. 2006, ApJ, 650, 614, doi: 10.1086/507443
- Harrington et al. (2020) Harrington, K. C., Weiss, A., Yun, M. S., et al. 2020, arXiv e-prints, arXiv:2010.16231. https://arxiv.org/abs/2010.16231
- Hodge et al. (2013) Hodge, J. A., Carilli, C. L., Walter, F., Daddi, E., & Riechers, D. 2013, ApJ, 776, 22, doi: 10.1088/0004-637X/776/1/22
- Hodge et al. (2012) Hodge, J. A., Carilli, C. L., Walter, F., et al. 2012, ApJ, 760, 11, doi: 10.1088/0004-637X/760/1/11
- Hodge & da Cunha (2020) Hodge, J. A., & da Cunha, E. 2020, Royal Society Open Science, 7, 200556, doi: 10.1098/rsos.200556
- Hodge et al. (2015) Hodge, J. A., Riechers, D., Decarli, R., et al. 2015, ApJ, 798, L18, doi: 10.1088/2041-8205/798/1/L18
- Hopkins et al. (2009) Hopkins, P. F., Cox, T. J., Younger, J. D., & Hernquist, L. 2009, ApJ, 691, 1168, doi: 10.1088/0004-637X/691/2/1168
- Hopkins et al. (2008) Hopkins, P. F., Hernquist, L., Cox, T. J., & Kereš, D. 2008, ApJS, 175, 356, doi: 10.1086/524362
- Ivison et al. (2011) Ivison, R. J., Papadopoulos, P. P., Smail, I., et al. 2011, MNRAS, 412, 1913, doi: 10.1111/j.1365-2966.2010.18028.x
- Kennicutt & Evans (2012) Kennicutt, R. C., & Evans, N. J. 2012, ARA&A, 50, 531, doi: 10.1146/annurev-astro-081811-125610
- Kovács et al. (2006) Kovács, A., Chapman, S. C., Dowell, C. D., et al. 2006, ApJ, 650, 592, doi: 10.1086/506341
- Madau & Dickinson (2014) Madau, P., & Dickinson, M. 2014, ARA&A, 52, 415, doi: 10.1146/annurev-astro-081811-125615
- Magnelli et al. (2012a) Magnelli, B., Lutz, D., Santini, P., et al. 2012a, A&A, 539, A155, doi: 10.1051/0004-6361/201118312
- Magnelli et al. (2012b) Magnelli, B., Saintonge, A., Lutz, D., et al. 2012b, A&A, 548, A22, doi: 10.1051/0004-6361/201220074
- McAlpine et al. (2019) McAlpine, S., Smail, I., Bower, R. G., et al. 2019, MNRAS, 488, 2440, doi: 10.1093/mnras/stz1692
- McMullin et al. (2007) McMullin, J. P., Waters, B., Schiebel, D., Young, W., & Golap, K. 2007, in Astronomical Society of the Pacific Conference Series, Vol. 376, Astronomical Data Analysis Software and Systems XVI, ed. R. A. Shaw, F. Hill, & D. J. Bell, 127
- Michałowski et al. (2010) Michałowski, M., Hjorth, J., & Watson, D. 2010, A&A, 514, A67, doi: 10.1051/0004-6361/200913634
- Mineo et al. (2014) Mineo, S., Gilfanov, M., Lehmer, B. D., Morrison, G. E., & Sunyaev, R. 2014, MNRAS, 437, 1698, doi: 10.1093/mnras/stt1999
- mneeleman & Prochaska (2021) mneeleman, & Prochaska, J. X. 2021, mneeleman/qubefit: Small documentation updates, v1.0.1, Zenodo, doi: 10.5281/zenodo.4534407
- Narayanan et al. (2012) Narayanan, D., Bothwell, M., & Davé, R. 2012, Monthly Notices of the Royal Astronomical Society, 426, 1178, doi: 10.1111/j.1365-2966.2012.21893.x
- Narayanan & Krumholz (2014) Narayanan, D., & Krumholz, M. R. 2014, MNRAS, 442, 1411, doi: 10.1093/mnras/stu834
- Nayyeri et al. (2017) Nayyeri, H., Cooray, A., Jullo, E., et al. 2017, ApJ, 844, 82, doi: 10.3847/1538-4357/aa7aa0
- Offringa & Smirnov (2017) Offringa, A. R., & Smirnov, O. 2017, MNRAS, 471, 301, doi: 10.1093/mnras/stx1547
- Offringa et al. (2014) Offringa, A. R., McKinley, B., Hurley-Walker, N., et al. 2014, MNRAS, 444, 606, doi: 10.1093/mnras/stu1368
- Oteo et al. (2016) Oteo, I., Ivison, R. J., Dunne, L., et al. 2016, ApJ, 827, 34, doi: 10.3847/0004-637X/827/1/34
- Pavesi et al. (2018) Pavesi, R., Sharon, C. E., Riechers, D. A., et al. 2018, ApJ, 864, 49, doi: 10.3847/1538-4357/aacb79
- Planck Collaboration et al. (2020) Planck Collaboration, Aghanim, N., Akrami, Y., et al. 2020, A&A, 641, A6, doi: 10.1051/0004-6361/201833910
- Popping et al. (2019) Popping, G., Pillepich, A., Somerville, R. S., et al. 2019, ApJ, 882, 137, doi: 10.3847/1538-4357/ab30f2
- Puglisi et al. (2019) Puglisi, A., Daddi, E., Liu, D., et al. 2019, ApJ, 877, L23, doi: 10.3847/2041-8213/ab1f92
- Rawle et al. (2014) Rawle, T. D., Egami, E., Bussmann, R. S., et al. 2014, ApJ, 783, 59, doi: 10.1088/0004-637X/783/1/59
- Richards et al. (2006) Richards, G. T., Lacy, M., Storrie-Lombardi, L. J., et al. 2006, ApJS, 166, 470, doi: 10.1086/506525
- Riechers et al. (2011) Riechers, D. A., Hodge, J., Walter, F., Carilli, C. L., & Bertoldi, F. 2011, ApJ, 739, L31, doi: 10.1088/2041-8205/739/1/L31
- Riechers et al. (2013) Riechers, D. A., Bradford, C. M., Clements, D. L., et al. 2013, Nature, 496, 329, doi: 10.1038/nature12050
- Riechers et al. (2019) Riechers, D. A., Pavesi, R., Sharon, C. E., et al. 2019, ApJ, 872, 7, doi: 10.3847/1538-4357/aafc27
- Riechers et al. (2020) Riechers, D. A., Boogaard, L. A., Decarli, R., et al. 2020, ApJ, 896, L21, doi: 10.3847/2041-8213/ab9595
- Riechers et al. (2021) Riechers, D. A., Nayyeri, H., Burgarella, D., et al. 2021, ApJ, 907, 62, doi: 10.3847/1538-4357/abcf2e
- Robertson et al. (2006) Robertson, B., Bullock, J. S., Cox, T. J., et al. 2006, ApJ, 645, 986, doi: 10.1086/504412
- Robertson et al. (2004) Robertson, B., Yoshida, N., Springel, V., & Hernquist, L. 2004, ApJ, 606, 32, doi: 10.1086/382871
- Robertson & Bullock (2008) Robertson, B. E., & Bullock, J. S. 2008, ApJ, 685, L27, doi: 10.1086/592329
- Saintonge et al. (2013) Saintonge, A., Lutz, D., Genzel, R., et al. 2013, ApJ, 778, 2, doi: 10.1088/0004-637X/778/1/2
- Sanders et al. (1988) Sanders, D. B., Soifer, B. T., Elias, J. H., et al. 1988, ApJ, 325, 74, doi: 10.1086/165983
- Schreiber et al. (2016) Schreiber, C., Elbaz, D., Pannella, M., et al. 2016, A&A, 589, A35, doi: 10.1051/0004-6361/201527200
- Scoville et al. (2016) Scoville, N., Sheth, K., Aussel, H., et al. 2016, ApJ, 820, 83, doi: 10.3847/0004-637X/820/2/83
- Sharon et al. (2016) Sharon, C. E., Riechers, D. A., Hodge, J., et al. 2016, ApJ, 827, 18, doi: 10.3847/0004-637X/827/1/18
- Sharon et al. (2019) Sharon, C. E., Tagore, A. S., Baker, A. J., et al. 2019, ApJ, 879, 52, doi: 10.3847/1538-4357/ab22b9
- Silva et al. (2018) Silva, A., Marchesini, D., Silverman, J. D., et al. 2018, ApJ, 868, 46, doi: 10.3847/1538-4357/aae847
- Smail et al. (2004) Smail, I., Chapman, S. C., Blain, A. W., & Ivison, R. J. 2004, ApJ, 616, 71, doi: 10.1086/424896
- Solomon et al. (1997) Solomon, P. M., Downes, D., Radford, S. J. E., & Barrett, J. W. 1997, ApJ, 478, 144, doi: 10.1086/303765
- Solomon & Vanden Bout (2005) Solomon, P. M., & Vanden Bout, P. A. 2005, ARA&A, 43, 677, doi: 10.1146/annurev.astro.43.051804.102221
- Speagle et al. (2014) Speagle, J. S., Steinhardt, C. L., Capak, P. L., & Silverman, J. D. 2014, ApJS, 214, 15, doi: 10.1088/0067-0049/214/2/15
- Spilker et al. (2014) Spilker, J. S., Marrone, D. P., Aguirre, J. E., et al. 2014, ApJ, 785, 149, doi: 10.1088/0004-637X/785/2/149
- Springel & Hernquist (2005) Springel, V., & Hernquist, L. 2005, ApJ, 622, L9, doi: 10.1086/429486
- Stacey et al. (2018) Stacey, H. R., McKean, J. P., Robertson, N. C., et al. 2018, MNRAS, 476, 5075, doi: 10.1093/mnras/sty458
- Stalevski et al. (2016) Stalevski, M., Ricci, C., Ueda, Y., et al. 2016, MNRAS, 458, 2288, doi: 10.1093/mnras/stw444
- Suzuki et al. (2020) Suzuki, T. L., Onodera, M., Kodama, T., et al. 2020, arXiv e-prints, arXiv:2012.09447. https://arxiv.org/abs/2012.09447
- Swinbank et al. (2010) Swinbank, A. M., Smail, I., Chapman, S. C., et al. 2010, MNRAS, 405, 234, doi: 10.1111/j.1365-2966.2010.16485.x
- Swinbank et al. (2013) Swinbank, A. M., Simpson, J. M., Smail, I., et al. 2013, Monthly Notices of the Royal Astronomical Society, 438, 1267, doi: 10.1093/mnras/stt2273
- Tacconi et al. (2020) Tacconi, L. J., Genzel, R., & Sternberg, A. 2020, ARA&A, 58, 157, doi: 10.1146/annurev-astro-082812-141034
- Tacconi et al. (2008) Tacconi, L. J., Genzel, R., Smail, I., et al. 2008, ApJ, 680, 246, doi: 10.1086/587168
- Tacconi et al. (2018) Tacconi, L. J., Genzel, R., Saintonge, A., et al. 2018, ApJ, 853, 179, doi: 10.3847/1538-4357/aaa4b4
- Walter et al. (2016) Walter, F., Decarli, R., Aravena, M., et al. 2016, ApJ, 833, 67, doi: 10.3847/1538-4357/833/1/67
- Walter et al. (2020) Walter, F., Carilli, C., Neeleman, M., et al. 2020, ApJ, 902, 111, doi: 10.3847/1538-4357/abb82e
- Wang et al. (2016) Wang, S., Liu, J., Qiu, Y., et al. 2016, ApJS, 224, 40, doi: 10.3847/0067-0049/224/2/40
- Wu et al. (2019) Wu, Y.-H., Goto, T., Kilerci-Eser, E., et al. 2019, MNRAS, 483, 5281, doi: 10.1093/mnras/sty3392
- Yang et al. (2017) Yang, C., Omont, A., Beelen, A., et al. 2017, A&A, 608, A144, doi: 10.1051/0004-6361/201731391
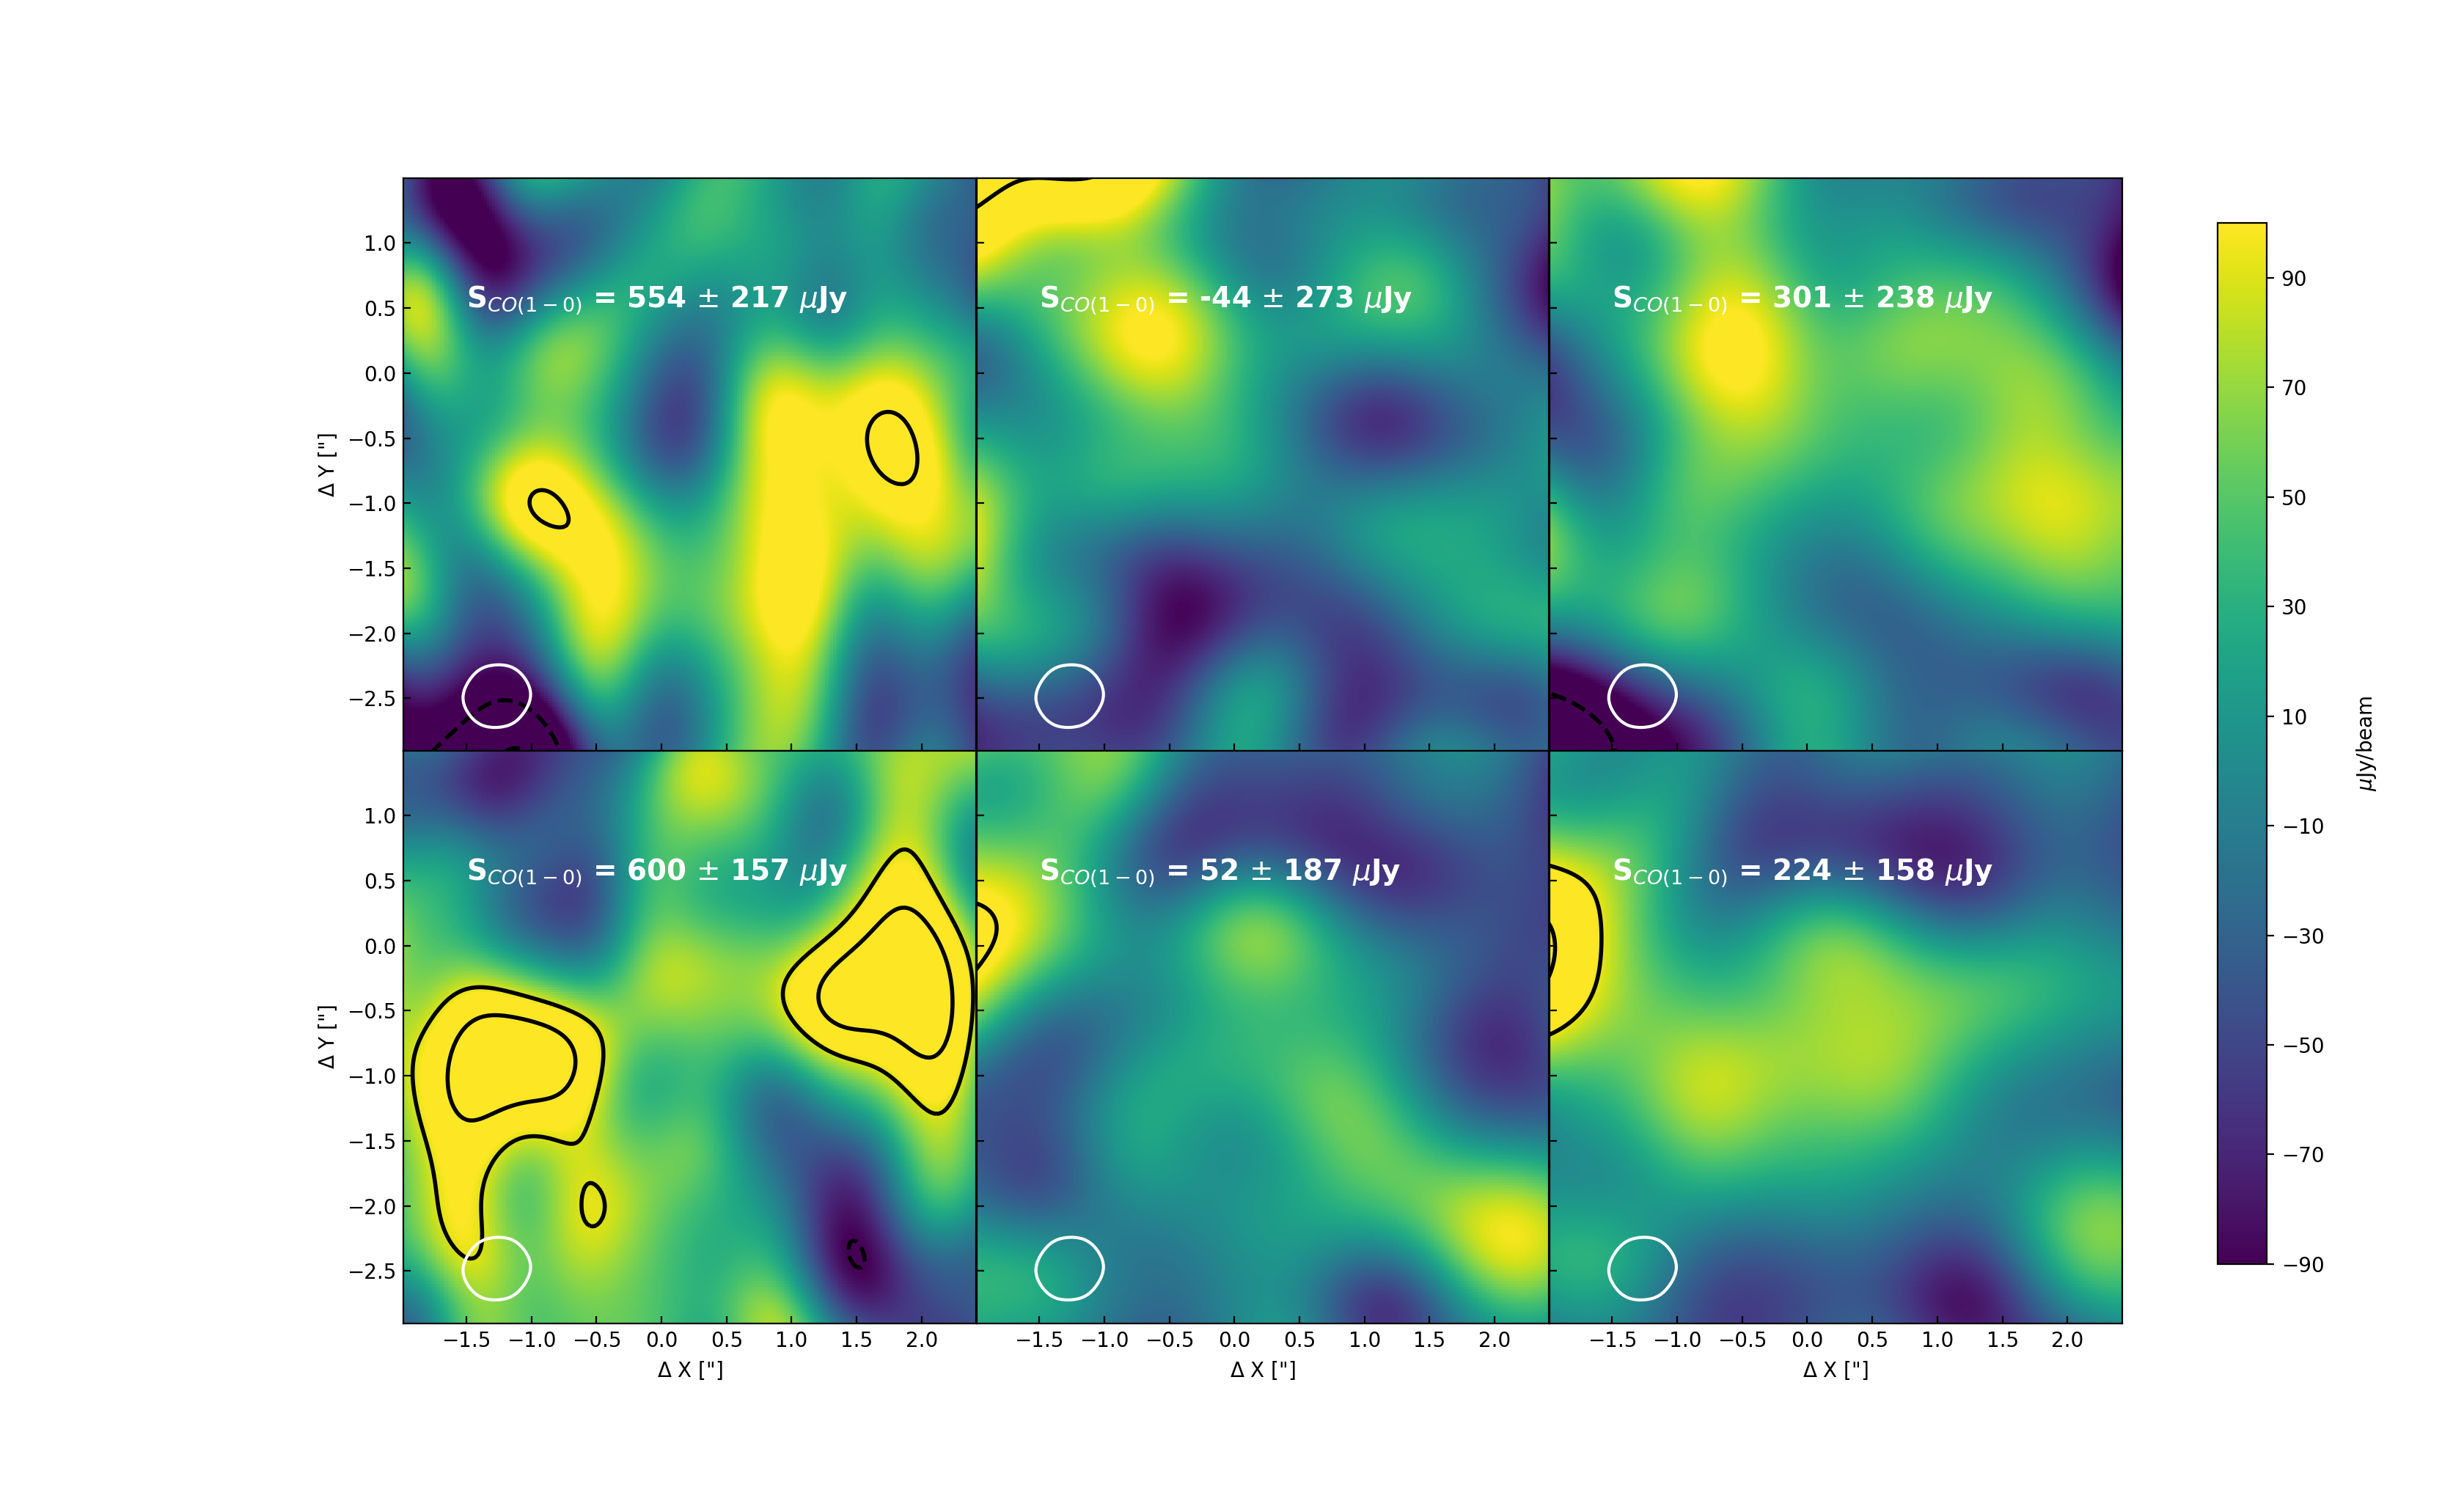
With the earlier VLA CO(1-0) data set used in R11, the CO(1-0) spectrum indicated a very broad linewidth of 1000 km s-1, similar to the GBT single-dish spectrum from Hainline et al. 2006. After independently re-analysing the R11 data, we recover the seemingly extended line emission. However, the deeper multi-configuration data presented here (including the R11 data) reveals a much narrower line FWHM. Figure 10 shows the CO(1-0) spectrum of SMM J13120 binned in channels of 138 km s-1 to increase the SNR. We do not recover any such broad component despite the fact that the combined data are two times more sensitive at matched resolution.
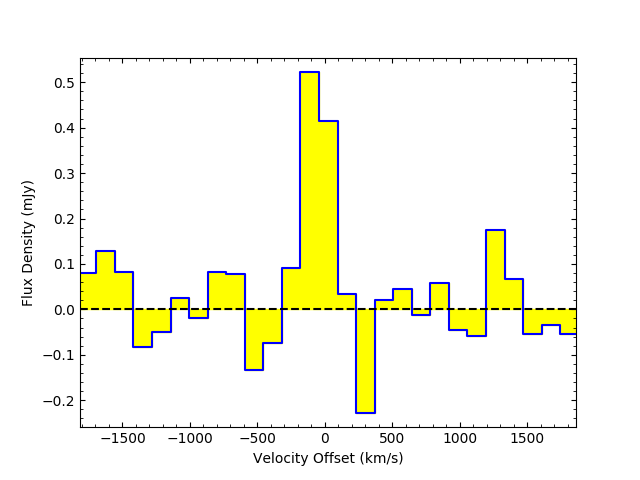
To further search for this broad component in the new data, we tapered both sets to the same resolution of 0.94. The tapered channel maps do not show further emission with respect to the native resolution channel maps (Figure 11). We then made 0th moment maps collapsed over the negative (-800 to -600 km s-1) and positive (400 to 600 km s-1) velocity offsets where emission was originally apparent in the spectrum in R11. The 0th moment maps are shown in Fig. 12. We compare emission seen in the earlier VLA data R11, the new data set and the combined datasets. We do not recover any emission above 2 significance in the new and combined datasets. Moreover, the flux densities we measure are consistent within 2 with the earlier R11 data, highlighting the uncertainty in the original dataset.
