Hubble Space Telescope STIS Spectroscopy of Nova T Aurigae 1891
Abstract
T Aurigae is an eclipsing old nova which exploded in 1891.
At a Gaia EDR3 distance of 815-871 pc, it is a relatively nearby old nova.
Through ultraviolet spectral modeling and using the new precise Gaia distance,
we find that the HST/STIS spectrum of T Aurigae is consistent with an accretion disk
with a mass transfer rate of the order of /yr,
for a white dwarf mass of , an
inclination of , and a Gaia distance of of pc.
The sharp absorption lines of metals cannot form in the disk and are likely forming in
material above the disk (e.g. due stream disk overflow), in circumbinary
material, and/or in material associated with the ejected shell from the 1891 nova explosion.
The saturated hydrogen Ly absorption feature is attributed to a large interstellar medium
hydrogen column density of the order of cm-2 towards T Aur,
as corroborated by the value of its reddening .
1.1in
1 Introduction
T Aurigae (henceforth T Aur) is a cataclysmic variable consisting of a white dwarf in a compact binary with a Roche lobe-filling main sequence-like donor star. The system underwent a classical nova explosion in 1891. As hydrogen-rich material builds up on the surface of the white dwarf, the critical pressure and ignition temperature is reached at the base of the accreted envelope for hydrogen fusion in electron degenerate layers. Hence, nuclear energy is released but there is no compensating expansion of the burning region to cool because the equation of state of the degenerate matter is insensitive to temperature. A runaway thermonuclear explosion occurs identified as the classical nova (Mestel, 1952; Starrfiels, 1971). The evolution of old novae is poorly understood for several reasons. Most studies focus on either, the nova explosion itself, the decline from outburst and abundances of metals from the emission lines that form in the nova shell as it expands. Moreover, the time baseline of even the oldest old nova is too short to determine the long term accretion rate
T Aur is a relatively nearby nova. The Gaia EDR3 parallax restricts the distance to pc, or pc, where we follow Schaefer (2018) to derive the distance using the Gaia EDR3 parallax and error (note that in Schaefer (2018) the Gaia DR2 data gives pc). Walker (1963) discovered that T Aur is an eclipsing binary with a period of 4 hours and 54 minutes. The light curve is of Algol nature and no secondary eclipse is observed. Walker (1963) also noted smaller variations in the light output (flickering) which are present in the current AAVSO light curves. These smaller light variations are also present in the nova system DQ Her and are indicative of accretion (Hege et al.1980). Following the nova in 1891, T Aur brightened significantly, reaching a visual magnitude of 4.5. Since the explosion, T Aur has returned to quiescence, settling at a visual magnitude of 14.9 (Strope, 2010).
Using the classification developed by Strope (2010), the light curve of T Aur 1891 eruption is a D type, representing a dust dip type. Following an increase in brightness from the nova outburst, T Aur underwent a fast decline before reaching a minimum and returning to quiescence. This large dip in brightness is almost certainly caused by the formation of dust particles in the expanding nova shell as the temperature of the shell decreases. As the dust particles continue to expand and attenuate, the brightness recovers. T Aur also has an impressive nova shell which has been imaged and studied by Santamaría (2020). The shell is moving rapidly outward with an expansion velocity along the minor axis of 315 km/s. System parameters have been previously derived and given in Table 1 as reported in the literature.
Most of the previous analyses (e.g. Patterson, 1984; Dubus et al., 2018) were completed using optical observations, which may be affected by the stream impact zone at the edge of the accretion disk, the Roche lobe-filling secondary donor star or surrounding nebular material.
Our analysis utilizes observations in the far ultraviolet wavelength range where the spectral energy distribution of the accretion disks and the white dwarf photospheres have their peak intensities. This minimizes or eliminates some of the contamination of the UV spectrum due to the hot spot (impact zone), the secondary donor star, and/or surrounding nebular material.
In section 2, we describe the synthetic spectral model codes for disks and photospheres that we employ, in section 3, we present the model fitting analysis of the HST spectrum and in section 4, we discuss our results and summarize our conclusions.
| Parameter | Value | References |
|---|---|---|
| Period | 0.204 days | Walker (1963) |
| Inclination | Selvelli & Gillmozzi (2019) | |
| Distance | pc | Gaia EDR3 |
| 0.420.08 | Selvelli & Gillmozzi (2013) | |
| Secondary Type | K5 | Bianchini (1980) |
| WD Mass | 0.70.2 | Selvelli & Gillmozzi (2019) |
| WD Radius (quiescence) | 0.011 | Bianchini (1980) |
| Secondary Mass | 0.63 | Bianchini (1980) |
| Secondary Temperature | 4000 K |
2 Archival Data
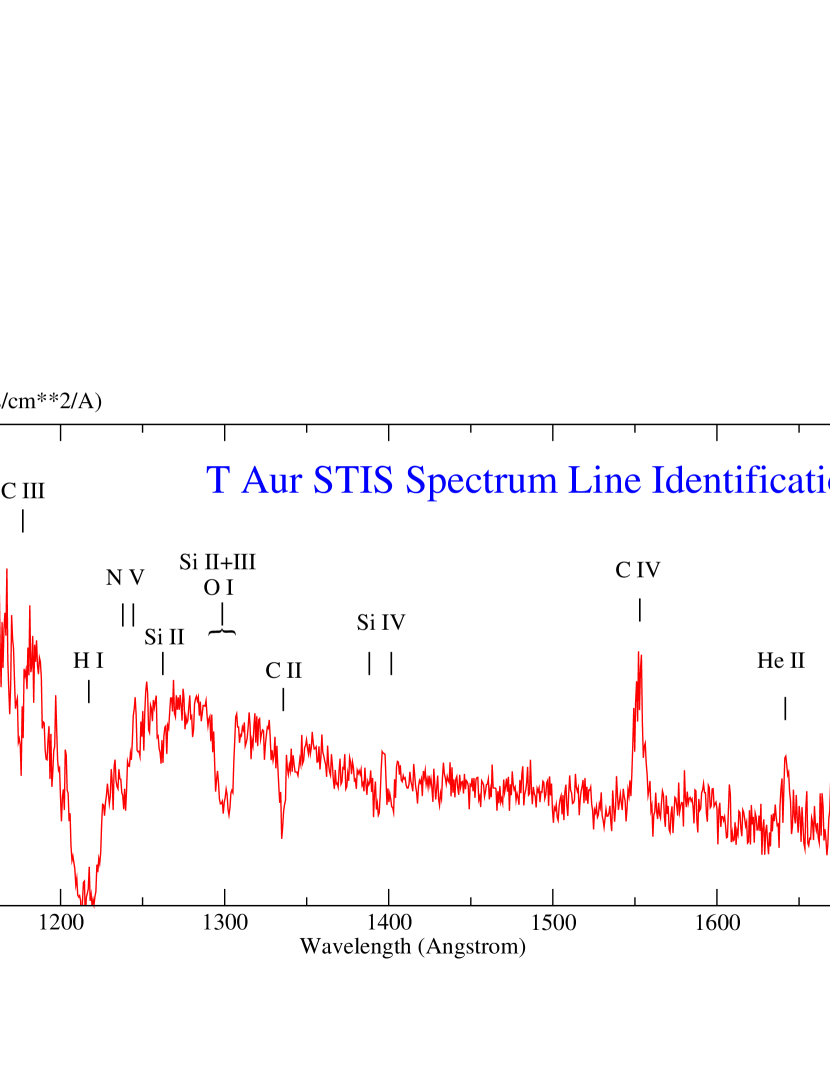
We retrieved the Hubble Space Telescope Imaging Spectrograph data from the MAST archive that had been obtained during a quiescent interval on March 7, 2003 (UT start time 12:01:54). The data (O6LI0M010) were collected in ACCUM mode using the 52X0.2 aperture, and totaled 600 s of good exposure time. The FUV-MAMA detector was set with the G140L grating centered at 1425 Å, thereby covering the wavelength range 1150 - 1715 Å. The data were processed through the pipeline with CALSTIS version 3.4. The extracted HST STIS spectrum is displayed in Fig.1, where it has been dereddened assuming (Selvelli & Gillmozzi, 2013). This value of the reddening agrees within the error bars with the value of assessed from the 3D map of the local ISM (Lallement et al., 2014; Capitanio et al., 2017; Lallement et al., 2019). Since T Aur has a nebula, it is likely that its nebular material contributes additional reddening to that of the ISM. In Fig.1, we identify absorption lines due to C iii (1175), N v doublet (), Si ii (1260, 1265), C ii (1335), Si ii+iii () + O i (), Si iv doublet (), and the unidentified feature at 1500 Å, first noted by Selvelli and Gilmozzi (2013; see their Table 14) who observed the same feature being present in the HST spectrum of the old nova DI Lac. Only two emission lines are evident: the C iv (1550) and the He ii (1640) lines. At the time of the observation the altitude of the sun was below the Earth’s limb, therefore minimizing airglow (Ly and O i) emissions.
3 Spectral Analysis and Results
3.1 A White Dwarf Scenario?
Our first glance at the spectrum gave us the impression that it resembled the FUV spectrum of a bare, hot accreting white dwarf with little evidence of an accretion disk. This initial impression was based upon the fact that no optically thick steady state accretion disk spectrum with solar composition at any inclination can replicate the rich absorption line spectrum of T Aur. The absorption lines in accretion disks at any inclination, except face-on, are Keplerian-broadened to the extent that the model absorption features are ”washed out” far too shallow and broad. Furthermore, we noted the presence of the Si ii 1265 Å line which arises from an excited level, only populated at higher densities, typically the earmark of a white dwarf photosphere. Finally, the hydrogen Ly absorption appears to be saturated which is still another earmark of an exposed accreting white dwarf. These characteristics led us to test the white dwarf interpretation with the following simple exercise before we carried out detailed modeling.
We estimate the observed UV luminosity of T Aur by the mean UV flux level of the STIS spectrum over the spectral range of 700 Å. We estimated the average flux from the STIS spectrum to be erg/cm2/s/Å. This average flux is multiplied by the wavelength range of 700 Å to obtain . The observed luminosity is given by
| (1) |
By using the Gaia distance of 840 pc, we obtain an observed luminosity on the order of erg/s.
We compare this observed luminosity with the bolometric luminosity output of an accreting white dwarf at a temperature of 30,000 K and a radius of 0.012 , using the Stefan-Boltzmann Law. The luminosity output of the accreting white dwarf is on the order of erg/s, two orders of magnitude smaller than the observed luminosity computed above.
If the UV flux was due to a white dwarf photosphere, the spectral analysis (see below) indicates that it would correspond to a WD with a gravity and temperature of 28,500 K. While such a gravity gives a WD mass of , close to the of Selvelli & Gillmozzi (2019), the scaling of the spectrum gives a distance of only 88 pc, or about 10 times shorter than the Gaia distance of 840 pc (which accounts for a flux 100 times smaller).
For the luminosity of the accretion disk, we follow Frank et al. (1992), and calculate the luminosity of the accretion disk by estimating how efficiently the rest mass energy, per unit mass, of the accreted material is converted to radiation. This efficiency is parameterized by a dimensionless quantity, , given by
| (2) |
The bolometric luminosity of the accretion disk is then given by
| (3) |
Taking the same parameters we used for the white dwarf above, we find that the disk luminosity is of order of ergs/s for an accretion rate of /yr. This disk luminosity is is of the same order of magnitude as the above derived observed UV luminosity. Thus, accretion light from a disk fully accounts for the observed luminosity of T Aur.
Our examination of the ISM in line of sight to T Aur enabled us to account for the saturation of the Ly absorption. As shown in Fig. 4, the Ly absorption line is accounted for by high column densities of H i in the sight line to T Aur. This is consistent with the high value of E(B-V) = 0.42 listed in Table 1.
The origin of the absorption lines, labelled ’stellar’ by Selvelli & Gilmozzi (2013; see their Table 14) is uncertain. We are confident that the absorption lines do not form in the accretion disk nor in the white dwarf photosphere. We have modeled the absorption lines along the lines described in the section on the disk modeling. Unfortunately, we cannot check for motions of the absorption features during the full exposure by examining subexposures, since the spectrum is a single “snapshot”.
3.2 Disk Models
We have carried out accretion disk model fits to the STIS spectrum of T Aur. We use the grid of accretion disk models from Wade & Hubeny (1998). These disk models have solar composition, and were generated (using TLUSTY/SYNSPEC) for discrete values of a CV system parameters. In the present work we used the models with WD mass , , and , combined with a binary inclination and , since the WD mass of T Aur is estimated to be and its inclination is . The mass transfer rates available range from /yr to /yr, in steps of 0.5 in , intermediate values are obtained by linear interpolation between the available values.
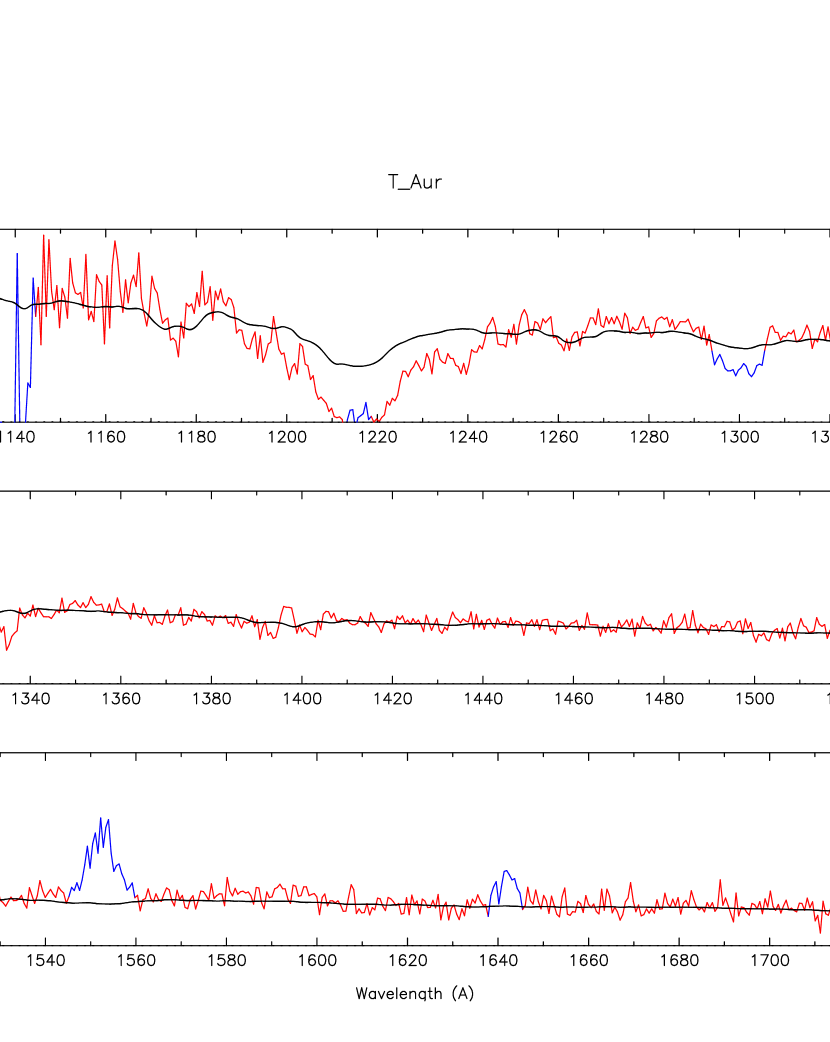
Overall we find that disk models with the above WD masses (0.55, 0.80, and 1.03) and inclinations ( and ) scale to the correct Gaia distance for a mass accretion rate within a factor of two of /yr. However, all these models poorly fit the Ly region and the absorption lines. In Fig.2 we present such a model fit with , /yr, and , scaling to a distance of 858 pc.
Since the reddening towards T Aur is relatively large (compared to CVs in general, but rather common for a nova at kpc), and that the system is enshrouded by nebular material likely ejected during its 1891 nova eruption, we must consider that the Ly region and absorption lines might be forming in material in the line of sight of the observer. We therefore also model the interstellar medium (ISM) absorption and add absorbing slabs to the accretion disk models.
The ISM modeling we use is described, e.g., in Godon et al. (2007). Assuming a reddening of , one can assess the hydrogen column density to be of the order of cm-2 (see e.g. Bohlin et al., 1978). Though, because of the ejected nebular material, not all the reddening is due to the ISM. We find that an ISM modeling with a hydrogen column density cm-2 is enough to reproduce the Ly absorption feature. The ISM model has a temperature of 50 K, a turbulent velocity of 80 km/s, and zero metallicity. In the wavelength region considered here, the main ISM component affecting the spectrum is the atomic hydrogen which shapes the Ly profile. The ISM molecular hydrogen column density was taken to be smaller than the atomic hydrogen column density and has no effect on the results (the ISM H molecular lines appear at shorter wavelengths, see Sembach, 2001, for the molecular lines).
On the other hand, we use SYNSPEC and Circus (Hubeny & Heap, 1996) to generate the absorbing slabs and incorporate them into the disk models. Further details on the slab modeling can be found, e.g., in Horne et al. (1994). We first applied an iron curtain, i.e. a cold slab of material with a temperature of 10,000 K and an electron density of cm-3. We increase the hydrogen column density, starting at cm-2. We find that we are able to fit the silicon absorption features at 1260 & 1265 Å together with the carbon line at 1335 Å for with a turbulent dispersion velocity of 75 km/s. This also creates a nitrogen line at 1193 Å. Since the remaining lines appear at a higher temperature, we applied a second slab with T=20,000 K and find that for the same hydrogen column density and turbulent velocity we are able to fit both the carbon line at 1175 Å, and the silicon resonance doublet at 1400 Å. A third (similar) slab with a temperature of 40,000 K generates the nitrogen doublet lines at 1240 Å and a weak/shallow C iv lines at 1550 Å. All the absorbing slabs have solar composition. For completeness, we use the 3 slabs in the modeling together with the ISM absorption model.
With the help of the slabs and ISM modeling we are able to significantly improve the fits of the disk models to the spectrum of T Aur. For example the disk model presented in Fig.2 has , with the ISM modeling we are able to decrease it to , and with the 3 absorbing slabs it comes down to . We applied the ISM and absorbing slabs to all the disk models and present the results in Table 2.
| ISM | Absorbing | Fig. | |||||
|---|---|---|---|---|---|---|---|
| (/yr) | (deg) | (pc) | Ly | Slabs | # | ||
| 0.55 | 41 | 839 | 2.52 | Yes | Yes | — | |
| 0.55 | 60 | 833 | 2.63 | Yes | Yes | — | |
| 0.80 | 41 | 858 | 12.7 | No | No | 2 | |
| 0.80 | 41 | 841 | 2.90 | Yes | No | — | |
| 0.80 | 41 | 842 | 2.46 | Yes | Yes | — | |
| 0.80 | 60 | 832 | 2.55 | Yes | Yes | — | |
| 1.03 | 41 | 839 | 2.30 | Yes | Yes | 3 | |
| 1.03 | 60 | 837 | 2.39 | Yes | Yes | — |
Note. — All the disk models were assumed to have solar composition.
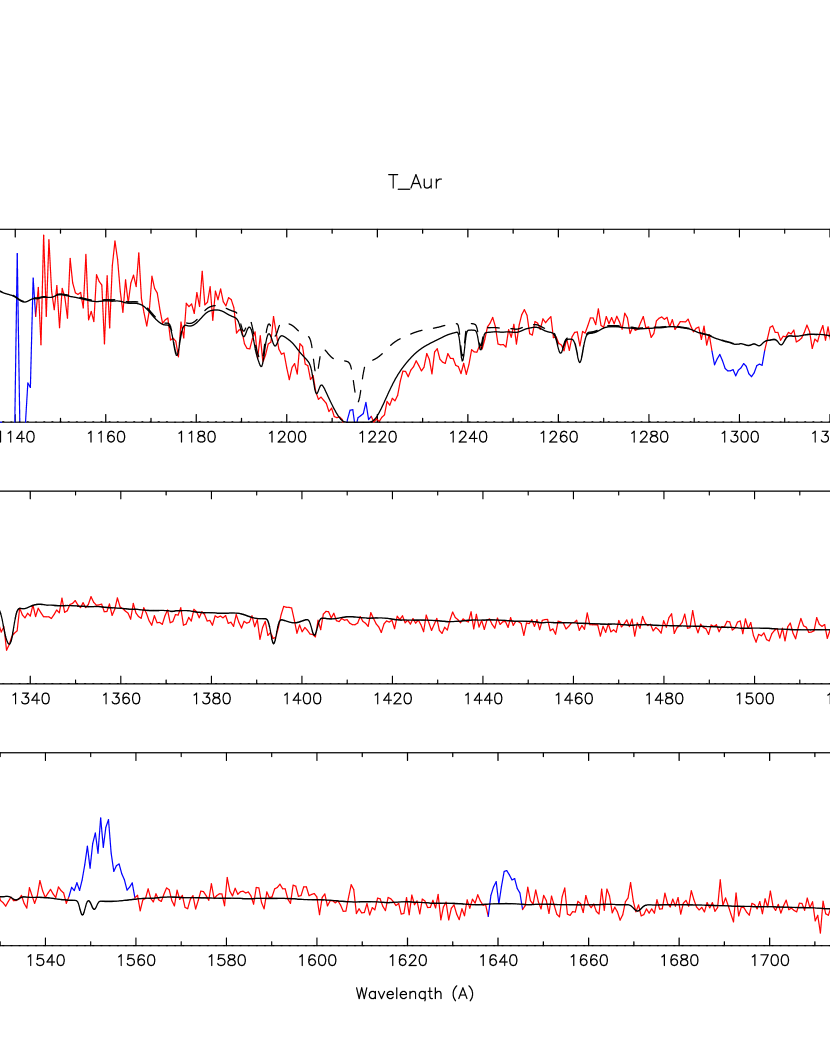
From the (veiled) disk model we ran, we find that the best fit is obtained for the larger WD mass () and the lower inclination (). This model has , and is presented in Fig.3. While this model fit has the lowest , it is only marginally better than the other veiled disk models. We are unable to account for the broad Si+O absorption feature at Å, which can form in the WD photosphere (which gives an unrealistic distance) or in a thicker absorbing slab (which produces far more absorption lines than observed). Since the continuum is relatively well fitted, we are confident that the mass accretion rate is of the order of /yr for the WD mass and distance of pc.
4 Discussion and Conclusions
T Aur is clearly a disk dominated system. Preliminary calculations demonstrate that a lone white dwarf produces a luminosity far below the observed luminosity. While an exposed white dwarf fits the observed spectra (figure 2), the allowed distances are far below the Gaia distance. Evidence of the accretion disk is apparent in light curve analysis of T Aur. Both Walker (1963) and Bianchini (1980) demonstrate small, rapid light variations which are evidence of an accretion disk.
T Aur is an eclipsing binary. If the white dwarf is being eclipsed then the inclination of the system must be high. However, lower inclinations are allowed if a portion of the accretion disk is eclipsed, not the white dwarf. If the accretion hot spot is being eclipsed, not the white dwarf, then the inclination of 57o reported by both Selvelli & Gillmozzi (2019) and Bianchini (1980) would be consistent. Walker (1963) observe that the T Aur light curve has no secondary eclipse and that the eclipse depth varies from 0.10 to 0.28 mags. These variations in eclipse depth are evidence of an accretion hot spot eclipse. This idea was also expressed by Bianchini (1980).
All accretion disk models fitted with absorbing slabs and ISM absorption have similar values. The model adopting a white dwarf mass of 1.03 and an inclination of 41o produces the minimum value of 2.30. However, the model adopting a white dwarf mass of 0.8 and an inclination of 60o produces a value of 2.55, which is not a statistically significant difference from the minimum. This model also produces a white dwarf mass within the allowed error range presented by Selvelli & Gillmozzi (2019) of 0.70.2 . The inclination of 60o is close to the value of 57o reported by both Selvelli & Gillmozzi (2019) and Bianchini (1980). These qualifications lend merit to this particular model.
5 Summary
T Aur is a disk-dominated old nova. Our calculations demonstrate the need for an accretion disk to account for the luminosity output of the system. The flickering present in the light curve and model fitting also confirm the disk. From model fitting, we determine a white dwarf mass of , a system inclination of and a mass transfer rate of yr. We have compared our model fitting results to the FUV data exclusively, with the results of Selvelli and Gilmozzi. Our disk model fitting for a white dwarf and inclination of 60 degrees is also within their error bars of the accretion rate for a 1 solar mass white dwarf and an inclination of 60 degrees. The relatively low inclination reveals the nature of the eclipses present in T Aur. In order to have a low inclination, part of the accretion disk, perhaps the hot spot, must be eclipsing. The white dwarf, being on the order of planetary dimensions, cannot be eclipsed at an inclination of 60o. While system parameters were determined, one mystery remains for T Aur. The deep absorption lines of metals remain unexplained. We know the the absorption lines do not form in the disk and they are too broad and deep to be interstellar. They are almost certainly associated with a circumbinary disk or possibly form in the shell ejected by the 1891 explosion. Because of the absence of subexposures (the STIS spectrum was a mere 600 s snapshot) and phase-resolved spectra, new FUV spectra are needed for a full analysis of this eclipsing system. A Hubble COS spectrum in TIMETAG mode down to the Lyman Limit would enable the detection of any motion of the absorption features.
Edward M. Sion https://orcid.org/0000-0003-4440-0551
Patrick Godon https://orcid.org/0000-0002-4806-5319
References
- Bianchini (1980) Bianchini, A. 1980, MNRAS, 192, 2
- Bohlin et al. (1978) Bohlin, R.C., Savage, B.D., & Drake, J.F. 1978, ApJ, 224, 132
- Capitanio et al. (2017) Capitanio, L., Lallement, R., Vergely, J.-L., Elyajouri, M., Montreal-Ibero, A. 2017, A&A, 606, A65
- Dubus et al. (2018) Dubus, G., Otulakowska-Hypka, M., & Lasota, J.-P. 2018, A&A, 617, 26
- Frank et al. (1992) Frank, J., King, A., & Raine, D. 1992, Accretion Power in Astrophysics (Cambridge Astrophys. Ser. 21; Cambridge: Cambridge Univ. Press)
- Godon et al. (2007) Godon, P., Sion, E.M., Barrett, P.E., & Szkody, P. 2007, ApJ, 656, 1092
- Horne et al. (1994) Horne, K., Marsh, T.R., Cheng, F.H., Hubeny, I., & Lanz, T. 1994, ApJ, 426, 294
- Hubeny (1988) Hubeny, I. 1988, CoPhC, 52, 103
- Hubeny & Heap (1996) Hubeny, I., & Heap, S.R. 1996, ApJ, 470, 1144
- Hubeny & Lanz (1995) Hubeny, I., & Lanz, T. 1995, ApJ, 439, 875
- Hubeny & Lanz (2017a) Hubeny, I., & Lanz, T. 2017a, A Brief Introductory Guide to TLUSTY and SYNSPEC, arXiv:1706.01859
- Hubeny & Lanz (2017b) Hubeny, I., & Lanz, T. 2017b, TLUSTY User’s Guide II: Reference Manual, arXiv:1706.01935
- Hubeny & Lanz (2017c) Hubeny, I., & Lanz, T. 2017c, TLUSTY User’s Guide III: Operational Manual, arXiv:1706.01937
- Lallement et al. (2019) Lallement, R., Babusiaux, C., Vergely, J.-L. et al. 2019, A&A, 625, A135
- Lallement et al. (2014) Lallement, R., Vergely, J.-L., Valette, B. et al. 2014, A&A, 561, A91
- Mestel (1952) Mestel, L. 1952, MNRAS, 112, 583
- Patterson (1984) Patterson, J. 1984, ApJS, 54, 443
- Santamaría (2020) Santamaría, E. et al. 2020, ApJ, 892, 1
- Schaefer (2018) Schaefer, B.E. 2018, MNRAS, 481, 3033
- Selvelli & Gillmozzi (2013) Selvelli, P., & Gillmozzi, R. 2013, A&A, 560, 49
- Selvelli & Gillmozzi (2019) Selvelli, P., & Gillmozzi, R. 2019, A&A, 622, 186
- Sembach (2001) Sembach, K.R., Howk, J.C., Savage, B.D., Shull, J.M., & Oegerle, W.R. 2001, ApJ, 561, 573
- Starrfiels (1971) Starrfield, S. 1971, MNRAS, 152, 307
- Strope (2010) Strope, R., Schaefer B., & Henden A. 2010, AJ, 140, 1
- Tody (1993) Tody, D. 1993, in ASP Conf. Ser. 52, Astronomical Data Analysis Software and Systems II, ed. R.J. Hanisch, R.J.B. Brissenden, & J. Barnes (San Fransisco, CA;ASP), 173
- Walker (1963) Walker M. 1963, ApJ, 138, 313
- Wijnen (2015) Wijnen, T.P.G., Zorotovic, M., Schreiber, M.R. 2015, A&A, 577, A143
- Wade & Hubeny (1998) Wade, R.A., & Hubeny, I. 1998, ApJ, 509, 350
- Wood (1995) Wood, M.A. 1995, in Proc. 9th Europ. Workshop on WDs, 443, White Dwarfs, ed. D. Koester & K. Werner (Berlin: Spinger), 41