Spatio-temporal sampling of near-petahertz vortex fields
Abstract
Measuring the field of visible light with high spatial resolution has been challenging, as many established methods only detect a focus-averaged signal. Here, we introduce a near-field method for optical field sampling that overcomes that limitation by employing the localization of the enhanced near-field of a nanometric needle tip. A probe field perturbs the photoemission from the tip, which is induced by a pump pulse, generating a field-dependent current modulation that can easily be captured with our electronic detection scheme. The approach provides reliable characterization of near-petahertz fields. We show that not only the spiral wave-front of visible femtosecond light pulses carrying orbital angular momentum (OAM) can be resolved, but also the field evolution with time in the focal plane. Additionally, our method is polarization sensitive, which makes it applicable to vectorial field reconstruction.
I Introduction
The precise knowledge of the electro-magnetic field oscillations of light is not only the backbone of ultrafast science [1, 2], but the indispensable prerequisite for many applications such as time-domain terahertz spectroscopy [3, 4, 5] and field-resolved mid-infrared spectroscopy [6, 7]. Common techniques for field sampling reaching from the near-infrared to the visible spectral region include attosecond streaking[8, 9, 10, 11, 12, 13, 14], electro-optic sampling [15], femtosecond streaking[16], non-linear photoconductive sampling[17], or the tunneling ionization with a perturbation for the time-domain observation of an electric field (Tiptoe) [18, 19, 20, 21, 22, 23, 24, 25]. While the sampling of electric field waveforms in the time domain is well established, its simultaneous spatial characterization has remained challenging. Whereas for terahertz radiation, where the wavelength is much longer than for visible light, sub-focal size resolution can be achieved, for instance, by using cameras [26] or small sensors [27], spatially resolved field measurements in the focus of a visible light beam are challenging as the typical focal size is of the order of a few micrometers. Here, a sub-micrometer probe is necessary.
Furthermore, measuring the field of an optical vortex beam brings additional difficulties related to the spatial phase structure in the focus. Because of its helical phase, the field has a phase-shift at opposite sides of the OAM mode [28, 29]. Thus, for measurement techniques that are only sensitive to the focal averaged field, a complete cancellation of the signal can be expected. Consequently, the field-resolved measurement of vortex beams requires sub-focal spatial sampling. In attosecond streaking experiments, an extreme ultraviolet (XUV) pulse is used to sample the electric field of a co-propagating (near-petahertz) field. Here, the XUV-focal size is much smaller than the sampling beam focal size, so the spatio-temporal characterization may be possible. Such measurements, however, require complex vacuum setups, electron spectroscopy, and would be experimentally demanding. It is thus not surprising that the use of attosecond streaking for the spatial reconstruction of near-petahertz vortex fields has not been reported yet. The measurement of vortex fields has mostly been limited to the measurement of the corresponding OAM carried by the light [29, 30, 31], not the field itself.
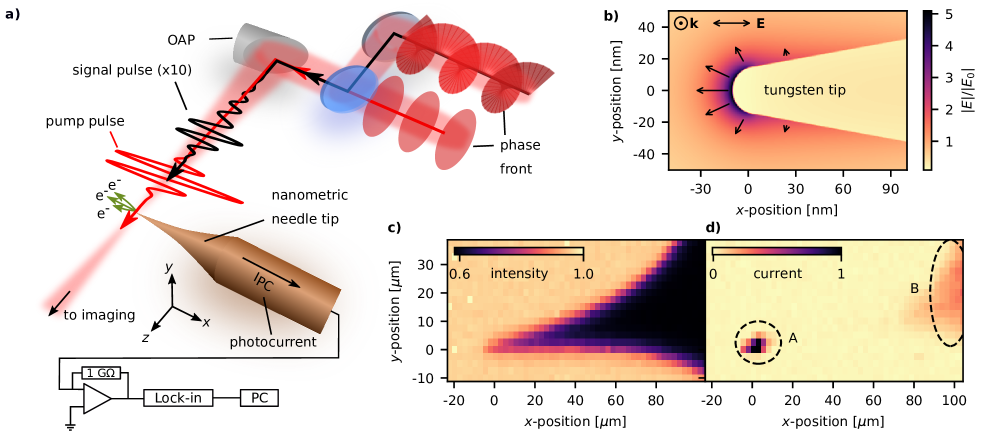
To date, approaches using near-field methods to achieve spatial resolution could either not resolve the electric field of light itself [33, 34, 35, 36], were limited to much lower frequency ranges in the THz regime [5, 4], or detected a spatially averaged signal from several sensors [23, 25]. We note, that the work presented in Ref. [25] has demonstrated a measurement of spatio-temporally coupled laser pulses. Here, the frequencies were limited to the infrared range and spatial resolution only achieved in one dimension (limited by the pixel size to (5.2 m)). Here, we overcome these limitations by employing a single nanometric needle tip as a localized probe for the near-field sampling of femtosecond light fields. The approach, termed nanoTiptoe and illustrated in Fig. 1a), inherits the method for sampling the electric field from Tiptoe [18] and achieves high spatial resolution from field localization at the nanometric needle tip.
In nanoTiptoe, a few-cycle pump pulse drives electron emission in the tunneling regime that depends nonlinearly on the electric field. Due to this nonlinearity and a short pump pulse, the photoemission is limited to the strongest half-cycle of the laser pulse, and suppressed otherwise. We note that only electric field vectors pointing into the surface cause photoemission from the nanometric needle tip [37]. Similar to Tiptoe, the emission burst during the strongest half-cycle opens a sub-cycle temporal gate that is perturbed linearly with the signal pulse [18], enabling characterization of its field. We measured the resulting photoemission current from the needle tip after transimpedance amplification employing lock-in-detection. Importantly, the fields driving photoemission were the locally enhanced near-fields, which were strongest near the apex of the tip, cf. Fig. 1b). The current measurement approach makes complex ultra-high-vacuum-based time-of-flight spectroscopy [38, 34] obsolete, which is a major advance in simplifying such measurements.
II Experimental Details
The output of a commercial 10 kHz Ti:Sa chirped pulse amplifier is broadened in a hollow-core fiber to an octave spanning spectrum ranging from 500 nm to 1000 nm, with a central wavelength of 750 nm. The pulses are then compressed to a duration of around 4.2 fs using chirped mirrors (UFI PC70). The laser beam was actively stabilized in angle and position. The pulses were split into a strong pump pulse and a weak signal pulse in a Mach-Zehnder interferometer (not shown in Fig. 1a)), where the signal pulse is chopped at half the repetition rate. To facilitate the precise control of the delay between signal and pump pulses, the pump arm is provided with a retro-reflector mounted on a closed-loop piezo-stage (MCL OPM100) with 100 m travel range. The beams were focused with variable temporal delay onto a nanometric tungsten needle tip inside a vacuum chamber ( mbar) using an off-axis parabolic mirror (OAP, mm). For the shadow image in Fig. 1c), we used mm to get a sharper contour. The needle was directly soldered to a BNC pin, which was mounted onto a 3D closed-loop piezo stick-slip stage. The photocurrent is amplified by V/A using a low-noise high-gain transimpedance amplifier (FEMTO DLPCA-200) and detected using a lock-in amplifier (Zürich Instruments HF2LI). The upper cut-off frequency () of the transimpedance amplifier is 1.1 kHz, which is below the repetition rate of our laser of 10 kHz and 5 kHz for pump and signal beam, respectively. The expected damping of the signal can be estimated from the measured amplifier response curve provided by the manufacturer to -20 dBV and -14 dBV for 10 and 5 kHz, respectively. These values correspond to a damping factor of the voltage signal of 10 and 5, in that order. Whenever we estimated a number of emitted electrons, we took these factors into account. For the lock-in detection, we used a demodulation bandwidth of 1.459 Hz (). From a noise reference measurement with blocked laser beams, we calculated the normalized noise density to 4.8 and 4.2 for the 5- and 10 kHz components, respectively. This is close to the specified value of 4.3 noise current at our amplification of . In order to be detectable, the minimum current modulation thus has to be larger than the noise current times the damping, that is: . Here, is the elementary charge, and the number of electrons. This corresponds to a current modulation of at least 30 electrons per shot, assuming a 1 Hz demodulation bandwidth for illustration purposes. In the high-gain mode of the amplifier, the amplification bandwidth would be even larger, such that damping becomes negligible, and a modulation of only 6 electrons per shot would become detectable in theory. We found best signal-to-noise performance, however, in the low-noise mode, where the cut-off frequency was below the repetition rate, as discussed earlier. The lock-in detection separates the contributions from pump pulse and signal pulse as they have different repetition rates. We were therefore able to directly measure a modulation current without the current caused by the pump beam. For a reference measurement using conventional Tiptoe, a pair of copper electrodes with a distance of m was employed to detect the total ionization yield in gas (i.e., air at 50 mbar). A bias voltage of 10 V between the electrodes was applied directly by the transimpedance amplifier. The sampling speed was around 10-14 data points per second, corresponding to a time interval longer than the time-constant of the lock-in amplifier of 47 ms. In addition, the data acquisition was paused for 100 ms after each step in space, in order to wait for the decay of currents induced by the movement of the tip.
III Results and Discussion
Before performing the actual field measurements, a large raster scan of the nanometric needle tip in the -plane in the laser focus was performed to confirm that the current is generated at the apex of the tip with a laser beam polarized along the tip axis (Fig. 1d)). Simultaneously, we recorded the transmitted light in an imaging geometry resulting in the shadow image of the tip shown in Fig. 1c). The comparison of Figs. 1c) and d) demonstrates that photoemission occurred predominantly at the apex of the needle tip (region A), whereas currents from sharp features at the needle shank (region B) were prevented by suitable positioning of the tip. As there is no emission between region A and B, we conclude that there is no emission from the side of the nanometric needle tip. Emission away from the tip apex occurs in regions characterized by a large surface roughness. Therefore, the distance between A and B corresponds to the upper limit for the size of the scanning region. Based on a broad parameter study [32] and the experimentally determined enhancement of around (see SI), as well as the opening angle (), we estimated an apex radius of the tip of nm.
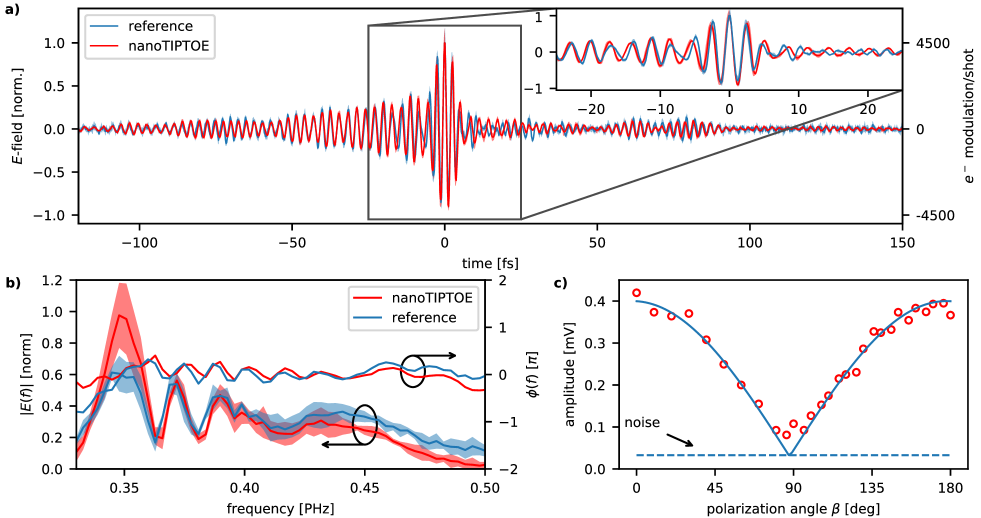
The nanoTiptoe measurement obtained for linearly polarized sample and pump pulses (polarized along the needle direction) with the needle tip placed in the center of the focus is presented in Fig. 2a). The obtained waveform is compared to a reference obtained via conventional Tiptoe. We note that the enhanced field on the needle tip exhibits a phase shift of typically to compared to the incident field [32]. However, since both beams in nanoTiptoe experience the same shift due to the enhancement, the overall phase difference is zero and therefore does not affect the measurement. The excellent agreement between the nanoTiptoe measurement and the reference indicates a rather flat spectral response and demonstrates the capability of nanoTiptoe to sample near-petahertz laser fields. This conclusion is further supported by the similarity of the measured spectral phases obtained using both methods (see Fig. 2b)). The nanoTiptoe measurements are only slightly red-shifted, as evident from the spectral amplitudes of the measured pulses in Fig. 2b) and the calculated response, see SI Fig. S5. This difference relates to the response function of the nanometric needle tip. The good agreement of the time-domain waveforms indicates a secondary importance of this small red-shift to most applications.
To further validate the nanoTiptoe technique for field sampling, we also performed scans of the dispersion of the signal pulse, its carrier-envelope-phase, the field-strength ratio (see corresponding SI sections) and its polarization. For the investigation of the polarization dependence, we kept the pump beam polarized along the tip axis and rotated the polarization of the signal beam, see Fig. 2c). As the superposition of both beams drives the ionization process, we would expect a scaling of the signal in free-space as , where is the angle between the polarizations of the two laser pulses (solid blue line in Fig. 2c)). However, at a nanostructure, the pump beam generates surface normal near-fields that the signal beam can interfere with (cf. Fig. 1c) and Ref. [32]). Our polarization scan (Fig. 2c)) suggests that the interference of the signal beam with surface normal near-fields has only a minor influence on the signal taken with nanoTiptoe, as the signal amplitude for perpendicular polarization nearly reaches the electronic noise amplitude (dashed blue line, Fig. 2c)). Therefore, nanoTiptoe exhibits a polarization sensitivity that allows to map the two-dimensional polarization state.
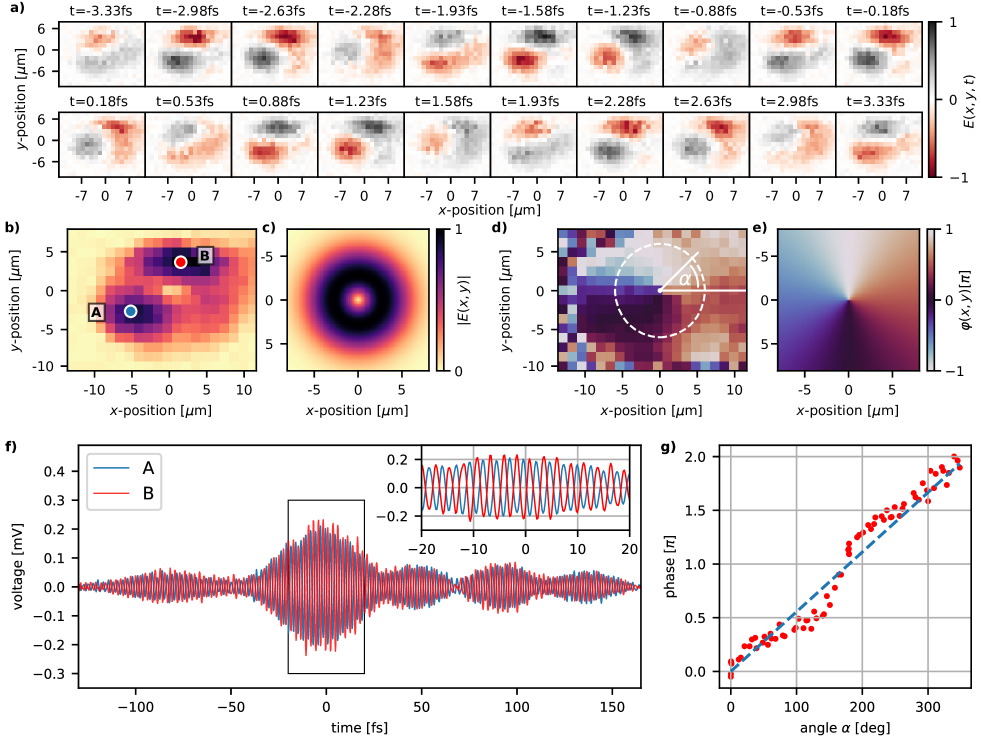
Having established that nanoTiptoe provides the electric field waveform of the sampling field, we can now investigate how scanning the needle tip accross the focal plane provides spatially-resolved data. Some care has to be taken in such scanning measurements. As the measured waveform samples only the relative phase between signal and pump pulse [23, 24], the mode size of the pump beam has been made smaller by a factor of roughly , causing a larger focal spot size. This increase in size leads to a rather flat pump beam intensity and phase profile over the area that is scanned for the sampling pulse. In order to demonstrate the capability of nanoTiptoe in spatio-temporal field sampling of near-petahertz fields, we sampled a light beam carrying orbital angular momentum (OAM) [28, 29]. The signal beam was shaped by a vortex plate (Vortex Photonics V-780-20-1), that preserves linear polarization, into an OAM beam. As the wave plate had a limited bandwidth, a suitable bandpass filter was added, which increased the pulse duration to 33 fs. The pump pulse, however, was not modified such that the temporal gate remained short. The vortex beam resulting from the beam shaping of the signal pulse is expected to exhibit a field distribution with a singularity on the propagation axis as well as a helical phase shape (cf. Fig. 1a) and Fig. 3c)).
In order to map the evolution of the vortex field in the focal plane, we scanned the tip through the beam while varying the delay over a few oscillations of the most intense part of the signal pulse. The result is depicted in Fig. 3a). A clear rotational motion of the field amplitudes around the center of the focal spot is observable. The extracted amplitude and phase as a function of the needle tip position are shown in Fig. 3b) and d), together with a theoretical expectation for a Laguerre-Gaussian mode (c) and e)), see SI for details. An animated version of Fig. 3a) can be found in the supplementary material. The field distribution exhibits a typical doughnut-shape, the minimum of which is visible in the middle despite the pump beam being maximal there. In order to validate that nanoTiptoe provides full spectral resolution at every point in space, we also performed scans over the full pulse length, but only at selected points marked as A and B in Fig. 3b). The corresponding data was Fourier-transform filtered and is shown in Fig. 3f). The points A and B were chosen at opposite sides of the mode, since this is where we expect the spatial phase difference to be maximum. Indeed, the corresponding waveforms exhibit a clear -phase difference, which is due to the OAM of the signal beam. As can be seen in Fig. 3d), one of the main features of light carrying orbital angular momentum, the helical phase front, agrees well with the theoretical prediction, Fig. 3e). To quantify the spiral phase, we introduced a polar angle , and evaluated all phase points within the dashed circle in Fig. 3d). We fixed the central point and calculated the corresponding for every data point in the region of interest. The result (red dots in Fig. 3 g)), is in qualitative agreement with the expected linear increase of the phase with . We attribute the small deviations from the linear scaling for to a curved pulse front of the pump beam, which is even visible without vortex plate, see SI for details.
IV Conclusions
In conclusion, we have demonstrated that nanoTiptoe enables the spatially resolved measurement of near-petahertz optical field oscillations with sub-cycle resolution. The localized probe enabled the spatio-temporal characterization of optical fields by employing a nanometric needle tip instead of the conventional electrodes. The field enhancement allowed the characterization of laser fields with moderate intensity - a major advance compared to techniques requiring high-power laser sources. As compared to previous approaches for electronic field detection with nanotips, which were often limited to the low terahertz region [5, 4], nanoTiptoe increases the temporal resolution by nearly three orders of magnitude. While the detected bandwidth is comparable to that in Ref. [38] using attosecond streaking spectroscopy, the nanoTiptoe approach is much simpler and avoids a complex vacuum beamline. A combination of nanoTiptoe with latest approaches in time-resolved scanning tunneling microscopy [35, 36] seems promising in characterizing the light-induced near-fields of a nanometric sample with attosecond precision. Theoretically, the resolution here is limited by the interaction of the nanometric needle with the field close to the apex, as extensively studied in Ref. [32]. For our tip geometry, we expect a maximum resolution in the order of the tip diameter, and even down to 1 nm[39] using smaller tips. Finally, orienting the needle along the propagation direction of the laser beam [40] may pave the way towards the measurement of the longitudinal component of strongly focused light with nanoTiptoe. Such measurements would offer a more detailed understanding of the properties of focused light in superresolution microscopy.
Author Contributions
J.B. and J.S. contributed equally to this work. J.S. and M.F.K. conceived the nanoTiptoe concept. P.H. contributed expertise on nanometric needle tips. A.S., M.F.K., and P.C. conceived the experiment with OAM beams. J.B., J.S., A.M., and N.S. performed the measurements. Z.W. and P.R. supported laser operations. The data was analyzed by J.B. and J.S. The manuscript was written by J.B., J.S., B.B. and M.F.K. and reviewed by all authors.
Funding
Deutsche Forschungsgemeinschaft (DFG) (SPP1840 (QUTIF),LMUexcellent); European ResearchCouncil (ERC) (FETopen PetaCOM, FETlaunchpad FIELDTECH); Alexander von Humboldt Stiftung; Max-Planck Gesellschaft (MPG) (IMPRS-APS, MPSP, Fellow Program); ERC Adv. Gr. AccelOnChip; U.S. Department of Energy, Office of Science, Basic Energy Sciences, Scientific User Facilities Division (DE-AC02-76SF00515); US Defense Threat Reduction Agency (DTRA) (HDTRA1-19-1-0026); University of Ottawa; NRC Joint Centre for Extreme Photonics; Natural Sciences and Engineering Research Council of Canada (NSERC).
Acknowledgments
We are grateful for support by Ferenc Krausz providing suitable laboratories and for support by Thomas Nubbemeyer and Maximilian Seeger in laser operations. We acknowledge fruitful discussions with Matthew Weidman, Vladislav Yakovlev, Nicholas Karpowicz, and Ferenc Krausz. The experiments were carried out at LMU and MPQ. J.S., and A.M. acknowledge support by the Max Planck Society via the IMPRS for Advanced Photon Science. J.B. acknowledges support by the Max Planck School of Photonics. M.F.K. acknowledges support by the Max Planck Society via the Max Planck Fellow program. M.F.K.’s work at SLAC is supported by the U.S. Department of Energy, Office of Science, Basic Energy Sciences, Scientific User Facilities Division. P.B.C. acknowledges funds from the US Defense Threat Reduction Agency (DTRA) and the University of Ottawa. P.B.C. and A.S. acknowledge support from NRC Joint Centre for Extreme Photonics and also from the Natural Sciences and Engineering Research Council of Canada (NSERC).
Disclosures
The authors declare no competing interests.
Data availability
Data underlying the results presented in this paper are not publicly available at this time but may be obtained from the authors upon reasonable request.
Supplemental document
See Supplement 1 for supporting content as well as the supplementary animation.
References
- [1] Brabec, T. & Krausz, F. Intense few-cycle laser fields: Frontiers of nonlinear optics. Rev. Mod. Phys. 72, 545–591 (2000). URL https://link.aps.org/doi/10.1103/RevModPhys.72.545.
- [2] Krausz, F. & Ivanov, M. Attosecond physics. Rev. Mod. Phys. 81, 163–234 (2009). URL https://link.aps.org/doi/10.1103/RevModPhys.81.163.
- [3] Cocker, T. L., Jelic, V., Hillenbrand, R. & Hegmann, F. A. Nanoscale terahertz scanning probe microscopy. Nature Photonics 15, 558–569 (2021). URL https://doi.org/10.1038/s41566-021-00835-6.
- [4] Peller, D. et al. Quantitative sampling of atomic-scale electromagnetic waveforms. Nature Photonics 15, 143–147 (2021). URL https://doi.org/10.1038/s41566-020-00720-8.
- [5] Wimmer, L. et al. Terahertz control of nanotip photoemission. Nature Physics 10, 432–436 (2014). URL https://doi.org/10.1038/nphys2974.
- [6] Pupeza, I. et al. Field-resolved infrared spectroscopy of biological systems. Nature 577, 52–59 (2020). URL https://doi.org/10.1038/s41586-019-1850-7.
- [7] Neuhaus, M. et al. Transient field-resolved reflectometry at 50–100 thz. Optica 9, 42–49 (2022). URL http://opg.optica.org/optica/abstract.cfm?URI=optica-9-1-42.
- [8] Hentschel, M. et al. Attosecond metrology. Nature 414, 509–513 (2001). URL https://doi.org/10.1038/35107000.
- [9] Itatani, J. et al. Attosecond streak camera. Phys. Rev. Lett. 88, 173903 (2002). URL https://link.aps.org/doi/10.1103/PhysRevLett.88.173903.
- [10] Kienberger, R. et al. Atomic transient recorder. Nature 427, 817–821 (2004). URL https://doi.org/10.1038/nature02277.
- [11] Goulielmakis, E. et al. Direct measurement of light waves. Science 305, 1267–1269 (2004). URL https://science.sciencemag.org/content/305/5688/1267. eprint https://science.sciencemag.org/content/305/5688/1267.full.pdf.
- [12] Hammond, T. J., Brown, G. G., Kim, K. T., Villeneuve, D. M. & Corkum, P. B. Attosecond pulses measured from the attosecond lighthouse. Nature Photonics 10, 171–175 (2016). URL https://doi.org/10.1038/nphoton.2015.271.
- [13] Wyatt, A. S. et al. Attosecond sampling of arbitrary optical waveforms. Optica 3, 303–310 (2016). URL http://www.osapublishing.org/optica/abstract.cfm?URI=optica-3-3-303.
- [14] Kim, Y. H. et al. Attosecond streaking using a rescattered electron in an intense laser field. Scientific Reports 10, 22075 (2020). URL https://doi.org/10.1038/s41598-020-79034-2.
- [15] Keiber, S. et al. Electro-optic sampling of near-infrared waveforms. Nature Photonics 10, 159–162 (2016). URL https://doi.org/10.1038/nphoton.2015.269.
- [16] Korobenko, A. et al. Femtosecond streaking in ambient air. Optica 7, 1372–1376 (2020). URL http://www.osapublishing.org/optica/abstract.cfm?URI=optica-7-10-1372.
- [17] Zimin, D. et al. Petahertz-scale nonlinear photoconductive sampling in air. Optica 8, 586–590 (2021). URL http://www.osapublishing.org/optica/abstract.cfm?URI=optica-8-5-586.
- [18] Park, S. B. et al. Direct sampling of a light wave in air. Optica 5, 402–408 (2018). URL http://www.osapublishing.org/optica/abstract.cfm?URI=optica-5-4-402.
- [19] Saito, N., Ishii, N., Kanai, T. & Itatani, J. All-optical characterization of the two-dimensional waveform and the gouy phase of an infrared pulse based on plasma fluorescence of gas. Opt. Express 26, 24591–24601 (2018). URL http://www.opticsexpress.org/abstract.cfm?URI=oe-26-19-24591.
- [20] Hwang, S. I. et al. Generation of a single-cycle pulse using a two-stage compressor and its temporal characterization using a tunnelling ionization method. Scientific Reports 9, 1613 (2019). URL https://doi.org/10.1038/s41598-018-38220-z.
- [21] Cho, W. et al. Temporal characterization of femtosecond laser pulses using tunneling ionization in the uv, visible, and mid-ir ranges. Scientific Reports 9, 16067 (2019). URL https://doi.org/10.1038/s41598-019-52237-y.
- [22] Cho, W., Shin, J.-u. & Kim, K. T. Reconstruction algorithm for tunneling ionization with a perturbation for the time-domain observation of an electric-field. Scientific Reports 11, 13014 (2021). URL https://doi.org/10.1038/s41598-021-92454-y.
- [23] Bionta, M. R. et al. On-chip sampling of optical fields with attosecond resolution. Nature Photonics 15, 456–460 (2021). URL https://doi.org/10.1038/s41566-021-00792-0.
- [24] Liu, Y. et al. All-optical sampling of few-cycle infrared pulses using tunneling in a solid. Photon. Res. 9, 929–936 (2021). URL http://www.osapublishing.org/prj/abstract.cfm?URI=prj-9-6-929.
- [25] Liu, Y., Beetar, J. E., Nesper, J., Gholam-Mirzaei, S. & Chini, M. Single-shot measurement of few-cycle optical waveforms on a chip. Nature Photonics 16, 109–112 (2022). URL https://doi.org/10.1038/s41566-021-00924-6.
- [26] Zhao, J., E, Y., Williams, K., Zhang, X.-C. & Boyd, R. W. Spatial sampling of terahertz fields with sub-wavelength accuracy via probe-beam encoding. Light: Science & Applications 8, 55 (2019). URL https://doi.org/10.1038/s41377-019-0166-6.
- [27] Mitrofanov, O. et al. Near-field terahertz probes with room-temperature nanodetectors for subwavelength resolution imaging. Scientific Reports 7, 44240 (2017). URL https://doi.org/10.1038/srep44240.
- [28] Allen, L., Beijersbergen, M. W., Spreeuw, R. J. C. & Woerdman, J. P. Orbital angular momentum of light and the transformation of laguerre-gaussian laser modes. Phys. Rev. A 45, 8185–8189 (1992). URL https://link.aps.org/doi/10.1103/PhysRevA.45.8185.
- [29] Yao, A. M. & Padgett, M. J. Orbital angular momentum: origins, behavior and applications. Adv. Opt. Photon. 3, 161–204 (2011). URL http://aop.osa.org/abstract.cfm?URI=aop-3-2-161.
- [30] Rego, L. et al. Generation of extreme-ultraviolet beams with time-varying orbital angular momentum. Science 364, eaaw9486 (2019). URL https://www.science.org/doi/abs/10.1126/science.aaw9486. eprint https://www.science.org/doi/pdf/10.1126/science.aaw9486.
- [31] Fang, Y. et al. Probing the orbital angular momentum of intense vortex pulses with strong-field ionization. Light: Science & Applications 11, 34 (2022). URL https://doi.org/10.1038/s41377-022-00726-7.
- [32] Thomas, S., Wachter, G., Lemell, C., Burgdörfer, J. & Hommelhoff, P. Large optical field enhancement for nanotips with large opening angles. New Journal of Physics 17, 063010 (2015). URL https://doi.org/10.1088/1367-2630/17/6/063010.
- [33] Barwick, B. et al. Laser-induced ultrafast electron emission from a field emission tip. New Journal of Physics 9, 142–142 (2007). URL https://doi.org/10.1088/1367-2630/9/5/142.
- [34] Hoff, D. et al. Tracing the phase of focused broadband laser pulses. Nature Physics 13, 947–951 (2017). URL https://doi.org/10.1038/nphys4185.
- [35] Garg, M. & Kern, K. Attosecond coherent manipulation of electrons in tunneling microscopy. Science 367, 411–415 (2020). URL https://science.sciencemag.org/content/367/6476/411. eprint https://science.sciencemag.org/content/367/6476/411.full.pdf.
- [36] Garg, M. et al. Real-space subfemtosecond imaging of quantum electronic coherences in molecules. Nature Photonics (2021). URL https://doi.org/10.1038/s41566-021-00929-1.
- [37] Yalunin, S. V., Gulde, M. & Ropers, C. Strong-field photoemission from surfaces: Theoretical approaches. Phys. Rev. B 84, 195426 (2011). URL https://link.aps.org/doi/10.1103/PhysRevB.84.195426.
- [38] Schötz, J. et al. Reconstruction of nanoscale near fields by attosecond streaking. IEEE Journal of Selected Topics in Quantum Electronics 23, 77–87 (2017).
- [39] Thomas, S., Krüger, M., Förster, M., Schenk, M. & Hommelhoff, P. Probing of optical near-fields by electron rescattering on the 1 nm scale. Nano Letters 13, 4790–4794 (2013). URL https://doi.org/10.1021/nl402407r. PMID: 24032432, eprint https://doi.org/10.1021/nl402407r.
- [40] Bouhelier, A., Beversluis, M., Hartschuh, A. & Novotny, L. Near-field second-harmonic generation induced by local field enhancement. Phys. Rev. Lett. 90, 013903 (2003). URL https://link.aps.org/doi/10.1103/PhysRevLett.90.013903.