Evolution of A Peculiar Type Ibn Supernova SN 2019wep
Abstract
We present a high-cadence short term photometric and spectroscopic monitoring campaign of a type Ibn SN 2019wep, which is one of the rare SN Ibn after SNe 2010al and 2019uo to display signatures of flash ionization (He II, C III, N III). We compare the decline rates and rise time of SN 2019wep with other SNe Ibn and fast transients. The post-peak decline in all bands (0.1 mag d-1) are consistent with SNe Ibn but less than the fast transients. On the other hand, the m15 values are slightly lower than the average values for SNe Ibn but consistent with the fast transients. The rise time is typically shorter than SNe Ibn but longer than fast transients. SN 2019wep lies at the fainter end of SNe Ibn but possesses an average luminosity amongst the fast transients sample. The peculiar color evolution places it between SNe Ib and the most extreme SNe Ibn. The bolometric light curve modelling shows resemblance with SN 2019uo with ejecta masses consistent with SNe Ib. SN 2019wep belongs to the “P cygni” sub-class of SNe Ibn and shows faster evolution in line velocities as compared to the “emission” sub-class. The post-maximum spectra show close resemblance with ASASSN-15ed hinting it to be of SN Ib nature. The low He I CSM velocities and residual H further justifies it and gives evidence of an intermittent progenitor between WR and LBV star.
1 Introduction
Type Ibn Supernovae (hereafter SNe Ibn) are a rare class of core-collapse SNe (CCSNe) undergoing interaction with hydrogen poor circumstellar medium (CSM). Interaction, in general, produces narrow emission lines — broader than H II regions but narrower than the lines arising from the outer ejecta of the SN (Pastorello et al., 2007). However, in some cases interaction happens below the photosphere without any observable narrow emission lines (e.g. Morozova et al., 2017; Andrews & Smith, 2018). SNe Ibn are characterised by narrow lines of He (2000 km s-1) in their spectra and was introduced with the discovery of SN 2006jc (Pastorello et al., 2007). This is defined in analogy with SNe IIn, which show narrow H features (Schlegel, 1990). SNe that are embedded in dense CSM may also show short-lived narrow high ionization emission lines (at 10 days) owing to the recombination of the CSM following the shock breakout flash or through interaction of the SN ejecta with nearby CSM. These features are known as “flash features” (e.g. Gal-Yam et al., 2014; Gal-Yam, 2019).
Unlike the light curves of SNe IIn which show great photometric diversity (Nyholm et al., 2020), SNe Ibn light curves (though small in number as only less than 40 SNe Ibn are known till date (Hosseinzadeh et al., 2019)) are surprisingly homogeneous with a uniform light curve shape and decay rates of 0.05–0.15 mag d-1 (Hosseinzadeh et al., 2017). They typically rise within a timescale of 15 days and reach a peak absolute magnitude of MR = 19 mag (Hosseinzadeh et al., 2017), with exceptions like ASASSN-14ms which has a peak luminosity of MV 20.5 mag, lying between normal SNe Ibn and superluminous SNe (Wang et al., 2021). Pastorello et al. (2016), however, highlighted the existence of many outliers in the SN Ibn group which are slow decliners, for example, OGLE-2012-SN-006 (Pastorello et al., 2015a) and SN 2010al (Pastorello et al., 2015b). The fast-rising and decaying nature of SNe Ibn enables their comparison with the fast transients (Drout et al. (2014); Arcavi et al. (2016); Pellegrino et al. (2021)) which may hint toward their similar origin. The light curves of Stripped envelope (SESNe; typically Ibs) are in general powered by radioactivity but in the case of SNe Ibn the light curves are too steep to reconcile for the amount of 56Ni contributing to the radioactive luminosity (Moriya & Maeda, 2016). Instead, a combination of Ni-decay and CSM interaction are required to reproduce the light curve (Karamehmetoglu et al., 2019; Wang & Li, 2019; Gangopadhyay et al., 2020a).
In the past few years, one of the most unsettling question has been regarding the progenitors giving rise to SNe Ibn explosions. The homogeneity of the light curves does not necessarily imply the homogeneity of the progenitors, which are largely dependent on the CSM configuration. Unlike SNe IIn where some have been linked to H-rich luminous blue variable (LBV) stars (e.g., Gal-Yam & Leonard (2009); Smith et al. (2010)), there have been no direct detection of SNe Ibn progenitors to date. There are two precursor detections of massive SN Ibn progenitors – the luminous outburst of the prototypical SN Ibn 2006jc, observed two years before the explosion (Foley et al., 2007; Pastorello et al., 2007; Smith et al., 2008) and the other for SN 2019uo where precursor starts 340 days before the explosion and is observed over 35 days (Strotjohann et al., 2021). The progenitor of SN 2006jc is believed to be a massive star with remaining LBV properties (Pastorello et al., 2007). The stripping of the outer envelope can occur also from the massive binaries (Foley et al., 2007). Strotjohann et al. (2021) suggests that the progenitors could be Wolf-Rayet (WR) stars that have shed their hydrogen envelopes or massive stars that are stripped by a binary partner. Recent evidence of a low mass progenitor host has been proposed for PS1-12sk, which occurred in a non-star forming galaxy (Sanders et al., 2013; Hosseinzadeh et al., 2019). Based on the late time UV/Optical HST images, an interacting binary progenitor scenario was inferred for SNe 2006jc and 2015G (Sun et al., 2020).
Discovery:
SNe Ibn 2019wep was discovered on 2019 December 07.96979 UT by Xing Gao (Zhang et al., 2019a) in Xingming Observatory Sky Survey (C42) images at an unfiltered mag of 18.2 which was estimated by several 40 sec survey images. The SN was located at , (equinox J2000.0) (Mao et al., 2019) which is about 26 east and 276 south of the center of the host galaxy PGC33464.
Zhang et al. (2019b) obtained the classification spectrum of SN 2019wep with the 2.4 m Li-Jiang Telescope (LJT+YFOSC) of Yunnan Observatories, China. The spectrum depicted a blue continuum and highly ionized “flash features” of He II, H I and C IV. This spectrum matches with that of a young SN II with signatures of interaction. Another spectrum taken a few days later shows evidence of narrow P cygni He I features classifying it as a SN Ibn. SN 2019wep is one of the rare SNe Ibn to show signatures of flash ionisation after SNe 2019uo and 2010al.
Estimation of explosion epoch:
Mao et al. (2019) reported the non-detection of a source in archival images of Xingming Observatory Sky Survey (C42) on 2019-05-30 (limiting mag 19.0) while the Zwicky Transient Facility (ZTF111https://www.wis-tns.org/object/2019wep; Bellm 2014; Bellm et al. 2019) reported a last non-detection of the source on 2019-11-25 (MJD 58812) in -band at a limiting magnitude of 19.89 mag. Four pre-maximum unfiltered data points of SN 2019wep are available in TNS222https://www.wis-tns.org/object/2019wep which match well with our -band data. We combine the unfiltered magnitudes with our -band data (since the passbands are close) and perform a parabolic fit on the combined light curve of SN 2019wep. The magnitudes are converted to flux and the fit is performed using the data up to 6 days after the discovery. The best-fit coefficients are used to find the roots of the equation, i.e., the value of time for which the flux equals zero. This gives the explosion epoch to be MJD 58824.5 2. The error is estimated from the fitting error associated with the data.
Distance and Extinction:
Adopting km s-1 Mpc-1, =0.27 and =0.73, we obtain a luminosity distance of 108.3 Mpc (corresponding to a redshift 0.025 333https://ned.ipac.caltech.edu/byname?objname=PGC33464&hconst=73&omegam=0.27&omegav=0.73&corr_z=4) for SN 2019wep. The Milky Way extinction along the line of sight of SN 2019wep is mag (Schlafly & Finkbeiner, 2011). For estimating the extinction due to the host galaxy, we estimate equivalent widths of the Na ID line in the three spectra of SN 2019wep taken on 2019-12-16, 2019-12-19 and 2019-12-24. Using the formulation by Munari & Zwitter (1997) and Poznanski et al. (2012), we estimate host galaxy mag. The estimated extinction results in matching the colors of SN 2019wep in close agreement with that of SNe 2010al and 2019uo. Thus, we adopt a total mag. We use these values of distance and extinction throughout the paper.
In this paper we aim to investigate the photometric and spectroscopic evolution of the peculiar SN Ibn 2019wep which not only showed signatures of flash ionisation but also shows some similarities with SN Ib at late phases. In Section 2, we discuss the procedure of photometric and spectroscopic data reduction. In Section 3, the photometric evolution of SN 2019wep is studied and compared with other SNe Ibn and fast transients. In Section 4, we discuss the interpretation of the observed spectral features including the late-time distinct P cygni features and unique H behavior. Our conclusions are given in Section 5.
2 Data Acquisition and Reduction
We observed SN 2019wep with the 2m Las Cumbres Observatory (LCO) telescopes in the UBVgri filters from 3 to 98 days after explosion under the Global Supernovae Project (GSP) program. The photometric observations in UBVRI/ugri were also taken with the 0.8m Tsinghua-NAOC Telescope (TNT; Huang et al. 2012), Xinglong Observatory, China. Image subtraction was done using High Order Transform of PSF ANd Template Subtraction 444https://github.com/acbecker/hotpants. The instrumental magnitudes were estimated using DAOPHOT555Dominion Astrophysical Observatory Photometry. The LCO image subtraction and photometry were done with lcogtsnpipe666https://github.com/svalenti/lcogtsnpipe (see Valenti et al., 2011, 2016). The instrumental SN magnitudes in gri bands and UBV bands were calibrated with respect to the Sloan Digital Sky Survey (SDSS) catalog and Landolt standard fields respectively.
The photometry of SN 2019wep is presented in Table 1.
| Date | JD | Phase | Telescope | ||||||
|---|---|---|---|---|---|---|---|---|---|
| (yyyy-mm-dd) | (2400000+) | (day) | (mag) | (mag) | (mag) | (mag) | (mag) | (mag) | |
| 2019-12-12 | 58829.35 | 0.85 | — | 17.190.03 | 17.110.03 | 17.290.03 | 17.420.10 | — | LCO |
| 2019-12-12 | 58829.35 | 0.85 | — | 17.200.03 | 17.180.04 | 17.380.04 | — | — | LCO |
| 2019-12-13 | 58830.41 | 1.91 | 16.490.03 | 17.380.02 | 17.350.03 | 17.410.03 | 17.480.03 | 17.910.07 | LCO |
| 2019-12-13 | 58830.41 | 1.91 | 16.450.04 | 17.350.03 | 17.280.02 | 17.430.03 | 17.570.03 | 17.750.07 | LCO |
| 2019-12-15 | 58832.36 | 3.86 | 16.860.04 | 17.480.03 | 17.360.03 | 17.590.04 | 17.620.03 | 17.680.05 | LCO |
| 2019-12-15 | 58832.37 | 3.86 | 16.850.05 | 17.560.03 | 17.280.03 | — | 17.590.03 | 17.630.05 | LCO |
| 2019-12-18 | 58835.35 | 6.85 | 17.330.05 | 18.050.03 | 17.840.02 | 17.930.03 | 17.880.03 | 18.020.03 | LCO |
| 2019-12-18 | 58835.35 | 6.85 | — | 18.060.03 | 17.830.02 | 17.930.04 | 17.860.03 | 18.050.03 | LCO |
| 2019-12-18 | 58835.73 | 7.25 | — | 18.340.03 | 18.180.03 | 17.930.05 | 18.060.02 | 18.050.03 | TNT |
| 2019-12-19 | 58836.36 | 7.86 | 17.630.03 | 18.100.02 | 17.940.01 | 17.970.03 | 17.890.02 | 17.970.03 | LCO |
| 2019-12-19 | 58836.37 | 7.87 | 17.490.03 | 18.130.02 | 17.950.01 | 17.980.03 | 17.880.02 | 18.070.03 | LCO |
| 2019-12-21 | 58838.33 | 9.83 | 17.740.04 | 18.430.03 | 18.130.01 | 18.160.03 | 18.030.02 | 18.120.03 | LCO |
| 2019-12-21 | 58838.34 | 9.84 | 17.800.04 | 18.350.02 | 18.140.01 | 18.110.03 | 18.060.02 | 18.180.04 | LCO |
| 2019-12-22 | 58839.47 | 10.97 | 18.010.03 | 18.640.02 | 18.330.01 | 18.270.02 | 18.140.02 | 18.230.03 | LCO |
| 2019-12-22 | 58839.48 | 10.98 | 18.020.03 | 18.620.02 | 18.360.01 | 18.310.02 | — | 18.230.02 | LCO |
| 2019-12-24 | 58841.44 | 13.04 | 18.450.10 | 18.750.03 | 18.550.04 | 18.440.06 | 18.270.04 | 18.210.07 | LCO |
| 2019-12-24 | 58841.44 | 13.04 | 18.370.08 | — | 18.600.03 | 18.340.05 | 18.190.04 | 18.330.08 | LCO |
| 2019-12-27 | 58844.37 | 15.87 | 18.980.06 | 19.270.04 | 18.980.02 | 18.670.03 | 18.560.03 | 18.550.04 | LCO |
| 2019-12-27 | 58844.37 | 15.87 | 19.010.06 | 19.290.04 | 18.990.02 | 18.700.03 | 18.490.02 | 18.590.04 | LCO |
| 2019-12-27 | 58844.78 | 16.28 | — | 19.300.09 | 19.000.05 | 18.710.04 | 18.500.03 | 18.510.03 | TNT |
| 2019-12-28 | 58845.80 | 17.30 | — | 19.370.03 | 19.110.02 | 18.770.03 | 18.610.02 | 18.520.09 | TNT |
| 2019-12-29 | 58846.81 | 18.31 | — | 19.470.05 | 19.280.03 | 18.860.06 | 18.810.06 | 18.910.09 | TNT |
| 2019-12-30 | 58847.78 | 19.28 | — | 19.570.05 | 19.470.07 | 19.050.09 | 18.950.09 | — | TNT |
| 2020-01-01 | 58849.82 | 21.32 | — | 20.070.09 | 19.870.07 | 19.070.05 | 19.100.09 | 18.860.05 | TNT |
| 2020-01-02 | 58850.47 | 21.97 | 20.320.24 | 20.420.08 | 20.100.05 | 19.650.08 | 19.310.07 | 19.490.13 | LCO |
| 2020-01-02 | 58850.47 | 21.97 | 20.120.23 | 20.430.10 | 20.090.05 | 19.640.07 | 19.290.06 | — | LCO |
| 2020-01-02 | 58850.75 | 22.25 | — | 20.570.99 | 18.890.05 | 19.480.05 | 19.180.04 | 19.290.04 | TNT |
| 2020-01-03 | 58851.78 | 23.28 | — | 20.390.08 | 20.090.05 | 19.590.05 | 19.290.03 | 18.970.04 | TNT |
| 2020-01-04 | 58852.76 | 24.26 | — | 20.570.99 | 20.090.05 | 19.590.05 | 19.400.04 | 19.110.07 | TNT |
| 2020-01-05 | 58853.30 | 24.80 | 20.040.27 | 20.680.22 | 20.520.14 | 19.860.12 | 19.600.09 | 19.380.09 | LCO |
| 2020-01-05 | 58853.30 | 24.80 | 20.400.32 | — | — | 19.890.13 | 19.510.09 | 19.350.08 | LCO |
| 2020-01-06 | 58854.28 | 25.78 | — | 20.620.22 | 20.650.19 | 20.060.14 | 19.480.10 | 19.480.24 | LCO |
| 2020-01-06 | 58854.28 | 25.78 | — | 20.410.22 | — | 19.950.13 | 19.410.08 | 20.530.15 | LCO |
| 2020-01-14 | 58862.44 | 33.94 | — | 20.730.24 | — | 20.630.20 | 19.470.16 | — | LCO |
| 2020-01-14 | 58862.46 | 33.94 | — | — | — | 20.320.17 | 19.960.21 | — | LCO |
| 2020-01-18 | 58866.44 | 37.94 | — | 21.490.24 | 21.510.17 | 20.630.16 | 20.010.09 | 19.880.11 | LCO |
| 2020-01-18 | 58866.44 | 37.94 | — | 21.280.21 | 21.100.12 | 20.530.13 | 20.080.09 | 19.880.11 | LCO |
| 2020-01-24 | 58872.48 | 43.98 | — | 21.340.18 | 21.270.10 | 21.280.14 | 20.150.08 | 19.910.11 | LCO |
| 2020-01-24 | 58872.49 | 43.99 | — | 21.480.25 | 21.280.11 | 20.890.12 | 20.180.07 | 19.940.11 | LCO |
| 2020-01-28 | 58876.43 | 47.93 | — | 21.660.33 | 21.470.16 | 20.790.16 | 20.340.12 | 20.310.16 | LCO |
| 2020-01-28 | 58876.44 | 47.94 | — | 21.840.28 | 21.660.24 | 20.770.28 | 20.290.08 | — | LCO |
| 2020-01-28 | 58876.48 | 47.98 | — | 21.800.33 | — | 20.760.13 | — | — | LCO |
| 2020-01-28 | 58876.48 | 47.98 | — | 21.370.23 | — | 20.840.17 | — | — | LCO |
| 2020-02-01 | 58880.47 | 51.97 | 21.390.24 | 21.430.12 | 20.660.12 | 20.390.10 | 20.200.13 | LCO | |
| 2020-02-01 | 58880.48 | 51.98 | — | 21.520.24 | 21.560.16 | 20.810.16 | 20.420.11 | 20.330.15 | LCO |
| 2020-02-08 | 58887.41 | 58.91 | — | 21.510.53 | 21.340.28 | 21.210.49 | 20.340.19 | 20.380.25 | LCO |
| 2020-02-08 | 58887.41 | 58.93 | — | — | 21.880.42 | 20.670.34 | 21.570.44 | 21.760.24 | LCO |
| 2020-03-15 | 58923.61 | 95.11 | — | 22.670.39 | 22.270.31 | 22.050.45 | 21.990.43 | 21.880.13 | TNT |
| Phase | Telescope | Instrument | Range |
|---|---|---|---|
| Å | |||
| -2.9 | 2.0m LJT | YFOSC | 3400-7600 |
| -2.9 | 2.0m LJT | YFOSC | 3400-7600 |
| -2.0 | 2.0m FTN | FLOYDS spectrograph | 3400-9500 |
| -1.0 | 2.0m FTN | FLOYDS spectrograph | 3400-9500 |
| 0.0 | 2.0m FTN | FLOYDS spectrograph | 3400-9700 |
| 1.4 | 2.0m LJT | YFOSC | 3400-7600 |
| 5.0 | 2.0m FTN | FLOYDS spectrograph | 3400-9700 |
| 7.2 | 2.0m LJT | YFOSC | 3400-7600 |
| 8.0 | 2.0m FTN | FLOYDS spectrograph | 3400-9500 |
| 12.3 | 2.0m LJT | YFOSC | 3400-7600 |
| 13.0 | 2.0m FTN | FLOYDS spectrograph | 3400-9500 |
| 18.3 | 2.0m LJT | YFOSC | 3400-7600 |
The spectroscopic observations of SN 2019wep were taken at 9 epochs spanning up to 22 days after explosion with the 2.0m FTN and FTS telescopes of LCO and 2.4m LJT of Yunnan Observatories, China. The 1D wavelength- and flux-calibrated spectra were extracted using the floydsspec pipeline777https://github.com/svalenti/FLOYDSpipeline (Valenti et al., 2014) for the LCO data. Spectroscopic data of the LJT telescope was reduced using the APALL task in IRAF888Image Reduction and Analysis Facility followed by wavelength and flux calibration. The slit loss corrections were done by scaling the spectra to the photometry. Finally, the spectra were corrected for the heliocentric redshift of the host galaxy. The log of spectroscopic observations is given in Table 2.
3 Photometric Evolution of SN 2019wep
The multi-band light curve evolution of SN 2019wep is shown in Figure 1. Even though our observations were unable to trace the light curve maximum, four pre-maximum unfiltered data points were reported in TNS which we combine with our -band data to perform a polynomial fit on the early data upto 8 days. A derivative of the flux values tending to zero is used to estimate the light curve maximum which occurs at MJD 58828.5 2 days. The error in the obtained values is the fitting error associated with the light curve. The maximum magnitude in -band is estimated by fitting a cubic spline function in the light curve data upto 10 days. This results in a peak absolute magnitude of MV= -18.26 0.20 mag where the estimated error accounts for the contribution of error in magnitude, redshift and interpolation errors. Even though most of the SNe Ibn have covered the -band maximum, which is also the case of our comparison sample, we use days since -maximum as a reference epoch throughout the study because of a better sampling in -band.
For estimating the peak absolute magnitude in - and -bands, we select the first 30 days phase bin and perform a linear fit on the light curve as suggested by Hosseinzadeh et al. (2017) where the intercept gives a measure of the peak absolute magnitude. The peak absolute magnitudes for SN 2019wep are estimated to be Mr= -18.18 0.95 mag and Mi= -17.98 0.99 mag. The error on the peak magnitude is estimated from the estimated error on the peak date, the standard errors on the slope and intercept, and the slope-intercept covariance of the fit. We want to remark that the extrapolated peak only provides a limit on the magnitudes, and thus large error bars are associated with the estimation.
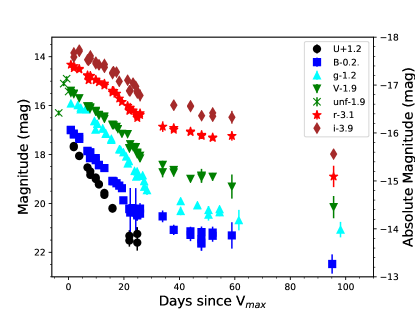
The rise time of an object is generally estimated as the difference between the estimated explosion epoch and the maximum. In the case of SN 2019wep we estimate the rise time to be 4 3 days. The error in rise time is the error in the explosion epoch and the epoch of maximum propagated in quadrature. The rise time of SN 2019wep indicates that it is one of the fast-rising members among the SNe Ibn subclass and has a good match with SN 1999cq (cf. Table 4; Hosseinzadeh et al., 2017; Matheson et al., 2000).
The -band light curve of SN 2019wep, between 0–30 days post maximum, has a decay rate of mag d-1. The and -band light curves follow approximately the same decline rate as -band and roughly comparable to the SNe Ibn sample, i.e., 0.1 mag d-1, of course with few exceptions (Hosseinzadeh et al., 2017). The - and -band light curves decay slightly faster with a rate of 0.145 0.003 mag d-1. Given the peak luminosity and decline rate, SN 2019wep also seems to follow the peak luminosity-decline rate relation of SNe Ibn proposed by Wang et al. (2021) concluding that more luminous SNe tend to have slower post-peak decline rates because of different CSM configurations.
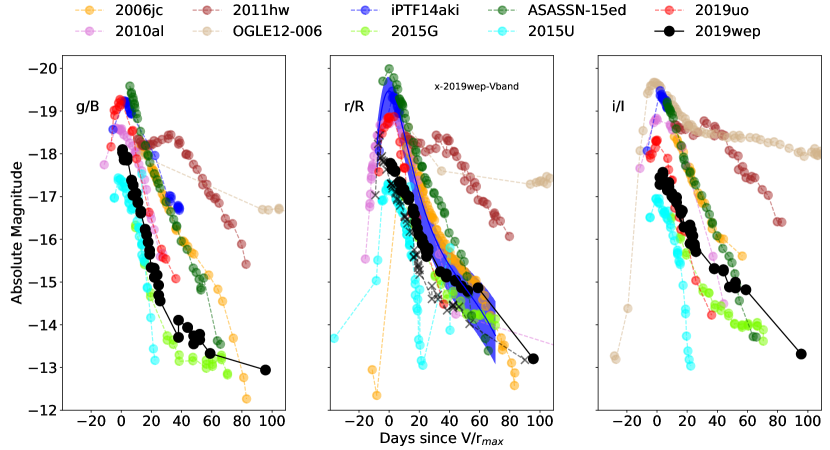
Fast transients are the group of objects that rise and fade in brightness on timescales much shorter than those of other SNe (Drout et al., 2014; Arcavi et al., 2016; Pellegrino et al., 2021; Maeda & Moriya, 2022). Their progenitor systems are uncertain and they have a featureless blue continuum similar to most SNe Ibn. The fast transients were an underrepresented class with a very few known examples (Ofek et al., 2010; Kasliwal et al., 2010) that were discovered by chance and displayed diverse observational properties. The recent high cadence surveys Pursiainen et al. (2018); Tampo et al. (2020); Andreoni et al. (2021) have allowed for a systematic search of fast transients. Using the ZTF sample, Ho et al. (2021) distinguished fast transients into three categories - i) sub-luminous SN IIb/Ic population, ii) luminous SN Ibn population, and iii) fast and blue optical transients (FBOTs). These studies have shown similarities between SNe Ibn and fast transients that are mostly powered by ejecta interacting with He-rich CSM. Moreover, SNe Ibn and fast transients show similar rise times, peak luminosity and decay rates (Clark et al., 2020; Xiang et al., 2021). Motivated with their similarity, we compare the absolute magnitude light curves of SN 2019wep in different bands with a sample of SNe Ibn (Hosseinzadeh et al., 2017) and fast transients (Drout et al., 2014) in the top and bottom panels respectively of Figure 2. The comparison sample has well covered peaks in -bands which is missed in SN 2019wep. The only peak coverage in SN 2019wep is in the -band. We plot the -band absolute magnitude along with -band in the top middle-panel (Figure 2) to show the comparison in peak magnitudes. The limiting peak absolute magnitudes of SN 2019wep in the and -bands are estimated by performing a linear fit as mentioned previously. We also estimate the 0–30 days decay rates of the sample of fast transients and find that it typically lies between 0.03-1 mag d-1. This indicates that the SN 2019wep light curves evolve faster than a prototypical SN II i.e a SNe IIP/IIL with a post plateau decay rate of 0.01 mag d-1 (Lyman et al., 2016; Bose et al., 2018), but has a evolution consistent with the categorised fast transients and lies at the faster decay end of SNe Ibn.
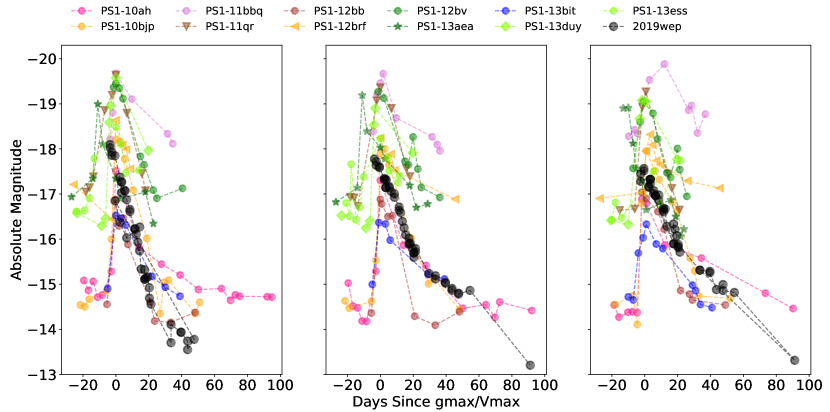
The top middle panel of Figure 2 also shows the normalized light curve of SNe Ibn (taken from Hosseinzadeh et al. (2017); comprising 95% of the SNe Ibn data) by the blue shaded region in the -band. The normalized light curve was generated by first normalizing all light curves by their estimated peak magnitudes and using a Gaussian process to estimate the average light curve. We see that the light curve shape of SN 2019wep is well matched with that of SNe 2010al, 2019uo and ASASSN-15ed and the brightness is comparable to iPTF14aki. The estimated peak magnitude in SN 2019wep is towards the lower brightness limit of the SNe Ibn sample. Since non-detections were not included in generating the normalized light curve by Hosseinzadeh et al. (2017), the template is biased toward a brighter and shallower evolution at early times with longer rise times of SNe Ibn. In comparison to the fast transients, SN 2019wep lies at an average brightness. The light curve shape matches well with one of the fast transient PS1-10ah.
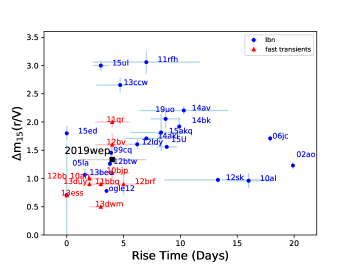
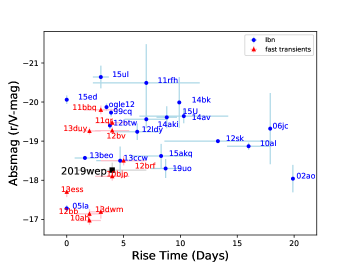
Figure 3 shows the correlation plots of SNe Ibn and fast transients where the m15 and absolute magnitude are plotted against the rise time. The plot indicates that the rise time of SN 2019wep is shorter (even though large error bars are associated with these estimations) with respect to the rise time estimates of other SNe Ibn. The rise time of SN 2019wep is slightly larger than the average value of the fast transients. The m15 value matches well with SN 1999cq and is lower as compared to other SNe Ibn. Even though rise times indicate that SN 2019wep lies in the faster end of the SNe Ibn sample, still, we remark that the light curves do not evolve faster than the group of fast transients. SN 2019wep is fainter than most of the SNe Ibn whereas it is of average brightness with respect to the fast transients.
We also compare the color evolution of SN 2019wep with a number of SNe Ibn, which usually show heterogeneity in their color evolution (bottom plot; Figure 4). We see that SN 2019wep shows a color evolution similar to SNe 2010al, ASASSN-15ed and 2019uo in early times but later on transitions to blue. The color of SN 2019wep increases up to 1.58 mag in 52 days post maximum, and subsequently becomes blue at 93 days. SN 2019wep continues to become redder for a longer duration of time than other SNe Ibn. For, SNe 2010al, iPTF14aki, 2019uo, ASASSN-15ed and 2019wep the color increases up to 1 mag, 40 days post maximum. At similar epochs, the color evolution of SN 2006jc was extremely blue ( mag). The transition to the redder colours for SNe 2019wep indicates that it shows the characteristic of not a typical Ibn SN, but the one which shows a close resemblance to a SN Ib with time. This is in good agreement with the P cygni spectroscopic features that transition from narrow to broad, indicating a He-rich circumstellar shell around the progenitor star along with optically thick CSM. The late redder colors for SN 2006jc (Pastorello et al., 2007) and OGLE-2012-SN-006 (Pastorello et al., 2015a) are indicative of dust formation.
To construct the bolometric light curve of SN 2019wep between UV to IR bands, we used the SuperBol code (Nicholl, 2018). The missing UV and NIR data was supplemented by extrapolating the Specrtral Energy Distributions (SEDs) using the blackbody approximation and direct integration method as described in Lusk & Baron (2017). A linear extrapolation was performed in the UV regime at late times. The estimated limiting peak bolometric luminosity of SN 2019wep is erg s-1 (top panel; Figure 4). The bolometric light curves of other SNe Ibn are also shown in the Figure. The overall light curve of SN 2019wep matches well with that of SN 2019uo (peak luminosity erg s-1. Gangopadhyay et al. (2020a) inferred that SN 2019uo was best described with a 56Ni + CSM model which can be assumed to be consistent with SN 2019wep (given that both SNe have similar peak luminosities) with a 56Ni mass of M⊙.
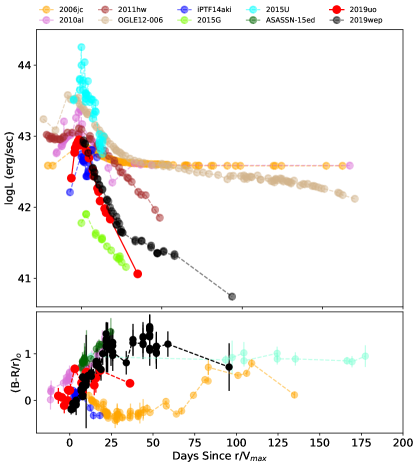
The bolometric light curve modelling of SN 2019wep has been performed in the work by Pellegrino et al. (2021) which we briefly summarise in this section. The physical parameters were derived from a best-fit hybrid model using the MINIM code (Chatzopoulos et al., 2013), which finds self-similar solutions to the propagation of forward and reverse shocks generated by the interaction between the SN ejecta and optically thick CSM as described by Chevalier (1982). The CSM has as its free parameters an inner radius R, mass M, and density , which has an assumed power law form with index = 12 in the outer region, and = 0 in the inner region. In addition to the CSM interaction, radioactive decay of 56Ni is used as an additional luminosity source. Constant optical and gamma-ray opacities are also assumed.
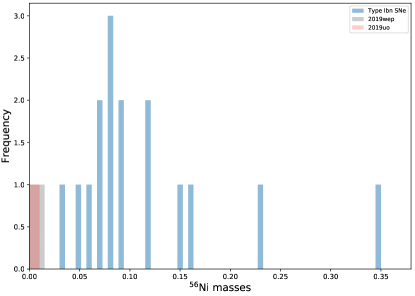
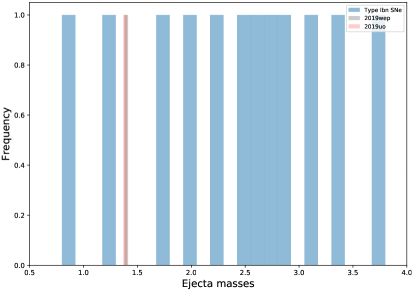
Pellegrino et al. (2021) find that the bolometric evolution of SN 2019wep can be well explained by CSM interaction plus radioactive decay, following the mechanism by Chatzopoulos et al. (2013). The best-fit model light curve to the data is shown in their Figure 1, with model parameters listed in their Table 6 (Pellegrino et al., 2021). This model has very similar CSM and ejecta parameters to that of SN 2019uo, including values of R, ejecta mass M, M, 56Ni mass M, and that are consistent with one another. The best-fit parameters of SN 2019uo from Chatzopoulos et al. (2013) differ from those presented in Gangopadhyay et al. (2020a) due to the fact that different assumptions were made between the models used in these two studies, including assumed CSM density power law indices. Nevertheless, the inferred parameters for these two SNe Ibn indicate that they likely share similar CSM and explosion properties which was expected because both members belong to P cygni class of SNe Ibn with flash ionized features. A direct comparison of SNe Ibn with SNe Ib is not possible because of the difference in the luminosity powering mechanism. We see, however, that even though the obtained 56Ni masses are lower than the canonical SESNe (Maeda & Moriya, 2022), the ejecta masses obtained are consistent with many SNe Ib as deciphered from the statistical analysis of Lyman et al. (2016); Prentice et al. (2016). This is also seen in the histograms (Figure 5) that compares SNe 2019uo and 2019wep with the statistical sample of SNe Ib taken from Prentice et al. (2019) and Taddia et al. (2018). We see that both SNe 2019uo and 2019wep lie at the lower limit of 56Ni mass while the ejecta masses are quite consistent with the sample. So, we can expect the appearance of P cygni spectroscopic features and broadening of the features with time. Also, since our obtained light curves are consistent with other SNe Ibn, the ejecta properties are expected to be within the canonical sample of SESNe (Maeda & Moriya, 2022). It is interesting, however, to note that the 56Ni masses of SNe 2019uo and 2019wep are very low. Although, there is no systematic study being done which compares the 56Ni masses with the ejecta masses for a group of SNe Ibn, in a recent study by Perley et al. (2022), very low 56Ni mass ( 0.03 M⊙) was estimated in a SN Icn 2021csp using late time photometric upper limits. Analysis of three recent SNe Icn 2021csp (Perley et al., 2022), 2019hgp (Gal-Yam et al., 2022) and 2021ckj (Pastorello et al., 2021) has shown that the velocities, abundance patterns and luminosities of SNe Ibn vs SNe Icn are parallel and share a similar WR progenitor. It is likely that the low 56Ni mass yields are due to significant fallback onto the central remnant after the explosion, which only unbound a small fraction of the 56Ni produced. This could be a possible scenario if a massive WR star undergoes only a partially successful explosion. Our estimated values of 56Ni mass from the best fit model light curves are lower than those of normal SNe Ibc but are consistent with those of SNe Icn (such as SN 2021csp) indicating that there was substantial fallback after the explosion (as claimed by Perley et al. 2022). This scenario also explains a reduced ejecta mass, which could explain why the ejecta mass of SN 2019wep is comparable to SNe Ib even if the progenitor is massive ( 20 M⊙). The other scenario could be the explosion of an ultra-stripped low-mass star, but the total ejecta mass of SN 2019wep is too high to justify this case.
4 Spectral evolution
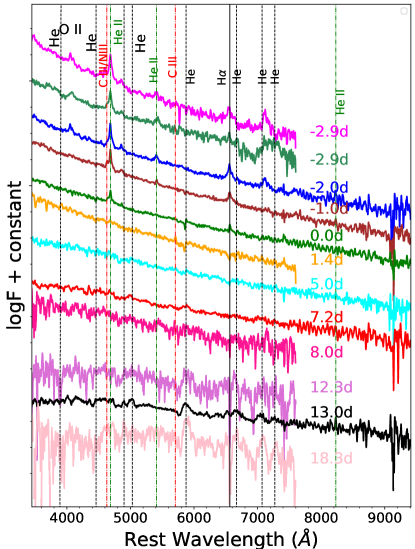
We present the spectral evolution of SN 2019wep from days to days post maximum (Figure 6). The first few spectra of SN 2019wep are very similar to SNe 2010al and 2019uo with a distinct blue continuum. The presence of this blue continuum also makes it similar to fast transients (Drout et al. 2014; Pellegrino et al. 2021).We fit a blackbody on the first three spectra (, and day) of SN 2019wep which show that the photospheric temperature varies between 22,000 K to 15,000 K. However, we want to remark that the SEDs of these SNe peak in the UV regime (Drout et al., 2014) and the temperature will essentially depend on the UV brightness of the object. As such, the temperature derived from the photometry is uncertain owing to the lack of UV observations. A narrow H emission is seen in the early spectrum of SN 2019wep with a velocity of 3000 km sec-1 which is most likely due to interstellar gas in the host galaxy and some contribution from SN which we will explain in detail in later sections. We see typical features of emission in SN 2019wep around 4660 Å in the first five spectra ( to days). The emission components are double-peaked with two distinct transitions, the blue component peaking at 4643 Å and the red component peaking at 4682 Å. The red component at 4682 Å is due to He II at 4686 Å, whereas the blue component arises from a blend of C III 4648 Å and N III 4640 Å. A very weak, less prominent doubly ionized C III feature at 5696 Å is also seen. These signatures are interpreted as He rich signatures in a flash ionised CSM (Gal-Yam, 2014; Pastorello et al., 2015b). Previously flash ionisation signatures of C III were seen in PTF12ldy and iPTF15ul (Hosseinzadeh et al., 2017). In SNe Ibn 2010al and 2019uo the flash ionization signatures of both C III and He II, typical of SNe II, are seen. Presence of such lines indicate that they could likely be originated from WR winds (Cooke et al., 2010; Silverman et al., 2010). Flash ionized signatures were previously noted in SNe IIn (e.g., SN 1998S; Fassia et al. (2001) and SN 2008fq; Taddia et al. (2013)). Groh (2014) reverted the WR progenitor scenario through the estimation of the physical parameters of a SN IIb 2013cu and found that the progenitor is not a WR star even though the flash ionized features showed WR like lines. A He II 5411 Å feature with a velocity between 1413 km s-1–1483 km s-1 is also seen in the very early spectra (- day) of SN 2019wep. In the early spectra, an absorption feature is seen close to 4000 Å which is most likely due to the presence of O II and He II features, respectively.
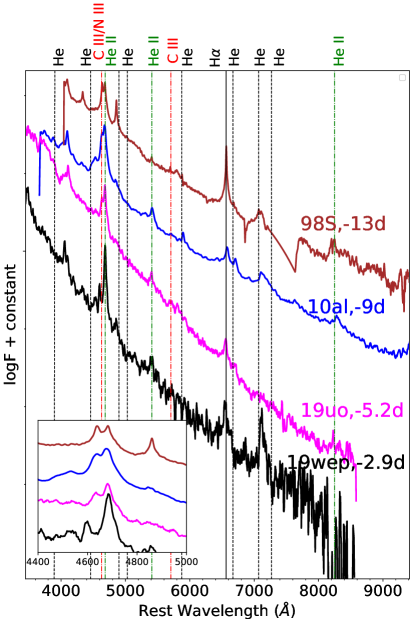
Figure 7 shows a comparison of the early spectra of SNe 1998S (type IIn), 2010al (type Ibn) and 2019uo (type Ibn) with SN 2019wep. It is interesting to note that SN 2019wep shows the strongest flash features in the early spectrum as compared with other SNe Ibn. The spectrum of SN 2010al shows only C III features around 4650 Å, SN 2019wep shows C III features around 4650 Å and at 5696 Å in agreement with SN 2019uo. The inset in Figure 7 highlights these features, which also indicates that SN 2019wep shows the most significant He II feature.
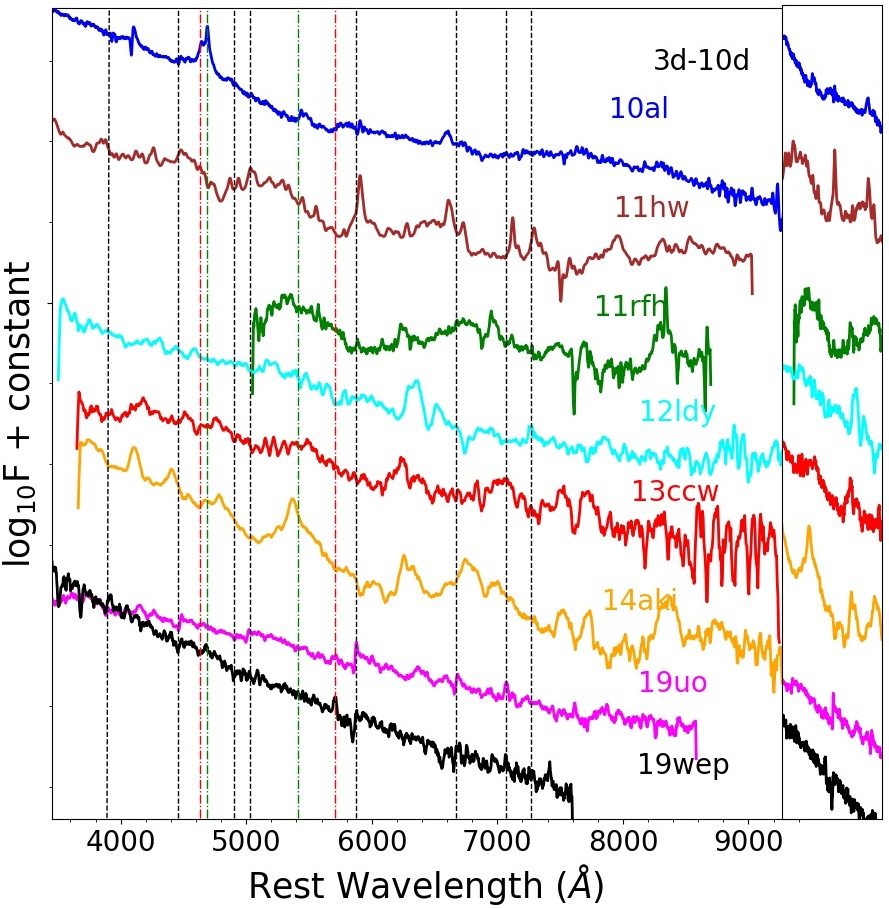

As the SN evolves further ( days), we see a distinct He I P cygni feature that is superimposed on a broader base (the continuum is not flat). The flash ionization spectral signatures vanishes with time and disappears on days. From – days, features of Ca II, Si II, and Na ID also start developing (see Figure 6). Figure 8 shows the spectral comparison of SN 2019wep with other SNe Ibn in the phase range between 3 day to 10 day post maximum. At similar phases, the He I 5876 Å feature of SN 2019wep is similar to that identified in SN 2010al and SN 2019uo with a narrow P cygni feature while other members show a prominent emission profile. Also, the continuum of SN 2019wep is bluer as compared to all other SNe of the comparison sample. However, the He I P cygni feature of SN 2019wep is broader than SNe 2010al and 2019uo, and is superimposed over a broader emission line. On the other hand, the He I P cygni profile in SN 2010al is over a flat continuum. The flash ionization signatures in SN 2019wep have vanished in this phase, but in SN 2010al these signatures are still visible. The spectral signatures of SN 2019wep (specially He I as shown in zoomed version in the right inset) indicates that SN 2019wep belongs to the “P cygni” subclass.
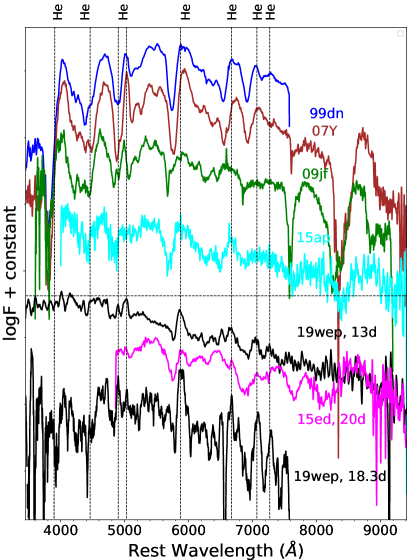
We see distinct broad emission lines of He I developing from - day indicating similarity to a SN Ib. For a more evident comparison, we plot the spectrum of SN 2019wep in Figure 9 with SN Ibn ASASSN-15ed (Pastorello et al., 2015d) and a few prototypical SNe Ib between – days after maximum. A comparison of the He I velocity of SN 2019wep shows that it has a typical absorption FWHM velocity of 5000 1000 km sec-1. At similar epochs, the FWHM velocity of ASASSN-15ed is 6300 1000 km sec-1 which is comparable to that of SN 2019wep. This is less than the typical SN Ib velocity of our comparison sample which has absorption trough velocity between 7000-9000 km sec-1. The major difference observed between SNe Ibn and SNe Ib spectra is that SNe Ibn have more symmetric profiles, while in SNe Ib the absorption dominates over the emission. Additionally, the absorption components of He I in SN 2019wep are almost similar to SNe Ib spectra suggesting a higher kinetic energy per mass unit in the SN ejecta, specially in the late phases of SNe Ibn that develop broad lines (Pastorello et al., 2015d). The simultaneous presence of a very narrow feature at early phases and transitioning to broad features suggests that these features arise from different emitting regions: the broader He I P cygni features are likely a signature of the SN ejecta, while the narrow He I P cygni lines are generated in the unperturbed, He-rich CSM. At early phases, the narrow lines are formed in the photosphere located in a dense shell. This shell is either continuously photoionized by early ejecta-CSM interaction in the inner CSM regions and/or by the initial shock breakout. Once recombination occurs, the shell becomes transparent and we see the signatures of underlying SN ejecta and the spectrum is dominated by broad P cygni lines.
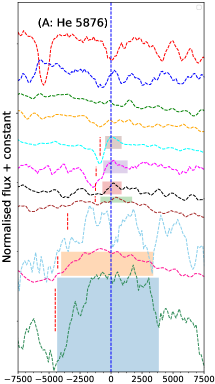
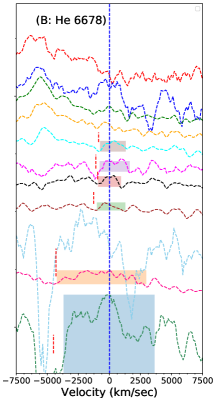
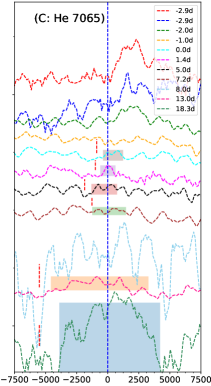
Figure 10 shows the evolution of He I 5876, 6676, 7065 Å feature in the velocity space. We see a narrow P cygni profile which gradually evolves with time and shows a broad emission on top. The physical explanation behind the origin of the “P cygni” subclass could be a shell of He around the progenitor star surrounded by a dense CSM. As the optically thick shell is lit by the explosion, the narrow P cygni features transition to broader emission as the shell is swept up by the SN ejecta. The viewing angle dependence could also affect this scenario; if the CSM is asymmetric and, we have a He rich torus, then P cygni features would only be visible if the system is viewed edge-on, while emission features can be seen only if it is viewed face-on. On the contrary, Karamehmetoglu et al. (2019) suggest that dominance of emission at late phases is not because of being optically thin, but because they lack other lines to branch into it. UV and X-ray emission arising at the shock boundary are the source of He ionisation and recombination. The ionised region outside the shock leads to electron scattering and emission, P cygni features usually originate from optical depths 1. X-rays penetrating further into the P cygni producing regions will fill in the absorption and lead to emission features. Thus, this provides an alternative scenario to the transitioning of P cygni to emission features of He I lines for SNe Ibn. Asymmetric CSM, thus, plays an important role in the origin of these unusual features. Much of the ejecta usually moves undisturbed by the prevalent CSM configuration. Luminosity generation as a consequence of the interaction of the equatorial CSM beneath the photosphere continues, but, spectral signatures remain hidden until the photosphere recedes. This is the primary cause driving the blue continuum at early stages followed by the appearance of broadened redshifted He features (Andrews & Smith, 2018).
We measure the expansion velocities and equivalent widths (EWs) of three neutral He lines (5876, 6678, and 7065 Å), wherever visible. The emission lines of He I were fit using a Gaussian on a linear continuum. The estimation of EW involves calculation of the integral of the flux normalized to the local continuum. We do not measure the EW of the P cygni lines. The velocities reported are estimated from the absorption minima of P cygni profiles. Figure 11 shows the evolution of velocity and EW for a sample of SNe Ibn taken from Hosseinzadeh et al. (2017). We see an increasing trend in both the line velocities and EW of the He lines. The velocity estimates of SN 2019wep lie at the upper range of SNe Ibn and show a faster evolution. In SN 2019wep, the broad features seen are more prominent than typical emission velocity of SNe Ibn around maxima varying between 6000-8000 km sec-1 (Hosseinzadeh et al., 2017). SN 2019wep has a good resemblance with ASASSN-15ed reaching broader emission profiles as seen in the P cygni subclass (Hosseinzadeh et al., 2017) while the emission subclass shows less evolution in line velocities. The EWs of the absorption component of He I lines for SN 2019wep are at an extreme high end than the normal SNe Ibn. This is also an indication that perhaps SN 2019wep lies somewhere between SN Ib and SNe Ibn.
He I line velocity evolution :
A wide diversity and heterogeneity is observed in the spectral evolution of SNe Ibn in accordance with SNe IIn. The physical parameters of SNe Ibn strongly depend on the composition, geometry, mass and density profile of CSM along with the residual stellar envelope at the time of explosion.
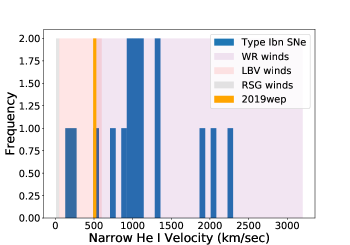
The properties of stellar wind and CSM can be inferred probing the line emitting regions. Spectra of interacting SNe IIn and SNe Ibn are typically produced in different gas regions (Chevalier & Fransson, 1985; Chugai, 1997). The emitting material moving at different velocities are indicated by different components of SNe with varying widths. The slow expanding, photoionised CSM is usually indicated by narrow emission lines (with velocities from a few hundreds to 6500 km sec-1). This gas is unshocked CSM produced by the progenitor star before exploding as a SN. This gives information on the mass-loss history of the SN progenitors. When a clear P cygni profile is identified, the position of the core of the blue-shifted absorption gives an idea of the expanding material. When this component is not detected, the velocity is estimated through the FWHM of the strongest He I emission lines, obtained after deblending the full line profile with Gaussian fits. Figure 12 shows the He I velocity of SN 2019wep, estimated from the weighted average of first two days to be 510 20 km sec-1. The expected range of WR wind speeds (500-3200 km sec-1) (Crowther & Smartt, 2007) is shown as the purple shaded region, the expected wind speeds of LBV stars (50-600 km sec-1) (Smith, 2017) is shown in red and the expected wind speed range of RSG stars (10-50 km sec-1) (van Loon et al., 2005) shown in black. Objects like SN 2019wep which show low CSM velocity are well- matched with other low velocity SNe 2011hw (200-250 km sec-1) and 2005la (about 500 km sec-1). For such SNe, an H line of moderate strength is also found to be associated with the SNe. Scenarios of H lines along with modest stellar wind velocities (a few hundreds km sec-1) are compatible with stellar progenitors which are transitioning between the LBV and the Wolf-Rayet (WNE-type) stages (Pastorello et al., 2008b, 2015e, 2016). PS1-12sk is one such event which showed narrow He I lines and relatively weak intermediate-width H lines and is uniquely associated with an elliptical galaxy. The plot also shows that the velocity of He I, represented by horizontal bars, lies at the lower end of the velocity distribution of SNe Ibn.
The traditional description by Humphreys & Davidson (1994) defines LBVs as single stars between 60-100 M⊙ at a transitional phase in the evolution of the most massive stars, between the main-sequence O-type stars and the H-deficient WR stars. However, Smith & Tombleson (2015) found that the LBVs are surprisingly isolated from O-type stars. Smith & Tombleson (2015) further claimed that many LBVs are likely to be the product of binary evolution and cannot drive the mass-loss mechanism leading to WR phase. Humphreys et al. (2016) again reverted the scenario proposed by Smith & Tombleson (2015) highlighting their uneven sample and reconfirm that LBVs are evolved massive stars that have shed a lot of mass and are moving towards WR phase.
Following the above description both single and binary progenitor scenario are equally likely in case of SN 2019wep with the progenitor having a reminiscent H feature typical of LBV stars and gradually transitioning to a WR phase having a dense CSM owing to the mass-loss rates of the LBV. It has been established that the sites of SNe Ibn are generally associated with star-forming environments (Pastorello et al., 2015b), with one exceptional case where no/little association of star-formation activity was found (PS1-12sk, Sanders et al. 2013; Hosseinzadeh et al. 2019). Thus, the popular and speculative progenitors are typically single massive WR stars with mass 18 M⊙ (Tominaga et al., 2008; Maeda & Moriya, 2022) or a binary progenitor scenario which may be equally likely (Foley et al., 2007).
Origin of H feature:
The H feature originating in SNe serve as an important classifier among the interacting SNe group. Although narrow He I emission lines are frequently detected in the spectra of SNe IIn, the relative strengths between H and the most prominent optical lines He I (5876 and 7065 Å) determines the classification of the transient as a SN IIn, SN Ibn or even a transitional object between these two SN types.
In the two transitional SNe IIn/Ibn 2005la and 2011hw, Balmer lines were prominently detected (Pastorello et al., 2008b, 2015e, 2016). The strength of H feature in both these SNe are comparable with He I lines. In the early spectrum of SN 2005la (Modjaz et al., 2014), H showed a narrow, marginally resolved (FWHM400 km sec-1) component, superposed on a broader base with a P cygni profile while the highest resolution spectrum of SN 2011hw (Pastorello et al., 2015e) showed an unresolved H (FWHM 250 km sec-1) observed over a much broader wing and the intermediate H component with FWHM monotonically increasing between 1350 km sec-1 and 2350 km sec-1. However, most of the SNe Ibn show no prominent H lines or, in some cases, the identification of H is controversial. For example, the detection of multiple lines of C II in the spectra of PS1-12sk (Sanders et al., 2013) argued - at least in the case of that object - against the identification of H lines.
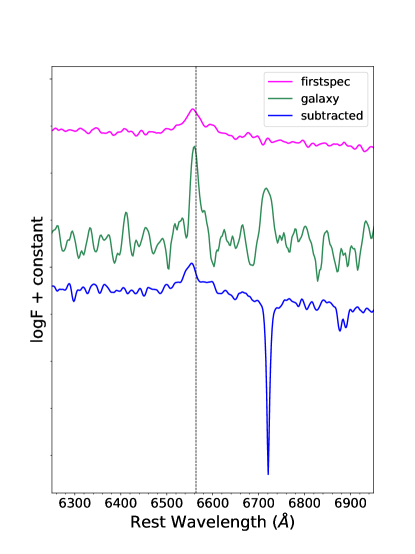
We also see little H at early time in SN 2019wep. To check whether the H is from the host galaxy or is a reminiscent contribution from the SN, we obtained a spectrum in June 2021 from 2.0m FTN. This was used as a host galaxy template for subtraction on the first spectrum of the SN obtained with the same instrumental setup. The flux of the H feature was matched. The subtracted spectrum is shown in Figure 13. Even after spectral subtraction, we see a residual H component with FWHM 1050 km sec-1. When comparing with the first LCO spectrum, it looks like that one also had a broad H base, not present in the host spectrum. So, we propose that at least some (and perhaps all) of the narrow H seen is from the host, but we cannot rule out that some of it (especially because there’s a broad base) is from the SN. We, however, concur that there may be a contamination due to C II. In terms of spectroscopic properties, a transitioning behaviour like SN 2011hw is noticed for SN 2019wep.
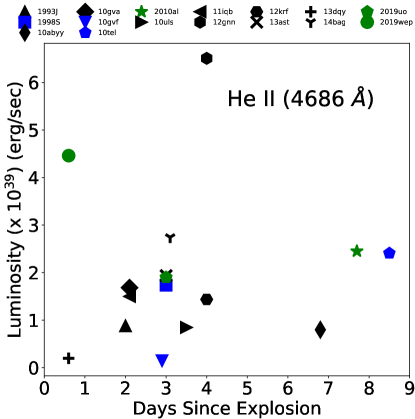
To ascertain the origin of SNe Ibn, a sample of 13 SNe II from literature (including SNe IIb, IIP and IIn; Khazov et al. (2016)) and Ibn (Hosseinzadeh et al., 2017; Gangopadhyay et al., 2020a) , with flash ionisation signatures within 10 days of explosion, are collected. The H lines are usually contaminated by host galaxy lines, we therefore select the relatively isolated and unblended He II 4686 Å line. Since the He II lines are much narrower than the lines from the SN ejecta, they can serve as a good tool to probe the flash-ionized CSM. While measuring the luminosities, we remove the continuum by fitting a linear function. Figure 14 shows the typical luminosity of the He II line in SN 2019wep and other SNe II/IIn/Ibn. From the figure we see that only one SN along with SN 2019wep has been detected very early post explosion for which flash ionization signatures are detected owing to the recombination of CSM. The average luminosity of He II for SN 2019wep is higher than almost all other SNe II, IIn and Ibn which is indicative of the fact that the amount of CSM in SN 2019wep is larger than average SNe II, IIn and Ibn sample at early time. This highlights the need for high cadence SN spectroscopy at very early phase to detect signatures of flash ionisation which are also indicative of presence of CSM and will in turn be useful to infer the possible progenitors.
5 Summary
The paper summarises the photometric and spectroscopic evolution of the SN Ibn 2019wep from to days post maximum. The availability of early data points in TNS were useful to constrain the -band maxima. The light curve decline is slower than the fast transients but is consistent with the SNe Ibn group with a typical decay rate of 0.1 mag d-1 (Hosseinzadeh et al., 2017). Fast transients are one of the exciting findings with characteristic timescales of 10 days, missed in most of the traditional surveys either due to poor resolution of the spectrum or unavailability of follow-up spectroscopic observations. A recent study by Ho et al. (2021) classified SNe Ibn as a subclass of fast transients due to their very similar rise times and blue continuum. This study motivated us to compare the properties of SN 2019wep with samples of SNe Ibn and fast transients. The limits on the absolute magnitude (MV= -18.26 0.20 mag and Mr = -18.18 0.95) shows that the SN lies at the fainter end of SN Ibn subclass but is closer to the average absolute magnitude of the fast transients.
The correlation plots also suggest that the rise time of SN 2019wep is higher than that of the fast transients but is shorter than the average SNe Ibn value. Our analysis suggests that SN 2019wep decays fast and has low luminosity in comparison to other SNe Ibn. We quote the results of the bolometric light curve modelling of SN 2019wep from Pellegrino et al. (2021). The bolometric light curve of SN 2019wep has striking resemblance with SN 2019uo suggesting a comparable 56Ni mass in both SNe. The ejecta mass of SN 2019wep is consistent with SNe Ib samples, even though the models cannot be directly comparable because of different physical mechanisms involved. The low 56Ni mass of SN 2019wep may suggest a significant fallback in the center which can also possibly explain the consistency of the ejecta mass of SN 2019wep with SNe Ib sample. The color evolution of SN 2019wep is unique, placing it between SNe Ib and SNe Ibn. The spectroscopic features of SN 2019wep indicate that it is one of the rare SNe Ibn with signatures of flash ionisation. The early, prominent flash ionisation lines of He II, C III, and N III are detected in the spectra, similar to SN 2019uo and SN 2010al. The disappearance of narrow He I features immediately after maximum and the transitioning to broad P cygni He I features hints towards a lateral shift from SN Ibn to SN Ib group. We interpret that the resemblance to SN Ib is due to the fact that the SN ejecta that is likely hidden by the CSM interaction becomes evident when the recombination comes into play at late phases. The P cygni subclass most likely originates from a He-rich shell around the progenitor surrounded by a dense CSM, or it may be due to viewing angle dependency. Asymmetricity of the CSM configuration also plays a major role in this aspect. This is also validated by the equivalent widths of He I features. The estimated line velocities are lower than the average values of SNe Ibn, but they show a faster evolution as compared to the “emission” subclass. The low He I velocity of CSM and the presence of residual H in the spectroscopic features indicate that SN 2019wep is a transitional SN Ibn with progenitor scenario lying between a LBV and a WR star. Maeda & Moriya (2022) essentially found that the progenitor of SNe Ibn are WR stars with mass 18 M⊙. While Ho et al. (2021) estimate that the volumetric rate of SNe Ibn population is 0.5 of CCSNe, Maeda & Moriya (2022) with their updated estimations found that the volumetric rates is 1 of CCSNe population. This is of course below the fraction of SNe Ibn with masses 18 M⊙ but many of them are undetected in optical because of emission of large fraction of UV radiation for these candidate SNe (Maeda & Moriya, 2022). High cadence UV surveys are thus, quintessential to detect ’UV Ibn’ SNe population.
Acknowledgments
We thank the referee for several critical comments and useful suggestions which has improved the presentation of the paper. We thank the support of the staff of the Xinglong 2.16 m and Lijiang 2.4 m telescope, for their support during observations. This work was partially supported by the Open Project Program of the Key Laboratory of Optical Astronomy, National Astronomical Observatories, Chinese Academy of Sciences. Funding for the Lijiang 2.4 m telescope has been provided by Chinese Academy of Sciences and the People’s Government of Yunnan Province. We acknowledge Weizmann Interactive Supernova data REPository (WISeREP; http://wiserep.weizmann.ac.il). DAH acknowledges support from NSF grant AST-1313404. The work of XW is supported by the National Science Foundation of China (NSFC grants 12033003, 11633002, and 11761141001), the Major State Basic Research Development Program (grant 2016YFA0400803), and the Scholar Program of Beijing Academy of Science and Technology (DZ:BS202002). This work makes use of data obtained with the LCO Network. KM acknowledges BRICS grant DST/IMRCD/BRICS/Pilotcall/ProFCheap/2017(G) and the DST/JSPS grant, DST/INT/JSPS/P/281/2018 for the present work. IA is a CIFAR Azrieli Global Scholar in the Gravity and the Extreme Universe Program and acknowledges support from that program, from the European Research Council (ERC) under the European Union’s Horizon 2020 research and innovation program (grant agreement number 852097), from the Israel Science Foundation (grant number 2752/19), from the United States - Israel Binational Science Foundation (BSF), and from the Israeli Council for Higher Education Alon Fellowship. JZ is supported by the NSFC (grants 12173082, 11773067), by the Youth Innovation Promotion Association of the CAS (grants 2018081), and by the Ten Thousand Talents Program of Yunnan for Top-notch Young Talents. The LCO team is supported by NSF grants AST-1911151 and AST-1911225.
References
- Andreoni et al. (2021) Andreoni, I., Coughlin, M. W., Kool, E. C., et al. 2021, ApJ, 918, 63, doi: 10.3847/1538-4357/ac0bc7
- Andrews & Smith (2018) Andrews, J. E., & Smith, N. 2018, MNRAS, 477, 74, doi: 10.1093/mnras/sty584
- Arcavi et al. (2016) Arcavi, I., Wolf, W. M., Howell, D. A., et al. 2016, ApJ, 819, 35, doi: 10.3847/0004-637X/819/1/35
- Becker (2015) Becker, A. 2015, HOTPANTS: High Order Transform of PSF ANd Template Subtraction. http://ascl.net/1504.004
- Bellm (2014) Bellm, E. 2014, in The Third Hot-wiring the Transient Universe Workshop, ed. P. R. Wozniak, M. J. Graham, A. A. Mahabal, & R. Seaman, 27–33. https://arxiv.org/abs/1410.8185
- Bellm et al. (2019) Bellm, E. C., Kulkarni, S. R., Barlow, T., et al. 2019, PASP, 131, 068003, doi: 10.1088/1538-3873/ab0c2a
- Benetti et al. (2011) Benetti, S., Turatto, M., Valenti, S., et al. 2011, MNRAS, 411, 2726, doi: 10.1111/j.1365-2966.2010.17873.x
- Bose et al. (2018) Bose, S., Dong, S., Kochanek, C. S., et al. 2018, ApJ, 862, 107, doi: 10.3847/1538-4357/aacb35
- Chatzopoulos et al. (2013) Chatzopoulos, E., Wheeler, J. C., & Couch, S. M. 2013, ApJ, 776, 129, doi: 10.1088/0004-637X/776/2/129
- Chevalier (1982) Chevalier, R. A. 1982, ApJ, 259, L85, doi: 10.1086/183853
- Chevalier & Fransson (1985) Chevalier, R. A., & Fransson, C. 1985, Supernova Interaction with a Circumstellar Wind and the Distance to SN 1979c, ed. N. Bartel, Vol. 224, 123, doi: 10.1007/3-540-15206-7_53
- Chugai (1997) Chugai, N. N. 1997, Ap&SS, 252, 225, doi: 10.1023/A:1000847125928
- Clark et al. (2020) Clark, P., Maguire, K., Inserra, C., et al. 2020, MNRAS, 492, 2208, doi: 10.1093/mnras/stz3598
- Cooke et al. (2010) Cooke, J., Ellis, R. S., Nugent, P. E., et al. 2010, The Astronomer’s Telegram, 2491, 1
- Crowther & Smartt (2007) Crowther, P., & Smartt, S. 2007, Astronomy and Geophysics, 48, 1.35, doi: 10.1111/j.1468-4004.2007.48135.x
- Drout et al. (2014) Drout, M. R., Chornock, R., Soderberg, A. M., et al. 2014, ApJ, 794, 23, doi: 10.1088/0004-637X/794/1/23
- Fassia et al. (2001) Fassia, A., Meikle, W. P. S., Chugai, N., et al. 2001, MNRAS, 325, 907, doi: 10.1046/j.1365-8711.2001.04282.x
- Foley et al. (2007) Foley, R. J., Smith, N., Ganeshalingam, M., et al. 2007, ApJ, 657, L105, doi: 10.1086/513145
- Gal-Yam (2014) Gal-Yam, A. 2014, in American Astronomical Society Meeting Abstracts, Vol. 223, American Astronomical Society Meeting Abstracts #223, 235.02
- Gal-Yam (2019) Gal-Yam, A. 2019, ApJ, 882, 102, doi: 10.3847/1538-4357/ab2f79
- Gal-Yam & Leonard (2009) Gal-Yam, A., & Leonard, D. C. 2009, Nature, 458, 865, doi: 10.1038/nature07934
- Gal-Yam et al. (2014) Gal-Yam, A., Arcavi, I., Ofek, E. O., et al. 2014, Nature, 509, 471, doi: 10.1038/nature13304
- Gal-Yam et al. (2022) Gal-Yam, A., Bruch, R., Schulze, S., et al. 2022, Nature, 601, 201, doi: 10.1038/s41586-021-04155-1
- Gangopadhyay et al. (2020a) Gangopadhyay, A., Misra, K., Hiramatsu, D., et al. 2020a, ApJ, 889, 170, doi: 10.3847/1538-4357/ab6328
- Gangopadhyay et al. (2020b) Gangopadhyay, A., Misra, K., Sahu, D. K., et al. 2020b, MNRAS, 497, 3770, doi: 10.1093/mnras/staa1821
- Gorbikov et al. (2014) Gorbikov, E., Gal-Yam, A., Ofek, E. O., et al. 2014, MNRAS, 443, 671, doi: 10.1093/mnras/stu1184
- Groh (2014) Groh, J. H. 2014, A&A, 572, L11, doi: 10.1051/0004-6361/201424852
- Ho et al. (2021) Ho, A. Y. Q., Perley, D. A., Gal-Yam, A., et al. 2021, arXiv e-prints, arXiv:2105.08811. https://arxiv.org/abs/2105.08811
- Hosseinzadeh et al. (2019) Hosseinzadeh, G., McCully, C., Zabludoff, A. I., et al. 2019, ApJ, 871, L9, doi: 10.3847/2041-8213/aafc61
- Hosseinzadeh et al. (2017) Hosseinzadeh, G., Arcavi, I., Valenti, S., et al. 2017, ApJ, 836, 158, doi: 10.3847/1538-4357/836/2/158
- Huang et al. (2012) Huang, F., Li, J.-Z., Wang, X.-F., et al. 2012, Research in Astronomy and Astrophysics, 12, 1585, doi: 10.1088/1674-4527/12/11/012
- Humphreys & Davidson (1994) Humphreys, R. M., & Davidson, K. 1994, PASP, 106, 1025, doi: 10.1086/133478
- Humphreys et al. (2016) Humphreys, R. M., Weis, K., Davidson, K., & Gordon, M. S. 2016, ApJ, 825, 64, doi: 10.3847/0004-637X/825/1/64
- Karamehmetoglu et al. (2019) Karamehmetoglu, E., Fransson, C., Sollerman, J., et al. 2019, arXiv e-prints, arXiv:1910.06016. https://arxiv.org/abs/1910.06016
- Kasliwal et al. (2010) Kasliwal, M. M., Kulkarni, S. R., Gal-Yam, A., et al. 2010, ApJ, 723, L98, doi: 10.1088/2041-8205/723/1/L98
- Khazov et al. (2016) Khazov, D., Yaron, O., Gal-Yam, A., et al. 2016, ApJ, 818, 3, doi: 10.3847/0004-637X/818/1/3
- Lusk (2016) Lusk, J. A. 2016, SuperBoL: Module for calculating the bolometric luminosities of supernovae. http://ascl.net/1609.019
- Lusk & Baron (2017) Lusk, J. A., & Baron, E. 2017, PASP, 129, 044202, doi: 10.1088/1538-3873/aa5e49
- Lyman et al. (2016) Lyman, J. D., Bersier, D., James, P. A., et al. 2016, MNRAS, 457, 328, doi: 10.1093/mnras/stv2983
- Maeda & Moriya (2022) Maeda, K., & Moriya, T. J. 2022, arXiv e-prints, arXiv:2201.00955. https://arxiv.org/abs/2201.00955
- Mao et al. (2019) Mao, X., Gao, W., Ding, Y., Zhang, M., & Gao, X. 2019, Transient Name Server Discovery Report, 2019-2556, 1
- Matheson et al. (2000) Matheson, T., Filippenko, A. V., Chornock, R., Leonard, D. C., & Li, W. 2000, AJ, 119, 2303, doi: 10.1086/301352
- Modjaz et al. (2014) Modjaz, M., Blondin, S., Kirshner, R. P., et al. 2014, AJ, 147, 99, doi: 10.1088/0004-6256/147/5/99
- Moriya & Maeda (2016) Moriya, T. J., & Maeda, K. 2016, ApJ, 824, 100, doi: 10.3847/0004-637X/824/2/100
- Morozova et al. (2017) Morozova, V., Piro, A. L., & Valenti, S. 2017, ApJ, 838, 28, doi: 10.3847/1538-4357/aa6251
- Munari & Zwitter (1997) Munari, U., & Zwitter, T. 1997, A&A, 318, 269
- Nicholl (2018) Nicholl, M. 2018, Research Notes of the American Astronomical Society, 2, 230, doi: 10.3847/2515-5172/aaf799
- Nyholm et al. (2020) Nyholm, A., Sollerman, J., Tartaglia, L., et al. 2020, A&A, 637, A73, doi: 10.1051/0004-6361/201936097
- Ofek et al. (2010) Ofek, E. O., Rabinak, I., Neill, J. D., et al. 2010, ApJ, 724, 1396, doi: 10.1088/0004-637X/724/2/1396
- Pastorello et al. (2007) Pastorello, A., Smartt, S. J., Mattila, S., et al. 2007, Nature, 447, 829, doi: 10.1038/nature05825
- Pastorello et al. (2008a) Pastorello, A., Mattila, S., Zampieri, L., et al. 2008a, MNRAS, 389, 113, doi: 10.1111/j.1365-2966.2008.13602.x
- Pastorello et al. (2008b) Pastorello, A., Quimby, R. M., Smartt, S. J., et al. 2008b, MNRAS, 389, 131, doi: 10.1111/j.1365-2966.2008.13603.x
- Pastorello et al. (2015a) Pastorello, A., Wyrzykowski, Ł., Valenti, S., et al. 2015a, MNRAS, 449, 1941, doi: 10.1093/mnras/stu2621
- Pastorello et al. (2015b) Pastorello, A., Benetti, S., Brown, P. J., et al. 2015b, MNRAS, 449, 1921, doi: 10.1093/mnras/stu2745
- Pastorello et al. (2015c) Pastorello, A., Hadjiyska, E., Rabinowitz, D., et al. 2015c, MNRAS, 449, 1954, doi: 10.1093/mnras/stv335
- Pastorello et al. (2015d) Pastorello, A., Prieto, J. L., Elias-Rosa, N., et al. 2015d, MNRAS, 453, 3649, doi: 10.1093/mnras/stv1812
- Pastorello et al. (2015e) Pastorello, A., Tartaglia, L., Elias-Rosa, N., et al. 2015e, MNRAS, 454, 4293, doi: 10.1093/mnras/stv2256
- Pastorello et al. (2016) Pastorello, A., Wang, X. F., Ciabattari, F., et al. 2016, MNRAS, 456, 853, doi: 10.1093/mnras/stv2634
- Pastorello et al. (2021) Pastorello, A., Vogl, C., Taubenberger, S., et al. 2021, Transient Name Server AstroNote, 71, 1
- Pellegrino et al. (2021) Pellegrino, C., Howell, D. A., Vinkó, J., et al. 2021, arXiv e-prints, arXiv:2110.15370. https://arxiv.org/abs/2110.15370
- Perley et al. (2022) Perley, D. A., Sollerman, J., Schulze, S., et al. 2022, ApJ, 927, 180, doi: 10.3847/1538-4357/ac478e
- Poznanski et al. (2012) Poznanski, D., Prochaska, J. X., & Bloom, J. S. 2012, MNRAS, 426, 1465, doi: 10.1111/j.1365-2966.2012.21796.x
- Prentice et al. (2016) Prentice, S. J., Mazzali, P. A., Pian, E., et al. 2016, MNRAS, 458, 2973, doi: 10.1093/mnras/stw299
- Prentice et al. (2019) Prentice, S. J., Ashall, C., James, P. A., et al. 2019, MNRAS, 485, 1559, doi: 10.1093/mnras/sty3399
- Pursiainen et al. (2018) Pursiainen, M., Childress, M., Smith, M., et al. 2018, MNRAS, 481, 894, doi: 10.1093/mnras/sty2309
- Sanders et al. (2013) Sanders, N. E., Soderberg, A. M., Foley, R. J., et al. 2013, ApJ, 769, 39, doi: 10.1088/0004-637X/769/1/39
- Schlafly & Finkbeiner (2011) Schlafly, E. F., & Finkbeiner, D. P. 2011, ApJ, 737, 103, doi: 10.1088/0004-637X/737/2/103
- Schlegel (1990) Schlegel, E. M. 1990, MNRAS, 244, 269
- Shivvers et al. (2016) Shivvers, I., Zheng, W. K., Mauerhan, J., et al. 2016, MNRAS, 461, 3057, doi: 10.1093/mnras/stw1528
- Silverman et al. (2010) Silverman, J. M., Kleiser, I. K. W., Morton, A. J. L., & Filippenko, A. V. 2010, Central Bureau Electronic Telegrams, 2223, 1
- Smith (2017) Smith, N. 2017, Interacting Supernovae: Types IIn and Ibn, ed. A. W. Alsabti & P. Murdin, 403, doi: 10.1007/978-3-319-21846-5_38
- Smith et al. (2010) Smith, N., Chornock, R., Silverman, J. M., Filippenko, A. V., & Foley, R. J. 2010, ApJ, 709, 856, doi: 10.1088/0004-637X/709/2/856
- Smith et al. (2008) Smith, N., Foley, R. J., & Filippenko, A. V. 2008, ApJ, 680, 568, doi: 10.1086/587860
- Smith & Tombleson (2015) Smith, N., & Tombleson, R. 2015, MNRAS, 447, 598, doi: 10.1093/mnras/stu2430
- Stetson (1987) Stetson, P. B. 1987, PASP, 99, 191, doi: 10.1086/131977
- Stritzinger et al. (2009) Stritzinger, M., Mazzali, P., Phillips, M. M., et al. 2009, ApJ, 696, 713, doi: 10.1088/0004-637X/696/1/713
- Strotjohann et al. (2021) Strotjohann, N. L., Ofek, E. O., Gal-Yam, A., et al. 2021, ApJ, 907, 99, doi: 10.3847/1538-4357/abd032
- Sun et al. (2020) Sun, N.-C., Maund, J. R., Hirai, R., Crowther, P. A., & Podsiadlowski, P. 2020, MNRAS, 491, 6000, doi: 10.1093/mnras/stz3431
- Taddia et al. (2013) Taddia, F., Stritzinger, M. D., Sollerman, J., et al. 2013, A&A, 555, A10, doi: 10.1051/0004-6361/201321180
- Taddia et al. (2018) Taddia, F., Stritzinger, M. D., Bersten, M., et al. 2018, A&A, 609, A136, doi: 10.1051/0004-6361/201730844
- Tampo et al. (2020) Tampo, Y., Tanaka, M., Maeda, K., et al. 2020, ApJ, 894, 27, doi: 10.3847/1538-4357/ab7ccc
- Tody (1986) Tody, D. 1986, in Society of Photo-Optical Instrumentation Engineers (SPIE) Conference Series, Vol. 627, Instrumentation in astronomy VI, ed. D. L. Crawford, 733, doi: 10.1117/12.968154
- Tody (1993) Tody, D. 1993, in Astronomical Society of the Pacific Conference Series, Vol. 52, Astronomical Data Analysis Software and Systems II, ed. R. J. Hanisch, R. J. V. Brissenden, & J. Barnes, 173
- Tominaga et al. (2008) Tominaga, N., Limongi, M., Suzuki, T., et al. 2008, ApJ, 687, 1208, doi: 10.1086/591782
- Valenti et al. (2011) Valenti, S., Fraser, M., Benetti, S., et al. 2011, MNRAS, 416, 3138, doi: 10.1111/j.1365-2966.2011.19262.x
- Valenti et al. (2014) Valenti, S., Sand, D., Pastorello, A., et al. 2014, MNRAS, 438, L101, doi: 10.1093/mnrasl/slt171
- Valenti et al. (2016) Valenti, S., Howell, D. A., Stritzinger, M. D., et al. 2016, MNRAS, 459, 3939, doi: 10.1093/mnras/stw870
- van Loon et al. (2005) van Loon, J. T., Cioni, M. R. L., Zijlstra, A. A., & Loup, C. 2005, A&A, 438, 273, doi: 10.1051/0004-6361:20042555
- Wang & Li (2019) Wang, S.-Q., & Li, L. 2019, arXiv e-prints, arXiv:1905.12623. https://arxiv.org/abs/1905.12623
- Wang et al. (2021) Wang, X., Lin, W., Zhang, J., et al. 2021, ApJ, 917, 97, doi: 10.3847/1538-4357/ac0c17
- Xiang et al. (2021) Xiang, D., Wang, X., Lin, W., et al. 2021, ApJ, 910, 42, doi: 10.3847/1538-4357/abdeba
- Zhang et al. (2019a) Zhang, J., Ye, K., & Wang, X. 2019a, Transient Name Server Classification Report, 2019-2565, 1
- Zhang et al. (2019b) —. 2019b, The Astronomer’s Telegram, 13337, 1