Confirming new changing–look AGNs discovered through optical variability using a random-forest based light curve classifier
Abstract
Determining the frequency and duration of changing–look (CL) active galactic nuclei (AGNs) phenomena, where the optical broad emission lines appear or disappear, is crucial to understand the evolution of the accretion flow around supermassive black holes. We present a strategy to select new CL candidates starting from a spectroscopic type 2 AGNs sample and searching for current type 1 photometric variability. We use the publicly available Zwicky Transient Facility (ZTF) alert stream and the Automatic Learning for the Rapid Classification of Events (ALeRCE) light curve classifier to produce a list of CL candidates with a highly automated algorithm, resulting in 60 candidates. Visual inspection reduced the sample to 30. We performed new spectroscopic observations of six candidates of our clean sample, without further refinement, finding the appearance of clear broad Balmer lines in four of them and tentative evidence of type changes in the remaining two, which suggests a promising success rate of per cent for this CL selection method.
keywords:
galaxies: active – accretion, accretion discs – (galaxies:) quasars: emission lines1 Introduction
One remarkable property of active galactic nuclei (AGNs) is their variability, which is seen in
a wide range of the electromagnetic spectrum. Of particular interest among AGNs with extreme
variability are the changing-look (CL) AGNs, which display an appearance or disappearance of their
optical broad emission lines (BELs) on time scales from months to years. Since the broad line
region (BLR) is photoionized by the UV/optical continuum from the accretion disc (e.g. see the review by Netzer, 2015)
dramatic variations in this waveband often occur simultaneously with the
appearance/disappearance of the BELs, with a time-lag that is consistent with expectations from reverberation mapping studies (i.e light-days to light-weeks, Trakhtenbrot
et al., 2019). In the Unification Model (UM, e.g. Antonucci, 1993), AGNs can be classified as type 1 or type 2 depending on the orientation of the system. Type 1 refers to AGNs whose nuclei are visible, while in type 2 AGNs a dusty structure (i.e., the torus) is expected to obscure a direct view to the accretion disc and the BLR, resulting in the absence of the disc’s blue continuum and of the BELs in the spectrum. This configuration also hides the intrinsic variability of the disc emission, so the optical flux in classical type 2 AGNs should be constant (Sánchez
et al., 2017). However, the existence of CL AGNs challenges the UM, as the presence of BELs should be determined by the inclination of the source, which cannot change drastically in a few year’s timescales.
The origin of the CL phenomenon in the optical range is still unclear, but nearly all observational tests have now disfavoured transient dust obscuration (as in CL AGNs in the X–ray range) or nuclear tidal disruption events (TDEs) as the source of most of the observed fading/brightening of the BELs and continuum emission (LaMassa
et al., 2015; Runnoe
et al., 2016; MacLeod
et al., 2016, 2019; Hutsemékers
et al., 2017, 2019). Interestingly, these sources could be suffering dramatic changes intrinsic to the accretion flow, in a way similar to what we observe when X ray–binaries (XRB) go into outburst (e.g. Homan &
Belloni, 2005). In this scenario, the CL AGN would make a spectral transition to/from an extreme UV bright accretion disc to a hot inner flow, which would produce a change in the BELs as a consequence of the changing shape of the ionizing spectrum. Recently, several studies have found evidence that supports the accretion state change as the physical origin of the CL phenomenon, although the observed time scale for this phenomenon is much shorter than expected if it was analogous to XRB outbursts. On the contrary, the events occur on thermal time scales, which has been associated with cooling/heating fronts propagating through the disc (Noda &
Done, 2018; Parker
et al., 2019; Graham
et al., 2020; Sniegowska et al., 2020). Thus, if type 2 CL AGNs change their type due to a change in the accretion state, they must belong to the unobscured, true type 2 AGN population (see Tran, 2001, and references therein).
In recent years, 200 CL AGNs have been successfully identified with a variety of methods, starting with blind searches of BELs variability by comparing archival optical spectra from different epochs (Yang et al., 2018; Green et al., 2022). However, most of the CL AGNs have been confirmed via follow-up spectroscopy of candidates that had experienced great variations in any of their properties: in the optical flux (Yang et al., 2018; Frederick et al., 2019; MacLeod et al., 2019), in the color (Hon et al., 2021), and/or in the optical and mid-IR photometric variability (Graham et al., 2020). These studies have shown the CL phenomenon is extremely rare. In a blind search for CL AGNs, Yang et al. (2018) found that just 19 out of 330795 (the 0.006 per cent) galaxies with repeated spectroscopy in the SDSS and/or LAMOST are CL AGNs. From an initial sample of 1.1 millions quasars, Graham et al. (2020) identified 47451 candidates that met specific optical and mid-IR photometric variability requirements, and found that 111 of them had significant spectral changes (the 15 per cent of their final sample with second epoch spectra). Since the origin of this variability is consistent with a change of state of activity and is not necessarily associated with a change in the optical type but in the flux of the BELs, these sources are called "changing-state" quasars. From this and previous works that include variability criteria to find new CL AGNs (Yang et al., 2018; Sánchez-Sáez et al., 2021b), it is clear that a diversity of phenomena can lead to extreme optical variations that are not associated with significant spectroscopic changes, and other observables are required to investigate further this behaviour.
Optimising the method to find new CL candidates will help to improve the statistics on the frequency and duration of this phenomenon. With the advent of real time, deep, large sky-coverage monitoring surveys as the Zwicky Transient Facility (ZTF, Bellm et al., 2019) it is possible now, for the first time, to obtain a census of the rate of these changes (Sánchez-Sáez et al., 2021b). Here, we find new CL using the machine learning classifications provided by the Automatic Learning for the Rapid Classification of Events (ALeRCE, Förster et al., 2021) broker, which allows us to select a sample of 60 candidates that transitioned from type 2 to type 1 AGNs. To test our selection technique, we performed spectroscopic follow-up for six candidates, finding clear evidence of the appearance of BELs for at least four of them. Throughout this work, we assume a standard cosmological model with H0 = 70 km s-1 Mpc-1, = 0.3, and = 0.7.
2 Selection of the sample
Our selection strategy is based on variability considerations: if an AGN shows rapid and strong optical variations we could have a direct view of its accretion disc and also of the BLR– if it exists. Therefore, current type 1 variability seen in a spectrally-classified type 2 AGN could mean that the AGN changed type since its spectrum was taken.
In this work we used the current variability-based, publicly available classifications provided by the ALeRCE light curve classifier tool (LCC, Sánchez-Sáez et al., 2021a). The LCC uses a hierarchical imbalanced Random Forest classifier, fed with variability features computed from ZTF light curves and colors obtained from AllWISE and ZTF photometry, to classify each source with ZTF alerts into 15 subclasses, including variable stars, transient events, and three classes of AGNs (host-dominated or AGN, core-dominated or QSO, and Blazar). The LCC is able to separate QSO, Blazar and AGN from other stochastic sources with a 99 percent success rate. For the classification of AGN-like sources, the most relevant features are the ZTF/ALLWISE colors, features related to the amplitude of the variability at different timescales, and features related to the timescale of the variability.
In particular, the ZTF produces alerts of all sufficiently variable objects (5 variation in the template-subtracted images). Only 10 per cent of known type 1 AGNs with mag show alerts in the ZTF because the typical variability of these objects is too small to reach this threshold. Therefore, if former type 2 AGNs with current type 1 variability behave in the same way as the rest of the type 1 population, we only expect to detect 10 per cent of the CLs in the sample with these data and method.
Our initial sample consists of 42027 AGNs that were classified as type 2 in the Million Quasars Catalog (MILLIQUAS,Version 7.1, N and K types, Flesch, 2021) or the Veron Catalog of Quasars & AGN (VERONCAT, 13th Edition, S2 and Q2 types, Véron-Cetty & Véron, 2010). From these, we discarded sources that have been classified as Seyfert I, Low Ionization Nuclear Emission Region (LINER) or Blazar in any other study according to the SIMBAD Astronomical Database, and those without public "GALAXY" or "QSO" spectra in the SDSS database, nor subclassified as BROADLINE, which led to 22380 sources.
To find strong CL candidates, we performed a sky crossmatch within 1 arcsec between our type 2 sample and the sources reported by the ZTF alerts that were classified primarily as AGN or QSO according to the ALeRCE LCC, which led to 60 sources (see Table 1). Of these, 30 possible misclassifications arise from a visual examination of the optical light curves and the SDSS spectra, so the further cleaning of the sample will be addressed in a forthcoming paper.
This selection method results in a sample of 60 CL candidates that show a type 1-like variability in the ZTF light curve, but that were previously classified as type 2 by the absence of significant BELs in their spectra. We note that we are searching for AGNs that changed from a type 2 to a type 1 classification according to their optical spectral lines only, so the selection is not biased towards obscured/unobscured AGNs. In order to test and refine this selection method, the next step is to confirm the sample spectroscopically by quantifying the change of the BELs.
| ZTF ID | Ra(deg) | Dec(deg) | z | Ndet | Prob. |
|---|---|---|---|---|---|
| ZTF18aaiescp | 207.212824 | 57.646811 | 0.13 | 14 | 0.81 |
| ZTF18aaihyhz | 216.756184 | 48.109091 | 0.04 | 36 | 0.63 |
| ZTF18aaiwdzt | 199.483614 | 49.258656 | 0.09 | 11 | 0.61 |
| ZTF18aaoudgg | 221.975974 | 28.556699 | 0.16 | 653 | 0.95 |
| ZTF18aaqftos | 180.955088 | 60.888197 | 0.07 | 345 | 0.41 |
3 Spectroscopic follow-up
3.1 Observations and data reduction
With the aim of evaluating the selection method, we were allocated one night by the Chilean Time Allocation Committee (CNTAC) to observe a sample of five CL candidates with the Goodman High Throughput Spectrograph (GTHS) at the SOAR-4.1m telescope. The spectra were observed on November 2nd, 2021, using the red camera with the 400 lines/mm grating and the M2 filter (500–905 nm), a slit width of 1 arcsec, in normal readout and binning of 2x2. The total exposure time was 1h per source, divided in 3 different observations of 20 min each. On the other hand, we were also allocated observing time with FORS2-VLT at the UT1 Cassegrain focus to monitor a CL AGN event in real time. Since this AGN belongs to the same sample of candidates presented, we include here the first spectrum of the monitoring series, noting that the following spectra also contain significant BELs. The spectrum was taken on November 11th, 2021, with GRIS300V+10 (GC435 filter), 1 arcsec slit, MIT red-optimized CCD, 100kHz 2x2 high readout mode. We took two different exposures of 12.5 min each. For the SOAR/GTHS sources, we used the master bias and flats produced by the SOAR pipeline111https://github.com/soar-telescope/goodman_pipeline, and the wavelength and flux calibration was obtained using the standard IRAF routines. In the case of the UT1/FORS2 object, we used the ESOReflex pipeline (Freudling et al., 2013). Both sets of observations were corrected by telluric bands using the spectrum of the standard star and the telluric task from IRAF. The spectra were corrected by redshift using the information from the SDSS database. The details of the observations are reported in Table 2.
ZTF ID SDSS name z epoch SNR5100c EWc EWc Hα/OIIIc log MBH Å Å yrs ZTF19abixawba SDSS J001014.86+000820.7 0.1022 new 33 47.0 5.8 10.10.5 21.17 8.0 0.2 0.0130.007 old 14 8 / 2.30.5 ZTF20abshfkfa SDSS J011311.82+013542.4 0.2375 new 24 1332 29 1 5.80.4 6.13 8.00.1 0.030.01 old 18 7 0+2 0.2 0.2 ZTF18accdhxvb SDSS J075544.35+192336.3 0.1083 new 91 90 15 5.10.4 17.02 8.50.1 0.0050.001 old 20 21 11 0.970.08 ZTF19aalxuyoa SDSS J081240.76+071528.5 0.0849 new 36 54 41 9.80.3 17.64 7.760.04 0.0270.005 old 27 2.2 / 0.30.2 ZTF19aaxdiuia SDSS J214046.03+091631.7 0.4030 new 17 – 41 – 11.08 – – old 17 – / – ZTF18abtizzea SDSS J215055.73-010654.1 0.0879 new 24 13 / 0.420.05 17.39 7.40.2 0.0050.003 old 11 3 / 0.10.1
3.2 Spectral analysis
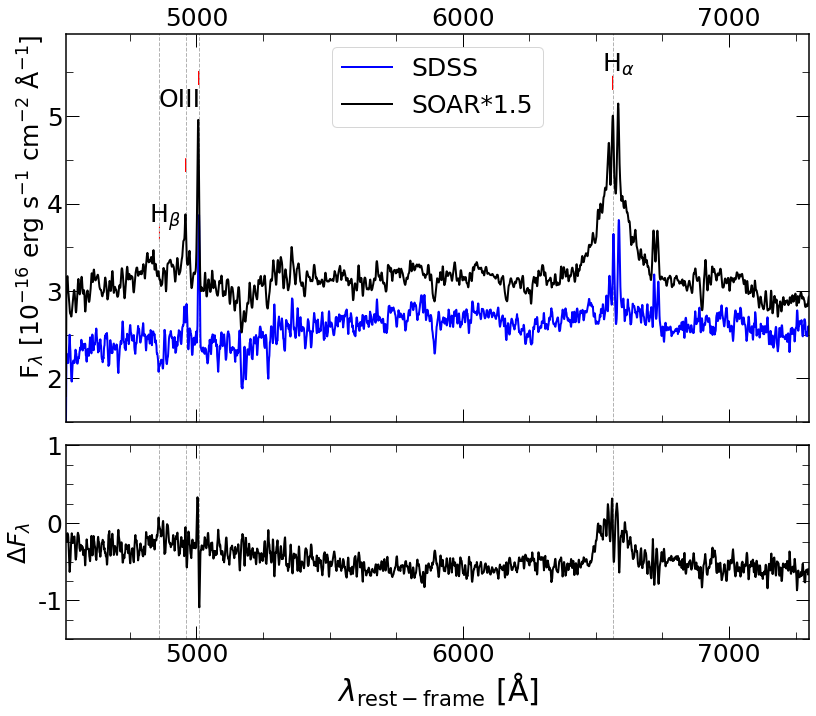
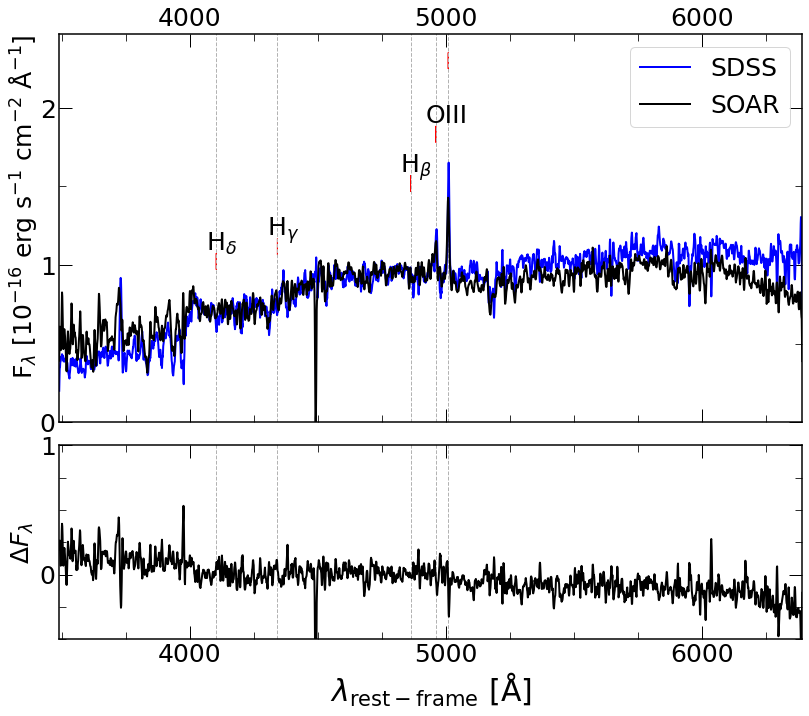
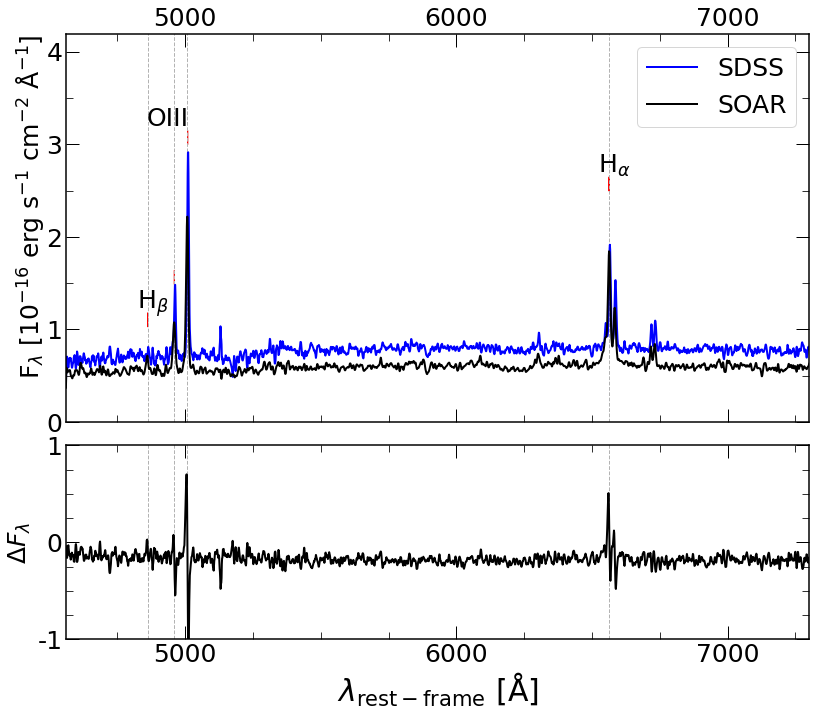
We analysed the new SOAR/GTHS and UT1/FORS2 observations and the archival SDSS spectra to compare the strength of the BELs in different epochs. In Figure 1 we present the plots of the average flux and difference spectra of the six CL candidates observed. It can be seen that ZTF19abixawb, ZTF20abshfkf, ZTF19aalxuyo and ZTF18accdhxv show a clear change both in the continuum and in the Hα and Hβ BELs. To quantify the changes of the emission lines, we fitted the spectra using the Penalized Pixel-Fitting (pPXF) software (Cappellari, 2017). The SDSS spectra were fitted using the MILES library (Vazdekis et al., 2010) for the stellar pseudocontinuum component, a set of power law models for the accretion disc contribution and two components for the emission lines, one with both permitted and forbidden lines to model the narrow emission and one just with the permitted lines to model the BELs. The second epoch spectra were fitted with the same components, using the stellar populations models from the best-fit to the SDSS spectra. To account for the fitting errors a total of 50 Monte Carlo simulations were performed for each spectrum using the residual of the best-fit to generate random noise. This noise was then added to the original spectrum and fitted with the same procedure. The errors reported for the EW in Table 2 correspond to the 10 and 90 percentiles of the simulations results.
For the sources with broad Hα emission, we estimated the black hole masses (MBH) and continuum luminosity at 5100 Å () following the approach outlined in Reines
et al. (2013), using the FWHM and luminosity of broad Hα obtained from the new spectra. With these values, we computed the current Eddington ratios , where erg s-1 is the Eddington luminosity and is the bolometric luminosity defined as according to Netzer (2019). The results of the spectral fitting and the derived physical quantities are shown in Table 2.
 |
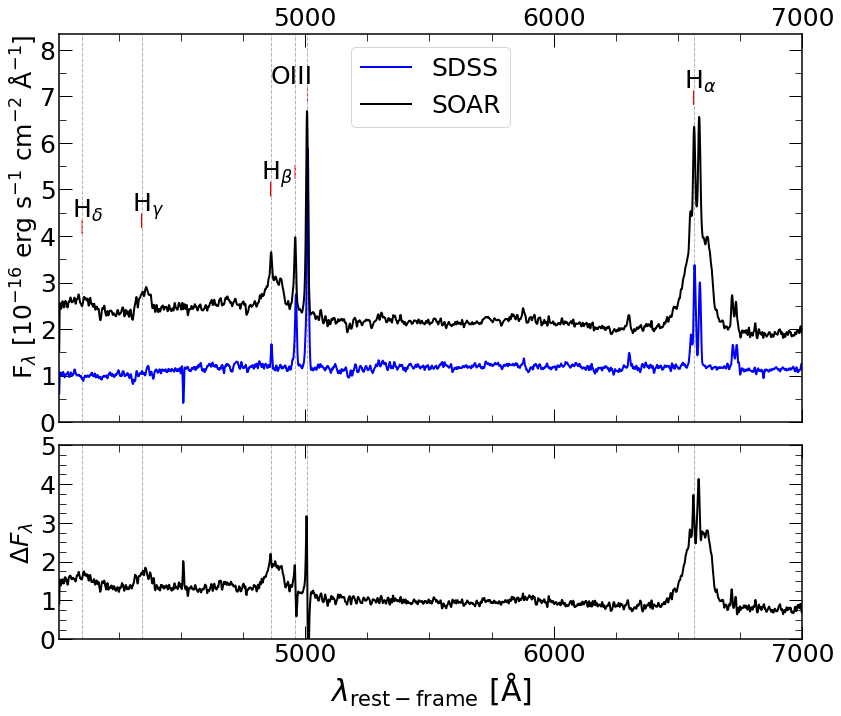 |
| (a)ZTF19abixawb | (b)ZTF20abshfkf |
 |
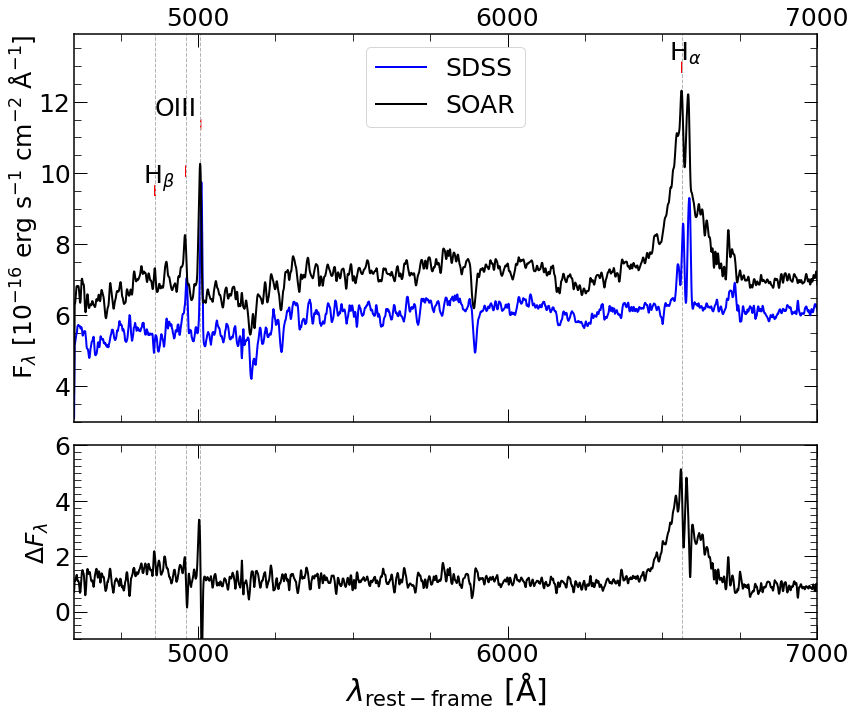 |
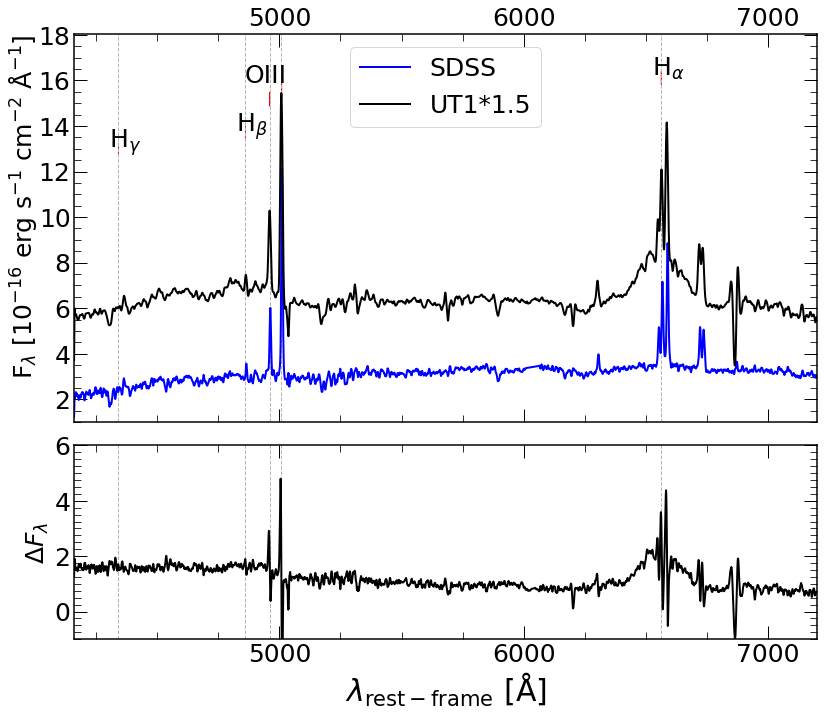
| (c)ZTF18accdhxv | (d)ZTF19aalxuyo |
 |
 |
| (e)ZTF19aaxdiui | (f)ZTF18abtizze |
4 Discussion
The selection of our CL candidates sample is based on current type 1 optical variability reported by the ZTF and previous type 2 spectral classification. Thus, this method leads to sources that showed very weak or absent BELs and now behave as normal type 1 AGNs, with obvious BELs in their optical spectra. Our sample is similar to the CL AGNs identified by comparing repeated spectroscopy as in Yang et al. (2018), and differs from the changing-state AGNs in that the latter usually refer to changes in the flux of existent BELs. Our method results in 60 CL candidates, from which half appear to be misclassified based on visual inspection of their spectra and light curves, leading to a list of 30 promising CL candidates. Here we confirm a significant spectral change (a change in the EW of Hα and Hβ) in four out of the six sources that we re-observed, which were chosen from our list of promising candidates based on observability considerations (i.e. that were observable on the same night we had been allocated). Despite the small size of this sub-sample, our first results suggest a success rate (SR) that is comparable to the 70 per cent SR reported in Hon et al. (2021), which is the most successful search method for CL AGNs to date in comparison to previous works with variability selection criteria (15-35 per cent, e.g. Yang et al., 2018; MacLeod et al., 2019).
With the results of this work, we can also make a lower limit estimate of the frequency of type 2 to type 1 transitions. There are 29943 type 2 sources (BroadType N or K in MILLIQUAS) that can be detected by the ZTF alert stream (dec-28 deg and r 21 mag). From these, 158 are classified as QSO or AGN by the LCC. As pointed out in Section 2, we need to take into consideration misclasifications in the parent sample, which could reach 30-50 per cent. This high probability comes from the fact that we are searching for oddities, so the frequency of misclassifications, which is overall small, matches the frequency of real candidates, which is also very small. Considering 50 per cent misclassifications and a minimum success rate of 2/3 (as found in this work) for spectra separated by an average of 15 years, we estimate a fraction of 0.18 per cent of type 2 AGN turning into type 1 per 15 years, or 0.01 per cent per year, that could be detected with this method. This number must be corrected by the percentage of sources that actually are variable enough to generate ZTF alerts (10 per cent for known type 1 AGNs), leading to a lower estimate of 0.12 per cent type 2 sources changing into type 1 per year (1.8 per cent in 15 years). This lower limit is similar to the value reported by Hon et al. (2021), who found a minimum turn-on CL AGN rate of 3 per cent over 15 yr.
Our results indicate that the sources in this work are currently accreting at a few per cent LEdd, which is close to the value for the state transitions observed in XRB, and suggests an accretion state change as the origin of the CL phenomena in these sources (Noda & Done, 2018; Ross et al., 2018; Hutsemékers et al., 2019; Graham et al., 2020; Guolo et al., 2021). In these transitions, the soft/hard accretion states are caused by pronounced changes in the accretion disc contribution to the total radiative output. According to the latest AGN accretion-oriented diagrams, the soft state in AGNs would include broad-line Seyferts, showing highly excited gas and radio-quiet cores consistent with disc-dominated nuclei, while most true Seyfert 2 nuclei and the bright LINERs would show low excitation at high accretion luminosities and could be identified with the bright hard and intermediate states (Fernández-Ontiveros & Muñoz-Darias, 2021). Here, our preliminary fits to the optical spectra suggest a significant increase of 40-70 per cent in the AGN component for ZTF19abixawb and ZTF20abshfkf, in agreement with the scenario where our sources transitioned from true type 2 AGNs, with some or negligible contribution from a cold accretion disc, to type 1 disc dominated sources. Incidentally, the light curves of these sources show persistent stochastic variations as typical type 1 AGNs, whereas the other two confirmed CLs, ZTF19aalxuyo and ZTF18accdhxv, show an increasing optical flux consistent with a transition to a disc dominated state. Independently of the AGN continuum contribution (that can be very uncertain), the HOIII ratios of the four CL AGNs are now between 5 and 30 times larger than in the archival spectra (see Table 2), which most likely reveals the change in the ionising flux. On the contrary, the two candidates that were not confirmed as CL show a strong declining trend over the last 2-3 years before the new spectra were taken. This suggests that we could have missed the transitions from true type 2 to type 1 and again to type 2. In fact, preliminary fits to the light curve of ZTF18abtizze point to a TDE as the origin of the optical variations, but further analysis is required to better understand the nature of this source. We note that for the other not-confirmed CL AGN, ZTF19aaxdiui, Hα falls out of the observed wavelength range, but the EW is the same as for the CL ZTF19aalxuyo (which displays very significant changes in Hα). Therefore, we cannot rule out this source is actually a CL AGN.
5 Summary and conclusions
We have selected a sample of 60 CL AGNs candidates that were classified spectroscopically as type 2, but currently show significant photometric variations according to the ALeRCE LCC. To test our selection criteria, we re-observed six of these sources with SOAR and VLT telescopes. By comparing these and archival SDSS observations we find that at least four of the sources have experienced a significant () increase in the emission of their Balmer BELs, which implies a promising success rate of per cent. Our spectral fits suggest the CL AGNs are currently accreting at a few per cent LEdd, which is consistent with an accretion state change as the origin of the CL phenomena in these sources. To the best of our knowledge, this is the first time the ALeRCE broker LCC has been used to select new potential CL AGNs candidates, and we are currently re-observing the full promising CL sample to refine the statistics on the frequency of type 2 to type 1 transitions, which will be presented in a forthcoming paper. In future work, we will improve the completeness of the candidate list by characterising light curves that use all available epochs of ZTF instead of only using the ZTF alert stream. This will include more of the lower-variability AGNs, which comprise 90 per cent of known type 1 sources.
Acknowledgements
We acknowledge financial support from ANID Becas 21200718 and 21212344 (ELN, SB), Millenium Nucleus NCN TITANS (PA, MLMA), ICN12009 MAS (LHG), FONDECYT Nº 3200250 and 1201748 (PSS, PL). ELN acknowledges Caltech for its hospitality. Based on observations collected at the European Southern Observatory under ESO programme 108.22BA.001, at the Southern Astrophysical Research telescope under CNTAC programme CN2021B-16, and with the Samuel Oschin Telescope 48-inch and the 60-inch Telescope at the Palomar Observatory as part of the ZTF project.
Data Availability
The SDSS data underlying this article were accessed from SDSS DR16 (http://skyserver.sdss.org/dr16). The UT1/FORS2 and SOAR/GTHS data underlying this article will be shared on reasonable request to the corresponding author.
References
- Antonucci (1993) Antonucci R., 1993, ARA&A, 31, 473
- Bellm et al. (2019) Bellm E. C., et al., 2019, PASP, 131, 018002
- Cappellari (2017) Cappellari M., 2017, MNRAS, 466, 798
- Fernández-Ontiveros & Muñoz-Darias (2021) Fernández-Ontiveros J. A., Muñoz-Darias T., 2021, MNRAS, 504, 5726
- Flesch (2021) Flesch E. W., 2021, arXiv e-prints, p. arXiv:2105.12985
- Förster et al. (2021) Förster F., et al., 2021, AJ, 161, 242
- Frederick et al. (2019) Frederick S., et al., 2019, ApJ, 883, 31
- Freudling et al. (2013) Freudling W., Romaniello M., Bramich D. M., Ballester P., Forchi V., García-Dabló C. E., Moehler S., Neeser M. J., 2013, A&A, 559, A96
- Graham et al. (2020) Graham M. J., et al., 2020, MNRAS, 491, 4925
- Green et al. (2022) Green P. J., et al., 2022, arXiv e-prints, p. arXiv:2201.09123
- Guolo et al. (2021) Guolo M., Ruschel-Dutra D., Grupe D., Peterson B. M., Storchi-Bergmann T., Schimoia J., Nemmen R., Robinson A., 2021, MNRAS, 508, 144
- Homan & Belloni (2005) Homan J., Belloni T., 2005, Ap&SS, 300, 107
- Hon et al. (2021) Hon W. J., Wolf C., Onken C. A., Webster R., Auchettl K., 2021, MNRAS, 511, 54
- Hutsemékers et al. (2017) Hutsemékers D., Agís González B., Sluse D., Ramos Almeida C., Acosta Pulido J. A., 2017, A&A, 604, L3
- Hutsemékers et al. (2019) Hutsemékers D., Agís González B., Marin F., Sluse D., Ramos Almeida C., Acosta Pulido J. A., 2019, A&A, 625, A54
- LaMassa et al. (2015) LaMassa S. M., et al., 2015, ApJ, 800, 144
- MacLeod et al. (2016) MacLeod C. L., et al., 2016, MNRAS, 457, 389
- MacLeod et al. (2019) MacLeod C. L., et al., 2019, ApJ, 874, 8
- Netzer (2015) Netzer H., 2015, ARA&A, 53, 365
- Netzer (2019) Netzer H., 2019, MNRAS, 488, 5185
- Noda & Done (2018) Noda H., Done C., 2018, MNRAS, 480, 3898
- Parker et al. (2019) Parker M. L., et al., 2019, MNRAS, 483, L88
- Reines et al. (2013) Reines A. E., Greene J. E., Geha M., 2013, ApJ, 775, 116
- Ross et al. (2018) Ross N. P., et al., 2018, MNRAS, 480, 4468
- Runnoe et al. (2016) Runnoe J. C., et al., 2016, MNRAS, 455, 1691
- Sánchez-Sáez et al. (2021a) Sánchez-Sáez P., et al., 2021a, AJ, 161, 141
- Sánchez-Sáez et al. (2021b) Sánchez-Sáez P., et al., 2021b, AJ, 162, 206
- Sánchez et al. (2017) Sánchez P., et al., 2017, ApJ, 849, 110
- Sniegowska et al. (2020) Sniegowska M., Czerny B., Bon E., Bon N., 2020, A&A, 641, A167
- Trakhtenbrot et al. (2019) Trakhtenbrot B., et al., 2019, ApJ, 883, 94
- Tran (2001) Tran H. D., 2001, ApJ, 554, L19
- Vazdekis et al. (2010) Vazdekis A., Sánchez-Blázquez P., Falcón-Barroso J., Cenarro A. J., Beasley M. A., Cardiel N., Gorgas J., Peletier R. F., 2010, MNRAS, 404, 1639
- Véron-Cetty & Véron (2010) Véron-Cetty M. P., Véron P., 2010, A&A, 518, A10
- Yang et al. (2018) Yang Q., et al., 2018, ApJ, 862, 109