a) These authors contributed equally to this work.
Electron-spin spectral diffusion in an erbium doped crystal at millikelvin temperatures
Abstract
Erbium-doped crystals offer a versatile platform for hybrid quantum devices because they combine magnetically-sensitive electron-spin transitions with telecom-wavelength optical transitions. At the high doping concentrations necessary for many quantum applications, however, strong magnetic interactions of the electron-spin bath lead to excess spectral diffusion and rapid decoherence. Here we lithographically fabricate a 4.4 GHz superconducting planar micro-resonator on a crystal doped with Er ions at a concentration of twenty parts per million relative to Ca. Using the microwave resonator, we characterize the spectral diffusion processes that limit the electron-spin coherence of Er ions at millikelvin temperatures by applying 2- and 3-pulse echo sequences. The coherence time shows a strong temperature dependence, reaching 1.3 ms at 23 mK for an electron-spin transition of .
I Introduction
Rare earth ion doped materials cooled to liquid helium temperatures have demonstrated long coherence times [1, 2, 3, 4] and large efficiencies for quantum memory demonstrations in the optical domain [5, 6, 7]. Recently, interest in these materials has extended to sub-Kelvin temperatures and sub-Tesla fields, where the electron-spin transitions of Kramers (odd-electron) rare-earth ions achieve gigahertz frequencies while exceeding the energy of the thermal bath. This interest is motivated by the prospect of ensemble-based microwave-to-optical conversion [8, 9] and microwave quantum memories [10, 11], both of which require long electron-spin coherence times and sufficient concentration for high-fidelity operation. Previous demonstrations of ensemble-based microwave quantum memories required concentrations of electron-spins between one and one hundred parts per million (ppm) to achieve storage efficiencies of order [12, 13, 14].
Several rare-earth doped materials have also demonstrated millisecond-scale electron-spin coherence [15, 16] and hybridised electron-nuclear-spin coherence [17, 18] with these applications in mind. Amongst these proposed materials, erbium doped calcium tungstate () has emerged as a leading candidate due to its telecom-wavelength optical transition and 20 ms coherence both predicted [19, 20] and measured [19] on a magnetically-sensitive electron-spin transition. This demonstration of long coherence was attributed to a millikelvin spin-bath temperature combined with an ultra-low Er doping concentration of just 0.7 ppb, yielding a regime in which the weak magnetic interaction with the 183W nuclear-spin bath dictated the electron-spin decoherence rate.
At higher doping concentrations that are required for quantum applications, however, the strong magnetic interactions between the electron-spins of erbium ions are expected to induce faster decoherence due to spectral diffusion (SD) [21]. Here we use pulsed electron spin resonance (ESR) spectroscopy to investigate SD in 20 ppm Er doped in the millikelvin temperature regime. Moreover, we demonstrate a two-pulse echo coherence time of 1.3 ms for an electron-spin transition of Er at 4.4 GHz and determine that this coherence is limited by unwanted paramagnetic impurities, indicating that could be suitable for quantum information processing applications requiring large optical or microwave absorption.
II Structure of
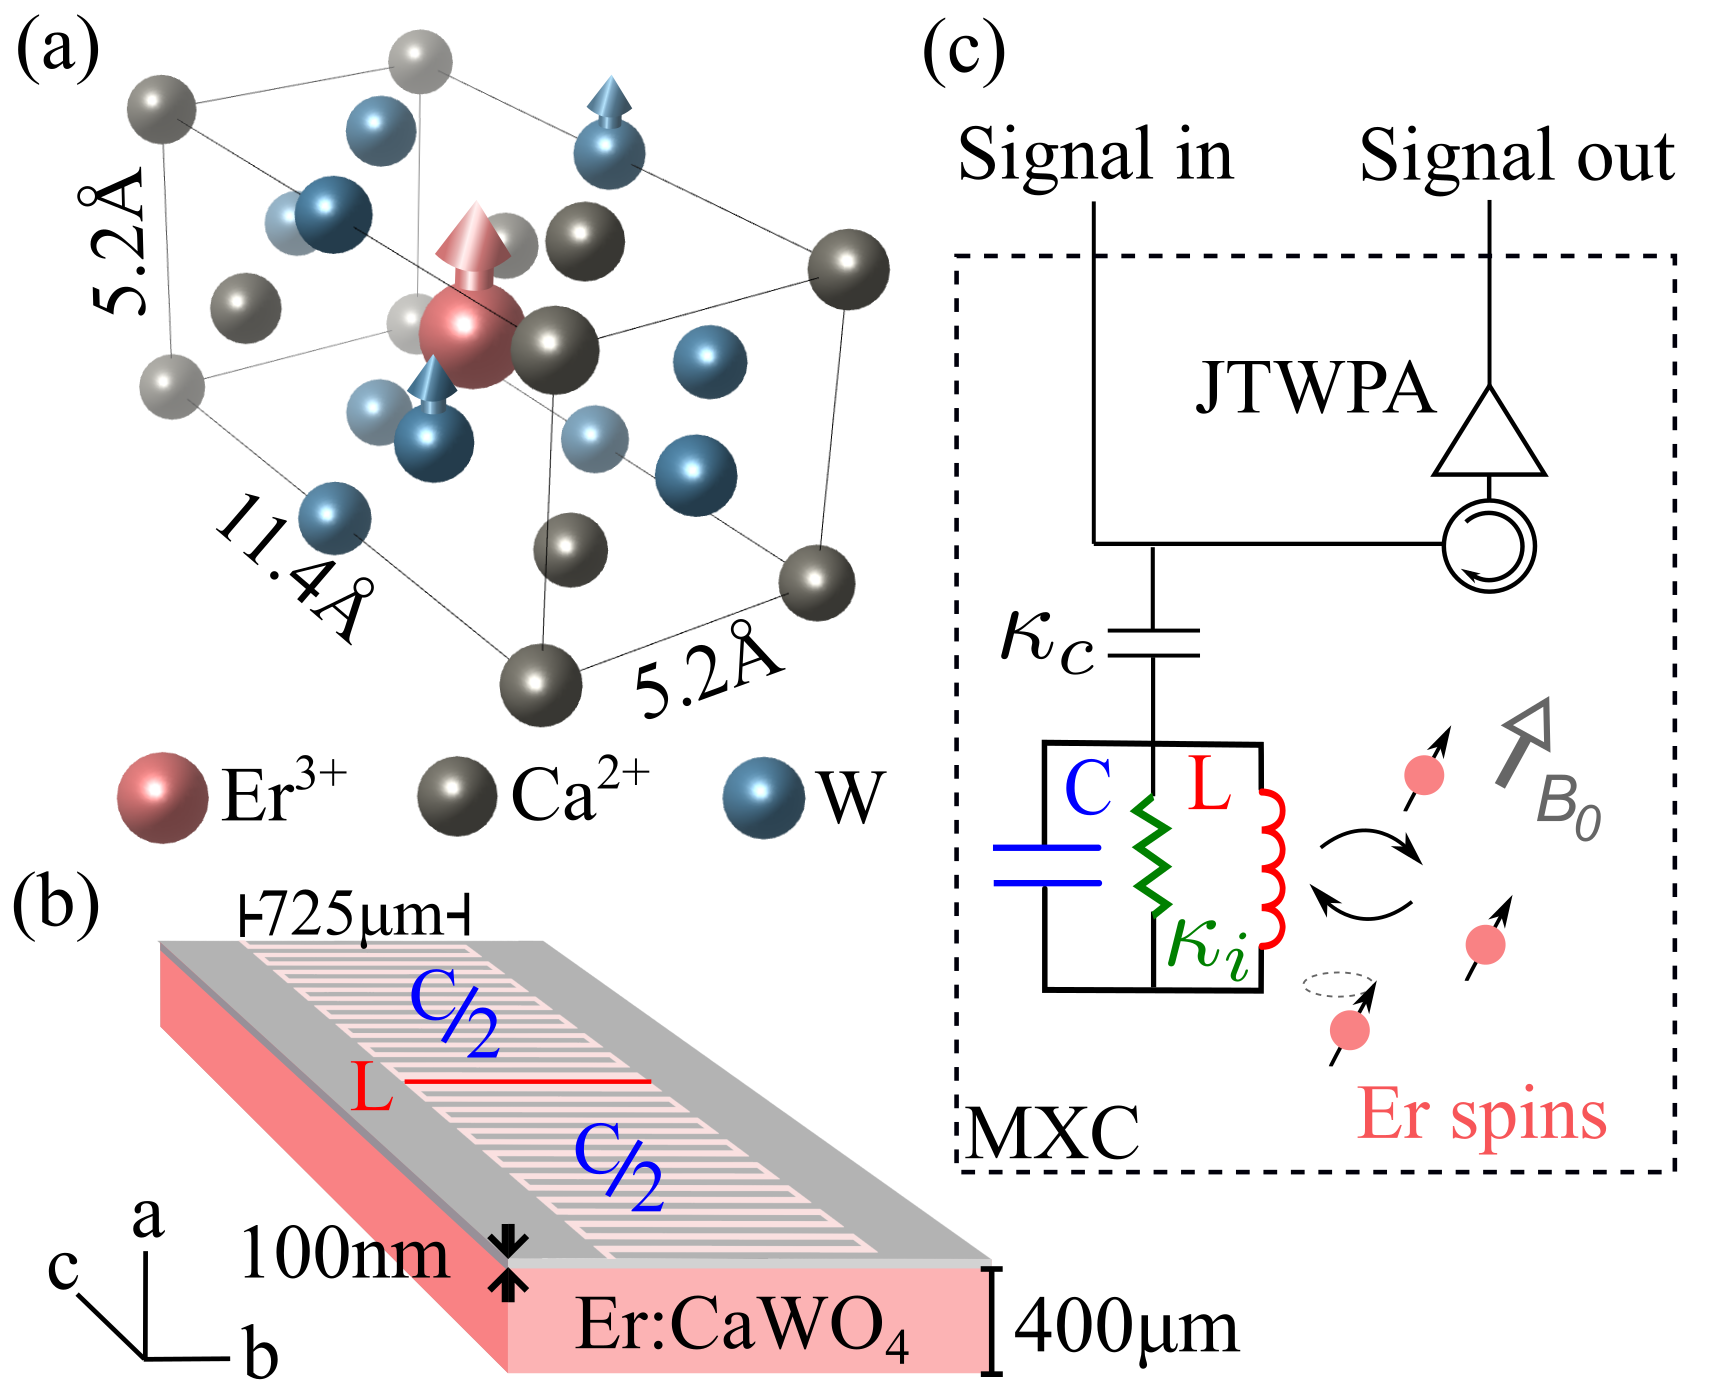
Calcium tungstate is an optically-transparent crystal with tetragonal unit cell structure (space-group ) and orthogonal crystal axes . An illustration of the unit cell structure is presented in Figure 1a, which has dimensions Å parallel the crystal axes. Crystals grown with a natural abundance of isotopes exhibit an intrinsically low level of magnetic noise, originating almost exclusively from the nuclear spins of the 183W isotope. This isotope has a natural abundance of 14 and a nuclear spin-half moment with a relatively small gyromagnetic ratio of MHz/T. For this reason is considered one of the best candidate hosts for quantum information processing amongst thousands of known materials [20, 22].
In the crystalline matrix, the ions substitutionally replace ions with additional long-range charge compensation [23]. The electrostatic interaction between the Er ions and the matrix lifts the 16-fold degeneracy of the electronic ground state of trivalent erbium, leading to eight pairs of degenerate electronic sub-levels known as Kramers doublets. Each doublet forms an effective spin-1/2 system and only the lowest energy Kramers doublet is populated at millikelvin temperatures. In the presence of an applied magnetic field , this effective electron-spin shows a strongly anisotropic Zeeman effect, characterized by the Hamiltonian:
Here is the Bohr-magneton and is the g-tensor whose symmetry mirrors the tetragonal point-group symmetry of the crystal electric-field at the location of the Er ion [24].
Additionally, 23 % of Er ions belong to the isotope which has non-zero nuclear-spin . For this subset of ions the magnetic-hyperfine interaction is parameterised by the hyperfine -tensor and therefore an additional term is required in the effective-spin Hamiltonian:
Note that we have neglected the weak magnetic-nuclear and nuclear-quadrupole interactions in the spin-Hamiltonian [25] because the additional precision awarded by these terms is not required to describe the processes studied here. Meanwhile, the -tensor once again reflects the symmetry of the matrix with MHz, MHz and the Hamiltonian yields a total of 16 energy levels. The energy level diagrams of both and are presented in the lower panel of Figure 2 for small magnetic fields applied perpendicular to the crystal -axis.
III Experimental Setup
For these measurements we use an ESR spectrometer comprised of a thin-film superconducting resonator and Josephson Traveling Wave Parametric Amplifier (JTWPA) [26]. Such spectrometers have been described in detail in refs [27, 28] and achieve sensitivities as high as for detecting two-pulse (Hahn) echoes originating from donors in silicon at mK temperatures [13]. This high sensitivity is due to the very low output noise, which is dominated by quantum fluctuations of the microwave field with little contribution from thermal photons at millikelvin temperatures. A 3D perspective representation of the sample studied here is shown in Fig. 1 (b). The circuit is etched into a 100 nm Nb layer sputtered directly on the surface of the crystal, which was grown by Scientific Materials Corp. and has dimensions mm parallel to the axes of the crystal. The superconducting LC resonator comprises 15 interdigitated fingers (the capacitor) on either side of the 725 m 5 m wire (the inductor).
The frequency of the fundamental resonator mode is = 4.37 GHz in the absence of a magnetic field, with a quality factor . The resonator is determined by the coupling rate to the measurement line and the internal energy loss rate . For these experiments a DC magnetic field is applied parallel to the sample surface in the direction of the inductance wire (the crystal -axis). Precision alignment of the magnetic field with respect to the crystal surface is important for minimising the internal loss rate because field penetration into the superconducting thin-film generates magnetic vortices; a well-known microwave loss channel [29].
To achieve this precision alignment, the sample is enclosed within a small copper box and mounted onto two copper-beryllium actuators from Attocube, comprising a goniometer and rotator. These are inserted into a set of two Helmholtz coils, and thermally anchored to the mixing chamber (MXC) of a dilution refrigerator. While the actuators precisely orient the sample with respect to the applied magnetic field, they also create a weak thermal bridge due to the separation of metallic components by their piezo-electric elements and therefore additional copper-braiding is used between the sample-box and MXC assembly to maintain good thermal conductivity.
Erbium electron-spin transitions are excited with microwave signals sent from a heavily attenuated ( 50 dB) input line. The transmitted microwave signal, together with the signal emitted by the spin ensemble, is then amplified by the JTWPA (see Fig. 1b). Further microwave amplification takes place at 4K using a high electron mobility transistor (HEMT) and at room temperature using low-noise semiconductor amplifiers.
IV ESR spectroscopy
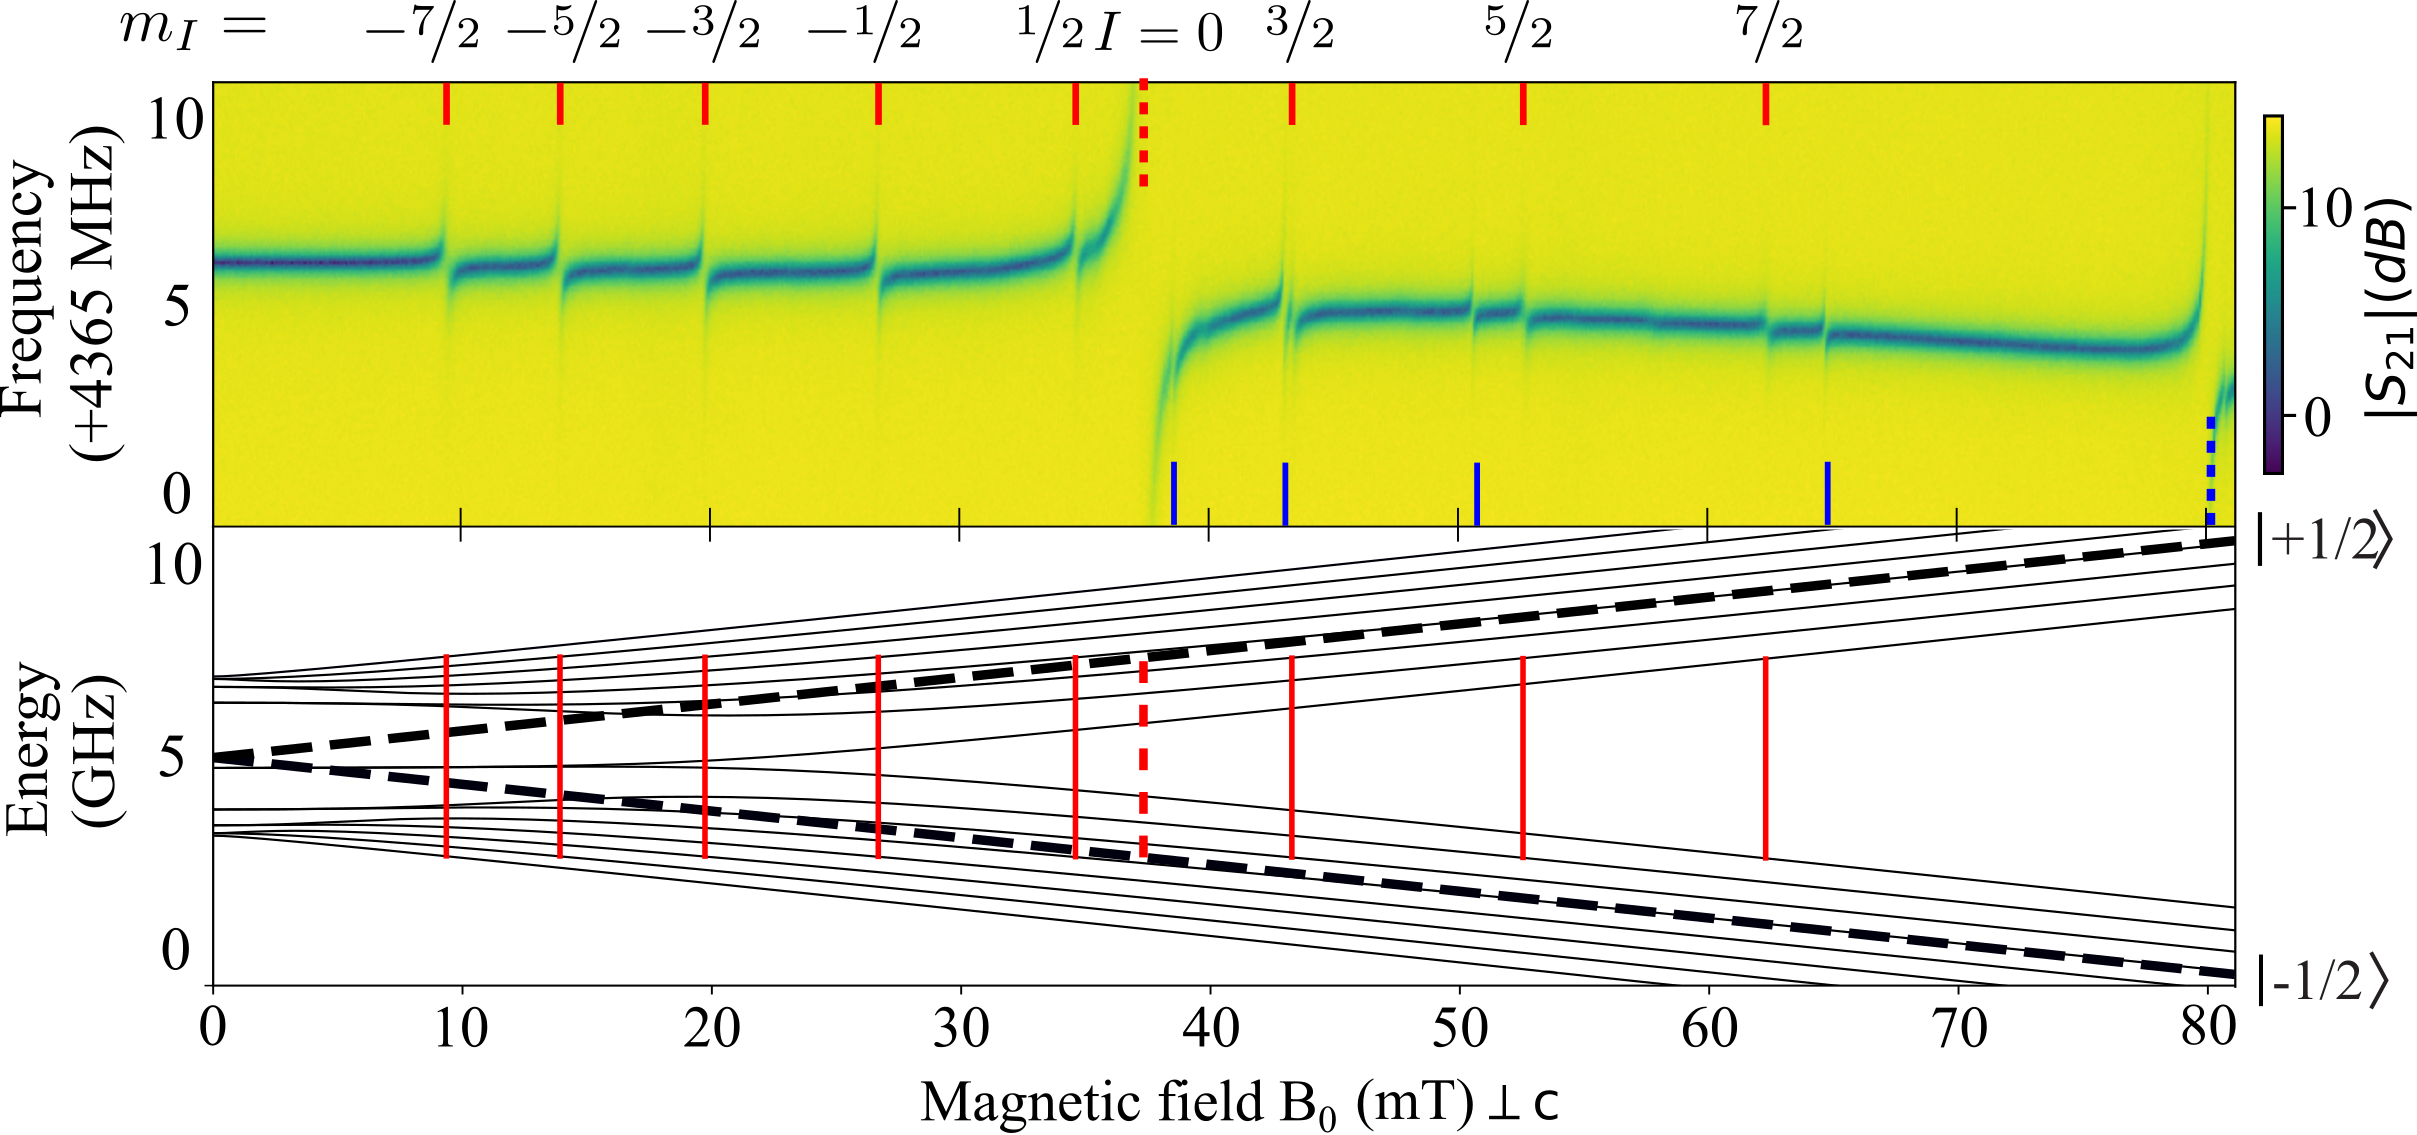
This crystal demonstrates a rich ESR spectrum due to the existence of several Er isotopes in natural abundance. Shown in Figure 2, the microwave transmission spectrum is measured as a function of magnetic field applied along the crystal -axis. Note that this spectrum was recorded at an elevated temperature of 100 mK in order to populate all the hyperfine levels of .
As stated previously, however, most isotopes of Er have no nuclear spin and the largest anti-crossing at 37 mT is associated with the high concentration of erbium isotopes; predominantly , and . Here the cooperativity between the resonator and the spin-ensemble is large due to the high spin density. Unfortunately, this high density of spins also gives rise to large instantaneous diffusion (ID), making it difficult to measure SD using the transition (see Sup. Mat. Section I). To avoid this technical limitation, we instead focus on the low-density isotope, which exhibits 16 hyperfine levels. The ESR-allowed transitions between these levels are labelled in Fig. 2 according to their nuclear-spin projection . The 8 corresponding solid red lines indicate the values of for which the ESR frequencies of are equal to , both experimentally (Fig. 2 Top) and theoretically (Fig. 2 Bottom). Avoided level crossings are observed in the spectrum at these field values, which is consistent with high-cooperativity between the resonator and each transition [30, 31]. Additionally, the five avoided level crossings observed in the spectrum above 38 mT are attributed to Yb impurities. The large anti-crossing at 80 mT is attributed to the Yb isotopes, comprising of all the even-numbered isotopes between and .
V Spectral Diffusion Model
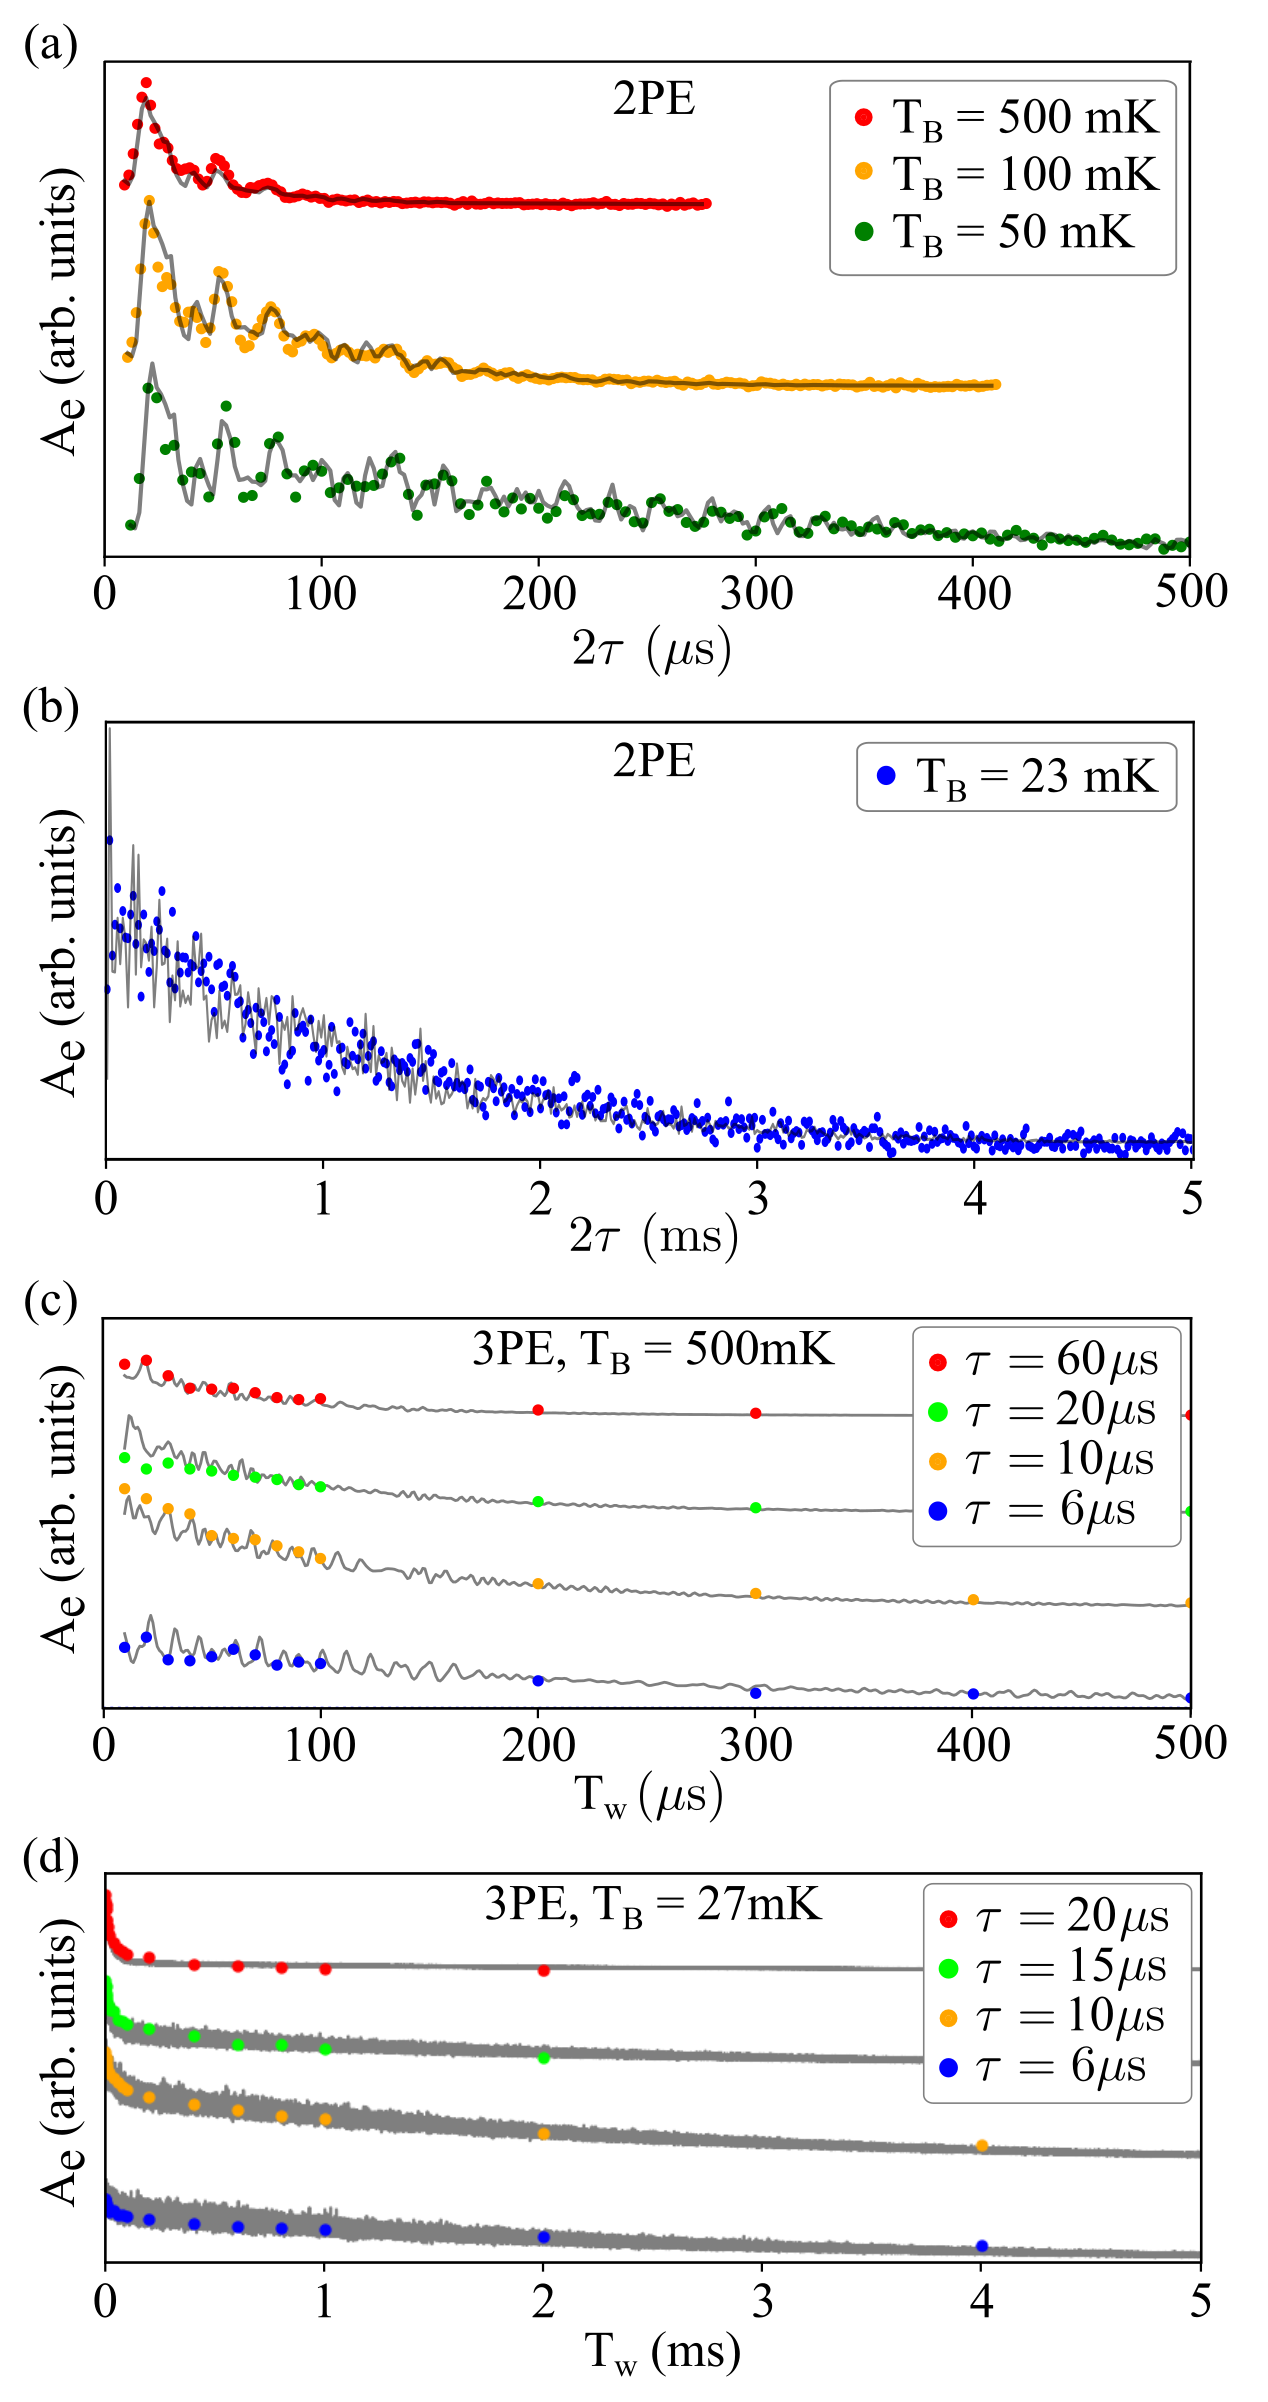
We use both two-pulse echoes (2PE) and three-pulse echoes (3PE) to elucidate the dynamic interactions which cause SD within the spin-ensemble of the isotope. Here the 2PE consists of a -pulse followed by a -pulse at time delay , while the 3PE consist of three pulses with separations and between pulses 1-2 and 2-3, respectively. The 2PE and 3PE data yield complementary information, and were first used in the 1960’s by Mims, Nasau and McGee to study SD of paramagnetic rare-earth-ion impurities [32].
Since then, the theory of spectral diffusion has evolved considerably, and here we fit the 2PE and 3PE data using the uncorrelated-sudden-jump model first described by Hu and Hartmann in 1974 [33]. This model is known to yield accurate fits of optical 2PE and 3PE data in rare-earth-ion doped materials [34] and relies on four key assumptions:
1) The subset of the transition under investigation (the excited spins) are sufficiently isolated from each other such that they do not contribute to SD.
2) SD is instead caused exclusively by the magnetic dipole interaction with other denser baths of perturbing spins.
3) These perturbing spins are randomly located within the crystal matrix and exhibit only two energy configurations. i.e: a Spin-1/2 system
4) Spin-flips within the baths of perturbing spins are uncorrelated and so each flip is treated independently. To describe explicitly this model of SD we utilise the formalism first introduced by Bai and Fayer [35] and later summarised by Bottger et. al. in a single equation suitable for both 2P- and 3P-echoes [34]. From this model, we derive a similar echo amplitude decay as a function of the inter-pulse delays, extended to account for several species S of perturbating spins:
| (1) | ||||
| (2) |
Here represents the limiting echo amplitude at zero delay and corresponds to the Electron Spin Echo Envelope Modulation (ESEEM) caused by the magnetic dipole-dipole interaction of the Er electron-spins and the proximal nuclear-spins. This is a well defined temporal modulation that depends only on the orientation and magnitude of the applied magnetic field, and has already been determined experimentally for the electron-spin transition studied here [36].
Meanwhile, the decaying component of the echo signal contains the coefficients , , and . The coefficient represents decoherence processes which occur on faster timescales than the measurement and instantaneous diffusion (ID) caused by the microwave excitation pulses. This is equivalent to the homogeneous linewidth of a single spin transition in the absence of spectral diffusion. Conversely, and describe the spectral diffusion which occurs during the delays and due to spin species . More specifically, represents the average spin-flip rate and is the full-width-half-maximum (FWHM) contribution to the dynamic distribution of transition frequencies within the sub-ensemble.
Indeed, any paramagnetic species or ESR transition that exhibits ppm or higher concentration can contribute significant amounts of spectral diffusion, and therefore it is important to identify all paramagnetic impurities in the material and determine their concentration. Initially, this was attempted via magnetic-rotation-spectroscopy (Sup. Mat. Section II) combined with numerical spin-resonator coupling estimates (Sup. Mat. Section III) which identified both and impurities.
However, our quantum-limited spectrometer was not able to detect paramagnetic impurities with small g-factors or long spin-lattice relaxation rates due to the limited magnetic field (400 mT) and temperature (600 mK). Thus a piece of the boule was submitted for inductively-coupled-plasma mass-spectrometry (ICP-MS) analysis and the results are presented in Table 1 [37].
Mass-spectrometry allowed for the concentration of the previously-identified Er, Yb and Mn impurities to be determined with high precision and three additional rare-earth-ion impurities were also identified in the crystal at lower concentrations.
| Element | Mn | Ce | Nd | Gd | Er | Yb |
|---|---|---|---|---|---|---|
| Conc. | 0.542 | 0.424 | 0.211 | 0.066 | 13.292 | 8.516 |
| Conc. (ppm) | 2.840 | 0.871 | 0.421 | 0.120 | 22.88 | 14.17 |
The two ESR transitions with the greatest absorption; the Er and Yb transitions, were thereby included in the SD analysis. For each transition (i.e: species) , the linewidth is proportional to the number of spins which can undergo spin-flip, and the expected temperature dependence is described by Boltzmann statistics [34]:
| (3) |
where is the Boltzmann constant, is the electron-spin bath temperature and is the g-factor of the electron-spin transition in the direction of the applied field . The constant is the maximum dynamic linewidth contribution from species . In the high-temperature limit approaches asymptotically, as the spin-down and spin-up populations of species equalize and the magnetic-dipole interaction with the sub-ensemble is maximised. Meanwhile, is the associated rate of spin-flips (the sum of upward and and downward spin-flips) which is also temperature dependent and has two contributions for the studied temperature range. The first is due to the spin flip-flops, which follows the same temperature dependence as in Eq. 3. The second is the spin-lattice (phonon) interaction resonant with the spin-transition frequency , yielding the following equation [34, 38]:
| (4) | ||||
Here and represent scaling constants of the flip-flop and spin-lattice interactions respectively, and it is assumed they do not vary between different paramagnetic species in the crystal. Meanwhile, represents the density of species and the FWHM of the inhomogeneously broadened ESR absorption line, which can depend on both the magnitude and direction of the applied magnetic field. Additionally, represents the g-factor in the direction of the applied field, while is the g-factor in the direction orthogonal to the c-axis of the crystal. Note that the flip-flop rate is only sensitive to the components of the g-tensor perpendicular to the direction of the applied field [39]. Here the magnetic field is applied along the -axis of the crystal, so this coupling depends on the spectroscopic splitting factors in the directions of both the a- and c-axes, namely and . As for both erbium and ytterbium, we approximate this angular dependence using only in the expression for the flip-flop rate.
In the limit , the effective linewidth presented in Eq (2) simplifies to . Thus, it is impossible to obtain independent values for and with only 2PE measurements, due to the multiplicative relationship between these two parameters. For this reason 3PE measurements are necessary to obtain an independent fit of and .
VI Ensemble Coupling measurements
To accurately fit the temperature dependence of and it is also important to know the temperature of the electron-spin bath, as this can be higher than the temperature of the mixing chamber due to limited thermal conduction. Here we independently determine as a function of by evaluating the coupling of the sub-ensemble to the resonator at each measured temperature, using a well established complex transmission formula [42]:
| (5) |
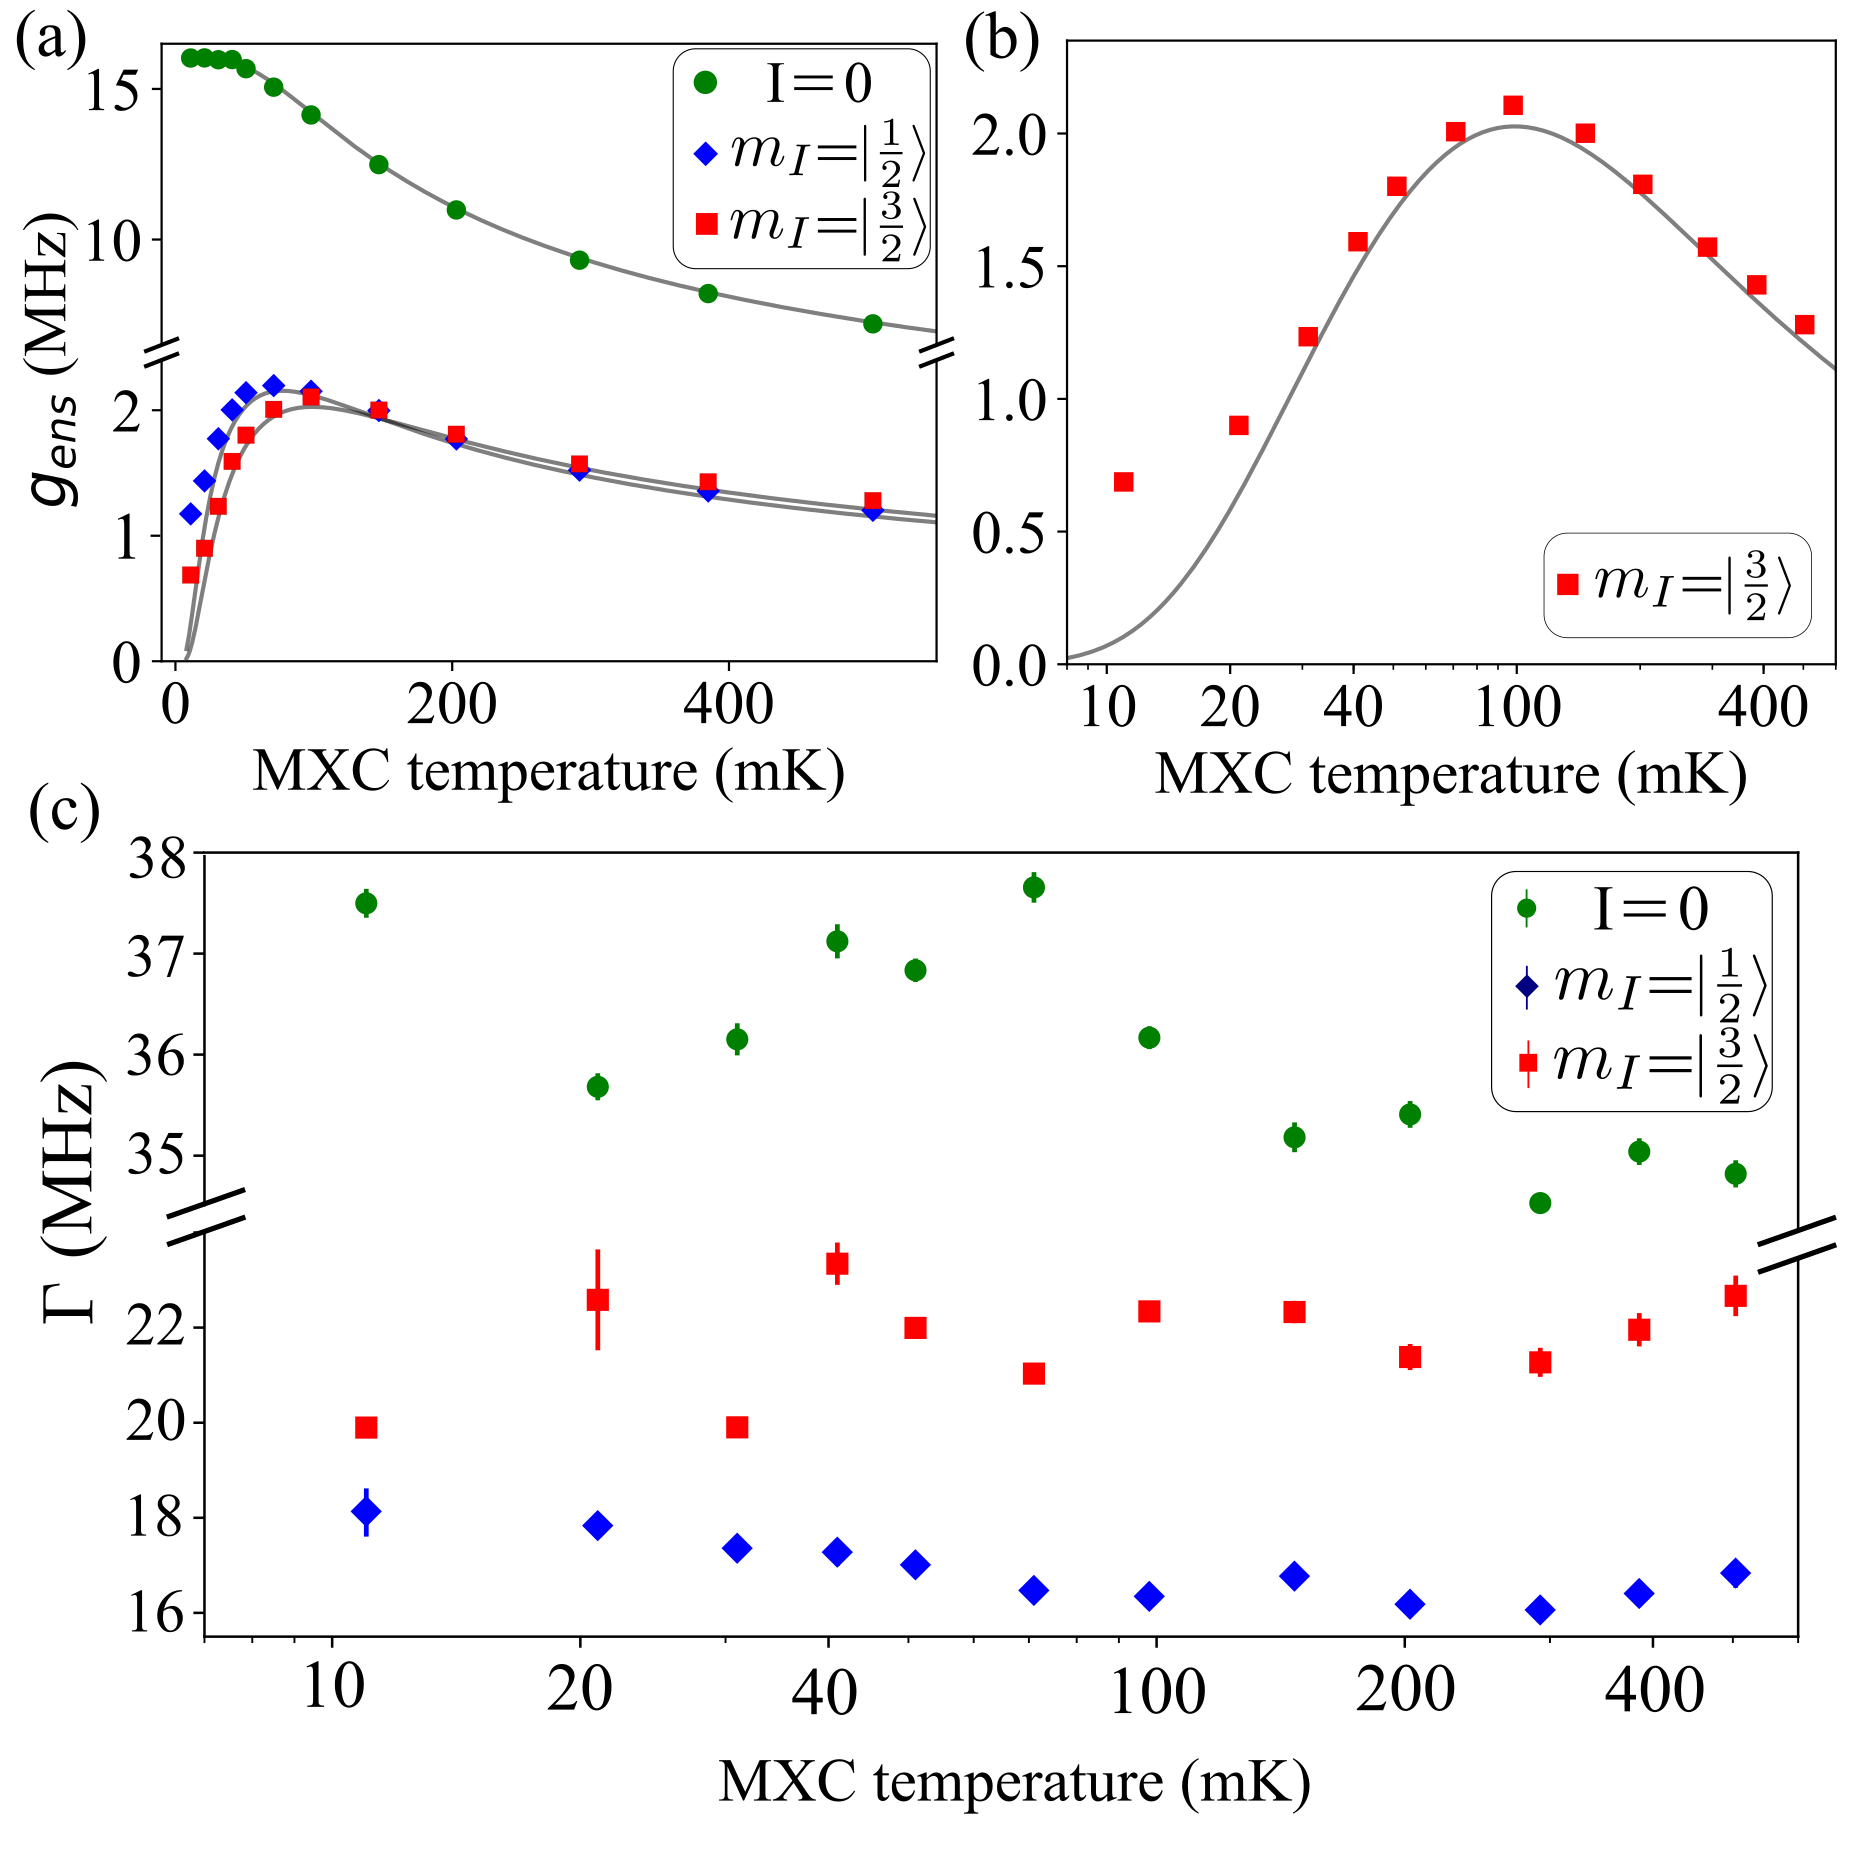
where is the temperature-dependent ensemble coupling between the electron-spin species and the resonator and the other variables are as previously defined. Example fits of and are presented in section III of the supplementary materials for several Er and Yb transitions. Figure 3 presents the results of this fitting as a function of for three of the electron-spin transitions presented in Fig. 2; the , and transitions.
Noting that is proportional to the square-root of the electron-spin polarisation of species [42], we can directly compare the fitted ensemble-coupling at each measured temperature with the expected temperature dependence, assuming the Er electron- and nuclear-spin populations thermalise to according to Boltzmann statistics (refer to Sup. Mat. Section IV for more detail).
Indeed, the solid black lines in Fig. 3a represent a simultaneous fit to for all three transitions. The only free parameter in this fit is the total Er concentration, which yields , equivalent to 18 ppm substitutional doping. This is consistent with the concentration determined by mass-spectrometry (Table 1) which was used for the analysis of the 3PE measurements (Sup. Mat. Section V).
Figure 3b presents an enlarged view of the ensemble-coupling data and fit for the transition. This transition was chosen to probe the spin-temperature below 100 mK because the nuclear-spin distribution of is considerably more sensitive to heating in this temperature region than the electron-spin distribution of the Er isotopes, shown by the green curve in Fig. 3a. Moreover, we assume that this measurement of the hyperfine level temperature of accurately determines the electron-spin bath temperature of all paramagnetic impurities in the sample because of the strong hyperfine coupling between the electronic and nuclear spin of , which keeps both spin baths isothermal. In particular, the fit to the data in Fig. 3b suggests that is well approximated by above 30 mK. Below this MXC temperature, however, we infer that poor thermal conduction combined with some heating at-or-near the location of the sample leads to an elevated bath temperature with mK at = 11 mK and mK when = 21 mK.
Both the excess heating and poor conductivity are likely caused by the piezo-electric actuators that precisely align the sample in the applied magnetic field. The issue of poor thermal conductivity was mentioned previously in Section II and the frictional ‘stick-slip’ mechanism which moves the actuators could potentially be a heat-source even during static (non-moving) operation [43]. This is possible if vibrations from the pulse-tube cooler couple to the loose frictional surfaces within the actuators, which are required for precise displacement. Indeed, thermal excursions up to 100 mK were observed when the actuators are actively displaced using a voltage signal, and this temperature rise is attributed to frictional heating.
VII Echo measurements
As mentioned at the beginning of Section V, 2PE and 3PE measurements were recorded at various spin-bath temperatures to determine the SD parameters and . A selection of these measurements is presented in Figure 4. To accurately determine the echo decay rates, it was necessary to fit the large ESEEM modulation depths observed in Fig. 4a and b. Fortunately, the ESEEM parameters have already been measured and published for the sample and experimental configuration used here [36].
For the 3PE measurements, up-to ten decay curves were taken at five different temperatures as a function of , with fixed ranging from 6 to 96 . These small values of were chosen for the 3PE measurements because they allow for accurate estimates of the rapid SD at higher temperatures. An example set of 3PE curves recorded at 530 mK and 27 mK are presented in sub-figures 4c and 4d, respectively. ESEEM is also present and simulated for the 3PE decay-curves, however, the data was recorded with large -spacings and so the fitted curves in grey show an under-sampling of the modulation.
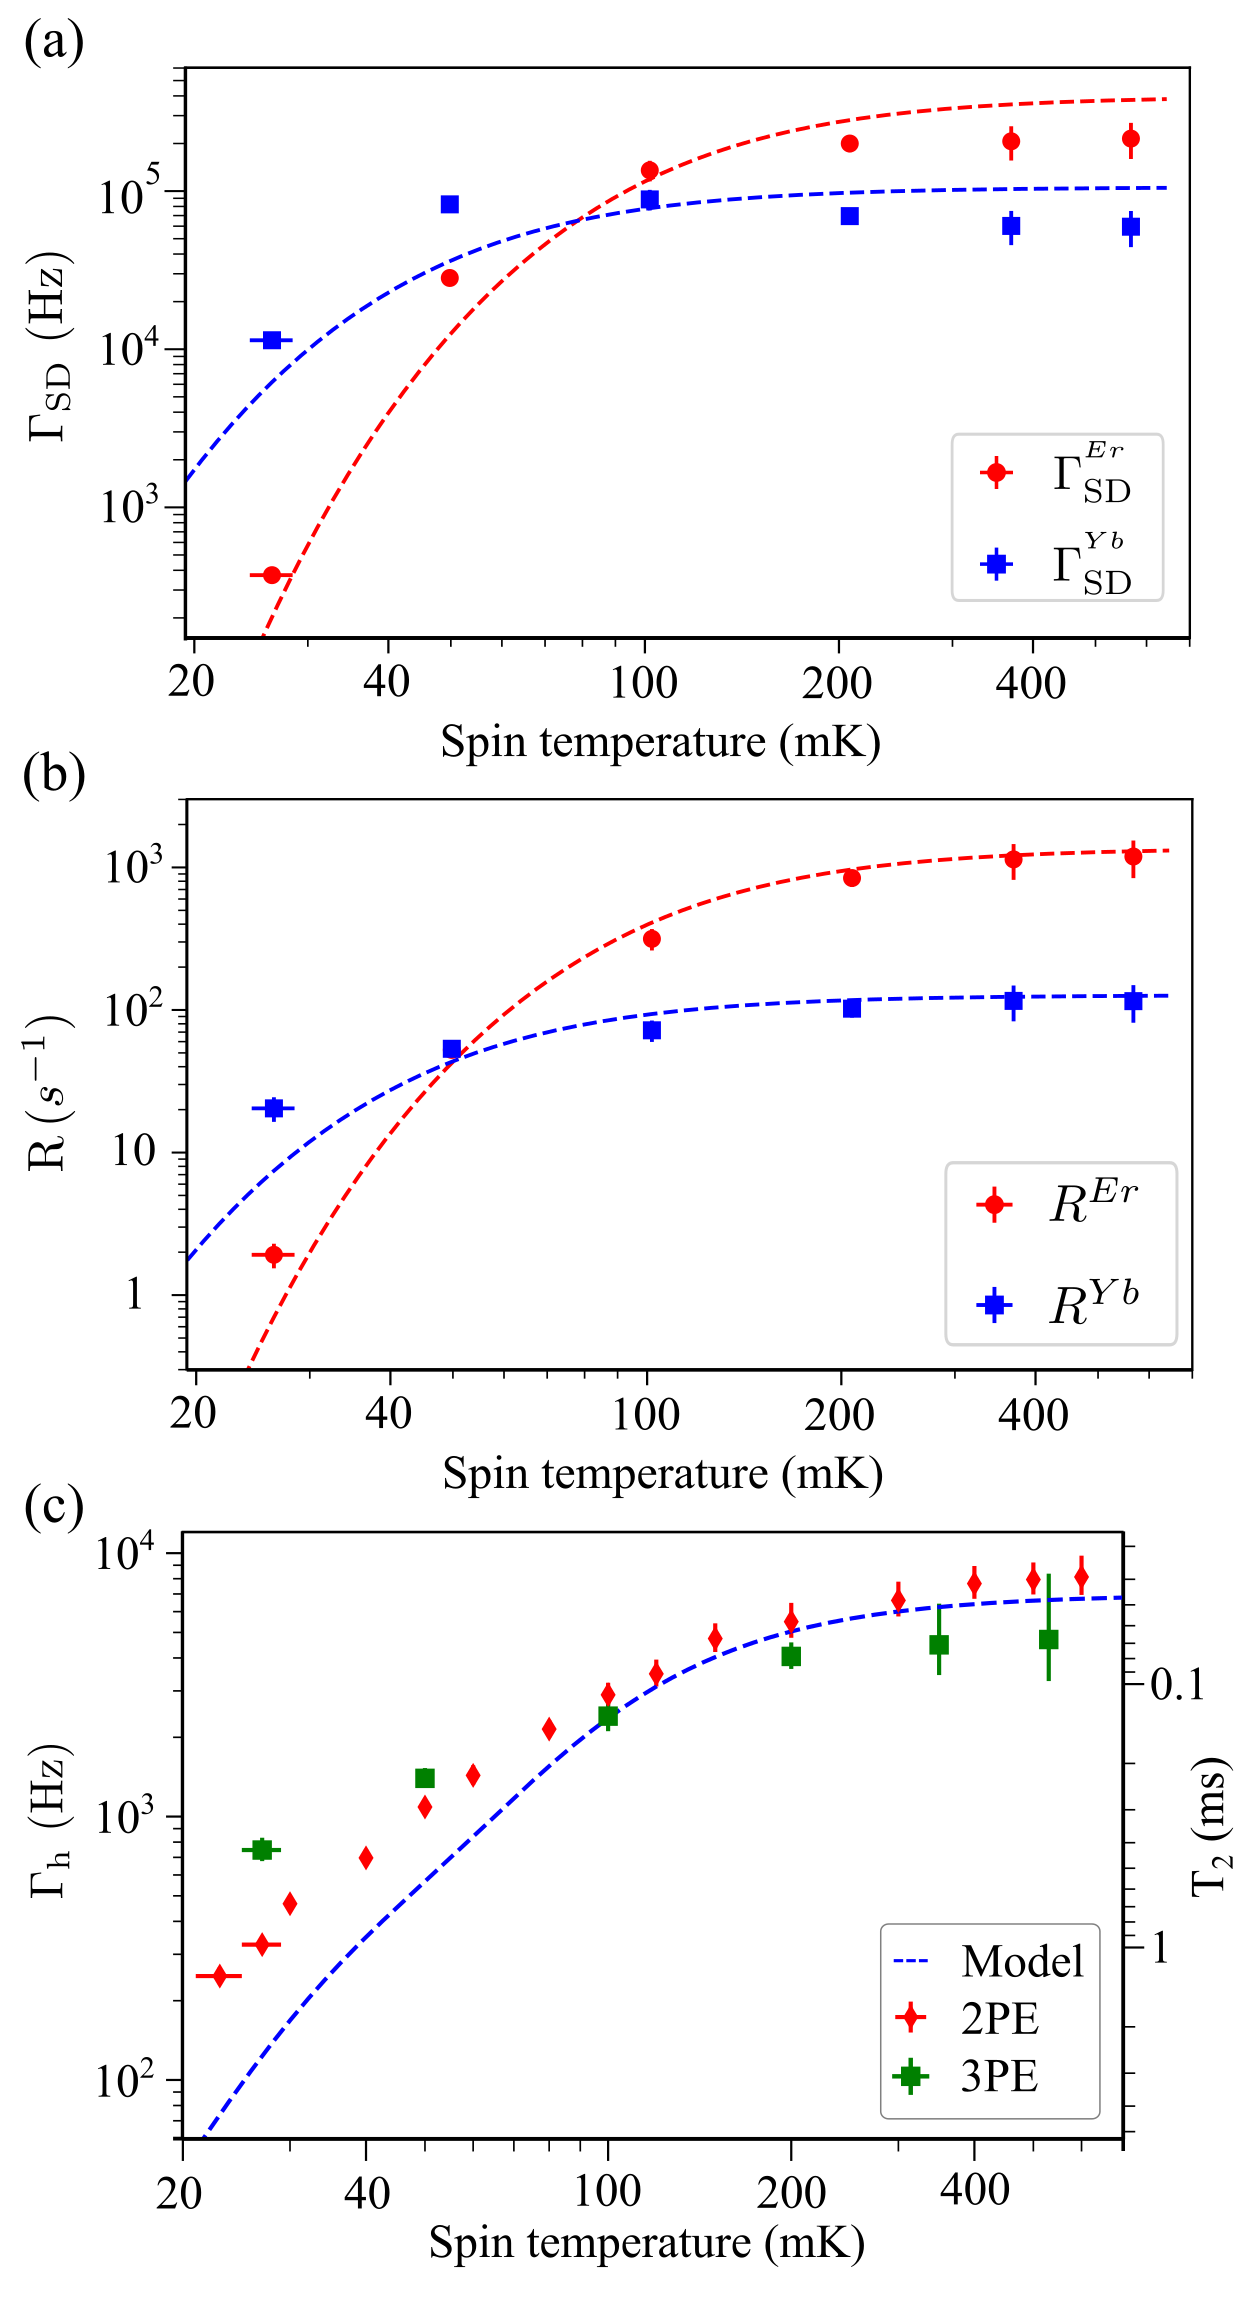
As mentioned previously, we rely on 3PE data to determine and at each measured temperature because 2PE measurements cannot be used to fit these these two parameters independently. For this fitting we also consider only the flip-flop contribution of and the relative concentration of Er and Yb impurities. The result of this fitting is presented in Figures 5a and 5b, and the details of the fitting process are presented in section V of the supplementary materials. For both the 2PE and 3PE measurements it is then possible to define a coherence time
| (6) |
Here and . These two parameters arise from the quadratic exponent presented in Eq. (2) when . For both the 2PE and 3PE measurements, this value of represents the time when the echo has decayed to of its initial amplitude (in the limit for 3PE measurements) and is presented in Fig. 5c.
Above 100 mK the value of inferred from either 2PE or 3PE measurements agree within error. However, they diverge below this temperature due to the difficulty in determining accurately using 3PE measurements when . Instead, the long tail of the -dependent decay visible in Figs. 4c and 4d is sensitive to spectral-diffusion processes that occur on timescales much longer than . For this reason we rely solely on the 2PE fit to determine at the lowest spin-bath temperatures, and we observe a maximum value of ms at mK.
VIII Analysis
Figures 5a and 5b illustrate the large decrease in and with decreasing temperature for both the Er and Yb spins. We attribute this to a reduction in the electron-spin flip-flop rate as a consequence of thermal polarisation of the spin populations. Indeed, our a-priori neglect of spin-lattice contribution in our SD analysis (Sup. Mat. Section V) is justified by the rapid spin-flip rates observed across the studied temperature range. For instance, is orders-of-magnitude greater than the spin-lattice relaxation rate estimated from previous measurements of spin-lattice relaxation in at 7.88 GHz and 500 mK [19], given the scaling presented in Equation 4.
While flip-flops within the Er electronic-spin bath are clearly the dominant source of SD at high temperature, the Yb electron-spins contribute most to SD at mK. This occurs because the Yb spins are less thermally polarised as a consequence of their smaller g-factor, even though the Yb spin-bath is less dense than the Er bath. Moreover, the total experimental contribution to SD from both the Er and Yb spins at the lowest temperature is significantly greater than the expected contribution shown by the dashed-line fits in Figs. 5a & 5b.
This discrepancy is also present in the decoherence-rate model presented in Figure 5c. This model is detailed in Section VI of the supplementary materials and takes into account the expected contribution of the temperature-dependent instantaneous diffusion due to pulse-excitation in addition to the dephasing caused by the 183W nuclear spin bath. Here the instantaneous diffusion contribution is temperature-dependent due to the thermal population density of the hyperfine state. Using the method described in Refs [44, 45] we estimate minimum and maximum contributions of 51 Hz at 23 mK and 630 Hz at 530 mK, respectively. The temperature-independent dephasing caused by the unpolarised 183W nuclear spin bath contributes only 12 Hz; a value derived from the cluster-correlation expansion estimate of determined by Le Dantec et. al. [19] for the Er electron-spin transition in .
The remaining discrepancy can have two possible origins. The first is that the uncorrelated-sudden-jump model presented in Section V makes the incorrect assumption that all spin-flips are uncorrelated in this system. Although this is valid for spin-flips driven predominantly by spin-lattice relaxation, as has been the case in previous applications of this model [34], there is an inherent correlation between spins-flips when they are driven by flip-flops. While the derivation of a ‘correlated-sudden-jump’ model which accounts for this discrepancy is beyond the scope of this work, it would be possible to investigate this issue further by simulating flip-flops of the paramagnetic spin baths using the cluster-correlation expansion approach [46, 47].
The second possibility is that one or more additional electron-spin species are contributing significantly to SD at low temperatures, consistent with the observation of additional impurities in the mass-spectrum (Table I). One likely candidate species is ; the third most abundant impurity in the crystal at a relative concentration of 2.8 ppm. With a g-factor of 2, manganese is weakly polarised at 23 mK and an estimate of the SD contribution were not undertaken here due to the complex electronic level structure in mT fields. [48].
IX Conclusion
Here we demonstrated an electron-spin coherence time exceeding 1 millisecond in 20 ppm doped , achieved by cooling the electronic spin bath to 23 mK and thereby significantly reducing the electron-spin flip-flop rate of both the Er and Yb impurities.
Further enhancements in spin-coherence could be achieved by chemically purifying the host matrix or improving the thermal spin-polarisation. For instance, increasing the resonator frequency from 4.4 to 8 gigahertz would significantly improve thermal-polarisation while maintaining compatibility with superconducting microwave circuits that typically operate in the 4-8 GHz band. In this situation one would expect the SD contribution of the Er and Yb spins to be reduced by factors of approximately and respectively, at a spin-bath temperature of 23 mK.
Chemical purification is also an important avenue to pursue because the smaller g-factors of non-erbium impurities will generally lead to significant SD contributions at low temperatures. Indeed, ytterbium alone presents an SD contribution times greater than erbium at 4.4 GHz and 23 mK. Reducing the Yb concentration to the ppb level observed in chemically purified would reduce this contribution by seven orders of magnitude, assuming the inhomogeneous spin-transition linewidth remains largely unchanged.
Such improvements could result in coherence-times approaching the nuclear-spin-limited of 27 milliseconds [19], while maintaining ppm Er concentrations.
Acknowledgements
We acknowledge technical support from P. Sénat, D. Duet, P.-F. Orfila, and S. Delprat, and we are grateful for fruitful discussions within the Quantronics group. We acknowledge IARPA and Lincoln Labs for providing the Josephson traveling-wave parametric amplifier.
This project has received funding from the European Union’s Horizon 2020 research and innovation program under Marie Sklodowska-Curie grant agreement no. 765267 (QuSCO) and no. 792727 (SMERC). E.F. acknowledges support from the Agence Nationale de la Recherche (ANR) grant DARKWADOR:ANR-19-CE47-0004. We acknowledge support from the ANR through the Chaire Industrielle NASNIQ under contract ANR-17-CHIN-0001 cofunded by Atos and through the project MIRESPIN under contract ANR-19-CE47-0011 and of the Region Ile-de-France through the DIM SIRTEQ (REIMIC project). We acknowledge support of the AIDAS virtual joint laboratory. R.B.L. was supported by Hong Kong Research Grants Council - General Research Fund (Project 14302121). S.L. was supported by the Impact Postdoctoral Fellowship of CUHK. S.B. thanks the support of the CNRS research infrastructure RENARD (FR 3443)
References
- [1] Zhong, M. et al. Optically addressable nuclear spins in a solid with a six-hour coherence time. Nature 517, 177–180 (2015). URL http://dx.doi.org/10.1038/nature14025.
- [2] Holzäpfel, A. et al. Optical storage for 0.53 s in a solid-state atomic frequency comb memory using dynamical decoupling. New Journal of Physics 22, 063009 (2020). URL https://iopscience.iop.org/article/10.1088/1367-2630/ab8aac%****␣ms.bbl␣Line␣25␣****https://iopscience.iop.org/article/10.1088/1367-2630/ab8aac/meta. eprint 1910.08009.
- [3] Longdell, J. J., Fraval, E., Sellars, M. J. & Manson, N. B. Stopped Light with Storage Times Greater than One Second Using Electromagnetically Induced Transparency in a Solid. Physical Review Letters 95, 063601 (2005). URL http://link.aps.org/doi/10.1103/PhysRevLett.95.063601.
- [4] Rančić, M., Hedges, M. P., Ahlefeldt, R. L. & Sellars, M. J. Coherence time of over a second in a telecom-compatible quantum memory storage material. Nature Physics 14, 50–54 (2018). URL http://www.nature.com/doifinder/10.1038/nphys4254.
- [5] Hedges, M. P., Longdell, J. J., Li, Y. & Sellars, M. J. Efficient quantum memory for light. Nature 465, 1052–1056 (2010). URL http://www.ncbi.nlm.nih.gov/pubmed/20577210http://dx.doi.org/10.1038/nature09081.
- [6] Dajczgewand, J., Le Gouët, J.-L., Louchet-Chauvet, A. & Chanelière, T. Large efficiency at telecom wavelength for optical quantum memories. Optics Letters 39, 2711 (2014). URL https://www.osapublishing.org/abstract.cfm?URI=ol-39-9-2711.
- [7] Sabooni, M., Li, Q., Kröll, S. & Rippe, L. Efficient Quantum Memory Using a Weakly Absorbing Sample. Physical Review Letters 110, 133604 (2013). URL http://link.aps.org/doi/10.1103/PhysRevLett.110.133604.
- [8] Bartholomew, J. G. et al. On-chip coherent microwave-to-optical transduction mediated by ytterbium in YVO4. Nature Communications 11, 1–6 (2020). URL https://www.nature.com/articles/s41467-020-16996-x. eprint 1912.03671.
- [9] Fernandez-Gonzalvo, X., Horvath, S. P., Chen, Y. H. & Longdell, J. J. Cavity-enhanced Raman heterodyne spectroscopy in for microwave to optical signal conversion. Physical Review A 100, 033807 (2019). eprint 1712.07735.
- [10] Grezes, C. et al. Towards a spin-ensemble quantum memory for superconducting qubits (2016). eprint 1510.06565.
- [11] Sigillito, A. J. et al. Fast, low-power manipulation of spin ensembles in superconducting microresonators. Applied Physics Letters 104, 222407 (2014). URL http://aip.scitation.org/doi/10.1063/1.4881613. eprint 1403.0018.
- [12] Grèzes, C. Towards a spin ensemble quantum memory for superconducting qubits. Phd thesis, Universite Paris-Saclay (2015).
- [13] Ranjan, V. et al. Electron spin resonance spectroscopy with femtoliter detection volume. Applied Physics Letters 116, 184002 (2020). URL https://aip.scitation.org/doi/abs/10.1063/5.0004322.
- [14] Probst, S., Rotzinger, H., Ustinov, A. V. & Bushev, P. A. Microwave multimode memory with an erbium spin ensemble. Physical Review B - Condensed Matter and Materials Physics 92, 014421 (2015). URL https://journals.aps.org/prb/abstract/10.1103/PhysRevB.92.014421. eprint 1501.01499.
- [15] Dold, G. milliKelvin ESR of rare-earth doped crystals using superconducting resonators. Phd thesis, University College London (2020).
- [16] Li, P. Y. et al. Hyperfine Structure and Coherent Dynamics of Rare-Earth Spins Explored with Electron-Nuclear Double Resonance at Subkelvin Temperatures. Physical Review Applied 13, 024080 (2020). eprint 1910.12351.
- [17] Rakonjac, J. V., Chen, Y.-H., Horvath, S. P. & Longdell, J. J. Long spin coherence times in the ground state and in an optically excited state of 167Er3+:Y2SiO5 at zero magnetic fields. Physical Review B 184430 (2020). URL https://journals.aps.org/prb/abstract/10.1103/PhysRevB.101.184430.
- [18] Ortu, A. et al. Simultaneous coherence enhancement of optical and microwave transitions in solid-state electronic spins. Nature Materials 2018 17:8 17, 671–675 (2018). URL https://www.nature.com/articles/s41563-018-0138-x. eprint 1712.08615.
- [19] Dantec, M. L. et al. Twenty-three millisecond electron spin coherence of erbium ions in a natural-abundance crystal. Science Advances 7, 9786 (2021). URL https://www.science.org/doi/full/10.1126/sciadv.abj9786. eprint 2106.14974.
- [20] Kanai, S. et al. Generalized scaling of spin qubit coherence in over 12,000 host materials (2021). URL https://arxiv.org/abs/2102.02986v1. eprint 2102.02986.
- [21] Herzog, B. & Hahn, E. L. Transient nuclear induction and double nuclear resonance in solids. Physical Review 103, 148–166 (1956).
- [22] Ferrenti, A. M., de Leon, N. P., Thompson, J. D. & Cava, R. J. Identifying candidate hosts for quantum defects via data mining. npj Computational Materials 6, 1–6 (2020). URL https://www.nature.com/articles/s41524-020-00391-7. eprint 2006.14128.
- [23] Kiel, A. & Mims, W. B. Electric-Field-Induced g Shifts for Loose Yb Ions in Three Scheelite Lattices. Physical Review B 1, 2935–2944 (1970). URL https://link.aps.org/doi/10.1103/PhysRevB.1.2935.
- [24] Bertaina, S. et al. Rare-earth solid-state qubits. Nature Nanotechnology 2, 39–42 (2007). URL http://www.nature.com/doifinder/10.1038/nnano.2006.174http://www.nature.com/articles/nnano.2006.174.
- [25] Guillot-Noël, O. et al. Hyperfine interaction of ions in : An electron paramagnetic resonance spectroscopy study. Physical Review B 74, 214409 (2006). URL http://link.aps.org/doi/10.1103/PhysRevB.74.214409.
- [26] Macklin, C. et al. A near-quantum-limited Josephson traveling-wave parametric amplifier. Science 350, 307–310 (2015).
- [27] Probst, S. et al. Inductive-detection electron-spin resonance spectroscopy with sensitivity. Applied Physics Letters 111, 202604 (2017). URL http://aip.scitation.org/doi/10.1063/1.5002540. eprint 1708.09287.
- [28] Bienfait, A. et al. Reaching the quantum limit of sensitivity in electron spin resonance. Nature nanotechnology 11, 253–257 (2015). URL http://www.nature.com/doifinder/10.1038/nnano.2015.282. eprint 1507.06831.
- [29] Song, C. et al. Microwave response of vortices in superconducting thin films of Re and Al. Physical Review B - Condensed Matter and Materials Physics 79, 174512 (2009). URL https://journals.aps.org/prb/abstract/10.1103/PhysRevB.79.174512. eprint 0812.3645.
- [30] Probst, S. et al. Anisotropic rare-earth spin ensemble strongly coupled to a superconducting resonator. Physical review letters 110, 157001 (2013). URL https://link.aps.org/doi/10.1103/PhysRevLett.110.157001https://journals.aps.org/prl/abstract/10.1103/PhysRevLett.110.157001.
- [31] Kubo, Y. et al. Strong Coupling of a Spin Ensemble to a Superconducting Resonator. Physical Review Letters 105, 140502 (2010). URL https://link.aps.org/doi/10.1103/PhysRevLett.105.140502.
- [32] Mims, W. B., Nassau, K. & McGee, J. D. Spectral Diffusion in Electron Resonance Lines. Physical Review 123, 2059 (1961). URL https://journals.aps.org/pr/abstract/10.1103/PhysRev.123.2059.
- [33] Hu, P. & Hartmann, S. R. Theory of spectral diffusion decay using an uncorrelated-sudden-jump model. Physical Review B 9, 1 (1974). URL https://journals.aps.org/prb/abstract/10.1103/PhysRevB.9.1.
- [34] Böttger, T., Thiel, C. W., Sun, Y. & Cone, R. L. Optical decoherence and spectral diffusion at 1.5 m in versus magnetic field, temperature, and concentration. Physical Review B 73, 075101 (2006). URL http://link.aps.org/doi/10.1103/PhysRevB.73.075101.
- [35] Bai, Y. S. & Fayer, M. D. Time scales and optical dephasing measurements: Investigation of dynamics in complex systems. Physical Review B 39, 11066 (1989). URL https://journals.aps.org/prb/abstract/10.1103/PhysRevB.39.11066.
- [36] Probst, S. et al. Hyperfine spectroscopy in a quantum-limited spectrometer. Magnetic Resonance 1, 315–330 (2020). eprint 2001.04854.
- [37] Angeletti, B. & Ambrosi, J. P. European Centre for Environmental Geoscience Research and Teaching (2020). URL https://www.cerege.fr/en/analytic-facilities/la-icp-ms-platform-elemental-chemistry.
- [38] Dantec, M. L. Electron spin dynamics of erbium ions in scheelite crystals , probed with superconducting resonators at millikelvin temperatures. Ph.D. thesis, Université Paris-Saclay (2022). URL https://tel.archives-ouvertes.fr/tel-03579857.
- [39] Car, B., Veissier, L., Louchet-Chauvet, A., Le Gouët, J. L. & Chanelière, T. Optical study of the anisotropic erbium spin flip-flop dynamics. Physical Review B 100, 165107 (2019). URL https://journals.aps.org/prb/abstract/10.1103/PhysRevB.100.165107. eprint 1811.10285.
- [40] Mims, W. B. & Gillen, R. Broadening of paramagnetic-resonance lines by internal electric fields. Physical Review 148, 438–443 (1966). URL https://journals.aps.org/pr/abstract/10.1103/PhysRev.148.438.
- [41] Baibekov, E. I. et al. Broadening of paramagnetic resonance lines by charged point defects in neodymium-doped scheelites. Optics and Spectroscopy 116, 661–666 (2014). URL http://link.springer.com/10.1134/S0030400X1405004X.
- [42] Ranjan, V. et al. Probing Dynamics of an Electron-Spin Ensemble via a Superconducting Resonator. Physical Review Letters 110, 067004 (2013). URL https://link.aps.org/doi/10.1103/PhysRevLett.110.067004. eprint 1208.5473.
- [43] Zech, M., Schoebel, J. & Pickert, T. Stick-slip drive, especially pieze-actuated inertial drive (2019). URL https://patents.google.com/patent/US10505470B2/en.
- [44] Kurshev, V. V. & Ichikawa, T. Effect of spin flip-flop on electron-spin-echo decay due to instantaneous diffusion. Journal of Magnetic Resonance (1969) 96, 563–573 (1992).
- [45] Tyryshkin, A. M. et al. Electron spin coherence exceeding seconds in high-purity silicon. Nature Materials 2011 11:2 11, 143–147 (2011). URL https://www.nature.com/articles/nmat3182.
- [46] Yang, W. & Liu, R. B. Quantum many-body theory of qubit decoherence in a finite-size spin bath. Physical Review B - Condensed Matter and Materials Physics 78, 085315 (2008). eprint 0806.0098.
- [47] Yang, W. & Liu, R. B. Quantum many-body theory of qubit decoherence in a finite-size spin bath. II. Ensemble dynamics. Physical Review B - Condensed Matter and Materials Physics 79, 115320 (2009). eprint 0902.3055.
- [48] Hempstead, C. F. & Bowers, K. D. Paramagnetic resonance of impurities in CaWO4. I. Two S-state ions. Physical Review 118, 131–134 (1960).