Chaotic and Clumpy Galaxy Formation in an Extremely Massive Reionization-Era Halo
Abstract
The SPT0311-58 system at is an extremely massive structure within the reionization epoch, and offers a chance to understand the formation of galaxies in an extreme peak in the primordial density field. We present 70 mas Atacama Large Millimeter/submillimeter Array observations of the dust continuum and [CII] 158 emission in the central pair of galaxies and reach physical resolution 100-350 pc, among the most detailed views of any reionization-era system to date. The observations resolve the source into at least a dozen kiloparsec-size clumps. The global kinematics and high turbulent velocity dispersion within the galaxies present a striking contrast to recent claims of dynamically cold thin-disk kinematics in some dusty galaxies just 800 Myr later at . We speculate that both gravitational interactions and fragmentation from massive parent disks have likely played a role in the overall dynamics and formation of clumps in the system. Each clump individually is comparable in mass to other galaxies identified in rest-UV/optical deep field surveys, but with star formation rates elevated by . Internally, the clumps themselves bear close resemblance to greatly scaled-up versions of virialized cloud-scale structures identified in low-redshift galaxies. Our observations are qualitatively similar to the chaotic and clumpy assembly within massive halos seen in simulations of high-redshift galaxies.
1 Introduction
The vast majority of known galaxies have been found through optical color selection techniques that identify predominantly low-mass, UV-bright star-forming galaxies, but the rarity and strong clustering of more massive galaxies typically exclude them from all but the widest survey fields. Far-infrared surveys offer an alternative perspective on the early universe, identifying the UV-dim population of dusty star-forming galaxies (DSFGs). Of these only a handful have been identified into the reionization epoch at , likely inhabiting dark matter halos that are much more rare and massive than UV-selected galaxies (e.g. Cooray et al., 2014; Strandet et al., 2017; Zavala et al., 2018). With star formation rates (SFRs) of hundreds of /yr, these IR-luminous dusty galaxies most likely then become the first massive quiescent galaxies now spectroscopically confirmed out to (e.g. Glazebrook et al., 2017; Straatman et al., 2016; Forrest et al., 2020). While the DSFG population has long been argued to consist primarily of major mergers (e.g. Ivison et al., 1998; Tacconi et al., 2008, among many others), recent works have found other DSFGs that appear to have kinematics dominated by thin-disk rotation (e.g. Rizzo et al., 2021; Fraternali et al., 2021), possible progenitors of dynamically cold, rotating quiescent galaxies at high redshift (e.g. Toft et al., 2017; Newman et al., 2018).
The DSFG SPT0311-58 is currently both the highest-redshift IR-selected system and a very massive object within the epoch of reionization (Strandet et al. 2017; Marrone et al. 2018, hereafter M18; Jarugula et al. 2021). Resolved into a pair of massive dusty galaxies by 0.3” ALMA observations, the masses of dust () and cold gas () are extreme compared to other known reionization-era galaxies. Even under conservative assumptions and considering only the currently-known spectroscopically-confirmed members, the implied host dark matter halo mass is just 800 Myr after the Big Bang, among the most massive halos expected in the standard CDM cosmology over an area of tens of square degrees (M18). This structure offers the chance to probe the details of galaxy assembly within an extreme peak of the primordial density field.
Here we present new 0.07” resolution ALMA observations of the dust and [CII] 158 emission in SPT0311-58, improving on the spatial resolution of the previous observations from M18 by 16 in beam area. The data reveal a highly clumpy and turbulent structure in the rapidly star-forming central galaxies, among the most detailed views of any reionization-era system. The observations and analysis are described in Section 2, and our main findings are discussed in Section 3. We conclude and describe future lines of work in Section 4. We assume a flat CDM cosmology with and Mpc-1 (Planck Collaboration et al., 2016); for this cosmology, 1” 5.4 kpc at . Images and data products are available at https://github.com/spt-smg/publicdata.
2 Data and Methods
2.1 ALMA Observations
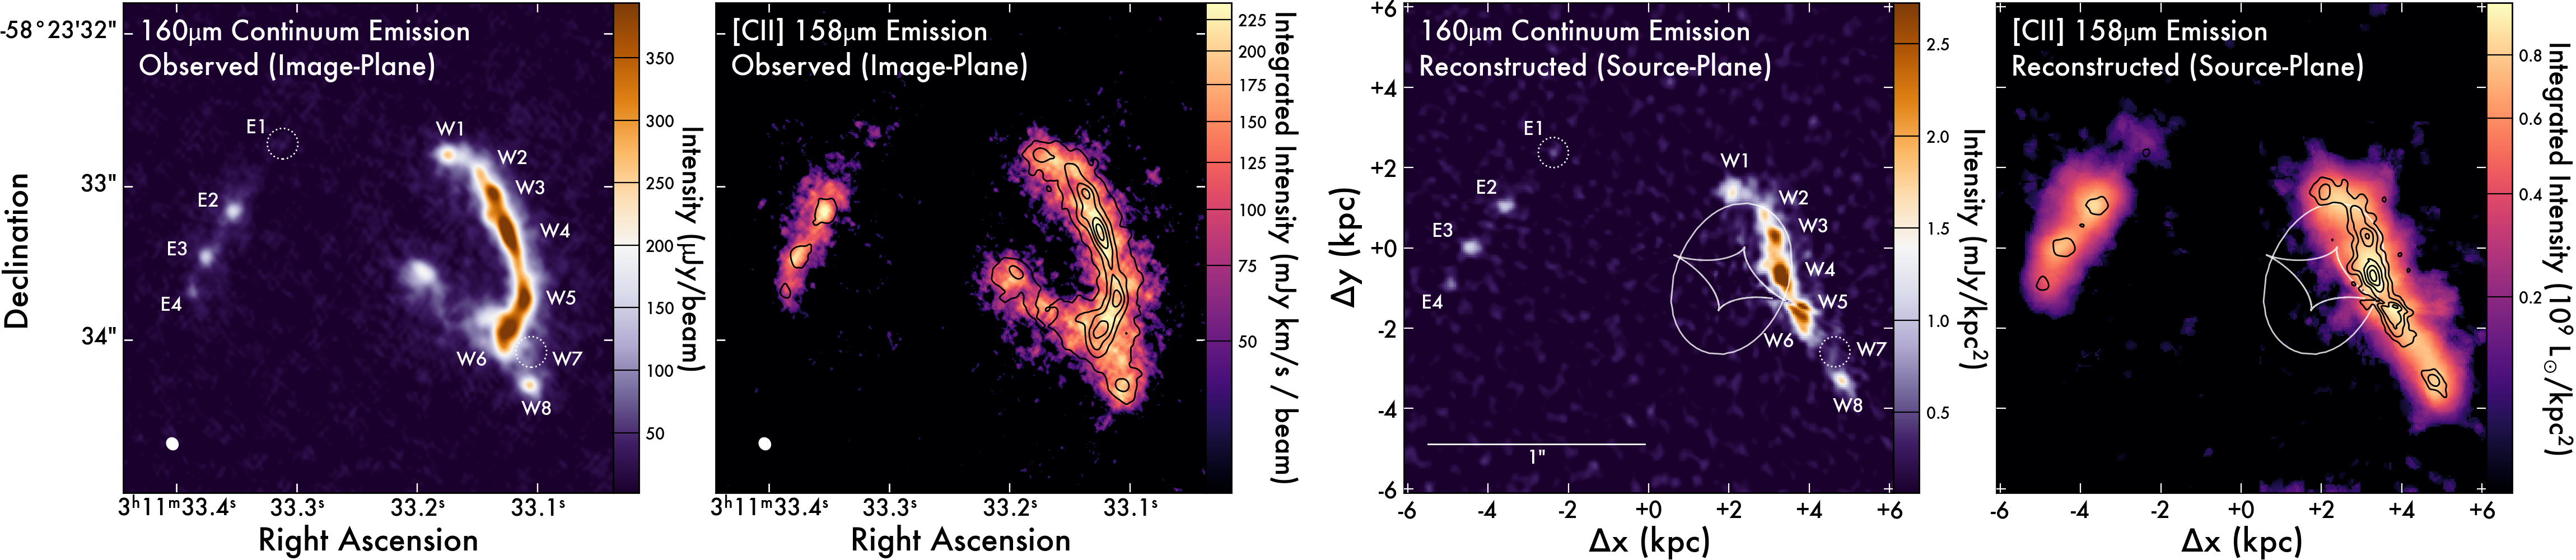
ALMA observations of the dust and [CII] emission were carried out in projects 2016.1.01293.S and 2017.1.01423.S, designed to reach spatial resolutions 0.25′′ and 0.05′′, respectively, at 240 GHz. The 2016 data were presented in M18, and the new data are essentially identical in spectral setup. The spectral resolution of the sideband containing the [CII] line is 10 . The newly-acquired data were obtained between 2017 November and 2018 October, comprising 40 min on-source in a compact array configuration with 15 m–1.4 km baseline lengths and 65 min in an extended array with 0.1–8.5 km baselines. The data were reduced using the standard ALMA pipeline and combined with the previous 2016 data. We performed a single round of phase-only self-calibration with a solution interval equal to the scan length. We imaged both the continuum and [CII] data using Briggs weighting with robustness parameter 0.5; the resulting synthesized beam size is 0.07′′ 0.08′′. The continuum image reaches 7.5 /beam sensitivity, and the [CII] data cube typically reaches 85 /beam sensitivity in 40 channels. The continuum image is shown in Fig. 1, together with an integrated [CII] (moment-0) map made by integrating channels from to with respect to . As noted by M18, SPT0311-58 consists of a western (SPT0311-58W) and eastern (SPT0311-58E) component, with SPT0311-58W mildly lensed by a foreground galaxy and SPT0311-58E essentially unlensed. The two components are separated by 700 and are therefore distinct objects ( M18, and see below) that our new data resolve in detail.
2.2 Lensing Reconstruction
Lens models and source-plane reconstructions of 0.3′′ ALMA data, including the [CII] line, were originally presented in M18. Those models used a pixellated reconstruction of the source plane and represented the foreground lens as a singular isothermal ellipsoid (SIE), following the methodology described in Hezaveh et al. (2016). We use the same code and reconstruction procedure for our high-resolution data. We re-fit for the foreground lens parameters including all available data, finding good quantitive agreement with the previous models. We reconstructed the continuum emission and [CII] emission in 40 channels, applying the best-fit lensing deflections. The peak residuals from the best-fit reconstruction reach 4 in the continuum, compared to a peak S/N120 in the data. This demonstrates that our assumption of an SIE profile, while simple, is adequate in the absence of other data to constrain the lens mass profile. We expect these residuals to have minimal impact on our subsequent analysis. The reconstruction of the continuum and integrated [CII] emission are shown in Fig. 1, while Fig. 2 shows a more detailed 3D rendering of the [CII] emission. Because SPT0311-58E lies far from the multiply-imaged region of the source plane and is essentially unlensed, its apparent morphology is reproduced basically exactly in the reconstruction. Similarly, much of the apparent image-plane structure in SPT0311-58W maps simply to the intrinsic source plane, a consequence of the spatial offset between lens and source. Due to variations in the local magnification, the effective spatial resolution of the reconstructions varies from 60 pc (near the lensing caustics in the central regions of SPT0311-58W) to 350 pc (across SPT0311-58E and the southern end of SPT0311-58W, which are not strongly lensed).
2.3 Clump Identification
The source-plane reconstructions of continuum and [CII] emission both show a highly clumpy structure. To verify this structure and measure clump properties, namely the size and spectral line width of each clump, we use the fellwalker clump-finding algorithm (Berry, 2015), which identifies distinct peaks in two- or three-dimensional data and integrates outward from these peaks to a user-specified minimum threshold. We analyze the continuum and [CII] data separately, i.e. we do not impose any correspondence between continuum and [CII] clumps. The fellwalker algorithm does not presume any spatial or spectral profile for the clumps. It instead simply labels the flux of each pixel as belonging to at most a single clump; any spatial or spectral overlap between clumps is therefore ignored. We require clumps to reach a minimum peak signal-to-noise of 4 in the continuum and 8 in the [CII] cube, and expand around peaks identified this way down to the 2 level. We also tested several other clump-finding techniques, including the classic clumpfind algorithm (Williams et al., 1994) and the tree-based astrodendro package111http://www.dendrograms.org/. All methods yielded consistent results for the continuum clumps; the clump-to-clump contrast in the continuum is high enough that the details of the clump identification are not very important. There was slightly more variation in the results from the [CII] cube due to the lower contrast between adjacent clumps. The most common differences were a failure to identify the clump we label E1 due to its faintness, and the joining of clumps W3 and W4 due to the low contrast between clumps. With some fine-tuning of the parameters we were able to recover all clumps consistently between the different algorithms, but we stress that our results are not strongly dependent on the details of the clump identification.
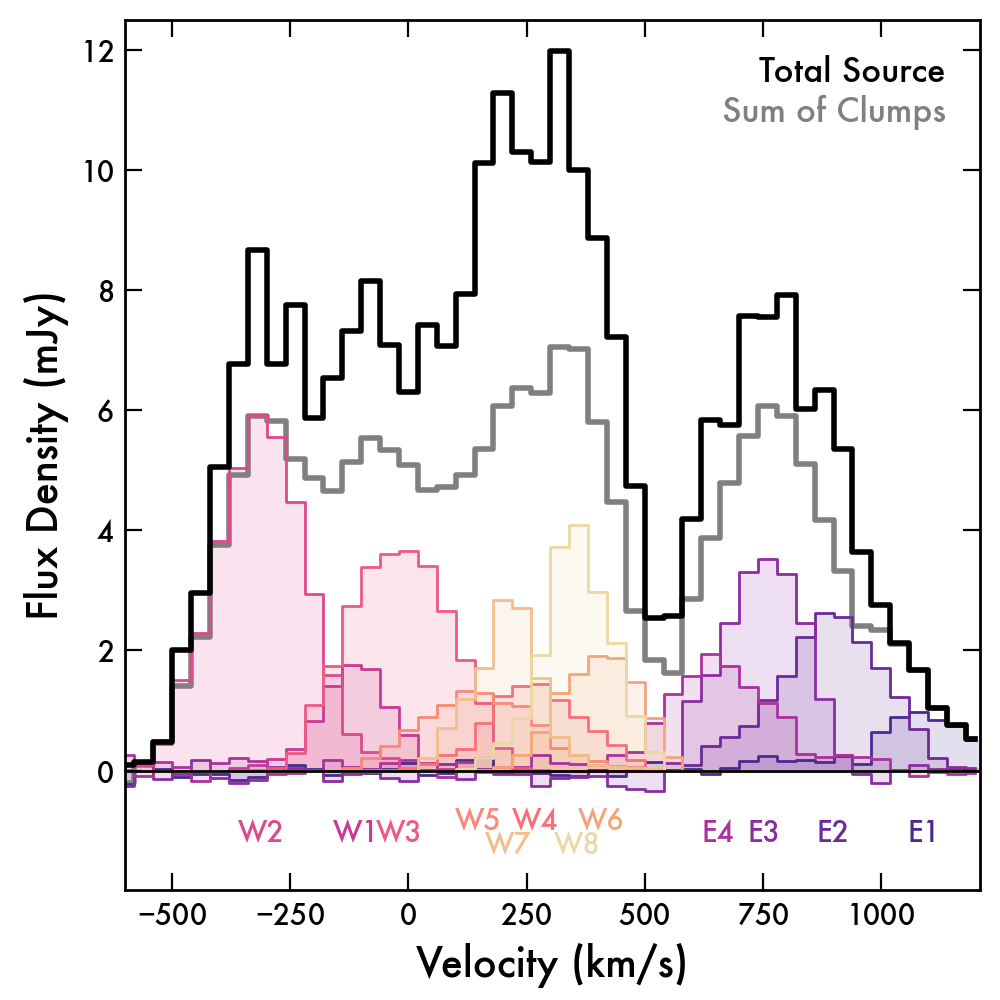
We identify 12 distinct clumps in the [CII] data cube, four in SPT0311-58E (labeled E1–E4 from north to south) and eight in SPT0311-58W (W1–W8). Ten clumps are also identified in the continuum image. Clump E1 peaks just below our minimum continuum S/N threshold, while clump W7 appears to be genuinely continuum-faint. For these two clumps we ‘manually’ measure continuum properties using apertures over the [CII]-emitting region; we verified that this method would also accurately recover the continuum flux density of the other clumps as well. All continuum clumps spatially overlap with a [CII] counterpart, and we conclude that the continuum clumps are physically associated with the corresponding [CII] clumps. Together the continuum ([CII]) clumps recover 80% (70%) of the total intrinsic emission measured by integrating within a large aperture over the source plane. The remainder is distributed in a handful of additional tentative clumps that do not reach our minimum peak signal-to-noise threshold, and a diffuse component surrounding the algorithmically-identified clumps that falls below our 2 threshold and is therefore not assigned to any particular clump. The [CII] spectra of all clumps, the sum of clumps, and the sum over the entire source plane are shown in Figure 3.
We tested the recovery of clump properties by injecting artificial Gaussian clumps into signal-free regions of the reconstructed data cube and then measuring the clump properties in the same way as the real data. For artificial clumps with properties similar to the real ones (radius R1 kpc, peak line flux 2.5 mJy), the size and integrated line fluxes were recovered well. The line width was also well-recovered as long as FWHM40 (the cube channel width, not coincidentally). This implies the minimum line width recoverable in our data is , which places limits on our later comparisons to clumps detected at low redshifts with narrow line widths.
3 Results and Discussion
3.1 Clumpy Formation of a Massive z 7 Galaxy
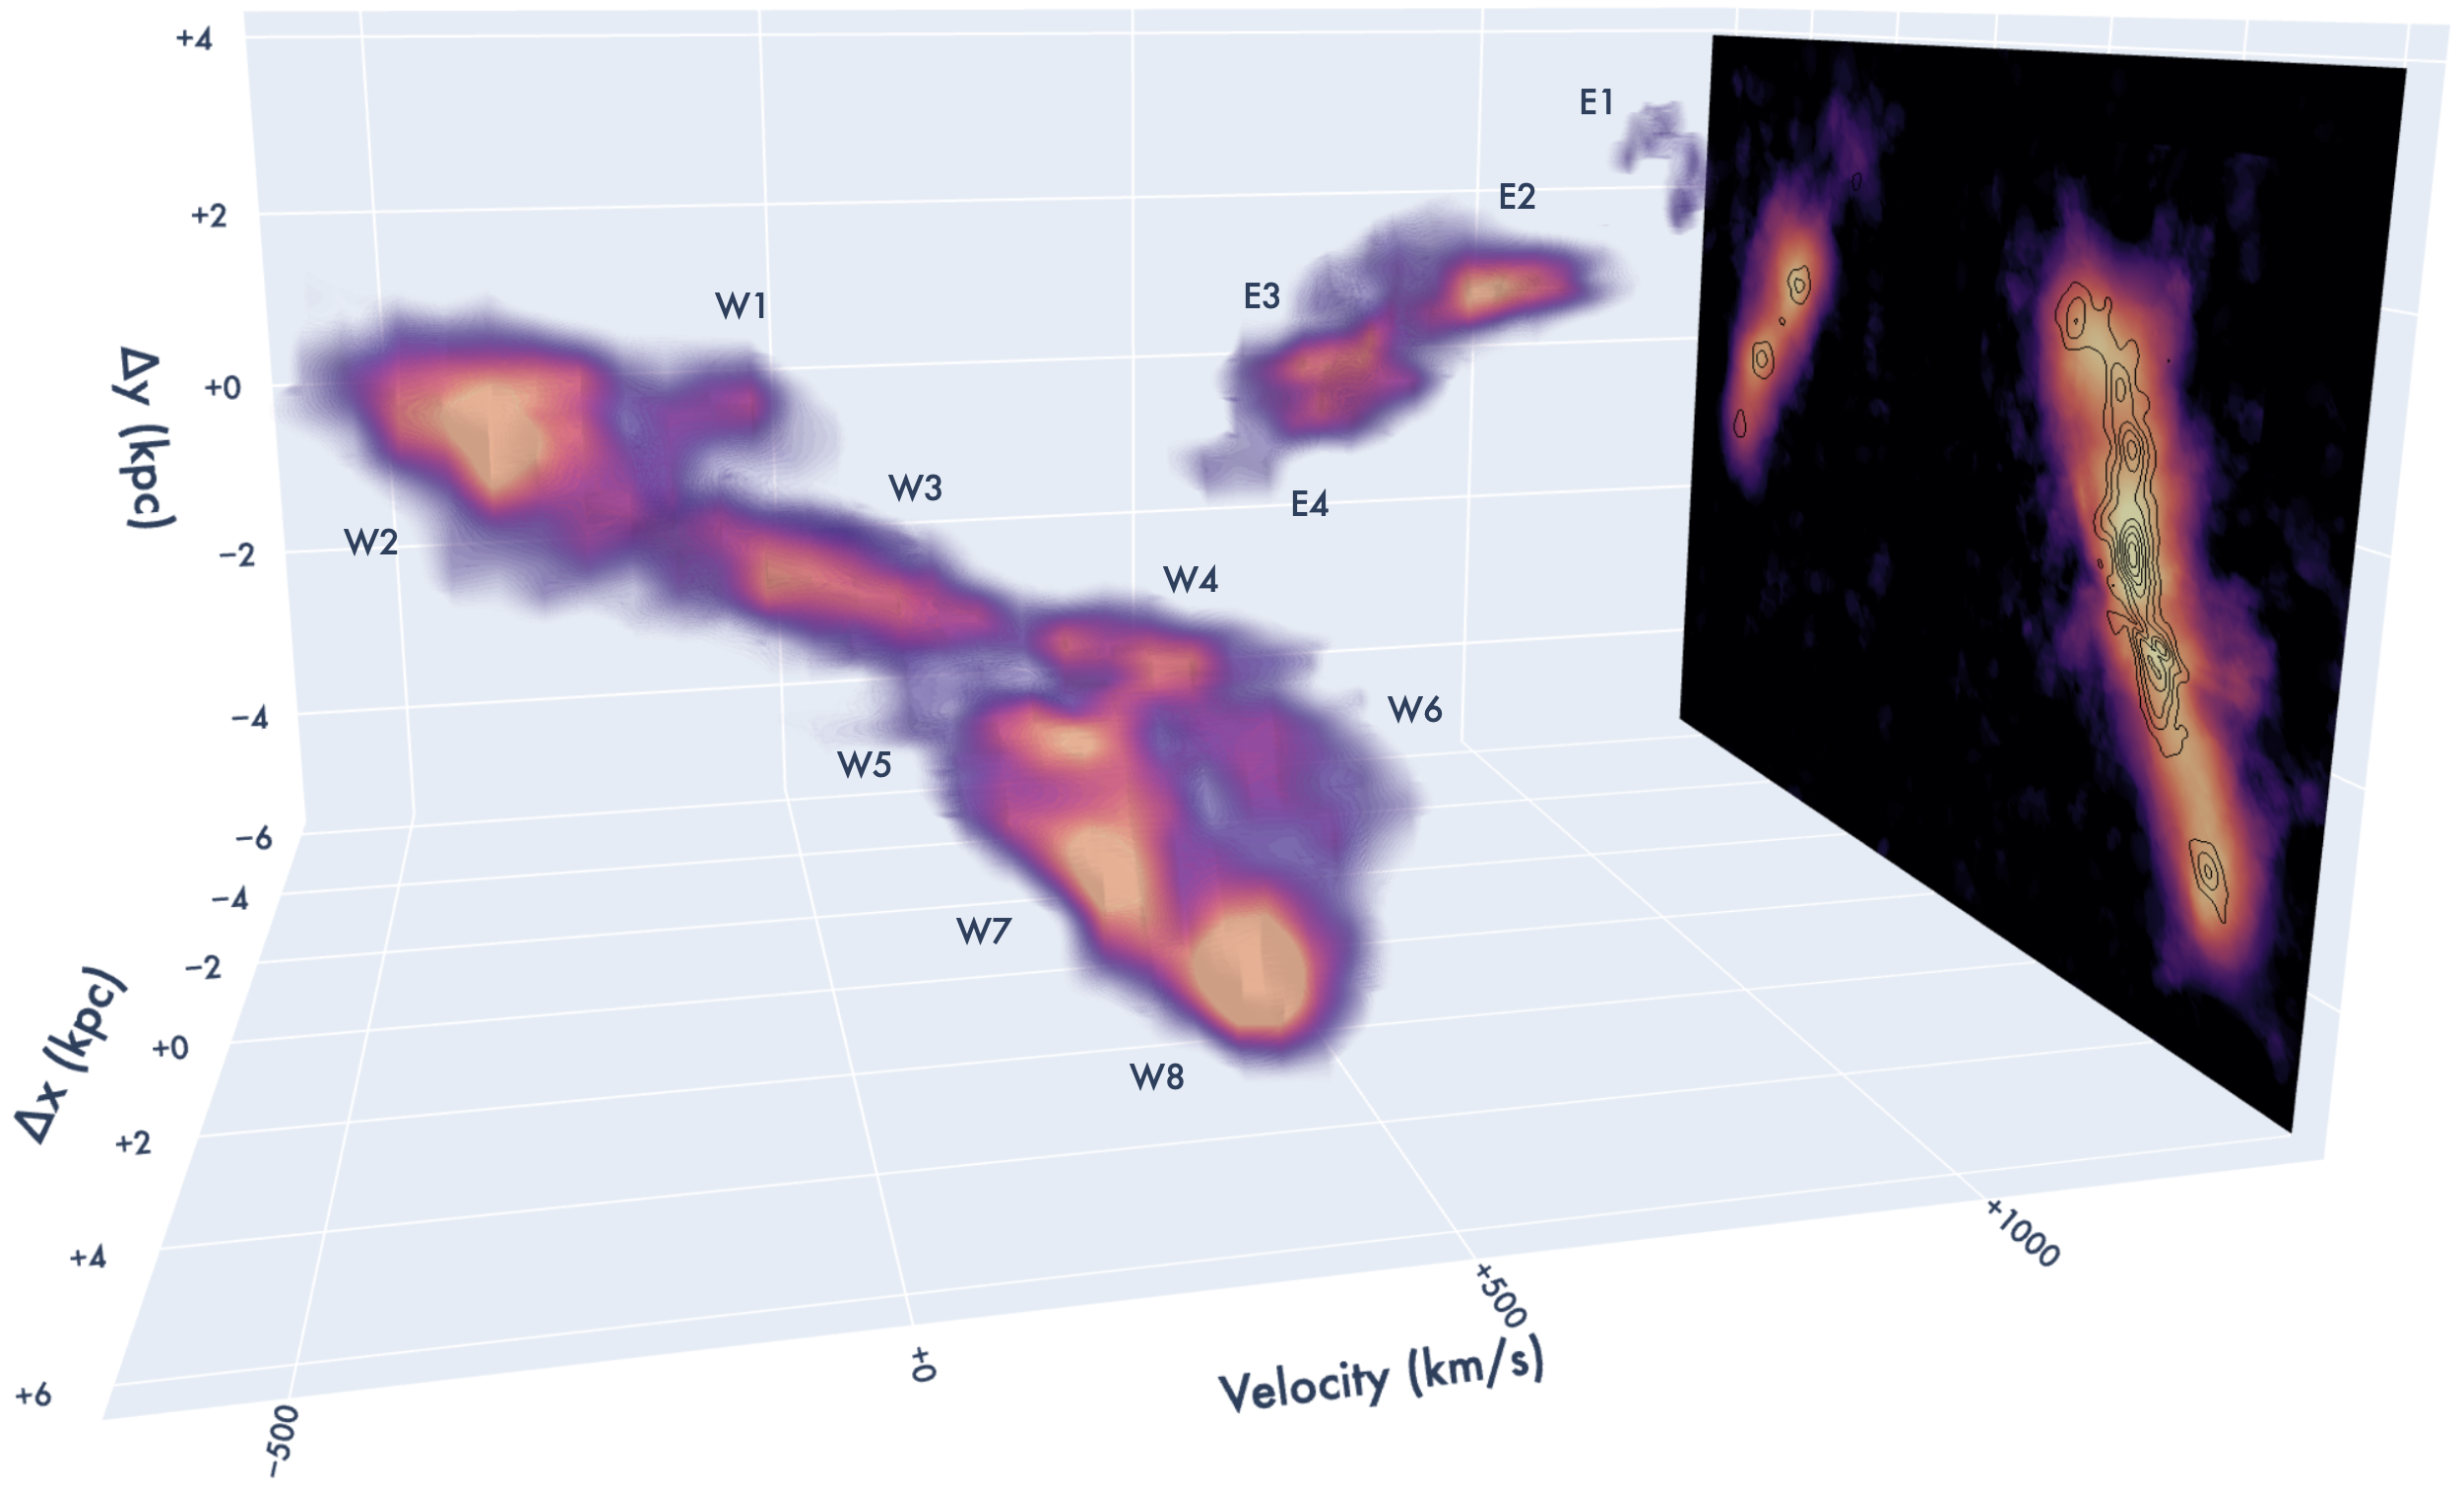
Our 100–350 pc resolution data provide among the most detailed views of any reionization-era galaxy currently available, demonstrating that the SPT0311-58 system consists of at least a dozen smaller substructures that dominate the total dust and [CII] emission. Importantly, no gravitational lensing ‘trickery’ has artificially produced the clumps, as the structures identified by the algorithms are also readily apparent in the image-plane in this modestly-lensed system. We illustrate this correspondence by labeling the identified clumps in both the image and source planes in Fig. 1. Figure 2 demonstrates that the [CII] emission is also highly clumpy in position-position-velocity space, with the smooth velocity-integrated emission a consequence of distinct clumps overlapping in the plane of the sky. The resolution and depth of our data (e.g. the continuum image reaches peak S/N75) are sufficient to overcome limitations in past works that ruled out significant clumpy structure in lower-redshift DSFGs (e.g. Hodge et al., 2016; Rujopakarn et al., 2019; Ivison et al., 2020).
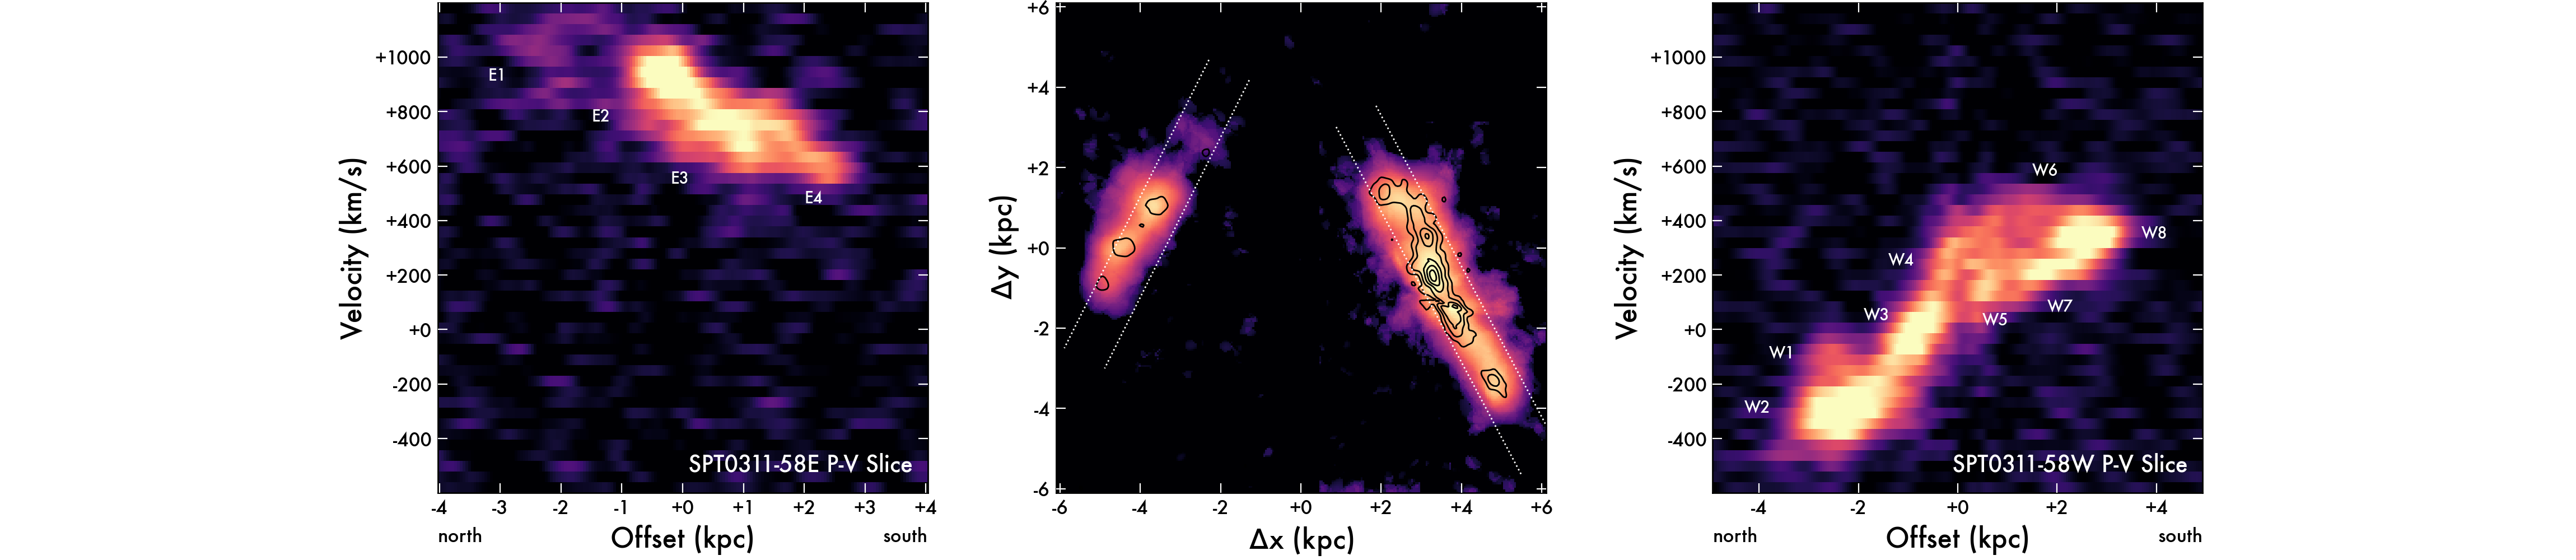
Globally, the SPT0311-58 clumps are not arranged randomly in position-position-velocity space, but appear to trace two ‘strings’ of clumps, one each in SPT0311-58W and E. While SPT0311-58E and W must be interacting, this raises the possibility that the clumps within each object have formed by fragmentation of a (very) massive pair of disks. The lower panels of Fig. 2 show position-velocity slices along the major axis of each object. Not all clumps are easily distinguished in these 2D projections of the 3D cube, although we have defined the slices to contain at least some of the [CII] emission of all clumps. It is clear from Fig. 2 that neither SPT0311-58E or W is consistent with simple thin-disk rotation: not all clumps are co-linear in either source, and some clumps in each source do not follow the pattern expected from simple rotational models. This is in clear contrast to several recent works that claim rotational disk-like structure in lower-redshift DSFGs based on [CII] kinematics (e.g. Fraternali et al., 2021; Rizzo et al., 2021) or dust continuum morphology alone (e.g. Hodge et al., 2019). The P-V diagrams in Fig. 2 are clearly less well-defined, more disturbed, and more turbulent than the analogous diagrams in, e.g., Rizzo et al. 2021. Even if we ascribe the entirety of the structure seen in Fig. 2 to rotation, we would estimate an upper limit on the ratio of rotational-to-turbulent motions in both SPT0311-58 galaxies, well below that claimed by the aforementioned works. Whether due to the higher redshift or the much larger mass of the system compared to these objects, SPT0311-58 presents a clear counterexample to the recent narrative that early DSFGs are dominated by dynamically cold, secularly rotating systems.
We nevertheless expect that rotational motions are present at some level, for several reasons. Angular momentum conservation requires that merging structures orbit each other, producing ‘velocity gradients’ superficially similar to rotation (see, e.g. Litke et al., 2019, for a similar case in a DSFG). However, it is implausible that a dozen merging subhalos should all be found within such close proximity yet still be distinctly identifiable given the short timescales expected for coalescence. Moreover, local processes can distort the rotation curve from the classic patterns. For example, a position-velocity diagram of the M82 galactic disc shows evidence of a supernova-driven bubble qualitatively similar to the pattern seen in clumps W4–W8, though on spatial scales 10 smaller (Weiß et al., 1999). In all likelihood both disk fragmentation and gravitational interactions contribute to the clumpy structure of SPT0311-58. SPT0311-58E and W are separated by 10 kpc on the sky and are clearly interacting, and at least some of the clumps in each source are likely distinct merging substructures. Other clumps may have fragmented from massive turbulent parent disks, but it is difficult to know the formation mechanism of any particular clump or ensemble of clumps.
Turning to the internal kinematics of the clumps, all clumps have velocity dispersions and circularized sizes kpc, measured from pseudo-moment-0 images that integrate the [CII] emission of each clump along the spectral dimension.222These sizes are probably underestimated because the clump-finding algorithm does not allow pixels to belong to more than one clump i.e. clump overlap is ignored. Only two clumps in SPT0311-58W, W3 and W4, show obvious internal velocity gradients that may suggest that the clumps themselves are rotating. Even for these clumps it is unclear whether rotation dominates, since these clumps are nearest the center of SPT0311-58W and are plausibly interacting. The remaining 10 clumps all appear to be dispersion-dominated at the current resolution. Future observations, especially those targeting a spectral line with more stringent excitation conditions to suppress emission from the diffuse gas, will be necessary to ascertain the internal kinematics of the SPT0311-58 clumps.
3.2 Enhanced Star Formation in z 7 Galaxy-Mass Clumps
We have shown that the clumps in SPT0311-58 are dispersion-dominated at the spatial resolution of the current data. Using the clump sizes and line widths from our clump-finding algorithm, we calculate simple dynamical mass estimates as with the clump velocity dispersion , radius , and gravitational constant G. The dimensionless pre-factor is intended to encapsulate the details of the clump kinematics and is typically assumed to lie in the range 2–7 (see Spilker et al. 2015 and references therein). We adopt for consistency with our subsequent analysis in Section 3.3, appropriate for dispersion-dominated systems. We estimate uncertainties of at least a factor of 2 because of the difficulty in separating the emission from adjacent clumps with low contrast and the lack of knowledge of the detailed clump dynamics. We calculate clump SFRs using the De Looze et al. (2014) [CII]-SFR relation; while calibrated at , we expect this relation to provide reasonably good estimates at as well (e.g. Leung et al., 2020). We find generally consistent SFRs if we instead apportion the total -based SFR among the clumps based on their continuum flux densities; is globally well-constrained for these galaxies (M18). These SFRs are also likely uncertain by a factor of at least 2 for the same reasons as above, excluding systematic uncertainties in the [CII]-SFR or -SFR conversions, and any differences in the dust temperature between clumps within each source, which would redistribute the same well-measured among the clumps differently.
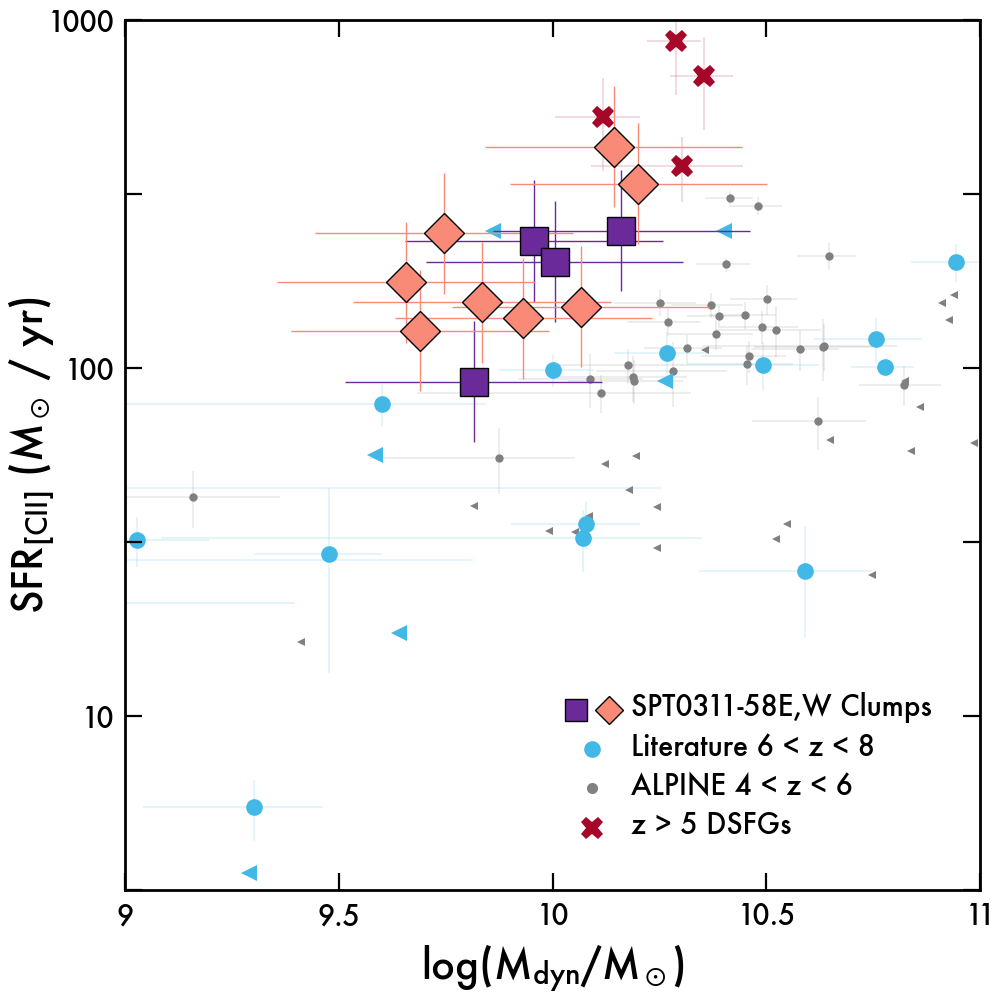
Fig. 4 compares the SPT0311-58 clumps in –SFR with lower-redshift massive galaxies from the ALPINE survey (; Fujimoto et al., 2020; Béthermin et al., 2020; Faisst et al., 2020), a sample of (UV-selected) galaxies detected in [CII] assembled from the literature (Willott et al., 2015; Knudsen et al., 2016; Pentericci et al., 2016; Bradač et al., 2017; Matthee et al., 2017; Carniani et al., 2018; Smit et al., 2018; Hashimoto et al., 2019; Matthee et al., 2019; Bakx et al., 2020; Harikane et al., 2020; Fujimoto et al., 2021), and IR-selected galaxies (Zavala et al., 2018; Litke et al., 2019; Spilker et al., 2020). We use the same [CII]-based SFR estimator for all samples, and the same calculation unless the original studies used a different method. The clump SFRs are clearly elevated compared to the UV-selected blank-field galaxies by 3–5, as are the other IR-selected objects. At some level this is a selection effect, since low-SFR galaxies by definition cannot enter the SPT survey (Vieira et al., 2013; Spilker et al., 2016; Everett et al., 2020), but also reflects the long-known high star formation efficiency in DSFGs (SFE SFR, and to zeroth order ; e.g. Greve et al. 2005; Aravena et al. 2016). Interestingly, however, the masses of the individual SPT0311-58 clumps are very typical of ‘normal’ galaxies selected from blank field imaging surveys. In other words, each clump individually can be thought of as similar in scale to the known population of high-redshift galaxies which together sum to create an extremely massive system, regardless of the physical origins of each individual clump.
3.3 The Nature of the Massive Clumps
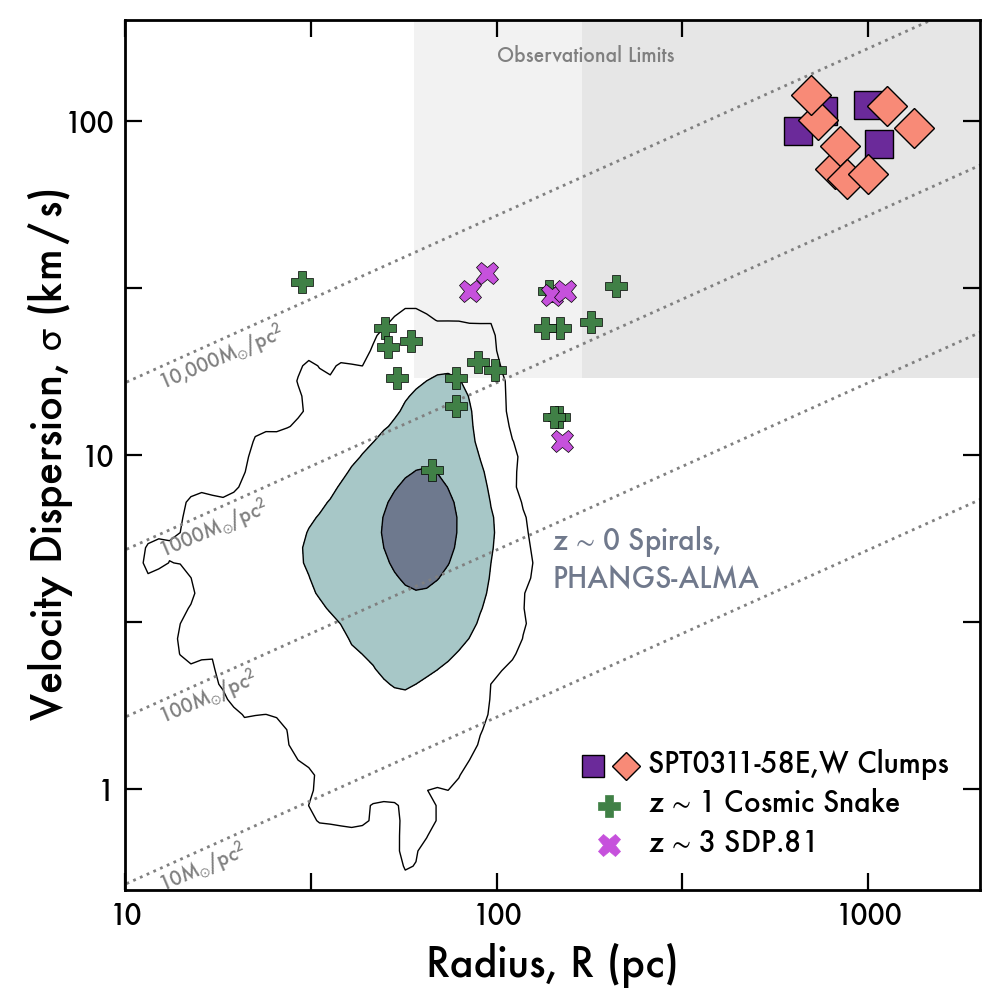
Finally, in this section we seek to gain more insight into the internal structure of the SPT0311-58 clumps from our 100–300 pc resolution data. Our results are summarized by Figure 5. Fig. 5 (left) shows the size–line width relation. We compare to a large sample of giant molecular clouds (GMCs) in nearby spiral galaxies from the PHANGS-ALMA survey (Rosolowsky et al., 2021), clumps identified in the lensed z1 ‘Cosmic Snake’ galaxy (Dessauges-Zavadsky et al., 2019), and similar clumps in the lensed z3 IR-selected galaxy SDP.81. The clumps in SPT0311-58 are clearly physically larger and more turbulent than the lower-redshift clump-scale structures. The gray shaded regions in Fig. 5 (left) illustrate the approximate limits of our data in size and line width, with size limits corresponding to our best achievable resolution in high-magnification regions of the source plane as well as unlensed regions, and a line width limit corresponding to FWHM40 , consistent with our recovery tests described in Section 2.3.
For virialized clouds with , clumps at fixed mass surface density follow the dotted lines in Fig. 5 (left). Although we examine this assumption next, we see from Fig. 5 (left) that the implied mass surface densities of the SPT0311-58 clumps are comparable to those of other cloud complexes. However, given the observational limitations, it is clear that we only would have been able to identify perhaps a third of the clumps seen in the galaxies, with the remainder too small and/or too narrow to be present in our data. Nevertheless, we would have been sensitive to clumps 0.5 dex smaller in size and/or 0.5 dex narrower in line width, but no such clumps are identified – in other words, none of the clumps we identify are close to the observational bounds of the data. Future observations with higher spatial resolution and/or sufficiently high S/N to allow reconstructions at finer spectral resolution will be required to determine if the clumps in SPT0311-58 break up in to yet smaller structures. The similarity in implied surface density suggests that, internally, the SPT0311-58 clumps may be akin to (greatly) ‘scaled-up’ versions of similar structures in lower-redshift galaxies.
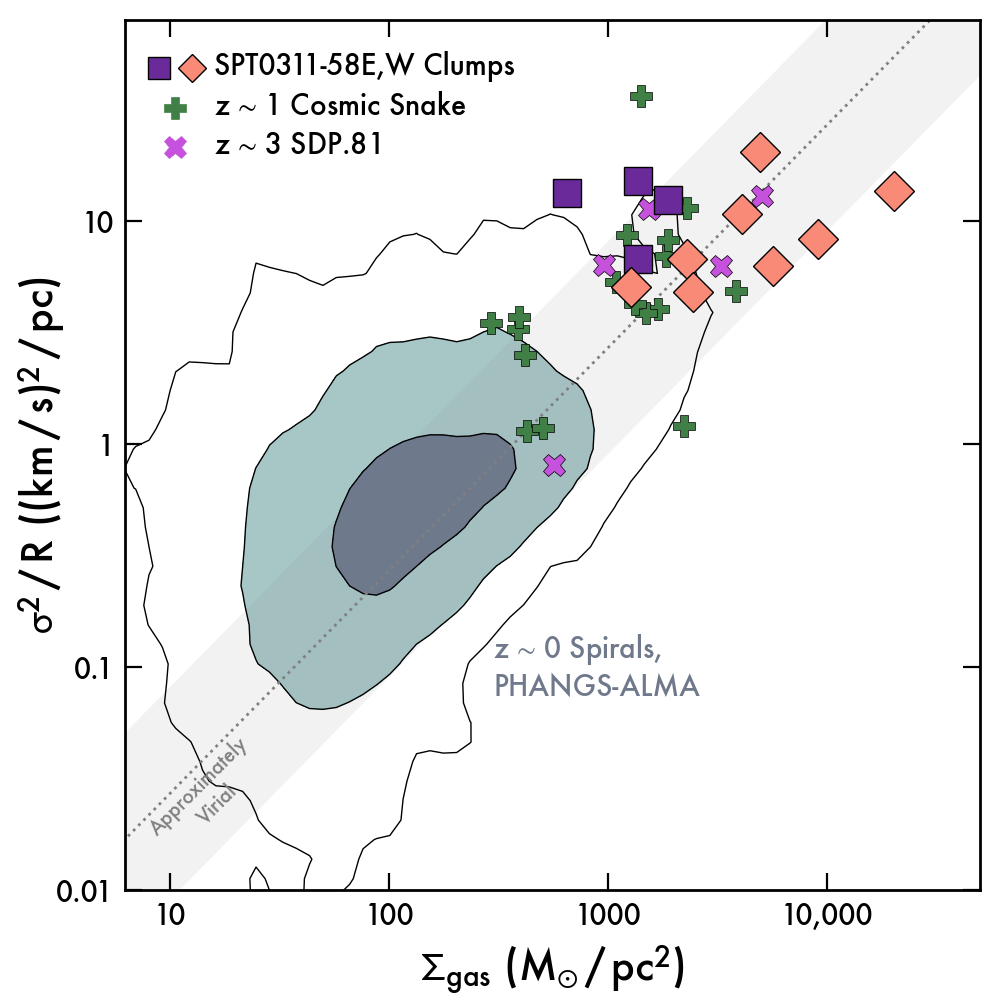
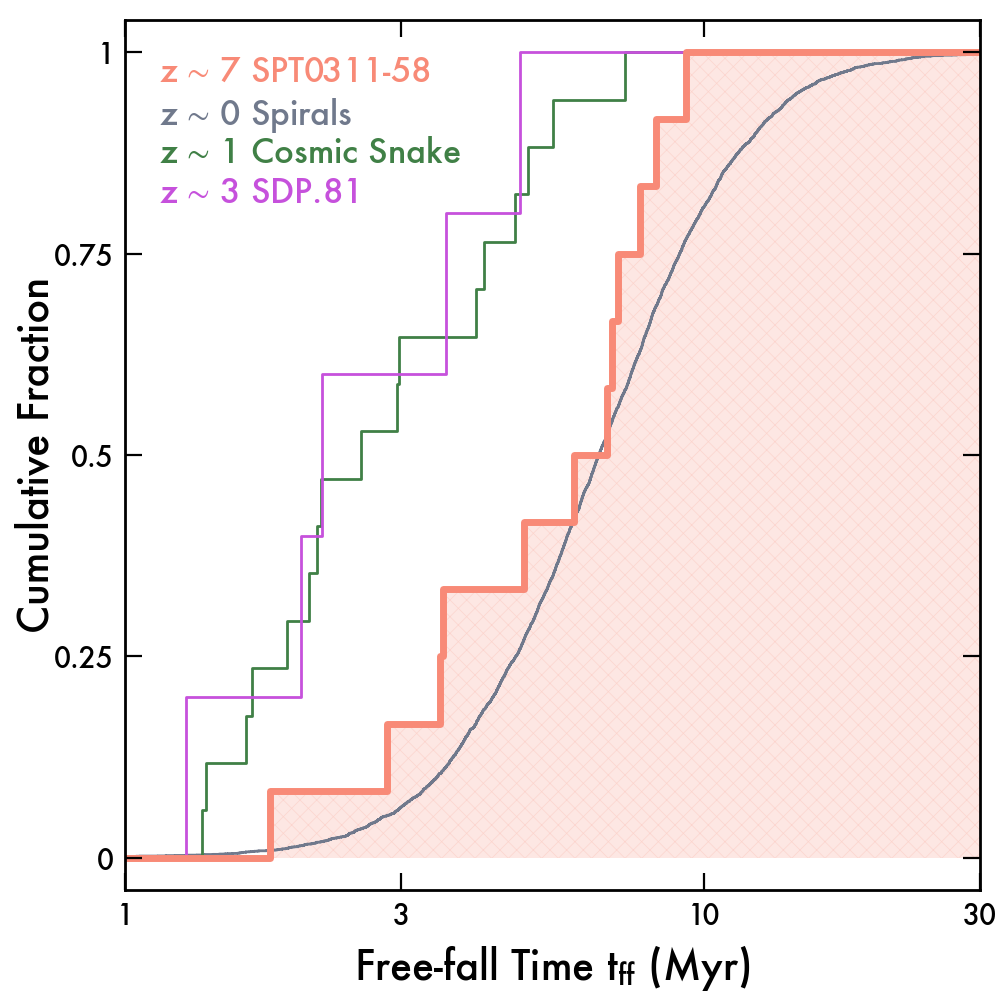
This is demonstrated further in Fig. 5 (center), where we compare the clump gas surface densities to the velocity dispersion ‘normalized’ by the clump size. Here we use the gas masses derived from radiative transfer modeling of the dust and CO emission in SPT0311-58 (Strandet et al. 2017, M18, Jarugula et al. 2021), most similar to the CO-based masses available for the comparison clumps. We simply divide the total masses of SPT0311-58E and W among the clumps according to their continuum flux densities; this is equivalent to assuming a constant gas/dust mass ratio in each source, which seems reasonable. For clouds in virial equilibrium333Typically clouds within a factor of 3 of this relation are taken to be consistent with virialization (e.g. Dessauges-Zavadsky et al., 2019; Rosolowsky et al., 2021), which we also adopt here. with mass dominated by the cold gas, we expect with in pc-2, in , and R in pc. Nearly all SPT0311-58 clumps are consistent with the locus expected for virialized structures, suggesting that they are also consistent with being self-gravitating bound objects. We note that unresolved rotational motions would move the clumps downwards in this plot, making them more tightly bound. Similar to the large sample of clouds and the limited samples of high-redshift clumps, the substructures in SPT0311-58 appear to be approximately in virial equilibrium. Assuming virialization, we show the distribution of the gravitational free-fall time for the SPT0311-58 and literature comparison clumps in Fig. 5 (right), following Rosolowsky et al. (2021) for the formulation of the free-fall time. The free-fall times of the SPT0311-58 clumps are remarkably similar to the distribution of the clumps. Equivalently, the volume density of the kpc-scale SPT0311-58 clumps is remarkably similar to the density of the 1000 smaller volume local clouds, since .
Taken together, Fig. 5 suggests that the individual clumps in SPT0311-58 bear a striking resemblance to similar structures on smaller scales in lower-redshift galaxies. We have argued that gravitational interactions, both between SPT0311-58E and W and between individual clumps within each object, likely play a strong role in driving the overall structure of the galaxies (Section 3.1), even if some clumps formed from fragmentation of very massive parent disks. Nevertheless the internal properties of the clumps seem to be otherwise similar to those of GMC-scale structures that form in undisturbed disks. Future observations with even higher spatial resolution could measure more detailed internal kinematic structure within the clumps and/or resolve each clump into even smaller sub-structures. The very large amounts of cold gas contained in the clumps, combined with the high likelihood of interactions between clumps and between SPT0311-58E and SPT0311-58W, likely explains the very rapid star formation seen in these galaxies.
4 Conclusions
We have presented a detailed view of an extremely massive reionization-era system, using 0.07” resolution observations of the dust and [CII] emission in the SPT0311-58 system to probe the structure of the central galaxies on scales down to 100 pc. The observations resolve the pair of central galaxies into at least a dozen clumps, each with turbulent velocity dispersion , size kpc, and mass . These galaxy-scale clumps are similar in mass to the population of currently-known reionization-era galaxies selected from rest-UV imaging surveys, but the SPT0311-58 clumps show SFRs elevated by about a factor of 3–5 compared to the UV-selected objects at similar mass. Globally, the chaotic and turbulent kinematics of SPT0311-58 present a striking contrast to recent claims of dynamically cold thin-disk rotation in some DSFGs. This could indicate a transition in the dominant DSFG kinematics between and , although the short 800 Myr interval between these epochs is only a few dynamical timescales. We speculate that some clumps may have formed from fragmentation of very massive parent disks while others are more likely merging substructures, but in any case the overall kinematics are highly chaotic and turbulent. Internally, the SPT0311-58 clumps bear a striking resemblance to greatly scaled-up versions of molecular cloud-scale structures identified in spirals and a pair of lensed galaxies; for example, the SPT0311-58 clumps show a similar distribution of free-fall times as a large sample of molecular clouds, implying similar volume densities as these clouds despite being 10 larger in size.
Thus far our most detailed view of the SPT0311-58 system has come from the millimeter imaging presented here, tracing the cold dust and gas within the central galaxies. Upcoming observations with the James Webb Space Telescope (GTO-1264, GO-1791) will also allow a similar-resolution view of the rest-UV/optical light and rest-optical nebular emission lines, allowing detailed constraints on the stellar contents and unobscured star formation in the central regions of this massive halo. Equally importantly, these observations will also probe larger distances into the halo surrounding the central galaxies, which will allow the selection of additional galaxies tracing the overdensity on larger scales. From the planned JWST imaging and spectroscopy it may also be possible to place (loose) constraints on the very early formation history of these galaxies, although the high dust obscuration will present challenges. Together with existing imaging from the Hubble Space Telescope and our ALMA observations, we will soon have a comprehensive sub-kiloparsec scale view of the galaxies assembling within an extremely massive reionization-era dark matter halo.
References
- Aravena et al. (2016) Aravena, M., Spilker, J. S., Bethermin, M., et al. 2016, MNRAS, 457, 4406, doi: 10.1093/mnras/stw275
- Astropy Collaboration et al. (2018) Astropy Collaboration, Price-Whelan, A. M., Sipőcz, B. M., et al. 2018, AJ, 156, 123, doi: 10.3847/1538-3881/aabc4f
- Bakx et al. (2020) Bakx, T. J. L. C., Tamura, Y., Hashimoto, T., et al. 2020, MNRAS, 493, 4294, doi: 10.1093/mnras/staa509
- Berry (2015) Berry, D. S. 2015, Astronomy and Computing, 10, 22, doi: 10.1016/j.ascom.2014.11.004
- Béthermin et al. (2020) Béthermin, M., Fudamoto, Y., Ginolfi, M., et al. 2020, A&A, 643, A2, doi: 10.1051/0004-6361/202037649
- Bradač et al. (2017) Bradač, M., Garcia-Appadoo, D., Huang, K.-H., et al. 2017, ApJ, 836, L2, doi: 10.3847/2041-8213/836/1/L2
- Carniani et al. (2018) Carniani, S., Maiolino, R., Amorin, R., et al. 2018, MNRAS, 478, 1170, doi: 10.1093/mnras/sty1088
- Cooray et al. (2014) Cooray, A., Calanog, J., Wardlow, J. L., et al. 2014, ApJ, 790, 40, doi: 10.1088/0004-637X/790/1/40
- De Looze et al. (2014) De Looze, I., Cormier, D., Lebouteiller, V., et al. 2014, A&A, 568, A62, doi: 10.1051/0004-6361/201322489
- Dessauges-Zavadsky et al. (2019) Dessauges-Zavadsky, M., Richard, J., Combes, F., et al. 2019, Nature Astronomy, 3, 1115, doi: 10.1038/s41550-019-0874-0
- Everett et al. (2020) Everett, W. B., Zhang, L., Crawford, T. M., et al. 2020, ApJ, 900, 55, doi: 10.3847/1538-4357/ab9df7
- Faisst et al. (2020) Faisst, A. L., Schaerer, D., Lemaux, B. C., et al. 2020, ApJS, 247, 61, doi: 10.3847/1538-4365/ab7ccd
- Forrest et al. (2020) Forrest, B., Marsan, Z. C., Annunziatella, M., et al. 2020, ApJ, 903, 47, doi: 10.3847/1538-4357/abb819
- Fraternali et al. (2021) Fraternali, F., Karim, A., Magnelli, B., et al. 2021, A&A, 647, A194, doi: 10.1051/0004-6361/202039807
- Fujimoto et al. (2020) Fujimoto, S., Silverman, J. D., Bethermin, M., et al. 2020, ApJ, 900, 1, doi: 10.3847/1538-4357/ab94b3
- Fujimoto et al. (2021) Fujimoto, S., Oguri, M., Brammer, G., et al. 2021, ApJ, 911, 99, doi: 10.3847/1538-4357/abd7ec
- Glazebrook et al. (2017) Glazebrook, K., Schreiber, C., Labbé, I., et al. 2017, Nature, 544, 71, doi: 10.1038/nature21680
- Greve et al. (2005) Greve, T. R., Bertoldi, F., Smail, I., et al. 2005, MNRAS, 359, 1165, doi: 10.1111/j.1365-2966.2005.08979.x
- Harikane et al. (2020) Harikane, Y., Ouchi, M., Inoue, A. K., et al. 2020, ApJ, 896, 93, doi: 10.3847/1538-4357/ab94bd
- Hashimoto et al. (2019) Hashimoto, T., Inoue, A. K., Mawatari, K., et al. 2019, PASJ, 71, 71, doi: 10.1093/pasj/psz049
- Hezaveh et al. (2016) Hezaveh, Y. D., Dalal, N., Marrone, D. P., et al. 2016, ApJ, 823, 37, doi: 10.3847/0004-637X/823/1/37
- Hodge et al. (2016) Hodge, J. A., Swinbank, A. M., Simpson, J. M., et al. 2016, ApJ, 833, 103, doi: 10.3847/1538-4357/833/1/103
- Hodge et al. (2019) Hodge, J. A., Smail, I., Walter, F., et al. 2019, ApJ, 876, 130, doi: 10.3847/1538-4357/ab1846
- Hunter (2007) Hunter, J. D. 2007, Computing in Science and Engineering, 9, 90, doi: 10.1109/MCSE.2007.55
- Ivison et al. (2020) Ivison, R. J., Richard, J., Biggs, A. D., et al. 2020, MNRAS, doi: 10.1093/mnrasl/slaa046
- Ivison et al. (1998) Ivison, R. J., Smail, I., Le Borgne, J. F., et al. 1998, MNRAS, 298, 583, doi: 10.1046/j.1365-8711.1998.01677.x
- Jarugula et al. (2021) Jarugula, S., Vieira, J. D., Weiss, A., et al. 2021, ApJ, 921, 97, doi: 10.3847/1538-4357/ac21db
- Knudsen et al. (2016) Knudsen, K. K., Richard, J., Kneib, J.-P., et al. 2016, MNRAS, 462, L6, doi: 10.1093/mnrasl/slw114
- Leung et al. (2020) Leung, T. K. D., Olsen, K. P., Somerville, R. S., et al. 2020, ApJ, 905, 102, doi: 10.3847/1538-4357/abc25e
- Litke et al. (2019) Litke, K. C., Marrone, D. P., Spilker, J. S., et al. 2019, ApJ, 870, 80, doi: 10.3847/1538-4357/aaf057
- Marrone et al. (2018) Marrone, D. P., Spilker, J. S., Hayward, C. C., et al. 2018, Nature, 553, 51, doi: 10.1038/nature24629
- Matthee et al. (2017) Matthee, J., Sobral, D., Boone, F., et al. 2017, ApJ, 851, 145, doi: 10.3847/1538-4357/aa9931
- Matthee et al. (2019) Matthee, J., Sobral, D., Boogaard, L. A., et al. 2019, ApJ, 881, 124, doi: 10.3847/1538-4357/ab2f81
- McMullin et al. (2007) McMullin, J. P., Waters, B., Schiebel, D., Young, W., & Golap, K. 2007, 376, 127. http://adsabs.harvard.edu/abs/2007ASPC..376..127M
- Newman et al. (2018) Newman, A. B., Belli, S., Ellis, R. S., & Patel, S. G. 2018, ApJ, 862, 126, doi: 10.3847/1538-4357/aacd4f
- Pentericci et al. (2016) Pentericci, L., Carniani, S., Castellano, M., et al. 2016, ApJ, 829, L11, doi: 10.3847/2041-8205/829/1/L11
- Planck Collaboration et al. (2016) Planck Collaboration, Ade, P. A. R., Aghanim, N., et al. 2016, A&A, 594, A13, doi: 10.1051/0004-6361/201525830
- Rizzo et al. (2021) Rizzo, F., Vegetti, S., Fraternali, F., Stacey, H. R., & Powell, D. 2021, MNRAS, 507, 3952, doi: 10.1093/mnras/stab2295
- Rosolowsky et al. (2021) Rosolowsky, E., Hughes, A., Leroy, A. K., et al. 2021, MNRAS, 502, 1218, doi: 10.1093/mnras/stab085
- Rujopakarn et al. (2019) Rujopakarn, W., Daddi, E., Rieke, G. H., et al. 2019, ApJ, 882, 107, doi: 10.3847/1538-4357/ab3791
- Smit et al. (2018) Smit, R., Bouwens, R. J., Carniani, S., et al. 2018, Nature, 553, 178, doi: 10.1038/nature24631
- Spilker et al. (2015) Spilker, J. S., Aravena, M., Marrone, D. P., et al. 2015, ApJ, 811, 124, doi: 10.1088/0004-637X/811/2/124
- Spilker et al. (2016) Spilker, J. S., Marrone, D. P., Aravena, M., et al. 2016, ApJ, 826, 112, doi: 10.3847/0004-637X/826/2/112
- Spilker et al. (2020) Spilker, J. S., Phadke, K. A., Aravena, M., et al. 2020, ApJ, 905, 85, doi: 10.3847/1538-4357/abc47f
- Straatman et al. (2016) Straatman, C. M. S., Spitler, L. R., Quadri, R. F., et al. 2016, ApJ, 830, 51, doi: 10.3847/0004-637X/830/1/51
- Strandet et al. (2017) Strandet, M. L., Weiss, A., De Breuck, C., et al. 2017, ApJ, 842, L15, doi: 10.3847/2041-8213/aa74b0
- Tacconi et al. (2008) Tacconi, L. J., Genzel, R., Smail, I., et al. 2008, ApJ, 680, 246, doi: 10.1086/587168
- Toft et al. (2017) Toft, S., Zabl, J., Richard, J., et al. 2017, Nature, 546, 510, doi: 10.1038/nature22388
- Vieira et al. (2013) Vieira, J. D., Marrone, D. P., Chapman, S. C., et al. 2013, Nature, 495, 344, doi: 10.1038/nature12001
- Weiß et al. (1999) Weiß, A., Walter, F., Neininger, N., & Klein, U. 1999, A&A, 345, L23. https://ui.adsabs.harvard.edu/abs/1999A%26A...345L..23W/abstract
- Williams et al. (1994) Williams, J. P., de Geus, E. J., & Blitz, L. 1994, ApJ, 428, 693, doi: 10.1086/174279
- Willott et al. (2015) Willott, C. J., Carilli, C. L., Wagg, J., & Wang, R. 2015, ApJ, 807, 180, doi: 10.1088/0004-637X/807/2/180
- Zavala et al. (2018) Zavala, J. A., Montaña, A., Hughes, D. H., et al. 2018, Nature Astronomy, 2, 56, doi: 10.1038/s41550-017-0297-8