Chemical Composition of a Palomar 12 Blue Straggler
Abstract
With the equivalent area of a 16m telescope, ESPRESSO in 4UT mode allows to inaugurate high resolution spectroscopy for solar-type stars belonging to extragalactic globular clusters. We determine the chemical composition of an extragalactic blue straggler. The star has a G magnitude of 19.01 and belongs to the globular cluster Pal12, that is associated to the Sagittarius dwarf galaxy. Abundances are computed by using high resolution spectroscopy and LTE analysis. Two 50 minutes ESPRESSO spectra, co-added, provide a Signal to Noise Ratio of 25 with a resolving power R70000. This allows us to measure with good precision abundance of several (13) elements. Li could help to distinguish between formation models of Blue Stragglers; we are able to set a 3 upper limit of Li=3.1, which is still too high to discriminate between competing models. The abundances we retrieve for the BS are compatible with those of giant stars of Pal 12 published in literature, re-analyzed by us using the same procedure and line list. Small differences are present, that can be ascribed to NLTE effects, but for Mg the BS shows a large under-abundance. The most likely explanation is that the BS atmosphere is dominated by gas processed through the Mg-Al cycle, but we have no suitable Al or Na lines to confirm this hypothesis. We show that ESPRESSO with 4UT can be used to derive precise abundances for solar-type stars fainter than magnitude 19. At these magnitudes a proper sky subtraction is needed and in crowded field the targets must be chosen with outmost care, to avoid contamination of the sky fibre from nearby stars.
keywords:
Stars: local group – Stars: abundances – Stars: cool stars– Stars: Blue Stragglers –Techniques: spectroscopy– ESPRESSO1 Introduction
The availability of the mode “4 UT” for the ESO ESPRESSO high resolution spectrograph (Pepe et al., 2021), by which the light of four 8m telescopes is fed to the spectrograph, opens the opportunity of high resolution spectroscopy of solar-type stars fainter than magnitude 18, in a realistic short amount of observing time. In the context of the “science verification” observations of this mode, in which telescope time is awarded to several projects for a few hours, we observed a Blue Straggler star in the Globular Cluster Palomar 12 (hereafter Pal 12). This cluster orbits the Sgr dwarf spheroidal (Ibata et al., 1995), is metal poor ([Fe/H]-1), and about 30 younger than the classical GCs (Pancino et al., 2010).
Just above the Turnoff (TO) of globular cluster, as a blue extension, are located the Blue Stragglers. Blue Stragglers (BS) have been for years enigmatic objects, and still now their formation mechanism is not fully understood. While, for instance, it is clear that they are the product of a merging, their general abundance pattern is the same as main sequence stars of the cluster they belong to (Shetrone & Sandquist, 2000)and it is debated whether they form as result of collisions between stars in clusters or as a result of mass transfer between, or merger of, the components of short-period binaries. Depending on the formation mechanism, for instance their Li abundance is expected to be around A(Li)=1.0 (Glebbeek et al., 2010). Beside the scientific interest of determining the BS abundances, this work is relevant as a pilot study, to test to which extent it is feasible to derive reliable abundances at these faint magnitudes.
2 Data
The star has been observed with the ESPRESSO spectrograph at the VLT telescope (Pepe et al., 2021) in 4UT-mode. In this mode, all the four 8 meter VLT Unit Telescopes observe the same object and convey the light to the ESPRESSO spectrograph, that is fed by a 16m equivalent aperture telescope. ESPRESSO in this mode provides a resolving power of 70000 and a rather heavy detector binning is needed to reduce the detector noise. The simultaneous spectral coverage is between 380 and 780 nm (Pepe et al., 2021).
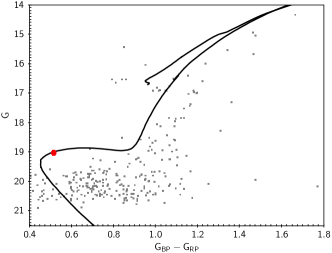
The observed star is S1236 from the (Stetson et al., 1989) list; it is a blue straggler, as it clearly appears from Figure 1 showing the GAIA Colour Magnitude diagram containing all the stars within 5 arcminutes from the cluster center and with proper motions 5.5 milliarcsec/yr. The selected star is enclosed in the red square (GAIA EDR3: source ID=6817951001157440512 , ra=326.6583556251155 , dec=21.259490392923386 Gmag=19.003, Bpmag- Rpmag=0.477, Bpmag-Gmag=0.117.).
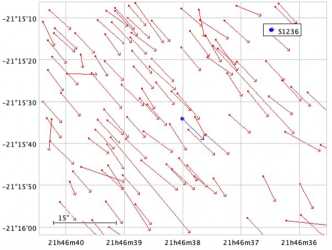
The star has a proper motion of -3.54 and -3.50 milliarcseconds/yr (in and respectively), which is rather well coincident with the mean cluster PM locus, as it appears from the analysis of the GAIA EDR3 stars located within a from the cluster center The overall cluster stars proper motion, calculated from the 532 stars for which GAIA has a measure, is of 4.76 milliarcseconds/yr, while the star has 4.98, well within the 0.9 milliarcseconds/yr dispersion of the cluster’ stars. The Figure 2 in which the proper motions and positions of the stars at the very center of Pal 12 are represented, shows how our target shares the same velocity flux in module and direction as most of the other stars.
Three 55 minutes ESPRESSO spectra were acquired between September 2 and September 4 2019. Of the two ESPRESSO fibres, one was devoted to the object, the second dedicated to record the sky. The data have been reduced using the ESPRESSO pipeline. The spectra we acquired with high detector binning (8x4 pixels), in order to minimize the impact of the detector Read Out Noise, and were reduced using the public version 1.3.2 of the ESPRESSO data reduction pipeline and the ESOReflex workflow, with default parameters, optimised for this instrument setting (www.eso.org/pipelines).
The ESPRESSO data reduction involves the following stages, executed as a chain:
-bias frames are processed to create a master frame and a determine the residuals, that is used in the recipes that process data with low signal to remove any residual structure present in the bias; similarly, master dark frames to obtain a map of the hot pixels;
-led flat frames (obtained illuminating the fibre with a led) are processed to map non-linear pixels; order tracing flats are used to trace the fibres location;
-flat fibre flats are used to obtain the fibre order profile (used to perform the optimal extraction), the order by order spectrum of the extracted flat (A and B) fibers, and the blaze functions;
-contamination frames obtained with only one fibre illuminated by a calibration, to determine the contamination between the two fibres
-twilight spectra are used to compute the relative efficiency between the two fibres.
A three steps wavelength calibration (using Fabry-Perot etalon and Th-A lamp) follows as well as flux calibrations. Separate object and sky spectra are generated for each exposure.
The sky spectra reveal that the third exposure was rather heavily contaminated by another stellar source, and at the end we have opted not to use this observation, because it was not possible to determine confidently the level of sky contamination. It has to be noted that for the other two exposures the sky counts are about 20 of the object flux, a not negligible quantity, and a wrong subtraction would produce substantial errors in the measured abundances, because it would deepen (or shallow) artificially the stellar absorption lines. In crowded fields the presence of nearby objects should be carefully checked when observing with ESPRESSO, because the distance between the object and the sky fibres is fixed to seven arcseconds, and the sky orientation cannot be chosen. In addition, the geometry of the projection on the sky is different for the four UT telescopes. When summing all of these effects the strong recommendation is to avoid targets having nearby stars around the 7 arcseconds distance, and to this purpose a circle indicating the sky fibre radius has been now added to the observing preparation tool for ESPRESSO.
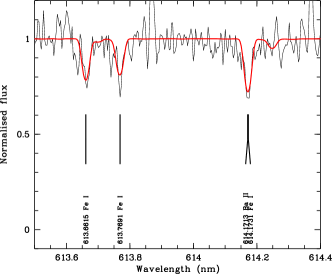
The typical signal level of the extracted spectra is of about 600 photoelectrons; the sky has been subtracted after passing an heavy smoothing, to avoid to decrease the S/N ratio of the stellar spectrum. The two 55 minutes spectra have been finally co-added, and the S/N ratio ranges between 20 and 25 in the continuum in the visible and red portion of the spectrum. A portion of the final co-added spectrum is shown in Figure 3, together with our fit.
The stellar radial velocity (RV), as measured separately in our two exposures by fitting the photospheric lines, is of 27.98 0.3 Km/s, in very good agreement with the Pal 12 RV of 28.5 km/sec, as measured by Cohen (2004) on giant stars, confirming that the star belongs to the cluster.
3 Atmospheric parameters, stellar rotation and chemical abundances
To determine the atmospheric parameters we used the Gaia EDR3 colour and a Parsec isochrone (Bressan et al. 2012) of age 3.66 Gyr and metallicity .
The isochrone was reddened for E(B-V) = 0.02, as appropriate for Pal 12 Stetson et al. (1989). By interpolating in the isochrone, for the observed , we derived = 7042 K and log g = 3.95 (c.g.s. units). Taking into account the photometric uncertainty 0f 0.028 mag on the colour the error on is 125 K and 0.07 dex on log g. Given the low S/N ratio we decided to keep fixed and log g and to determine the abundances from the analysis of the spectrum, see also (Mucciarelli & Bonifacio, 2020) for a discussion of the use of photometric versus spectroscopic atmospheric parameters. We assumed a microturbulent velocity , as done by Lovisi et al. (2010) in their study of Blue Stragglers in M 4, as several of their stars have parameters close to those of our target. The S/N of the spectra does not allow us to determine microturbulence in a robust way, especially because we can measure too few lines on the linear part of the curve-of-growth.
The lines appear to be clearly too broad for the resolving power delivered by the spectrograph. We attribute this to a non-negligible stellar rotation, which is observed in some blue stragglers (see e.g. Lovisi et al., 2010, and references therein). In order to estimate this broadening we measured the Full Width Half Maximum (FWHM) for a set of 73 Fe i lines, selected to be not blendend nor heavily saturated. The same set of lines was measured on synthetic spectra that were rotationally broadened by, 6,8,10,12,14 and then broadened with a gaussian of 4.28 FWHM, to take into account the instrumental profile. For each line we interpolated in the set of 5 values of FWHM measured on the synthetic spectra to obtain one estimated value of rotational velocity. Before averaging the derived rotational velocities we removed all those that would be extrapolating outside the interval 6-14 . The mean rotational velocity so obtained is of 8.44 .
The spectral analysis has been carried on using the MyGIsFOS program (Sbordone et al., 2014) and a grid of synthetic spectra computed with SYNTHE an a grid of model atmospheres computed with ATLAS 9 (Kurucz, 2005). We used the atomic line list compiled by Heiter et al. (2021), molecular lines from Bob Kurucz’s site 111http://kurucz.harvard.edu/molecules/old/. except for CH lines that were taken from Masseron et al. (2014).The grid spectra were individually rotationally broadened by 8.44 and the whole grid was broadened with a gaussian profile of 4.28 FWHM. Table 1 reports the abundance values retrieved. The line-to-line scatter for most elements having more than one measured line is compatible with the S/N ratio of the spectrum. For Li we could only derive a three upper limit of 23.7 mÅ, that corresponds to an upper limit of log (Li/H) +12 3.1.
| Element | A(X)⊙ | N(lines) | A(X) | [X/H] | |
|---|---|---|---|---|---|
| Mg i | 7.54 | 3 | 6.20 | 0.13 | |
| Si i | 7.52 | 1 | 6.85 | ||
| Ca i | 6.33 | 19 | 5.44 | 0.16 | |
| Sc ii | 3.10 | 3 | 2.09 | 0.36 | |
| Ti i | 4.90 | 5 | 4.26 | 0.23 | |
| Ti ii | 4.90 | 27 | 4.15 | 0.25 | |
| Cr i | 5.64 | 9 | 4.84 | 0.31 | |
| Cr ii | 5.64 | 5 | 4.57 | 0.28 | |
| Mn i | 5.37 | 3 | 4.49 | 0.02 | |
| Fe i | 7.52 | 136 | 6.52 | 0.28 | |
| Fe ii | 7.52 | 21 | 6.35 | 0.23 | |
| Ni i | 6.23 | 6 | 5.24 | 0.15 | |
| Sr ii | 2.92 | 1 | 1.55 | ||
| Y ii | 2.21 | 2 | 1.08 | 0.34 | |
| Zr ii | 2.62 | 1 | 2.16 | ||
| Ba ii | 2.17 | 1 | 1.14 |
| This paper | Cohen (2004) | ||||||||
| = 4033 | = 4000 | ||||||||
| = 0.74 | = 0.84 | ||||||||
| Element | A(X)⊙ | N(lines) | A(X) | [X/H] | N(lines) | A(X) | [X/H] | ||
| This paper | Cohen (2004) | ||||||||
| Na i | 6.30 | 4 | 4.91 | 0.05 | 4 | 5.01 | –1.29 | 0.16 | |
| Mg i | 7.54 | 1 | 6.89 | 2 | 6.85 | –0.69 | 0.11 | ||
| Si i | 7.52 | 16 | 6.60 | 0.18 | 13 | 6.78 | –0.74 | 0.16 | |
| Ca i | 6.33 | 9 | 5.43 | 0.05 | 14 | 5.31 | –1.02 | 0.22 | |
| Sc i | 3.10 | 1 | 1.97 | 6 | 2.25 | –0.85 | 0.16 | ||
| Sc ii | 3.10 | 6 | 2.11 | 0.18 | |||||
| Ti i | 4.90 | 46 | 4.01 | 0.11 | 28 | 4.05 | –0.85 | 0.16 | |
| Ti ii | 4.90 | 15 | 3.91 | 0.29 | 5 | 4.19 | –0.71 | 0.13 | |
| V i | 4.00 | 22 | 2.93 | 0.23 | 9 | 2.79 | –1.21 | 0.20 | |
| Cr i | 5.64 | 19 | 4.63 | 0.13 | 6 | 4.89 | –0.75 | 0.23 | |
| Cr ii | 5.64 | 3 | 4.64 | 0.19 | |||||
| Mn i | 5.37 | 3 | 4.22 | 0.08 | 2 | 4.31 | –1.06 | 0.09 | |
| Fe i | 7.52 | 171 | 6.49 | 0.19 | 131 | 6.72 | –0.80 | 0.23 | |
| Fe ii | 7.52 | 7 | 6.62 | 0.15 | 9 | 6.81 | –0.71 | 0.19 | |
| Co i | 4.92 | 17 | 3.72 | 0.21 | 4 | 3.80 | –1.12 | 0.28 | |
| Ni i | 6.23 | 55 | 5.02 | 0.20 | 22 | 5.24 | –0.99 | 0.17 | |
| Cu i | 4.21 | 2 | 2.46 | 0.13 | 2 | 3.55 | –0.66 | 0.16 | |
| Zn i | 4.62 | 2 | 3.01 | 0.08 | 2 | 3.16 | –1.46 | 0.16 | |
| Y ii | 2.21 | 9 | 0.92 | 0.25 | 2 | 0.84 | –1.37 | 0.52 | |
| Zr i | 2.62 | 8 | 1.55 | 0.23 | 3 | 1.52 | -1.10 | 0.06 | |
| Zr ii | 2.62 | 1 | 2.40 | ||||||
| Mo i | 1.92 | 3 | 1.39 | 0.39 | |||||
| La ii | 1.14 | 12 | 0.46 | 0.18 | 2 | 0.55 | –0.59 | 0.01 | |
| Ce ii | 1.61 | 3 | 0.40 | 0.26 | |||||
| Pr ii | 0.76 | 1 | -0.13 | ||||||
| Nd ii | 1.45 | 31 | 0.75 | 0.35 | 2 | 1.02 | –0.43 | 0.26 | |
| Sm ii | 1.00 | 7 | 0.22 | 0.34 | |||||
| Eu ii | 0.52 | 1 | 0.65 | 1 | 0.30 | -0.22 | |||
4 Comparison with the abundances in a Red Giant Branch star
In order to compare the chemical composition of the BS star 1336 with that of other stars in the cluster we retrieved from the Keck Archive the two spectra of the RGB star 1118 obtained by J. Cohen and whose analysis has been published in Cohen (2004). The spectra were co-added and processed with MyGIsFOS (Sbordone et al., 2014),using a grid of synthetic spectra adequate for this giant, based on ATLAS 12 model atmospheres and the same atomic and molecular data input as for the grid used to analyse the BS S1336.
We derived effective temperature and surface gravity from a Parsec isochrone (Bressan et al., 2012) and Gaia EDR3 photometry, as done for the BS star. The adopted parameters are = 4033 K and log g = 0.74, very close to the values derived by Cohen (2004) for this star. We also adopted the same microturbulent velocity of 1.8 as Cohen (2004).
The results of our analysis are summarised in Table 2. Our abundances for this star are generally in good agreement with those of Cohen (2004).
One strongly discrepant element is the Cu abundance (-1.09 dex difference between Cohen and our analysis), however this can be understood since in our analysis we have taken into account Hyperfine Splitting and Isotopic structure of the Cu i lines. This causes the line to de-saturate, thus producing for the same equivalent width a much lower abundances. Our Cu abundance is based on the 578.212 nm line and the 510.554 nm line like Cohen (2004). It is worth noting as our value is much closer to the average Cu in Pal12 of Cohen (2004), who indeed indicated Hyperfine Splitting as the likely cause of the large scatter of Cu abundance in her sample.
Finally, Fe differs by 0.23 dex, an amount that could seem quite large, however note that our measurement and that of Cohen (2004) are in agreement to better than 1 , thus fully consistent. Our analysis provides as well reasonably close values for Fe i and Fe ii. The difference with Cohen (2004) can be attributed to the choice of the Fe lines measured and to the adopted log gf values.
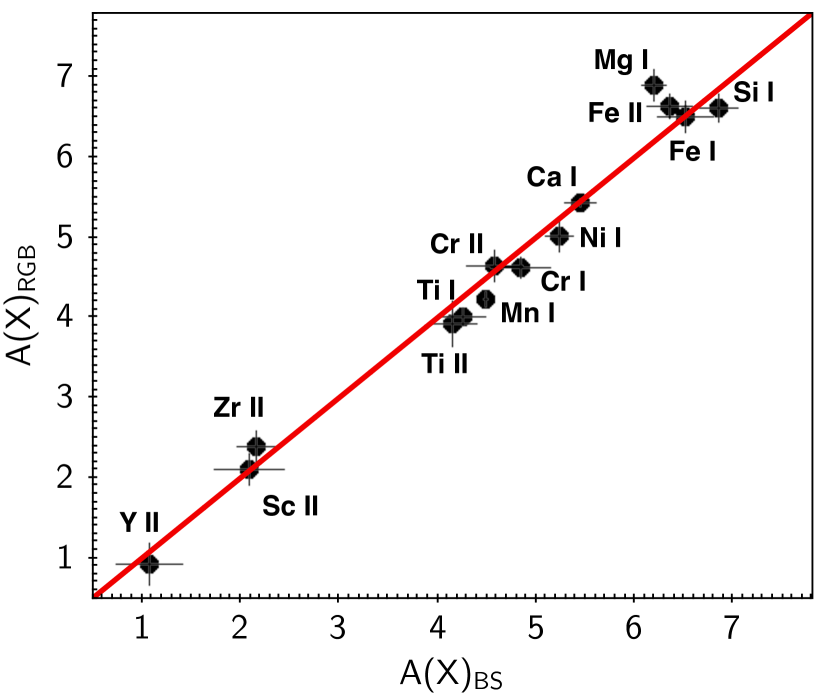
The analysis of the giant star 1118 is useful to set the comparison between the BS abundance and the cluster abundance on the same scale. In Fig. 4 the abundances measured in the Blue Straggler (BS) with those of the Red Giant Branch (RGB) star are compared. For all elements the agreement is good or very good, with the exception of Mg. Mg in the BS is 0.5 dex lower than in the RGB star. It is true that the abundance in the RGB star is based on only one line, yet our Mg abundance is in excellent agreement with that of Cohen (2004) (that is based on two lines) for this star and also with the average value of Pal12. The three Mg lines used in our BS spectrum provide very consistent abundances, so we are confident that also the BS Mg determination is robust.
It is unlikely that the difference is due to differential NLTE effects in the BS and in the giant, according to the NLTE computations of (Mashonkina, 2013) and (Alexeeva et al., 2018) a star with of K is barely affected by NLTE for the lines we used, and similarly, for the metal poor, cool giant Arcturus the difference between LTE and NLTE abundance is less than 0.1 dex. Still, It would be desirable to perform dedicated NLTE computations for this case, to completely rule out this possibility.
Another minor discrepancy is that of Mn (0.27 dex), which, however, could be due to differential 3D NLTE effects between the BS and the RGB. This is suggested by the 3D NLTE computations of Bergemann et al. (2019, see their figure 17). Again specific computations for these stellar models would be helpful to confirm it. BS and of the giant are comparable, in spite the BS being more than 4 magnitudes fainter.
5 Discussion & summary
The study of stars close to the TO of globular clusters has been proven to be fundamental to determine the nature of these fascinating objects. Chemical abundances are close to pristine in these stars, while they can change in red giants during the course of the stellar evolution; in addition, our spectroscopic analysis may suffer of different biases and limitations for stars in different regimes of gravity and effective temperature. We can therefore learn a lot from the determination of the chemical composition of stars close to the TO, and we have analysed several elements in a Blue Straggler belonging to the globular cluster Pal 12, associated to the Sagittarius Galaxy. The star is very faint (G=19.01) and to obtain this we have used ESPRESSO in the 4UT mode configuration, that provides a 16m equivalent telescope. We have analysed the spectrum a Pal 12 giant previously observed with Keck-HIRES to compare the abundances of the BS with those of the Pal 12 cluster, derived with the same method and lines GFs. The single abundances have comparable internal uncertainties and agree very well between the two stars, showing that the BS shares for most elements the Pal 12 abundance. Only Mg shows a strong discrepancy, with a lower abundance in the BS by 0.5 dex. Although NLTE effects cannot be completely excluded, they are very unlikely according to present calculations for similar stars and it is possible that the BS is indeed Mg-poor. Since there is no theoretical expectation for this to happen, we expect that the BS atmosphere is dominated by material processed in the Mg-Al cycle. Unfortunately we have no suitable Al or Na lines to compute their abundance and verify this hypothesis. Low Mg could be produced either by the merging of two ’second population’ stars, or by mass transfer from a close companion during the AGB phase. Lithium abundance could help to discriminate between different formation mechanisms of BS, but the 3 abundance of Li3.1 we obtain, is too high to derive a conclusion.
Acknowledgements
LPA acknowledges the scientific hospitality of the Arcetri Observatory. This research has made use of the Keck Observatory Archive (KOA), which is operated by the W. M. Keck Observatory and the NASA Exoplanet Science Institute (NExScI), under contract with the National Aeronautics and Space Administration. This work has made use of data from the European Space Agency (ESA) mission Gaia (https://www.cosmos.esa.int/gaia), processed by the Gaia Data Processing and Analysis Consortium (DPAC, https://www.cosmos.esa.int/web/gaia/dpac/consortium). Funding for the DPAC has been provided by national institutions, in particular the institutions participating in the Gaia Multilateral Agreement.
Data Availability
The ESPRESSO spectra are publicly available in the ESO archive, the Keck spectra are available from Keck Observatpry Archive
References
- Alexeeva et al. (2018) Alexeeva S., Ryabchikova T., Mashonkina L., Hu S., 2018, ApJ, 866, 153
- Bergemann et al. (2019) Bergemann M., et al., 2019, A&A, 631, A80
- Bressan et al. (2012) Bressan A., Marigo P., Girardi L., Salasnich B., Dal Cero C., Rubele S., Nanni A., 2012, MNRAS, 427, 127
- Cohen (2004) Cohen J. G., 2004, AJ, 127, 1545
- Glebbeek et al. (2010) Glebbeek E., Sills A., Hu H., Stancliffe R. J., 2010, in Kalogera V., van der Sluys M., eds, American Institute of Physics Conference Series Vol. 1314, International Conference on Binaries: in celebration of Ron Webbink’s 65th Birthday. pp 113–119, doi:10.1063/1.3536352
- Heiter et al. (2021) Heiter U., et al., 2021, A&A, 645, A106
- Ibata et al. (1995) Ibata R. A., Gilmore G., Irwin M. J., 1995, MNRAS, 277, 781
- Kurucz (2005) Kurucz R. L., 2005, Memorie della Società Astronomica Italiana Supplementi, 8, 14
- Lovisi et al. (2010) Lovisi L., et al., 2010, ApJ, 719, L121
- Mashonkina (2013) Mashonkina L., 2013, A&A, 550, A28
- Masseron et al. (2014) Masseron T., et al., 2014, A&A, 571, A47
- Mucciarelli & Bonifacio (2020) Mucciarelli A., Bonifacio P., 2020, A&A, 640, A87
- Pancino et al. (2010) Pancino E., Rejkuba M., Zoccali M., Carrera R., 2010, A&A, 524, A44
- Pepe et al. (2021) Pepe F., et al., 2021, A&A, 645, A96
- Sbordone et al. (2014) Sbordone L., Caffau E., Bonifacio P., Duffau S., 2014, A&A, 564, A109
- Shetrone & Sandquist (2000) Shetrone M. D., Sandquist E. L., 2000, AJ, 120, 1913
- Stetson et al. (1989) Stetson P. B., Vandenberg D. A., Bolte M., Hesser J. E., Smith G. H., 1989, AJ, 97, 1360