A Network-Based Explanation of Inequality Perceptions
Abstract
Across income groups and countries, individual citizens perceive economic inequality spectacularly wrong. These misperceptions have far-reaching consequences, as it might be perceived inequality, not actual inequality informing redistributive preferences. The prevalence of this phenomenon is independent of social class and welfare regime, which suggests the existence of a common mechanism behind public perceptions. The literature has identified several stylised facts on how individual perceptions respond to actual inequality and how these biases vary systematically along the income distribution. We propose a network-based explanation of perceived inequality building on recent advances in random geometric graph theory. The generating mechanism can replicate all of aforementioned stylised facts simultaneously. It also produces social networks that exhibit salient features of real-world networks; namely, they cannot be statistically distinguished from small-world networks, testifying to the robustness of our approach. Our results, therefore, suggest that homophilic segregation is a promising candidate to explain inequality perceptions with strong implications for theories of consumption and voting behaviour.
Keywords: Homophily, network, inequality, perception, random geometric graph.
1 Introduction
Conventional modern macroeconomics has long recognised the crucial relevance of expectations and belief-formation for aggregate dynamics (Galí 2015). In particular, beliefs about economic inequality and perceptions of social hierarchy can inform individuals in such diverse fields as consumption decisions (Duesenberry 1949; Veblen 1899 [2001]; Frank et al. 2014), redistributive preferences and voting behaviour (Gimpelson & Treisman 2018; Kim et al. 2018; Choi 2019) or subjective well-being and ethical convictions (Kuhn 2019; Clark & Senik 2010). Even in the most sophisticated behavioural models, belief-formation is, however, typically either assumed to be atomistic (Gabaix 2020) or does not systematically account for the impact of individual embeddedness within heterogeneous social contexts on those beliefs, even if social interaction is explicitly modelled (Flieth & Foster 2002; Lux 2009). We propose a parsimonious network-based model for the interaction of macro-level inequality, micro-level beliefs and the mediating effects of heterogeneous social contexts. In contrast to the assumption of deductive reasoning in orthodox models, we build on the empirically well-established notion that economic agents reason inductively and generalise from finite samples. Recent theoretical and empirical work has demonstrated the potency of this approach in explaining phenomena in such diverse fields as human probability assessment (Sanborn & Chater 2016; Chater et al. 2020) or regional inequality (Collier & Tuckett 2020). The model is both consistent with several stylised facts about inequality perceptions and the micro-level evidence on the composition of social networks.
The relevance of individual beliefs is perhaps best exemplified by spelling out its political economy implications. Across income groups and countries, the public perception of economic inequality and many other macroeconomic variables is empirically wrong, often spectacularly so. Errors in those beliefs might be due to conceptually different problems: uninformed beliefs or misinformed beliefs (Kuklinski et al. 2000). Uninformed voters are ignorant about the actual state of affairs, while misinformed voters’ beliefs are consistently deviating from it in one direction. The distinction is a crucial one. Uninformed voters’ beliefs would cluster around the actual state of affairs and, with no systematic deviations, be correct in expectations. For uninformed voters, we only need one informed voter to tip elections under majority rule into the correct direction; a majority of ignorant individuals might nevertheless vote for the correct policy, which is now known as the ’miracle of aggregation’ (Page & Shapiro 1993). However, his miraculous aggregation breaks down when we consider misinformed rather than uninformed voters with beliefs that are no longer randomly distributed but consistently tend in a (false) direction (Caplan 2011). The type of error in perceptions is thus intimately linked to the efficacy of democratic systems. For inequality perceptions, beliefs appear to be indeed the result of misinformation in this technical sense and they are consistently biased across income groups and welfare regimes.
In contrast to much of the behavioural literature, we refrain from ad-hoc assumptions about possible biases, e.g., assuming that individuals tend to perceive themselves in the middle of social hierarchies (cf., e.g. Knell & Stix 2020). Instead, we assume unbiased information processing capabilities for all the economic agents. Information is, however, asymmetric and agents form estimates about aggregate variables according to their local information. We show that a parsimonious process can generate sufficiently skewed information sets to replicate the aforementioned stylised facts and generate perceived inequality levels that are quantitatively in line with recent empirical evidence for a large sample of OECD countries (Choi 2019). In essence, we assume that agents (correctly) observe inequality within their local social network and (correctly) form estimates about the total population from them but still generate biased perceptions due to their network contacts not being representative for the overall population. Employing a new variant of a random geometric graph network, the assumption of income homophily alone can generate substantial misperception in line with the empirical evidence. The derived network topology also corresponds to empirically observed social networks across the world and features a small-world structure. Given the ubiquity of these topological features, our homophilic process appears to be a plausible candidate to explain the equally ubiquituous inequality misperceptions.
Our contribution is thus threefold: Firstly, we compile a list of four stylised empirical facts about income inequality and its biased perception from the nascent literature on the matter. Secondly, we develop a model that simultaneously replicates these stylised facts building on homophilic linkage and unbiased individual estimates based on local signals. Our model is quantitatively consistent with empirical estimates regarding both the input income distribution and the output perceptions, in contrast to the somewhat stylised models in the extant literature that also fail to replicate the dynamic behaviour of perceptions in response to changes in actual inequality. Thirdly, the network-formation algorithm presents a novel way of generating random geometric graph types of networks which is more intuitive for many application scenarios and allows specifying a minimum degree.
The remainder of this paper is organised as follows: Section 2 extracts four stylised empirical facts about inequality perception; furthermore, it reviews the evidence on empirical network topologies and individual belief formation within networks. Section 3 introduces the basic model of homophilic graph formation, reviews the main mechanisms generating heterogeneity in information sets, abd validates the model. Section 4 presents our analytic and simulative results, shows that they are consistent with the outlined stylised facts regarding network topologies as well as inequality perceptions and derives some important implications regarding heterogeneous segregation patterns across the income distribution. Section 5 concludes and discusses several promising avenues for further research, especially regarding consumption dynamics and voting behaviour.
2 Related Literature
Our model joins three different strands of literature. Empirical findings on inequality perceptions that a single theory or model has not yet explained constitute its main explanandum. As explanans, we develop a network model featuring the current state of research into both the social network structure of empirical networks, mainly their homophily and small-world character, and individual perceptions in networks. The family of random geometric graphs constitutes the third strand of literature as a promising methodological choice in Section 3.
2.1 Stylised Facts on Inequality Perceptions and Middle Class Bias
The empirical literature has identified four particular stylised facts for any theory of perceived inequality to be evaluated against: Irrespective of their objective status, all individuals perceive themself to be in the middle of the social hierarchy (Kelley & Evans 1995; Evans & Kelley 2004); as an immediate corollary of , poor individuals overestimate their social position, rich individuals tend to underestimate it (Knell & Stix 2020); poor individuals tend to perceive inequality to be higher and are closer to objective inequality on average (Osberg & Smeeding 2006; Newman et al. 2018) and the evolution of objective inequality is detached from the evolution of subjective inequality, that is, increases in objective inequality do not necessarily increase perceived inequality (Kenworthy & Mccall 2008; Bartels 2018; Gimpelson & Treisman 2018; Hvidberg et al. 2020). The ubiquity of misperceptions across states and welfare regimes calls for a common mechanism independent of differences in actual inequality or institutional framework.
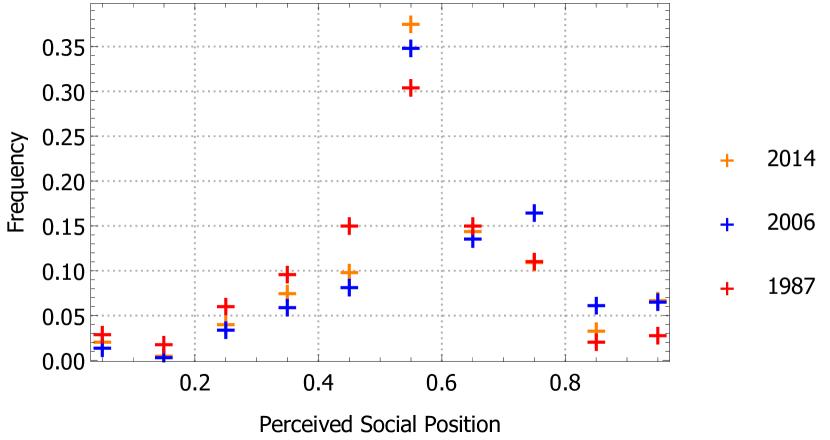
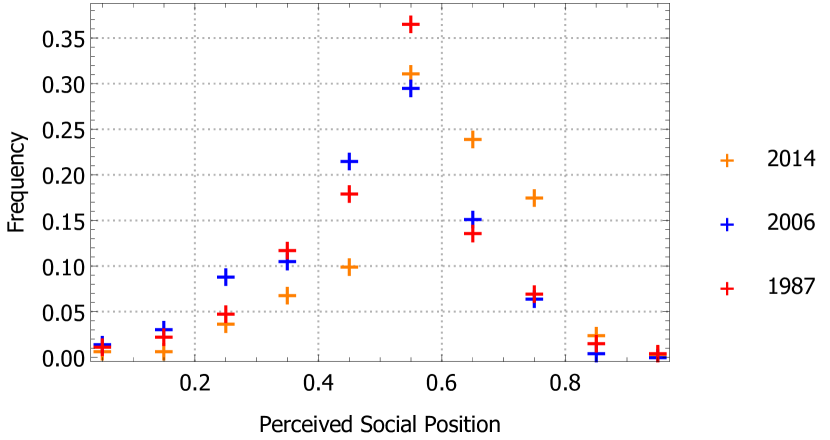
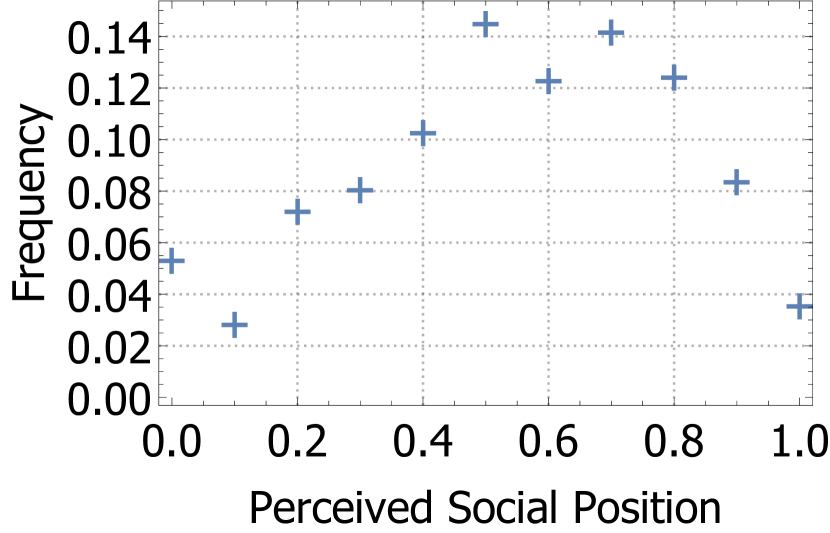
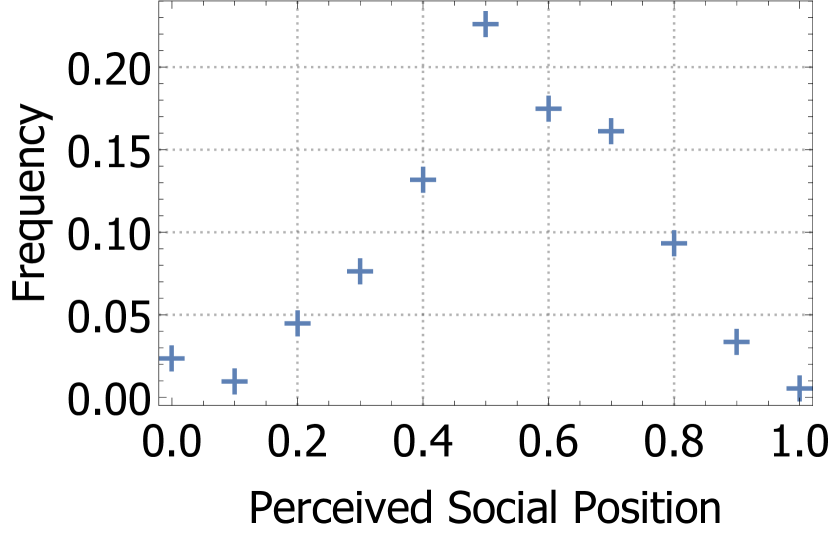
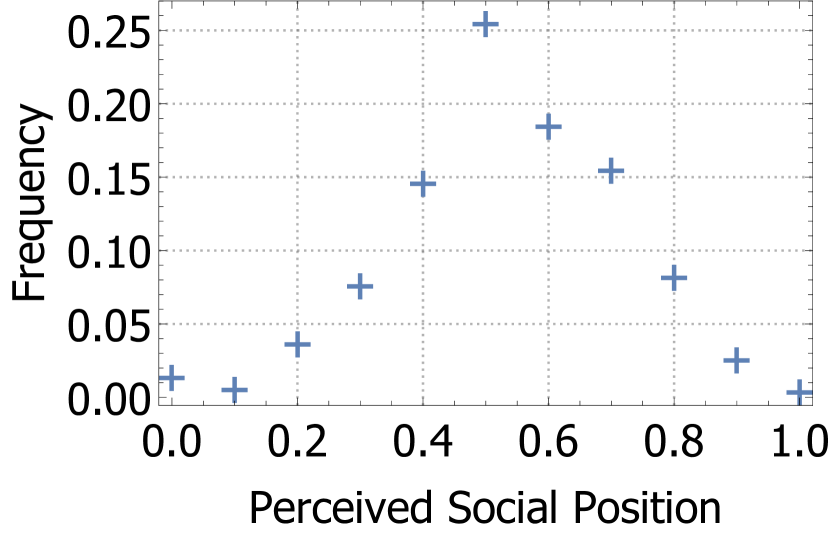
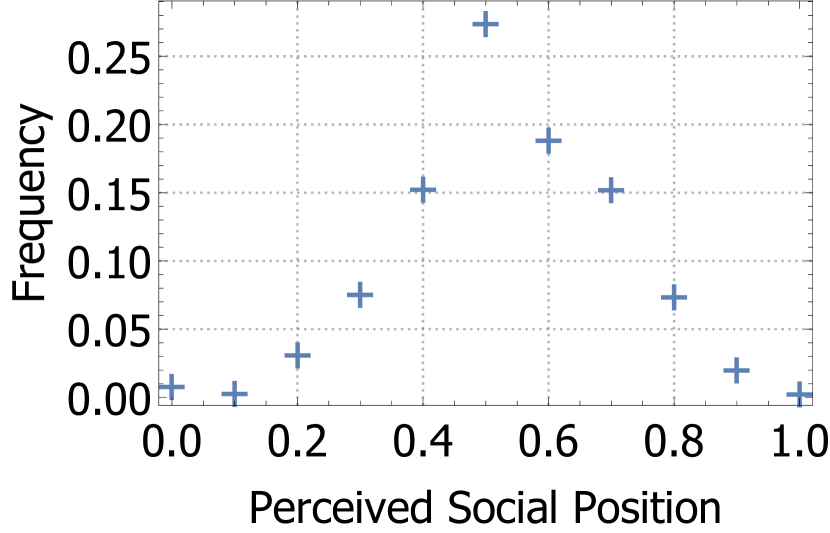
By way of illustration, we show the empirical frequency of self-perceptions to enable comparisons to the model output in Section 4 for stylised fact (i). The data shows the empirical frequency distributions of self-reported income deciles for Germany and the US from the , and wave of the ISSP Group (2016).111We included exactly these years, since they represent the first, last and median waves of available data. Typically, Germany is considered to be the epitome of a coordinated market economy, while the US represents a liberal market economy (Hall & Soskice 2001). By contrast, the qualitatively similar densities for both countries show that the mechanism behind misperceptions should be independent of the specific welfare regime. Especially the ‘middle class bias’ in the self-perceptions is rather striking. For a representative survey like the ISSP, each decile should, per construction, include exactly of observations and the frequency densiy should therefore exhibit a uniform density at . Instead, the frequencies display a marked peak at the middle categories, i.e., most Germans and most Americans tend to think they are middle class, even though they are objectively not. This finding holds for all considered countries in the ISSP and all considered years, apart from the three periods and two countries we selected for illustrative purposes (Choi 2019).222The other empirical frequencies are available upon request. Notice, however, that the qualitative middle class bias manifests itself in quantitatively rather different frequencies throughout time and between countries. We focus on the phenomenon that is common to all considered densities, i.e., the qualitative middle class bias and leave the direct quantitative calibration of our model for further research. We find this middle class bias to be the major driver of our results, implying the other stylised facts (ii) – (iv) directly but emerging endogenously in our network model. The relevant features of this network are discussed in the subsection below.
2.2 Empirical Social Networks
Empirical networks exhibit ubiquitous and salient features that can serve as stylised facts to guide the validation of proposed theoretical graph formation processes. Probably the most prominent one is the small-world property, indicating that paths between nodes in real-world social networks are unexpectedly short. At the same time, those networks also feature high degrees of clustering. Small-worldiness has obvious implications for any contagion process, be it rumours, diseases or information, where contagion across the whole network happens much faster than our intuition would suggest (Watts 1999; Moore & Newman 2000; Kleinberg 2001). The empirical research has identified small-world features across many different social groups, including friendship networks in schools (Weeden & Cornwell 2020), corporate board networks (Kogut & Walker 2001; Borgatti & Foster 2003; Davis et al. 2003; Conyon & Muldoon 2006; Galaskiewicz 2007) and scientific and artistic collaboration (Watts & Strogatz 1998; Newman 2001; Uzzi & Spiro 2005). Given this ubiquity, it appears safe to say that a graph-generating process for social networks needs to simultaneously produce low average path lengths and large degrees of clustering to be consistent with this stylised fact.
We situate our model in the random graph literature, where graph formation happens according to a stochastic process and is not the result of deliberate optimisation. Random graphs have been very successful in replicating structural stylised facts about network topologies, with the Watts-Strogatz model famously able to replicate those small-world properties (Watts & Strogatz 1998). Since the graph-generating process is, however, stochastic in nature, it does not feature explicit behavioural microfoundations. Therefore, we extend the purely stochastic notion with a behavioural ingredient, notably, that link-formation is homophilic.
First introduced by Lazarsfeld et al. (1954), another salient feature of empirical social networks is homophily, the tendency of similar individuals to connect with each other. This tendency is not only an empirical curiosum but has relevant theoretical implications, e.g., for information transmission, where homophilic segregation can severely slow the speed of learning (Golub & Jackson 2012) or diminish the attention members of minority groups receive (Karimi et al. 2018). The similarity can come in many dimensions such as gender, ethnicity or socio-economic status (McPherson et al. 2001). We focus on the latter in the narrow sense of economic homophily, which is empirically well-established. One strand of literature focuses on friendship networks in schools and colleges and provides evidence significant homophily according to income or social class (Cohen 1979; Huckfeldt 1983; Mayer & Puller 2008; Boucher 2015; Malacarne 2017).
Even one of the earliest contributions in the field, however, shows that homophily in socio-economic status is not fixed in time and varies with cultural norms and the importance of class distinctions (Cohen 1979). In light of this result, it appears unsurprising that we find considerable variation in implied degrees of country-level homophily in our model, perhaps reflecting cultural norms not in the structure but the degree of the graph formation process. Even for a constant degree of (economic) homophily, increasing inequality also increases segregation in the population, as then the relative distances in incomes increase and agents becoming more selective in choosing links. For geographical segregation, this effect is empirically documented (Reardon & Bischoff 2011; Chen et al. 2012; Tóth et al. 2021), testifying indirectly to the relevance of homophily as a graph-generating feature. Homophily in income also exists in social media friendship networks (Lewis et al. 2012, for a large sample of Facebook friends), where spatial segregation should not confound findings and becomes apparent in the choice of romantic partners, typically under the label of ‘homogamy’ (Kalmijn 1991; Kalmijn & Flap 2001). Finally, a very recent contribution by Cepić & Tonković (2020) for a representative sample of Croatian adults finds evidence for homophilic tie formation according to social class and income, with however considerable variability in cross-class ties, hinting at possible confounding factors we aim to capture with a parsimonious stochastic process. Importantly, Cepić & Tonković (2020) show that there is also strong variation in cross-class ties, though, which we show might be crucial for unbiased individual inference. A major predictor is there shown to be cross-class sociability is political participation which would, in our model, amount to the prediction that politically active individuals are also better informed on average which is indeed perfectly in line with the evidence (Campbell 2013, for a recent survey).
2.3 Belief Formation in Networks
The literature on belief formation itself appears to be much more scarce than the literature on the effects of perceptions and misperceptions. While very different in detail, the two currently dominant theories of public opinion formation suggest that the beliefs an individual holds are in a broad sense averages over the idiosyncratic messages they receive (Zaller 1992; Lodge et al. 1995).333Cf. Stevenson & Duch (2013) for a summary on those views. This literature has focused on the specific ‘averaging’ individuals use to process their information sets. Regarding perception formation about societal inequality, there exist to the best of our knowledge only two analytical models so far, namely Knell & Stix (2020) and Iacono & Ranaldi (2021). Both derive biased perceptions under very restrictive assumptions, though, and need to impose some kind of ‘biased averaging’. Knell & Stix (2020) assume that agents form subjective income densities over the whole support of possible income levels but let these densities be self-centered such that the mode of the distribution corresponds to their respective own incomes. While they partially succeed in replicating the four stylised facts on inequality perceptions at least qualitatively, their assumption essentially imposes the middle-class bias of stylised fact (i) ex ante and not as an emergent outcome from first principles. Iacono & Ranaldi (2021) also impose potentially biased perceptions and assume that agents only observe their own incomes as well as the minimum and maximum incomes. They continue to derive several important results on voting behaviour and show that information treatments on inequality might alter preferences for redistribution, therefore qualitatively replicating this stylised fact from the empirical literature. While the notion of local information sets appears appealing, using only the minimum, maximum and own income strikes us as unnecessarily artificial and implausible. Most importantly, being static, both models fail to make sense of the - arguably most relevant - stylised fact (iv), i.e., inequality perceptions being very persistent and not responding to changes in actual inequality. Our model is featuring this persistence by exploiting the fact that rising inequality also features rising segregation, as is also empirically established for geographical segregation (cf. the evidence discussed in subsection 2.2).
We develop on the notion that information is local but assume unbiased processing with skewed information sets as implied by the well-documented homophilic social network formation on which we expand in Section 3. The psychological literature on ‘social comparison theory’ (Festinger 1954) supports the notion that individual self-perceptions are much more responsive to local knowledge about small groups than to information about aggregates, e.g., knowing the population average (Buckingham & Alicke 2002; Zell & Alicke 2009; Alicke et al. 2010). Thus, belief formation about inequality appears to be indeed primarily based on local knowledge. This does not imply, however, that informational treatments in the form of reported averages do not change beliefs at all. Providing information about the actual degree of inequality seems to exhibit a significant effect on redistributive preferences for Argentina, Sweden and the US (Cruces et al. 2013; McCall et al. 2017; Karadja et al. 2017), with however small and insignificant effects for Germany (Engelhardt & Wagener 2018). Finally, two recent studies for the whole of Europe and Denmark separately demonstrate that individuals indeed tend to know the income levels of their immediate friends and family rather well, with non-negligible effects on inequality and fairness perceptions as well as perceived social positions (Clark & Senik 2010; Hvidberg et al. 2020).
Apart from this indirect evidence from informational treatments, there also exist several studies that measure the impact of local exposure to inequality on perceptions and redistributive preferences directly, therefore offering also direct evidence for our proposed mechanism.444We thank an anonymous reviewer for this hint and the helpful references. Thal (2017) demonstrates using a large-scale survey (Soul of the Community (SOTC)) that affluent Americans’ perception of social conditions is largely based on extrapolation from their own neighbourhood, as the affluent within homogeneous and isolated neighbourhoods perceive social disparities to be significantly less severe. Dawtry et al. (2015) find robust evidence for the US and New Zealand that individuals base their estimate of average societal income (and other quantiles) largely on their immediate subjective experience or ‘social sample’. This leads to differences in fairness perceptions and redistributive preferences, whenever the composition of social circles varies by income, as homophily strongly indicates. Kraus et al. (2017) finally demonstrate with respect to racial economic inequality that the homogeneity of the immediate social network appears to mask racial inequities, therefore also testifying to the relevance of immediate lived experience for perception formation.
In a series of articles close in spirit to our approach, Chiang (2011, 2015a, 2015b) exploits this notion and shows experimentally and computationally that individuals base their beliefs about inequality on local perceptions within referent networks and that income homophily has a potentially strong effect on those perceptions. While his approach is exploratory and does not account for the outlined stylised facts on inequality perceptions and empirical social networks, we provide a tractable model, readily calibrated with regards to those phenomena that is introduced below.
3 Model
This section provides a content-oriented presentation; a technical description following the ODD protocol is avaliable upon request. The model consists of three distinct phases run in sequential order:
-
1.
Agent initialisation and income allocation
-
2.
Network formation
-
3.
Gini perception and network evaluation
Each phase runs only once and phases one and two build the structure which phase three then analyses. This sequence implies that during network generation, agents adapt to others’ income level. However, there is no reaction to others’ linking behaviour or perception and, thus, the model does not feature interaction in a narrow sense. Moreover, in the model, an agent’s social contacts depend on their income. We choose this direction of causality for technical reasons and because it seems empirically likely (cf. Section 2). Nevertheless, our process scheduling would also be consistent with the opposite direction of causality or positive feedback effects between income and social contacts.
The model is designed that way because it focuses entirely on income perceptions given defined income distributions and network structures. Hence, both an agent’s income and their social contacts remain constant for the evaluated time frame or, put differently, that the simulation outcome is a snapshot of a certain point in time.
3.1 Agent Initialisation and Income Allocation
There are agents in the model; each agent draws their income from an exponential distribution with a mean of . Such a distribution normalises the empirical observed (pre-tax or market) income distributions in various industrialised countries for the vast majority of individuals (Drăgulescu & Yakovenko 2001; Silva & Yakovenko 2004; Tao et al. 2019). Thus, one can understand the model population as constituting a representative sample of empirical populations of these countries. The upper tail of to % of the income distributions empirically follows a Pareto law (Silva & Yakovenko 2004). We deliberately choose to exclude this small minority from our model, since their population size would induce another degree of freedom in our model and we want to demonstrate that segregation is indeed endogenous and not driven by differences in actual income regime. We use an identical, pre-validated exponential distribution for all Monte Carlo runs and also all levels of homophily to ensure comparability between simulation runs. Agents store their true income decile for evaluation purposes, too.
3.2 Network Formation
Each agent draws five other agents to link to. Like for real-world networks, links are therefore created by agents, not imposed on them. The number of five link choices is also empirically validated, as humans tend to only know the income of close friends or family (Clark & Senik 2010; Hvidberg et al. 2020), with typically only five individuals at this closest layer of emotional connection (Zhou et al. 2005; Hamilton et al. 2007; MacCarron et al. 2016).555For a recent review on the large literature on ‘Dunbar’s number’, cf. the first section of MacCarron et al. (2016). However, to the best of our knowledge, there are no empirical studies that specify whom this closest layer consists of. The relative weight in the draws are a function of the homophily strength and the respective income levels. Thereby, agent ’s weight in agent ’s draw is denoted by and determined as follows:
| (1) |
denotes the income of an agent, and denotes the homophily strength in income selection, externally set, and identical for all agents. represents a random graph, and for an increasing positive value of , an agent becomes ever more likely to pick link-neighbours with incomes being closer to their own. The exponential character of the link function ensures that those others with are large income difference become unlikely picks even at low homophily strengths.
The choice of an exponential weighting function might seem arbitrary but upon closer inspection, we find that translated into the probability of choosing , this weighting is equivalent to the discrete choice approach developed and popularised by Manski & McFadden (1981). The homophily parameter is then simply the intensity of choice parameter. To translate weights into probabilities, we normalise by all weights for all agents, i.e.,
| (2) |
with as the set of all agents except with size .666Note that this is, strictly speaking, only the probability of the first choice of agent , since we consider drawing without replacement,and does not account for the possibility that other agents already link to the agent in question, in contrast to our algorithm. Since the number of agents is rather large, the effect appears to cancel out in the aggregate, though, as also our simulation results in subsection 4.6 indicate. This formulation in (2) has a rather intuitive interpretation, with implying equiprobable picks with and thus indeed a random graph, while implies that approaches unity for with minimum income distance and for all other . Manski & McFadden (1981) demonstrate that the discrete choice rule above emerges naturally from random utility theory, i.e., agents maximise utility and utility can be decomposed into an observable and unobservable component. In our case, the observable component the agents minimise would be the income differences, with the unobservable part being all the attributes from which our agent in question would benefit due to their social connection. This appears to be rather intuitive, since of course income differences might be a rather salient characteristic and thus observable, while the utility from social connections might in some cases plausibly exceed the one derived from merely a good fit or small social distance.777Notice, however, that the derivation of the above choice rule crucially depends on the axiom of Independence of Irrelevant Alternatives (IIA) (Luce 1977), i.e., the probability of choosing between and being independent of the probability of choosing . IIA might be a good first-order approximation for homophilic choice but in friendship networks, knowing one agent might indeed increase the likelihood of knowing another agent that is friends with . It might thus prove interesting to extend and generalise the above choice rule to examine the effects on the network topology in further research. In this sense, the weighting function in eq. (1) is plausibly microfounded in a utility-maximising framework and can now be considered the workhorse choice rule in behavioural macroeconomics (Franke & Westerhoff 2017). Franke & Westerhoff (2017) also survey evidence from a several lab experiments in different macroeconomic contexts that discrete choice is indeed consistent with the data, while Anufriev & Hommes (2012) and Anufriev et al. (2018) provide laboratory evidence for the discrete choice approach for financial markets. However, there might of course be other potential choice mechanisms that could provide avenues for further research on network generation that can be readily included within our proposed flexible RGG framework.
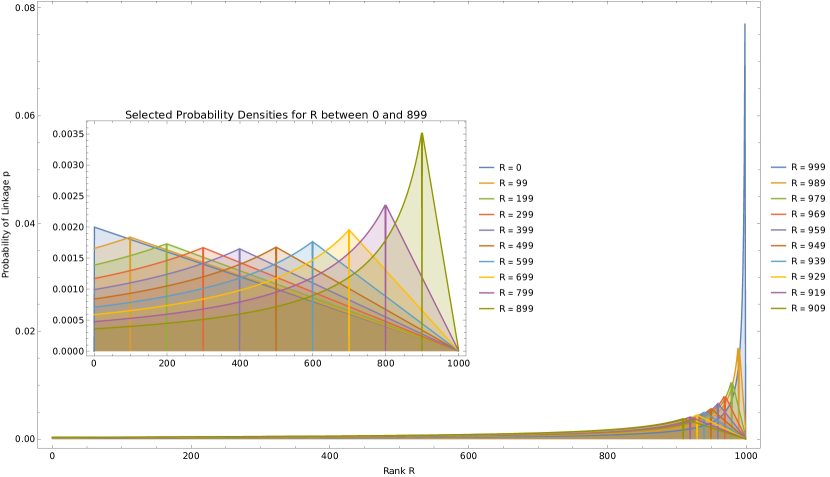
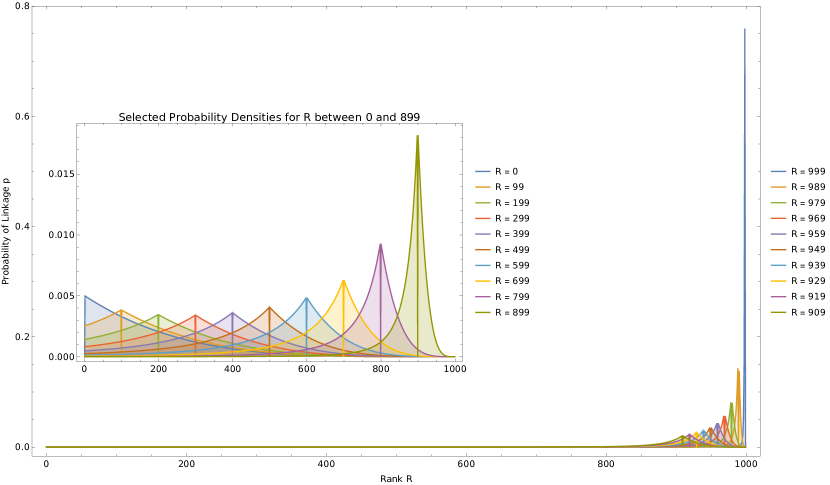
Note: The Figures plot the Probability Density Functions (PDFs) of a node with a given income rank for linkage with another node for the whole support of income ranks. The above Figure assumes a homophily strength , whereas the below Figure assumes .
Figures 4 and 4 illustrate the linkage probabilities implied by the weighted draw based on the exponentially distributed income levels. As can be seen, the decay within the left tail is always more rapid than for the right tail, indicating differences in the ‘selectivity’ above or below a relative position. We understand ‘selectivity’ according to rank as the effect a decrease in income rank distance of one agent to another has on the linkage probability between them. Consequently, the local maxima of individual linkage probability densities exhibit a bi-modal shape with peaks at the highest and lowest rank but are also heavily skewed to the left, i.e., agents with the high incomes are most selective in their link picks. General selectivity increases with . Notice also that largest income ranks are extremely selective in all scenarios, in some cases in some cases exceeding linkage probabilities of incomes close to the median by more than two orders of magnitude in linkage probabilities.
An anonymous reviewer pointed out that individuals may form links based on relative rather than absolute income differences: For lower incomes, a given absolute gap in units of currency may mean two entirely different lived experiences, while people with high incomes may hardly notice the same absolute gap. To represent this in the linkage function in eq. (1), one must simply replace by and by . Appendix C analyses this transformation of scale in detail. The altered argument in the choice function is equivalent to assuming that agents aim to minimise the percentage difference in incomes and is, therefore, a natural extension to capture potentially scale-dependent tie-formation along the lines discussed above (Törnqvist et al. 1985).
Our findings from Section 4 regarding self-perceptions and aggregate inequality perceptions prove qualitatively robust; quantitatively, the major findings occur at even lower homophily levels. However, the logarithmised incomes fail to replicate the greater under-estimation of inequality for richer individuals with higher income ranks. The segregation tendency is approximately symmetric for moderate to high homophily strengths, i.e., all agents are approximately equally likely to include agents below and above them in income rank. Since there is hardly any differential behaviour according to income rank, all agents tend to perceive roughly equal levels of inequality according to the (local) Gini, in contrast to the stylised fact (iii). Thus, absolute income differences pose the more strongly validated presentation in the present model framework. Nevertheless, the model invites empirical research into whether income homophily is based on absolute or relative differences - or some combination of both.888Since only the specification following scale-independent choice is consistent with inequality perceptions varying systematically with income while choice based on logarithmised incomes is not, the existence or non-existence of differential behaviour might help to discriminate between implied choice functions.
The resulting network for our baseline specification is a member of the family of Random Geometric Graphs (Dall & Christensen 2002), which Talaga & Nowak (2020) showed to reproduce core features of many social networks efficiently. Specifically, we combine the notions of homophily (Boguná et al. 2004) with pre-setting node degrees (Newman et al. 2001; Newman 2009).999Our procedure is related to Karimi et al. (2018) who also combine a Preferential-Attachment model with a homophilic ingredient. Crucially, however, their model builds on a binary notion of homophily with only two groups. Our algorithm, in contrast, does not impose any restriction on the target feature and is applicable to attributes potentially defined over the whole positive real half-line. However, concerning our application, we are able to simplify both approaches by pre-determination of only the global minimum degree, like in Preferential-Attachment networks, and consequently defining relative weights rather than absolute probabilities.
Links are undirected and have identical weights for evaluation purposes. Agents pick their neighbours in random sequential order. If an agent picks agent who had themself picked before that, the already existing link between the two agents remains untouched, but does not pick another neighbour instead of . Consequently, each agent has at least 5 link-neighbours (i.e. clsoe social contacts with mutual knowledge of income) but may have more.
3.3 Gini Perception and Network Evaluation
Agents know about their own income and also their social contacts’ incomes. However, they do not possess knowledge about any other agent or structural features of the whole income distribution. Thus, agents judge income inequality in the population as well as their own income position solely based on themself and their link-neighbours. Besides the agents’ perceptions, there is a global assessment of various network parameters in order to validate the model.
Subjective inequality perceptions mirror standard Gini calculation on the level of individual personal networks: Each agent finds the mean of all income differences between themself and each link neighbour and between any two of their link-neighbours and divides this by twice the mean overall income of themselves and all link-neighbours. Then, the overall perceived Gini is simply the arithmetic mean of individual perceptions.
To estimate their income decile, an agent compares the number of link-neighbours having a higher income than the agent themself to the link-neighbours having a lower income than the agent themself.
3.4 Validation
The simulation results of our model are in line with our theoretical expectations and we can explain their emergence in terms of the mechanisms sketched in Section 4. Moreover, we carried out sensitivity analyses that revealed no unintended consequences of changes in any relevant model feature like homophily level, number of links or actual income distribution. Thus, we consider the model design and implementation to be internally validated (Gilbert & Troitzsch 2005, p. 22) as a tool for explaining inequality perceptions in the model population.
Transferring these explanations from the model to the real world requires external validation of our model. However, there are different accounts of what constitutes an explanation in the first place. The current discussion of the concept of explanations in the philosophy of the social sciences highlights two types of explanations: How-actually and how-possibly explanations, also known as candidate explanations (Epstein 1999). While how-actually explanations aim for identifying the actual mechanism driving the dynamics in a specific case, how-possibly-explanations provide mechanisms that could possibly bring about the explanandum in question (Reutlinger et al. 2018); they enquire for mechanisms that potentially cause the observed phenomenon. In case of epistemically possible how-possibly explanations, these mechanisms are in line with the knowledge about the real world (Grüne-Yanoff & Verreault-Julien 2021).
Our model yields an epistemically possible how-possibly explanation of inequality perception because it “produces quantitative agreement with empirical macrostructures, as established through on-board statistical estimation routines” and also “quantitative agreement with empirical microstructures, as determined from cross-sectional and longitudinal analysis of the agent population” (Barde & Van Der Hoog 2017): Simulation outputs of a societal structure close to a small-world one with self-segregation of highest-income agents and severe underestimation of the income Gini across income levels mirror the corresponding empirical findings.
Following the suggestion by Fagiolo et al. (2019), we use empirical micro-data to calibrate the model. Namely, it relies on an exponential income distribution that characterises industrialised countries. Furthermore, the extent of agents’ closest layer of interaction (‘Dunbar’s number’) that means mutual knowledge of income, their linking behaviour, and individual perception formation follows rules that are theoretically established in rational choice theory but also empirically grounded in the referenced lab experiments and surveys. The exponential weighting function from the discrete choice framework is also analytically convenient and lets us represent the probability densities of ties in closed form. This allows us to e.g. demonstrate conclusively that the combination of discrete choice in graph formation and an exponential income distribution leads to the endogenous emergence of echo chambers for top-income earners whose isolation increases in the intensity of choice .101010 This combination of analytical convenience that leads to internal validity and empirical plausibility that affirms external validtity is also one of the reasons why we deliberately choose not to use an Exponential Random Graph (ERGM) or Stochastic Actor Oriented Modelling (SAOM) framework (Snijders 2011, for a recent survey) but situate our model in the RGG framework: Firstly, the application of these types of models would require merging relational data with the socioeconomic status of the respective agents which is rarely achieved in practice, as De Paula (2017) notes. In our case, the problem of data availability is compounded by the fact that we require the graph data not only to report all social ties but also to identify the closest layer of emotional connection. Only there we can reasonably expect agents to exactly observe incomes as is required by our model mechanism. We are currently not aware of any dataset fulfilling these constraints but welcome any empirical attempt in this direction, as the external validity of our proposed model mechanism can ultimately only be established empirically. Secondly and more importantly, the estimated coefficient estimates and tie-level probability densities from ERGMs and SAOMs are purely phenomenological and need to be simulated by Monte Carlo techniques, while we are able to express them analytically and thus precisely determine the effect of our model parameters. We thank an anonymous reviewer for pointing us to ERGMs.
This empirical input calibration and output validation jointly guarantee resemblance (Mäki 2009) between our model and the real world. We develop a specific parallel reality (Sugden 2009) that features generating mechanisms for empirical findings in our reality, and hence our results present a candidate explanation for the stylised empirical facts. There may be different, more adequate, parallel realities featuring either these or even better mechanisms, despite to the best of our knowledge there being no existing models that fulfil these characteristics. Overall, the following section presents an epistemically possible how-possibly explanation of inequality underestimation that “constitutes epistemic progress on the way towards HAEs [how-actually explanations, A/N]” (Grüne-Yanoff & Verreault-Julien 2021) of the phenomenon. The model simultaneously features technical verification and external validation based on input and output measures. Gräbner (2018) considers this combination desirable albeit rarely possible for model development. Since our model features a range of proposed micro-mechanisms (e.g., on endogenously evolving segregation, cf. subsection 4.5), we also hope to inform empirical research to further examine their external validity.
4 Results
The homophilic graph model will be evaluated against the five stylised facts outlined earlier. As we have shown in Section 3, we only require the homophily strength parameter , the number of links each node chooses and the income distribution as inputs for initialisation. Since link formation is stochastic, we run the graph formation routine times and report model averages, if not otherwise indicated. Most of the results are obtained with initialisation by the same set of incomes generated from an exponential distribution with location parameter and observations for choices of link-neighbours each agent undertakes to make results comparable for variation in . The overall Gini coefficient for these randomly generated income levels is with within % deviation from the theoretical Gini of , indicating that the observed effects of are not artefacts of initialisation. Results are also robust for different numbers of links chosen per node, as long as . We also evaluated the null model for , where we did not find any significant deviations in the mean inequality perceptions and the actual overall inequality of , testifying to the robustness of our approach.111111The results for the null model as well as for different are available upon request.
4.1 Small-Worldiness
We use state-of-the-art methods to test for the existence of small-world features against an appropriate network null model, here an Erdős-Rényi (ER) graph with the corresponding number of nodes and mean degree first introduced by Erdős & Rényi (1960). ER graphs appear to be the correct null model for two reasons: Firstly, they are a particular case of our model with , i.e. without homophily. Hence, the procedure allows isolating the impact of homophily and examining whether the model indeed tends to yield ‘smaller worlds’ for homophilic formation in the precise sense outlined below. Secondly, we can establish an exact one-to-one correspondence between a graph generated by our model and the ER model, as ER graphs only require the number of nodes and a linkage probability for initialisation that is fully determined by the mean degree of the correspondent network. Other prominent generating models such as Watts-Strogatz graphs have additional degrees of freedom like the ‘rewiring probability’ without clear correspondence to our model.
We construct three summary metrics to test our model against, as introduced by Humphries & Gurney (2008). Firstly, measures the deviation in average path lenghts , that is,
| (3) |
where is the average path length of network with as the average path length of a correspondent ER graph with equivalent number of nodes and mean degree. ‘Small-worldiness’ requires , as our network should not deviate too much from the random benchmark that indeed features short paths. with as Euler’s constant, as the number of nodes and as the average degree can be analytically derived which we use in our calculation (Fronczak et al. 2004).
Secondly, we also require a high clustering coefficient which an ER graph cannot generate. The deviation in the clustering coefficients is defined as
| (4) |
with as the clustering coefficient of graph and as the clustering coefficient of the corresponding ER graph. Here, again, analytical results are available which we utilise, mainly that with again as the average degree and the number of nodes (Watts 1999). Since ER graphs typically do not exhibit clustering, we require here that for a small-world to be present.
Finally, we use a summary measure introduced by Humphries & Gurney (2008). We define as
| (5) |
Humphries & Gurney (2008) show that features desirable statistical properties when confronted with the conventional Watts-Strogatz model for graph formation and shows a unique maximum between the extreme cases of a random network and an ordered lattice. This is in line with our intuition that small-worldiness results from the interaction of order (in the form of high clustering near the lattice) and randomness (in the form of the random graph featuring low average path lengths), as shown by Watts & Strogatz (1998). We require for small-worlds. Note that is an immediate corollary of the two requirements and , but does not imply the two individual requirements. We call the first sufficient condition ‘strong small-worldiness’ and with a violation of either or ‘weak small-worldiness’, where we now only require normalised clustering to increase faster than average path lengths.
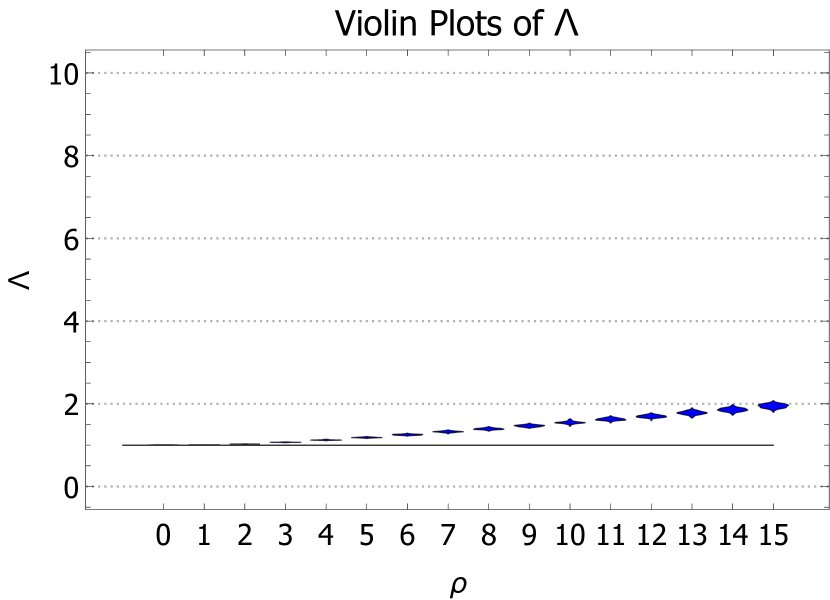
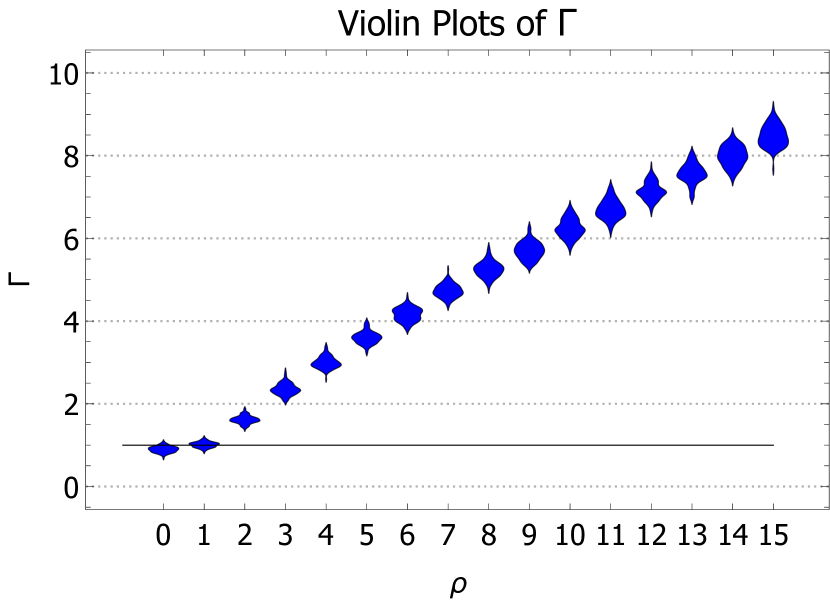
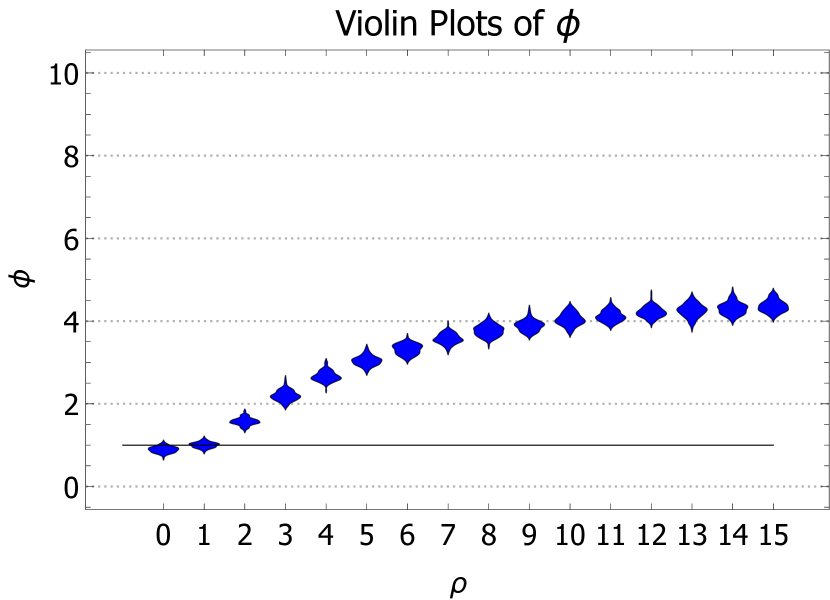
Note: The Figures report violin plots for the relevant statistics for ‘small-worldiness’. The average path length is significantly higher than the ER benchmark for all depicted , indicating violation of the ‘strong small-worldiness condition’. Normalised clustering coefficients are for significantly higher than the ER benchmark and increase at a much faster rate than average path lengths, indicating that indeed the ‘weak small-worldiness’ condition is fulfilled.
The ER benchmark is nested in our model for , as is also readily visible from the fact that both and for . We indeed find that homophily induces path lengths to grow significantly above this ER benchmark. Normalised clustering coefficients, however, increase much more rapidly with homophily than average path lengths, demonstrating that our model can achieve relatively high clustering without simultaneously increasing path lengths in the same way. The proposed process thus violates the strong condition but fulfills the weak condition for small-worlds and is therfore broadly in accordance with the topological patterns found in real-world social networks. We note further the symmetry to the canonical Watts-Strogatz approach (Watts & Strogatz 1998). While we build on a random network with short average path lengths and interpolate to the desired high clustering through homophily, Watts and Strogatz start from an ordered state with high clustering and approach the random graph benchmark by rewiring to generate shorter average path lengths. Arguably, however, our approach starts from a plausible and empirically well-established behavioural principle in contrast to the purely stochastic process in the Watts-Strogatz world without such behavioural foundations. Besides providing empirical validation, this finding might also point to relatively rapid contagion throughout the homophilic network, be it in the form of rumours or ‘expenditure cascades’.
4.2 Perceived Social Hierarchy and Middle Class Bias
For unbiased hierarchy perceptions, the reported frequency of perceived social position would coincide with the actual positions. Unbiased perceptions thus entail reported perceived positions of equal frequency, as they coincide with the actual population shares. As we show both analytically in Appendix B and by simulation, perceived social positions for homophilic graph formation are far from the equiprobable benchmark. We find a tendency of the vast majority of individuals to place themselves in the middle of the perceived hierarchy, in line with the empirical evidence. We prove that the tendency exists for all . Its strength is a function of , though, as we show exemplarily in Figures 11 to 11. The figures plot the empirical densities of income ranks which the respective the individuals perceive to hold. For , the tendency is relatively weak, while for , and , the densities display a distribution that notably peaks at the centre. In fact, the displayed densities indeed seem to feature all the salient features of the densities of empirical perceived social positions, as shown in Choi (2019) and also in Figures 2 and 2 for the ISSP data we collect.
Note: The Figures report the perceived social positions for with bins each. All Figures exhibit significant deviation from the benchmark with equal frequencies. The tendency for individuals to place themselves in the middle of the income hierarchy is, however, only apparent for the middle and right panels, indicating that a homophily strength of might be too low to replicate the empirically observed tendency. For , and , the densities approximate the empirical densities rather well, though.
Notice that this a necessary outcome of homophilic graph formation under very mild and general conditions and based on a well-established utility maximisation framework, in contrast to models that take this tendency as an assumption. The latter strand of literature has typically taken a bounded rationality stance on the issue and argued that it is failures in information processing which explain the persistent errors in perceptions of social positioning. Our model replicates stylised fact purely by virtue of the network formation process. In contrast to the literature on bounded rationality, we can hence show that stylised fact is consistent with purely rational actors that form correct beliefs based on their available information, as long as homophilic graph formation constrains their information sets. Our model thus entails very different policy implications to improve self-perceptions. Since information processing is assumed to be correct in our model, information treatments, i.e., increasing the information received from nodes with heterophilic incomes, have mitigating effects on perceptions. Influencing information processing itself, as implied by the established models, is arguably a much harder task for policy.
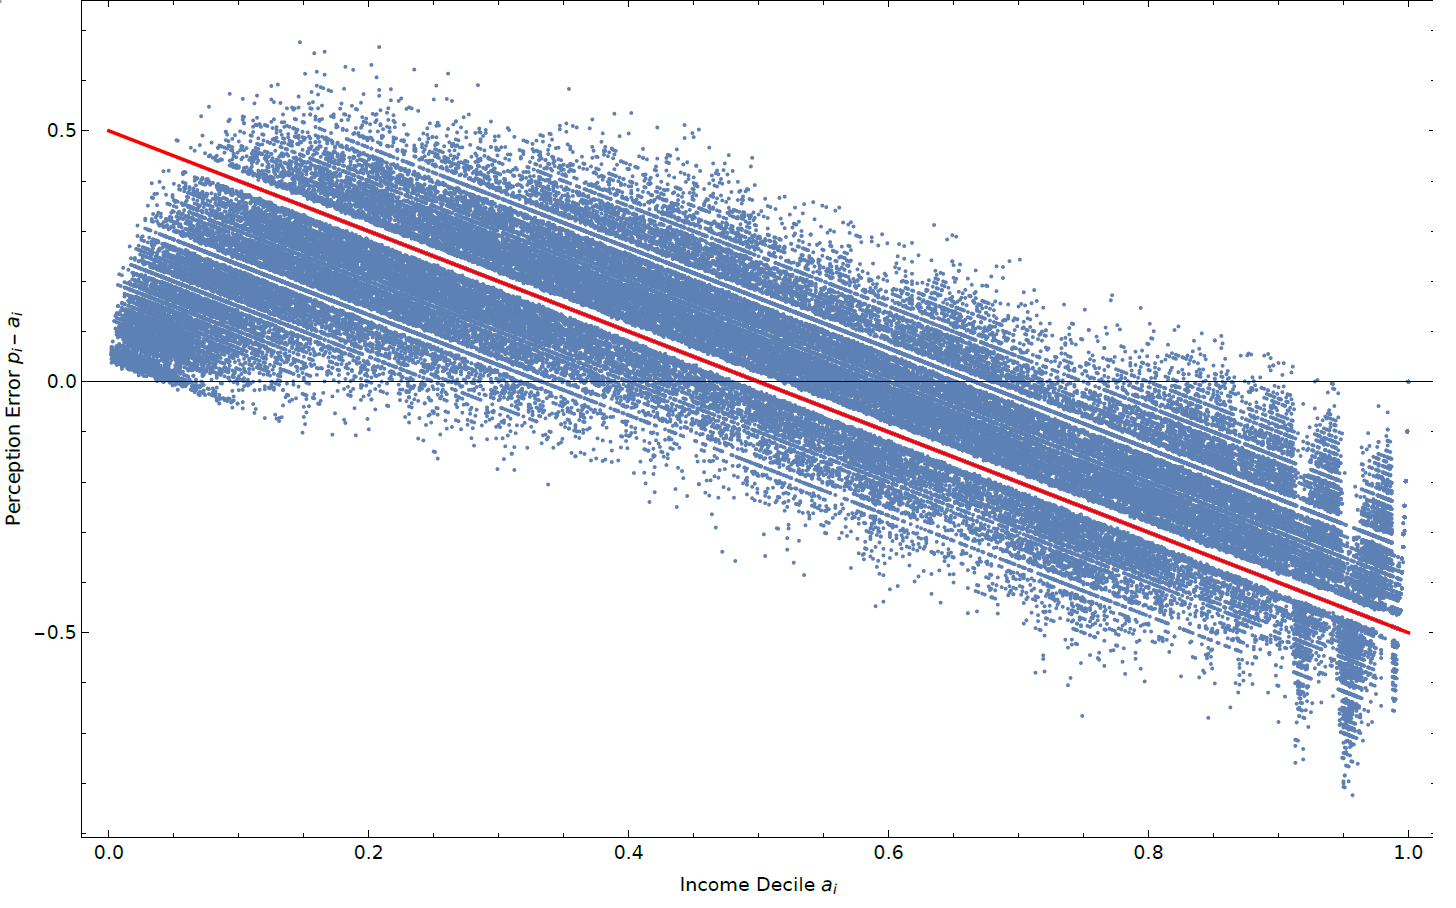
An immediate corollary of the population perceiving themselves to earn the median income is the tendency for rather poor individuals to overestimate their position and the rich to underestimate it, as all perceive themselves to be in the middle. Hence, the fit for the median perception tracks the trend in the simulations reasonably well for the vast majority of observations (cf. Figure 12). As we discuss in more detail in Appendix B, there is no tendency to the median for the left and right tail of the distributions which the simulation results reflect, too. Indeed, approaching the minimum or maximum improves the accuracy of individual estimates. The intuition for this is quite simple: The poorest and the richest individual will always correctly perceive their social position, independent of . The rationale for this is that the actual minimum (maximum) of the whole will always be the minimum (maximum) of any potential non-empty subset of the population. Apart from such boundary effects, however, we indeed replicate stylised fact insofar as the poorer half of the population seems to overestimate their social position, while the richer half underestimates it. This finding is in line with the empirical evidence and suggests that total whole population tends to underestimate the degree of inequality, as we will show in the upcoming subsection.
4.3 Perceived Individual Inequality
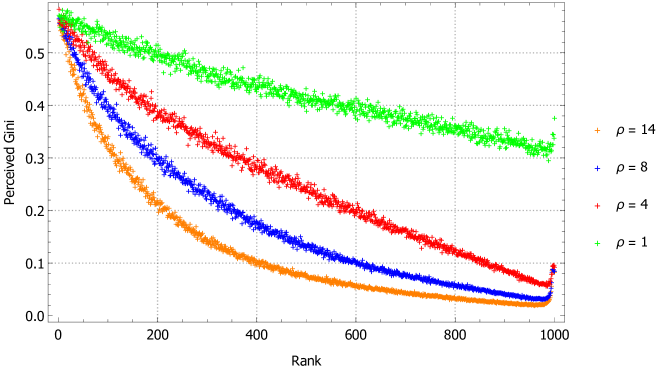
We define perceived inequality as the Gini coefficient calculated over the perception set of a given individual . In Figure 13, we plot those perceived Ginis against the income ranks of our individuals with a higher rank indicating a higher income. In line with stylised fact , we find that inequality perceptions decrease approximately monotonically in income rank, while almost all individuals underestimate the actual degree of inequality significantly. As a result of our homophilic graph formation process, perceptions are most accurate for the poorest which either over- or underestimate actual inequality of slightly. The Gini coefficient is conventionally defined as the ratio of (unweighted) mean differences in the incomes within the perception set of an individual to twice the mean income within this group. Homophilic graph formation now lets those unweighted mean differences increase linearly at most, while the mean incomes increase exponentially due to the exponential distribution by which incomes are initialised. As a result, the ratio falls almost monotonically. This results is not only plausible due to its accordance with stylised fact but might also correspond with the empirical evidence on perception formation. One of the most prominent hypotheses on perception formation from stimuli is the Weber-Fechner law (Fechner 1862) which indicates that perceived differences in stimuli need to be proportional to the baseline of a given stimulus to be recognisable. The phenomenon is well-established not only for sensory stimuli (Formankiewicz & Mollon 2009; Pienkowski & Hagerman 2009) but also finds use in marketing research on price responses (Sirvanci 1993; Snell et al. 1995). In this framework, one can also understand a decreasing perceived Gini as the change in stimuli (the unweighted differences in incomes of the perception set) do not increase in the same way as the baseline of stimuli (the mean incomes of this perception set) and is thus also consistent with the psychological microevidence.
4.4 Perceived Global Inequality
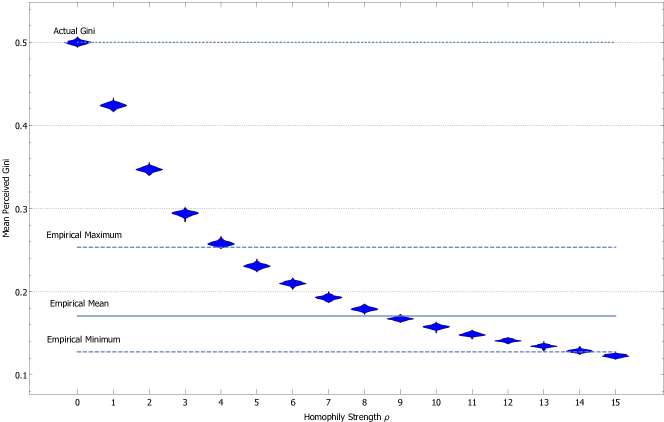
For further validation, we also examine whether our graph generating process can quantitatively replicate empirical perception patters. We use the mean, minimum and maximum for inequality perceptions on a national level calculated yearly for a large sample of OECD countries in a year time-span by Choi (2019).121212For details and descriptives of their sample, cf. Choi (2019), especially Appendix B2. Over all countries, they find a minimum perceived Gini of , a mean perceived Gini of and a maximum perceived Gini of . In analogy to their empirical results, we average over the Gini perceptions of all individuals. As we show in Figure 14, we find that our process can fully account for their empirical findings and the variation between inequality perceptions by only varying the homophily parameter . We also note that the sample average of national inequality perceptions implies a homophily degree . Yet, our findings imply considerable cross-country variation in homophily that ranges between to .
4.5 Perception Dynamics
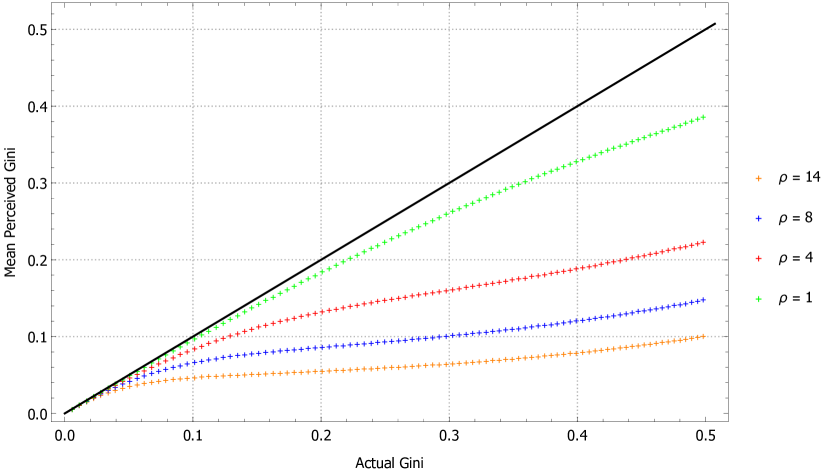
To analyse perception dynamics, that is, the reaction of inequality perceptions to changes in actual inequality, we need to initialise the model with another distribution, as the exponential has a fixed Gini of about , irrespective of its precise parametrisation. We use the log-normal as another benchmark and vary the dispersion parameter to simulate changes in the Gini coefficient which is another distribution typically used to describe the skewed nature of empirical income distributions (Knell & Stix 2020). As we see, apart from implausibly low degrees of inequality, changes in actual inequality cause far less than a one-to-one change in perceived inequality. Especially for higher degrees of homophily, we find that the schedule quickly reaches a plateau, where inequality perceptions are now extremely persistent with respect to increases in actual inequality. Our model thus is consistent with stylised fact as our last test of validity.
The persistence in perceptions occurs because homophily becomes more binding and segregation stronger when actual inequality increases. This mechanism leads ceteris paribus to a decrease in perceived inequality which offsets a direct impact of objective inequality on subjective perception. Compare, for illustration, the two regimes close to a completely egalitarian income distribution near and relatively high degrees of inequality near . The egalitarian state is close to a random network, as homophilic segregation presupposes income differences. Small changes in actual inequality are thus not strongly reflected in segregation and almost fully impact perceived inequality, leading to a one-to-one correspondence of perceived and actual inequality in this neighbourhood. For large degrees of actual inequality and large homophily, changes in actual inequality immediately impact segregation, leading to a plateau and very persistent perceptions. Notably, this mechanism is not only consistent with the empirical evidence in terms of its emergent outcome; several recent studies by Reardon & Bischoff (2011); Chen et al. (2012) and Tóth et al. (2021) examine the mechanism directly and show that economic inequality tends to increase (spatial) segregation. A fruitful avenue for further research could be the time-scale on which this channel works, with more laggard segregation responses obviously decreasing the space for inequality-enhancing policies.
4.6 Segregation Patterns
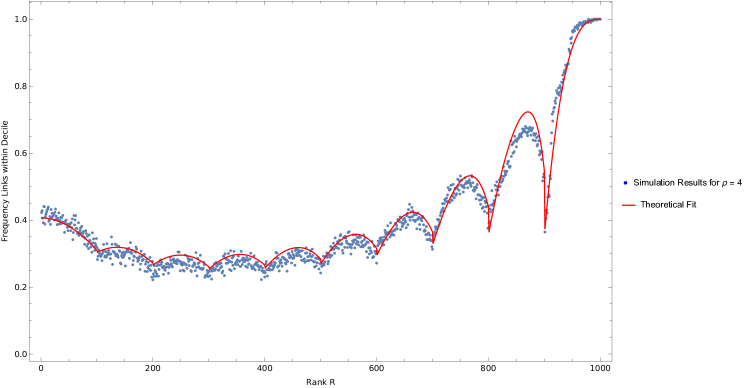
We measure segregation as the proportion of links an individual has in their own decile as as one particular way to measure ‘selectivity’ without access to behavioural linkage parameters. This constitutes a straightforward but standard way to measure segregation and is easily transformed into normalised measures of segregation like the E-I index which is defined as the difference between the share of between-group links and the share of within-group links (Bojanowski & Corten 2014).131313Both measures are simple linear transformations of each other due to . Figure 16 plots the simulated segregation statistics as well as a theoretical fit for . For analytical convenience, the superposed red line plots the probabilities that an individual chooses another agent to link to within their own decile as a first pick, so the total choice set consists of other individuals, and does not account for the possibility that other agents already link to the agent in question, in contrast to our algorithm. Appendix A details the derivation. The goodness of fit demonstrates that these incoming-links do not exhibit a significant effect on segregation patterns and tend to average out in the aggregate, showing that our analytical approximation is indeed reasonable.
Segregation exhibits two distinct patterns along the rank distribution. Firstly, we find that segregation exhibits a skewed U-shape and increases, especially for the richest decile, which is almost completely disconnected from the other groups. In this sense, our graph formation process endogenously creates echo chambers for the richest whose information sets do not cover the poorer population at all. This results from the fact that the richest part of the population is extremely selective in choosing their link-neighbours, as we have shown in Section 3. Secondly, we also find a rather strong variation together with local maxima within deciles. This finding might be, however, spurious and a partial artefact of boundary effects at decile boundaries. As Appendix B shows analytically, individuals will choose those sets of link-neighbours with the highest probability that are distributed symmetrically around them in rank. Thus, individuals exactly at the decile boundary will most likely select a set with half of their neighbours across the boundary. Individuals closer to the centre of a decile, on the other hand, will by the same token choose with highest probability link-neighbours within their own decile. Arbitrarily pre-defined group boundaries can thus create within-group variability in commonly used indices like the E-I index that nevertheless exhibits desirable statistical features at an aggregate level (Bojanowski & Corten 2014). These findings extend well beyond income deciles, as variables like age group, place of living, gender, education or ethnicity are likely strongly correlated with income. Studies using E-I type indices to detect homophily in other variables might hence create spurious results if income homophily is also present. The relevance of such boundary effects has increasingly also been recognised in applied work (Hvidberg et al. 2020). Whenever dimensions have a cardinal scale like income, it might therefore prove more fruitful to use a rolling-window type of estimation, where within-groups are defined in relation to the individual in question, such as a fixed number of income ranks or a fixed income rank interval around theirs.
4.7 Summary of Generating Mechanisms
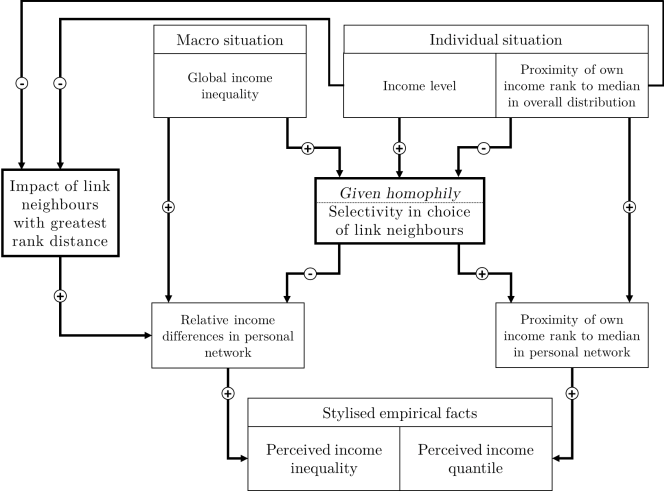
For non-biased individual samples, one would expect agents to both estimate global inequality correctly in aggregate and also locate their true income quantile. However, homophily triggers link selectivity and hence biased samples which in turn causes inequality perceptions based on an agent’s income level and rank (cf. Figure 17)
Selectivity in link formation depends on global income inequality. Furthermore, agents whose income is further from the global median income are more selective in their link-neighbours and so are agents with the higher income ranks, as an artefact of the cut-off in the exponential selection function at the low end of the income distribution (cf. the skewed U-shape in Figures 4 and 4). Such link-neighbour selection generates personal networks for each agent in which this agent tends to have the median income and where income rank differences are relatively small.
Moreover, the extent of relative income differences in one’s personal network now depends on the characteristics of the agent in question. Firstly, the impact of link-neighbours with great rank differences to the perceiving agent is larger if this perceiving agent and consequently the majority of link-neighbours have a low income themselves since local inequality calculations weight income differences by the local mean. Secondly, agents close to the global income distribution median ceteris paribus perceive lower inequality levels, for the greatest rank distances tend to be smaller in these cases.
Overall, in a homophilic linking regime, the complex interaction of actual income inequality and of individual absolute income and distribution rank cause biases in income level self-rating and inequality assessment that aggregate to biased underestimation of inequality. Due to the interplay of factors that feed into individual selectivity in choice of link-neighbours, the relation between objective income structure and individual perceptions is non-monotonic and not trivial but requires case-based assessment.
5 Discussion
Our parsimonious model provides an epistemically possible how-possibly explanation of the stylised empirical facts regarding inequality perceptions that we identified in the literature. Individuals who evaluate their immediate social environment without bias can misperceive their own rank in the overall income distribution as well as global inequality. Homophilic formation of the immediate environment suffices to fully explain the discrepancy between actual and perceived inequality since a rising level of actual inequality causes higher selectivity in link-formation. Moreover, the further away someone’s income rank is from the global median and the higher their income, the more selective they are in their choice of link-neighbours.
Thus, public misperceptions are not necessarily driven by limitations in information processing, e.g. a behavioural tendency to place oneself near the median of social hierarchy, but by limited information sets the individuals exhibit for inductive reasoning. The seemingly subtle distinction between constraints on information processing and information sets carries important policy implications: When it is the limits of available information and not limits in cognitive ability driving misperceptions, informational treatments may be successful, as also the empirical literature suggests (Cruces et al. 2013; McCall et al. 2017; Karadja et al. 2017). Such treatments can either consist of delivering information about income inequality itself or facilitating the formation of more diverse contacts in order to overcome the segregation by income that our model finds. In other words, this means breaking up echo chambers that are caused by humans drawing confidence in their beliefs only from repeated observations while ignoring a potential lack of diversity in sources (Foster et al. 2012; Schwarz et al. 2016).
Educating individual citizens about their information deficit and providing ways of overcoming it is important from a democracy theory perspective. For example, (Rawls 2005, p. 224) requires “presently accepted general beliefs” as basis for arguments in the public forum. However, while one can asses the income inequality objectively without any room for disagreement if using all globally available information, citizens who work only with their individual information will agree on a belief about the Gini that underestimates its actual value. Hence, the lack of individual information access inhibits deliberation about the level inequality and its changes, e.g., in response to past policy measures.
For the first time, we are able to infer the composition of these reference groups from readily available observational data on perceived inequality to inform both empirical investigations as well as more comprehensive model-building in other regards. Directly investigating perception networks might provide a possible remedy for the problem that identification of interaction effects within survey data in the form of time series is hindered by sample sizes that are typically one or two orders of magnitude too low to distinguish noise from true interaction (Alfarano & Milaković 2012). Our main empirical prediction is that the homogeneity of social groups, the fraction of links to agents within the own income decile, roughly follows a U-shaped pattern with a massive decrease in diversity for the richest and (a quantitatively much more modest one) for the poorest agents. This finding might point to an endogenously emerging ‘elite discourse’ with almost no transmission of information to the poorer % of the population.
Our cross-country analysis shows that there exists considerable variability in implied homophily levels. There are several possible candidates to explain this variability, such as cultural norms, diversity in media and political representation or spatial segregation. Regarding spatial segregation patterns, Thorstein Veblen made the farsighted observation as early as 1899 that urbanisation should increase diversity in social contacts, since cities are the place “where the human contact of the individual is widest and the mobility of the population is greatest” (Veblen 1899 [2001], p. 66). Thus, perceived inequality should ceteris paribus be higher in urban areas resulting from the higher average income diversity per perception network, a testable hypothesis and thus a possible avenue for further research in spatial economics. This is also what the rather scarce existing evidence for Vietnam and Central and Eastern Europe suggests (Mahajan et al. 2014; Binelli & Loveless 2016). In this way, spatial and perception network segregation might therefore overlap and interact (Newman et al. 2018; Tóth et al. 2021), and policy affecting the allocation of land could thus also exhibit unintentional effects on perceptions. We leave detailed analyses on these determinants for further research.
In terms of theory, our empirically validated random geometric graphs might provide an ideal microfoundation for theories of consumption as dependent on the relative income position and for which shocks that affect local income compositions lead to ‘expenditure cascades’ (Duesenberry 1949; Veblen 1899 [2001]; Frank et al. 2014). This new mechanism might shed light on the disputed link between economic inequality and growth. We will address these questions in further research.
Finally, our model presents a way of generating random geometric graphs defining both the distribution of the feature that determines linking probability between any pair of nodes and a minimum degree value for each node. Put differently, we apply a Barabási-Albert (1999) Preferential-Attachment type procedure, which is intuitive for social scientists, to features other than degree and get network graphs that can be analysed using readily available methods from random geometric graph theory. To the best of our knowledge, there is no such way yet.
While it is reassuring that a scale-transformation to a log-scale delivers the same salient ‘middle-class bias’ as our baseline specification, log-transformations in general strike us as a very parsimonious way to capture scale-dependence in choice. This is not only relevant for inequality perceptions but for essentially all variables and features where perception of stimuli is plausibly dependent on scale. In general, it is possible to apply the generating procedure to features other than income that exhibit different distributional patterns. This approach will hopefully inspire future studies of expectation formation, e.g., regarding inflation or business sentiment. In these fields, identification of the relevant perception networks might be a crucial step to bring macroeconomic theory currently mostly building on atomistic rational expectations and empirical studies, that find little support for those types of expectations, closer together (Pesaran & Weale 2006). Hence, we also provide a toolkit for analysing the impact of homophily regarding any specified feature on network generation (and potential interactions on the resulting network) given a particular distribution of this feature that is well-grounded in the behavioural economics literature. In sum, we anticipate our theoretical framework to generate numerous avenues for further studies both theoretically, regarding graph- and expectation formation, as well as empirically, pertaining to the determinants of homophily and possible policy measures, to information transmission and to the effects of inequality on aggregate consumption.
Appendix A Linkage Probabilities for Homophilic Networks
-
Heuristic Derivation.
Linkage Probabilities.
Consider an arbitrary node indexed as their rank increasing in income that is part of a graph with nodes characterised by adjacency matrix . Let denote their income, where defines the PDF of a exponential probability distribution defined over the real half-line with parameter and the corresponding CDF. The quantile function for any population share and with parameter for an exponential distribution is given as
(6) We assume without loss of generality that for normalisation. Calculated values therefore need to be scaled up by the inverse of the mean income, for empirical application.
The quantile of a node with income can be approximated by their rank , such that as a discrete approximation of the continuous probability density which holds for large . We want to derive the probability that a node with rank connects to a node with a distance of to node . Expressing the weights as defined in Section 3 now in the form of quantiles, we get
(7) (8) Assume first that , that is, is richer than . Simplifying the weights yields for :
(9) (10) (11) (12) Analogously, we get for
(13) (14) (15) (16) To translate into probabilites, we need to normalise by all weights. Note that this is still a (close) approximation of the probabilities of link-formation of a given node . Nodes draw their link-neighbours from the set of all neighbours. This implies that draws are not independent, as we assume here. Since , however, the effect is marginal. The approximation for the probability below, however, seems to perform quite well which we verify in our subsection on segregation. The probability that chooses as a link-partner can therefore be approximated as
Notice that the function behaves as expected and is monotonically decreasing in . The strength of selection also increases monotonically in the homophily parameter . For , we recover the equiprobable case without any decay. The precise functional form of the decay for is, however, far from trivial and changes along the rank distribution. The right tail of the correspondent density is always a power transformation of a linear function, whereas the left tail for any given is a power transformation of function with hyperbolic decay. In this sense, all nodes are more ’selective’ regarding individuals that are poorer than regarding the richer part of the population. To see this, compare the decay for the minimum and the maximum of the distribution for as a special case. For , with linear decay in , as there exists only a right tail, while for , which decays extremely fast in by a power function, as there exists only a left tail here. In this sense, the richest individual is far more ’selective’ in choosing their (poorer) link-neighbours than the poorest individual choosing their (richer) ones.
The theoretical expected segregation index we compare against our simulation results can be straightforwardly computed from those probabilities. Let be the set of nodes that are in the same group as node such as an income quantile. The probability to connect with a link-neighbour can then again by approximated as
(17)
Appendix B Perceived Quantiles in Perception Networks
-
Proof Sketch.
Pure Homophily implies a Tendency to the Median in Perceived Quantiles.
Consider an arbitrary node indexed in a graph characterised by adjacency matrix . Let denote their income, where defines the PDF of a exponential probability distribution defined over the real half-line with parameter and the corresponding CDF. Let be the number of links of node with even. This leaves us with possible permutations of link-neighbours. Assume further for that it is between and , such that
(18) Let now be an arbitrary realisation of a permitted set of incomes of nodes to which linked, indexed by out of the set of permitted sets with and size . Assume further that all incomes in are distinct. If link formation is independent of as the sole characteristic differentiating from all other nodes, all sets of the same size are equally likely with probability by extension, since connects to any other node with equal probability. This would be the case for both standard preferential attachment models as well as ER random graphs.
In our model, the probability that depends negatively on the absolute distance , such that . By linearity, the probability of node to have as their chosen set of incomes to which she is linked decreases in the sum of absolute differences, that is, . It follows, that as a local probability of a set of a given length being chosen by homophilic preferential attachment is maximised for a minimisation of . Since the benchmark without homophily is equal probability of for all sets of a given size , this condition also maximises the global probability that this set is chosen for a given size . Formally, the minimisation problem chooses a set or sets such that
(19) It remains to be shown that this minimisation leads to the choice of a set for which is the median value. The median requires the same number of values above or below in . With links for node of income rank and even, this requires values above and below . For as the median being minimising for the absolute distances, this requires i) that there exists no node with rank such that their income distance to is less than the income distance from node to the node ranked . If i) is violated, the node with rank is part of the distance-minimising set and thus, is not the median of . The symmetrical condition ii) requires that there is no node with rank such that its distance to is less than the distance of to the node with rank . In terms of a quantile function, we require
(20) and (21) Rearranging yields (22)
Expressing the left-hand side of inequalities for a generic distribution in (22) for an continuous exponential such that and substituting the quantile function, we require
| (23) |
The condition presupposes to be sufficiently large for the discrete realisations of the sample to approximate the quantiles of the continuous exponential distribution. We find this condition fulfilled for several numerical experiments. It is easy to see that the left-hand side condition in (22) is fulfilled for a quantile function whose first derivative is monotonically increasing which is the case for for and . We can also show this by manipulation of (23) as
| (24) | ||||
| (25) |
| which implies | ||||
| (27) | ||||
| (28) | ||||
| (29) | ||||
Since per definition, condition (29) is trivially fulfilled. Notice that this implies for an exponential initial distribution, cannot be below the median in the most likely set. The right hand-side of inequalities (22) is a bit more demanding. Stating the condition in terms of the quantile function for an exponential, we get
| (30) | ||||
| Simplifying yields | ||||
| (31) | ||||
| (32) | ||||
| (33) | ||||
| (34) | ||||
| (35) | ||||
For our discrete sample, which reveals that condition (35) is only a slightly more demanding condition than boundary condition (18) that guarantees the possibility of being a median in the first place and only differs by . Since we typically assume , this term vanishes. Indeed, for a realistic baseline scenario with and , the condition is fulfilled for the poorest of the population and thus for the vast majority. Together with the lower boundary condition (18), the tendency to place themselves in the middle should exist for about % of the population and thus the vast majority. Minimising absolute deviations for an exponential income distribution and thus entails choosing sets that let be the median of for almost all . While the strength of this mechanism will of course be dependent on , the median is the most likely outcome for any homophilic network as the perceived quantile for the vast majority of nodes.
Appendix C Linkage Based on Logarithmised Income Differences
In this appendix, we discuss the case where agents seek to minimise relative rather than absolute income differences in tie formation, i.e., weights for tie-formation are inversely proportional to the absolute distance in log income. Agent ’s weight in agent ’s draw is thus determined by
| (36) |
The scale-transformation by logarithmising tends to offset the property of the exponential income distribution to exhibit much higher (absolute) income differences in its upper tail than in the lower parts of the distribution, since the natural log has negative second derivative. For moderate to high levels of agents will have a strong tendency to choose an equal number of agents above or below them in income that is roughly homogeneous across the income distribution (apart from agents located at the boundary). For self-perceptions, this implies a ‘middle-class bias’ per stylised facts (i) and, by extension, (ii), as is also readily verified by simulation with the results below in Figures 21 to 21.
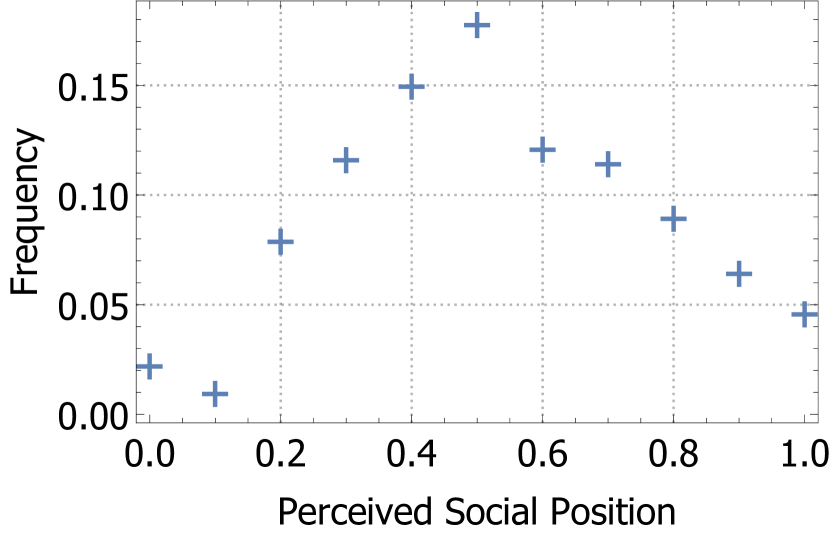
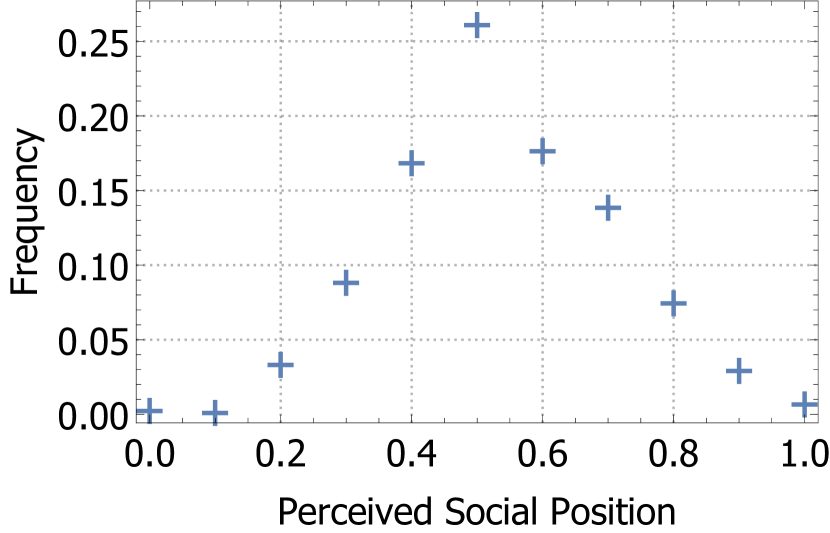
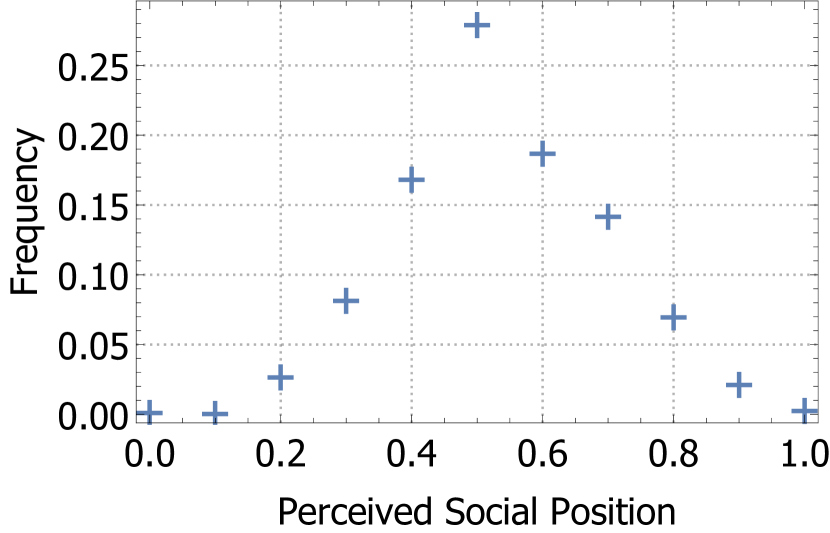
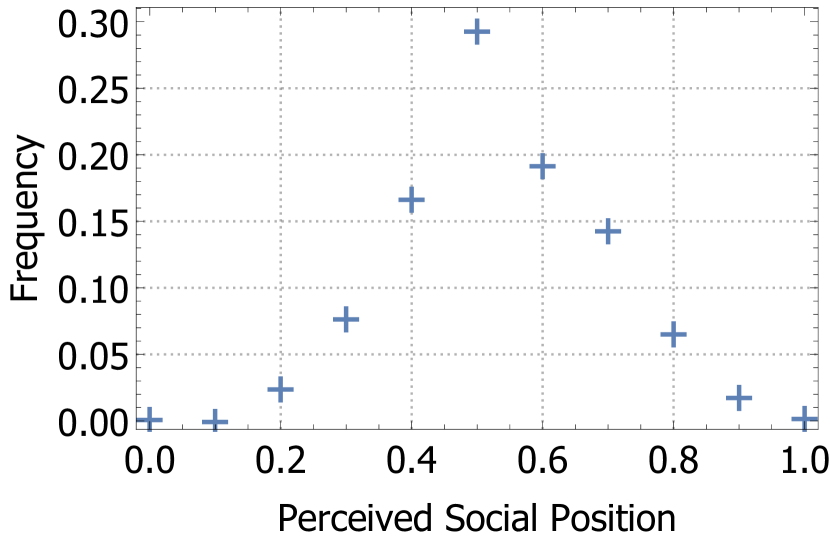
Note: The Figures report the perceived social positions for with bins each and for a choice function with log incomes in its argument. All Figures exhibit significant deviation from the benchmark with equal frequencies. While the tendency is apparent in all panels, its strength expectedly increases and perceptions are more narrowly clustered around the middle categories the higher is.
Logarithmising income in the weight function as in eq. (36) bears enormous consequences for inequality rather than self-perceptions, though. This is what Figure 22 below shows. Apart from agents at the respective upper and lower boundaries, the approximately homogeneous segregation tendency across the income distribution manifests itself in roughly homogeneous inequality perceptions for all considered . For low , the behaviour of local Ginis is thus broadly consistent with one aspect of stylised fact (iii), namely that perceived inequality tends to decrease in income rank, as is also shown in Figure 22 for . However, poor agents then drastically overestimate inequality in violation of the second aspect of stylised fact (iii) that (almost) all agents somewhat drastically underestimate inequality.
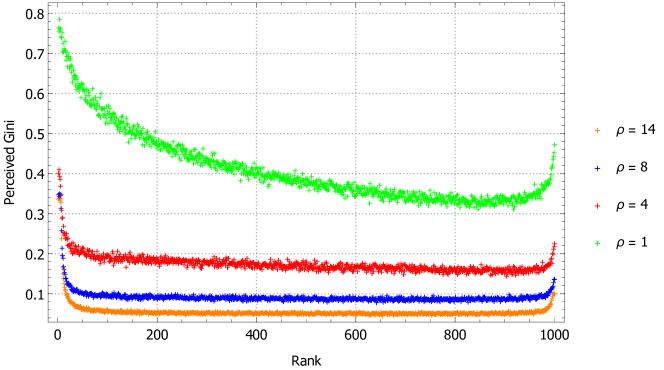
Heuristically, the behaviour of the local Gini coefficients is a direct consequence of the behaviour of an exponential income distribution on a log-scale. Incomes increase locally linear in rank around the mean income (of ) but increase much faster superlinearly near the upper and lower tails of the distribution, as Figure 23 shows.
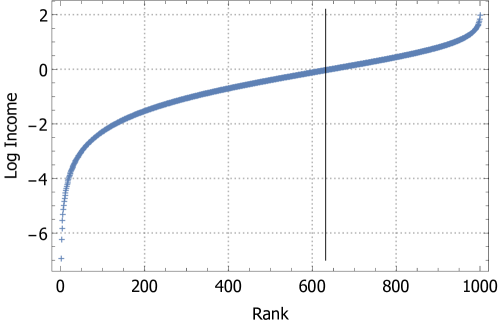
This shape of the distribution of logarithmised incomes implies that the agents with income at the lower tail will have a relatively strong probability of observing incomes around the mean, where income ranks do not change inclusion probabilities very much. Since these values are, from the perspective of low-income agents, extreme values, this higher probability of observing incomes within this locally linear region translates into higher expected inequality perceptions, as is evident from the boundary effects in Figure 22. A symmetric argument applies to the upper tail of the distribution, although with a more attenuated effect, since the mean income is closer to the maximum value in income rank due to the skewness of the exponential. Hence, the values around the mean are not as extreme from the perspective of the agents with maximal incomes, leading to a less pronounced increase in upper boundary inequality perceptions. Agents with log incomes located in the locally linear region exhibit the strongest tendency to perceive incomes close to them in rank and exhibit the most pronounced dislike of extreme perceptions at the upper and lower tail. In this sense, the bias against extreme values increases with decreasing distance to the mean income which indicates that inequality perceptions decrease until the mean income is reached and increase afterwards. Increasing then disproportionately affects extreme distances due to the exponential nature of the weights, mitigating any differences in perceptions caused by them. For , any differential behaviour is then barely visible in local inequality perceptions within Figure 22, in contrast to both stylised fact (iii) and our results for choice with absolute income differences.
References
- Alfarano & Milaković (2012) Alfarano, S. & Milaković, M. (2012). Identification of interaction effects in survey expectations: a cautionary note. Studies in Nonlinear Dynamics & Econometrics, 16(4)
- Alicke et al. (2010) Alicke, M. D., Zell, E. & Bloom, D. L. (2010). Mere categorization and the frog-pond effect. Psychological Science, 21(2), 174–177
- Anufriev et al. (2018) Anufriev, M., Chernulich, A. & Tuinstra, J. (2018). A laboratory experiment on the heuristic switching model. Journal of Economic Dynamics and Control, 91, 21–42
- Anufriev & Hommes (2012) Anufriev, M. & Hommes, C. (2012). Evolutionary selection of individual expectations and aggregate outcomes in asset pricing experiments. American Economic Journal: Microeconomics, 4(4), 35–64
- Barabási & Albert (1999) Barabási, A.-L. & Albert, R. (1999). Emergence of scaling in random networks. Science, 286(5439), 509–512
- Barde & Van Der Hoog (2017) Barde, S. & Van Der Hoog, S. (2017). An empirical validation protocol for large-scale agent-based models. Bielefeld Working Papers in Economics and Management, 04-2017
- Bartels (2018) Bartels, L. M. (2018). Unequal democracy: The political economy of the new gilded age. Princeton University Press
- Binelli & Loveless (2016) Binelli, C. & Loveless, M. (2016). The urban–rural divide: Perceptions of income and social inequality in Central and Eastern Europe. Economics of Transition, 24(2), 211–231
- Boguná et al. (2004) Boguná, M., Pastor-Satorras, R., Díaz-Guilera, A. & Arenas, A. (2004). Models of social networks based on social distance attachment. Physical Review E, 70(5), 056122
- Bojanowski & Corten (2014) Bojanowski, M. & Corten, R. (2014). Measuring segregation in social networks. Social Networks, 39(1), 14–32
- Borgatti & Foster (2003) Borgatti, S. P. & Foster, P. C. (2003). The network paradigm in organizational research: A review and typology. Journal of Management, 29(6), 991–1013
- Boucher (2015) Boucher, V. (2015). Structural homophily. International Economic Review, 56(1), 235–264
- Buckingham & Alicke (2002) Buckingham, J. T. & Alicke, M. D. (2002). The influence of individual versus aggregate social comparison and the presence of others on self-evaluations. Journal of Personality and Social Psychology, 83(5), 1117
- Campbell (2013) Campbell, D. E. (2013). Social networks and political participation. Annual Review of Political Science, 16, 33–48
- Caplan (2011) Caplan, B. (2011). The Myth of the Rational Voter: Why Democracies Choose Bad Policies-New Edition. Princeton University Press
- Cepić & Tonković (2020) Cepić, D. & Tonković, Ž. (2020). How social ties transcend class boundaries? Network variability as tool for exploring occupational homophily. Social Networks, 62, 33–42
- Chater et al. (2020) Chater, N., Zhu, J.-Q., Spicer, J., Sundh, J., León-Villagrá, P. & Sanborn, A. (2020). Probabilistic biases meet the Bayesian brain. Current Directions in Psychological Science, 29(5), 506–512
- Chen et al. (2012) Chen, W.-H., Myles, J. & Picot, G. (2012). Why have poorer neighbourhoods stagnated economically while the richer have flourished? Neighbourhood income inequality in Canadian cities. Urban Studies, 49(4), 877–896
- Chiang (2011) Chiang, Y.-S. (2011). Judgment of distributional inequality in networks. Social Networks, 33(4), 342–349
- Chiang (2015a) Chiang, Y.-S. (2015a). Good samaritans in networks: An experiment on how networks influence egalitarian sharing and the evolution of inequality. PloS One, 10(6), e0128777
- Chiang (2015b) Chiang, Y.-S. (2015b). Inequality measures perform differently in global and local assessments: An exploratory computational experiment. Physica A: Statistical Mechanics and its Applications, 437, 1–11
- Choi (2019) Choi, G. (2019). Revisiting the redistribution hypothesis with perceived inequality and redistributive preferences. European Journal of Political Economy, 58, 220–244
- Clark & Senik (2010) Clark, A. E. & Senik, C. (2010). Who compares to whom? The anatomy of income comparisons in europe. Economic Journal, 120(544), 573–594
- Cohen (1979) Cohen, J. (1979). Socio-economic status and high-school friendship choice: Elmtown’s youth revisited. Social Networks, 2(1), 65–74
- Collier & Tuckett (2020) Collier, P. & Tuckett, D. (2020). Narratives as a coordinating device for reversing regional disequilibrium. Rebuilding Macroeconomics Working Paper Series, 22
- Conyon & Muldoon (2006) Conyon, M. J. & Muldoon, M. R. (2006). The small world of corporate boards. Journal of Business Finance & Accounting, 33(9-10), 1321–1343
- Cruces et al. (2013) Cruces, G., Perez-Truglia, R. & Tetaz, M. (2013). Biased perceptions of income distribution and preferences for redistribution: Evidence from a survey experiment. Journal of Public Economics, 98, 100–112
- Dall & Christensen (2002) Dall, J. & Christensen, M. (2002). Random geometric graphs. Physical Review E, 66(1), 016121
- Davis et al. (2003) Davis, G. F., Yoo, M. & Baker, W. E. (2003). The small world of the American corporate elite, 1982–2001. Strategic Organization, 1(3), 301–326
- Dawtry et al. (2015) Dawtry, R. J., Sutton, R. M. & Sibley, C. G. (2015). Why wealthier people think people are wealthier, and why it matters: From social sampling to attitudes to redistribution. Psychological Science, 26(9), 1389–1400
- De Paula (2017) De Paula, A. (2017). Econometrics of network models. In Advances in Economics and Econometrics: Theory and Applications: Eleventh World Congress, vol. 1, (pp. 268–323). Cambridge University Press
- Drăgulescu & Yakovenko (2001) Drăgulescu, A. & Yakovenko, V. M. (2001). Evidence for the exponential distribution of income in the USA. The European Physical Journal B, 20(4), 585–589
- Duesenberry (1949) Duesenberry, J. S. (1949). Income, saving, and the theory of consumer behavior. Harvard University Press
- Engelhardt & Wagener (2018) Engelhardt, C. & Wagener, A. (2018). What do Germans think and know about income inequality? A survey experiment. Socio-Economic Review, 16(4), 743–767
- Epstein (1999) Epstein, J. M. (1999). Agent-based computational models and generative social science. Complexity, 4(5), 41–60
- Erdős & Rényi (1960) Erdős, P. & Rényi, A. (1960). On the evolution of random graphs. Publ. Math. Inst. Hung. Acad. Sci, 5(1), 17–60
- Evans & Kelley (2004) Evans, M. D. & Kelley, J. (2004). Subjective social location: Data from 21 nations. International Journal of Public Opinion Research, 16(1), 3–38
- Fagiolo et al. (2019) Fagiolo, G., Guerini, M., Lamperti, F., Moneta, A. & Roventini, A. (2019). Validation of agent-based models in economics and finance. In C. Beisbart & N. J. Saam (Eds.), Computer Simulation Validation: Fundamental Concepts, Methodological Frameworks, and Philosophical Perspectives, (pp. 763–787). Cham: Springer International Publishing
- Fechner (1862) Fechner, G. T. (1862). Elemente der Psychophysik. Breitkopf und Härtel, Leipzig
- Festinger (1954) Festinger, L. (1954). A theory of social comparison processes. Human Relations, 7(2), 117–140
- Flieth & Foster (2002) Flieth, B. & Foster, J. (2002). Interactive expectations. Journal of Evolutionary Economics, 12(4), 375–395
- Formankiewicz & Mollon (2009) Formankiewicz, M. A. & Mollon, J. (2009). The psychophysics of detecting binocular discrepancies of luminance. Vision research, 49(15), 1929–1938
- Foster et al. (2012) Foster, J. L., Huthwaite, T., Yesberg, J. A., Garry, M. & Loftus, E. F. (2012). Repetition, not number of sources, increases both susceptibility to misinformation and confidence in the accuracy of eyewitnesses. Acta psychologica, 139(2), 320–326
- Frank et al. (2014) Frank, R. H., Levine, A. S. & Dijk, O. (2014). Expenditure cascades. Review of Behavioral Economics, 1(1–2), 55–73
- Franke & Westerhoff (2017) Franke, R. & Westerhoff, F. (2017). Taking stock: A rigorous modelling of animal spirits in macroeconomics. Journal of Economic Surveys, 31(5), 1152–1182
- Fronczak et al. (2004) Fronczak, A., Fronczak, P. & Hołyst, J. A. (2004). Average path length in random networks. Physical Review E, 70(5), 056110
- Gabaix (2020) Gabaix, X. (2020). A Behavioral New Keynesian Model. American Economic Review, 110(8), 2271–2327
- Galaskiewicz (2007) Galaskiewicz, J. (2007). Has a network theory of organizational behaviour lived up to its promises? Management and Organization Review, 3(1), 1–18
- Galí (2015) Galí, J. (2015). Monetary policy, inflation, and the business cycle: an introduction to the new Keynesian framework and its applications. Princeton University Press
- Gilbert & Troitzsch (2005) Gilbert, N. & Troitzsch, K. (2005). Simulation for the social scientist. McGraw-Hill Education (UK)
- Gimpelson & Treisman (2018) Gimpelson, V. & Treisman, D. (2018). Misperceiving inequality. Economics and Politics, 30(1), 27–54
- Golub & Jackson (2012) Golub, B. & Jackson, M. O. (2012). How homophily affects the speed of learning and best-response dynamics. Quarterly Journal of Economics, 127(3), 1287–1338
- Gräbner (2018) Gräbner, C. (2018). How to relate models to reality? An epistemological framework for the validation and verification of computational models. Journal of Artificial Societies and Social Simulation, 21(3)
- Group (2016) Group, I. R. (2016). International Social Survey Programme (ISSP) 1985-2014. GESIS Data Archive, Cologne
- Grüne-Yanoff & Verreault-Julien (2021) Grüne-Yanoff, T. & Verreault-Julien, P. (2021). How-possibly explanations in economics: anything goes? Journal of Economic Methodology, 28(1), 114–123
- Hall & Soskice (2001) Hall, P. A. & Soskice, D. (2001). Varieties of Capitalism: The Institutional Foundations of Comparative Advantage. Oxford University Press
- Hamilton et al. (2007) Hamilton, M. J., Milne, B. T., Walker, R. S., Burger, O. & Brown, J. H. (2007). The complex structure of hunter–gatherer social networks. Proceedings of the Royal Society B: Biological Sciences, 274(1622), 2195–2203
- Huckfeldt (1983) Huckfeldt, R. R. (1983). Social contexts, social networks, and urban neighborhoods: Environmental constraints on friendship choice. American Journal of Sociology, 89(3), 651–669
- Humphries & Gurney (2008) Humphries, M. D. & Gurney, K. (2008). Network ‘small-world-ness’: a quantitative method for determining canonical network equivalence. PloS One, 3(4), e0002051
- Hvidberg et al. (2020) Hvidberg, K. B., Kreiner, C. & Stantcheva, S. (2020). Social position and fairness views. Working Paper 28099, National Bureau of Economic Research
- Iacono & Ranaldi (2021) Iacono, R. & Ranaldi, M. (2021). The nexus between perceptions of inequality and preferences for redistribution. The Journal of Economic Inequality, 19(1), 97–114
- Kalmijn (1991) Kalmijn, M. (1991). Status homogamy in the United States. American Journal of Sociology, 97(2), 496–523
- Kalmijn & Flap (2001) Kalmijn, M. & Flap, H. (2001). Assortative meeting and mating: Unintended consequences of organized settings for partner choices. Social Forces, 79(4), 1289–1312
- Karadja et al. (2017) Karadja, M., Mollerstrom, J. & Seim, D. (2017). Richer (and holier) than thou? The effect of relative income improvements on demand for redistribution. Review of Economics and Statistics, 99(2), 201–212
- Karimi et al. (2018) Karimi, F., Génois, M., Wagner, C., Singer, P. & Strohmaier, M. (2018). Homophily influences ranking of minorities in social networks. Scientific reports, 8(1), 1–12
- Kelley & Evans (1995) Kelley, J. & Evans, M. (1995). Class and Class Conflict in Six Western Nations. American Sociological Review, 60(2), 157–178
- Kenworthy & Mccall (2008) Kenworthy, L. & Mccall, L. (2008). Inequality, public opinion and redistribution. Socio-Economic Review, 6(1), 35–68
- Kim et al. (2018) Kim, H., Huh, S., Choi, S. & Lee, Y. (2018). Perceptions of inequality and attitudes towards redistribution in four East Asian welfare states. International Journal of Social Welfare, 27(1), 28–39
- Kleinberg (2001) Kleinberg, J. (2001). Small-world phenomena and the dynamics of information. Advances in neural information processing systems, 14, 431–438
- Knell & Stix (2020) Knell, M. & Stix, H. (2020). Perceptions of inequality. European Journal of Political Economy, 65, 101927
- Kogut & Walker (2001) Kogut, B. & Walker, G. (2001). The small world of Germany and the durability of national networks. American Sociological Review, 66(3), 317–335
- Kraus et al. (2017) Kraus, M. W., Rucker, J. M. & Richeson, J. A. (2017). Americans misperceive racial economic equality. Proceedings of the National Academy of Sciences, 114(39), 10324–10331
- Kuhn (2019) Kuhn, A. (2019). The subversive nature of inequality: Subjective inequality perceptions and attitudes to social inequality. European Journal of Political Economy, 59, 331–344
- Kuklinski et al. (2000) Kuklinski, J. H., Quirk, P. J., Jerit, J., Schwieder, D. & Rich, R. F. (2000). Misinformation and the currency of democratic citizenship. Journal of Politics, 62(3), 790–816
- Lazarsfeld et al. (1954) Lazarsfeld, P. F., Merton, R. K. et al. (1954). Friendship as a social process: A substantive and methodological analysis. Freedom and control in modern society, 18(1), 18–66
- Lewis et al. (2012) Lewis, K., Gonzalez, M. & Kaufman, J. (2012). Social selection and peer influence in an online social network. Proceedings of the National Academy of Sciences, 109(1), 68–72
- Lodge et al. (1995) Lodge, M., Steenbergen, M. R. & Brau, S. (1995). The responsive voter: Campaign information and the dynamics of candidate evaluation. American Political Science Review, 89(2), 309–326
- Luce (1977) Luce, R. D. (1977). The choice axiom after twenty years. Journal of Mathematical Psychology, 15(3), 215–233
- Lux (2009) Lux, T. (2009). Rational forecasts or social opinion dynamics? Identification of interaction effects in a business climate survey. Journal of Economic Behavior & Organization, 72(2), 638–655
- MacCarron et al. (2016) MacCarron, P., Kaski, K. & Dunbar, R. (2016). Calling Dunbar’s numbers. Social Networks, 47, 151 – 155
- Mahajan et al. (2014) Mahajan, S., Dinh, V. T., Rab, H., Trieu, V. Q., Nguyen, L. V., Kwakwa, V. & Verghis, M. (2014). Taking stock: an update on Vietnam’s recent economic developments. Tech. rep., Washington, D.C.: World Bank Group
- Mäki (2009) Mäki, U. (2009). MISSing the world. Models as isolations and credible surrogate systems. Erkenntnis, 70, 29–43
- Malacarne (2017) Malacarne, T. (2017). Rich friends, poor friends: Inter–socioeconomic status friendships in secondary school. Socius, 3, 2378023117736994
- Manski & McFadden (1981) Manski, C. F. & McFadden, D. (1981). Structural analysis of discrete data with econometric applications. MIT press Cambridge, MA
- Mayer & Puller (2008) Mayer, A. & Puller, S. L. (2008). The old boy (and girl) network: Social network formation on university campuses. Journal of Public Economics, 92(1-2), 329–347
- McCall et al. (2017) McCall, L., Burk, D., Laperrière, M. & Richeson, J. A. (2017). Exposure to rising inequality shapes americans’ opportunity beliefs and policy support. Proceedings of the National Academy of Sciences, 114(36), 9593–9598
- McPherson et al. (2001) McPherson, M., Smith-Lovin, L. & Cook, J. M. (2001). Birds of a feather: Homophily in social networks. Annual Review of Sociology, 27(1), 415–444
- Moore & Newman (2000) Moore, C. & Newman, M. E. (2000). Epidemics and percolation in small-world networks. Physical Review E, 61(5), 5678
- Newman et al. (2018) Newman, B. J., Shah, S. & Lauterbach, E. (2018). Who sees an hourglass? Assessing citizens’ perception of local economic inequality. Research and Politics, 5(3)
- Newman (2001) Newman, M. E. (2001). The structure of scientific collaboration networks. Proceedings of the National Academy of Sciences, 98(2), 404–409
- Newman (2009) Newman, M. E. (2009). Random graphs with clustering. Physical Review Letters, 103(5), 058701
- Newman et al. (2001) Newman, M. E., Strogatz, S. H. & Watts, D. J. (2001). Random graphs with arbitrary degree distributions and their applications. Physical Review E, 64(2), 026118
- Osberg & Smeeding (2006) Osberg, L. & Smeeding, T. (2006). ”Fair“ inequality? Attitudes toward pay differentials: The United States in comparative perspective. American Sociological Review, 71(3), 450–473
- Page & Shapiro (1993) Page, B. I. & Shapiro, R. Y. (1993). The rational public and democracy. In Reconsidering the Democratic Public. Pennsylvania State University Press
- Pesaran & Weale (2006) Pesaran, M. H. & Weale, M. (2006). Survey expectations, vol. 1, (pp. 715–776). Elsevier
- Pienkowski & Hagerman (2009) Pienkowski, M. & Hagerman, B. (2009). Auditory intensity discrimination as a function of level-rove and tone duration in normal-hearing and impaired subjects: The ”mid-level hump“ revisited. Hearing research, 253(1-2), 107–115
- Rawls (2005) Rawls, J. (2005). Political liberalism. Columbia University Press
- Reardon & Bischoff (2011) Reardon, S. F. & Bischoff, K. (2011). Income inequality and income segregation. American Journal of Sociology, 116(4), 1092–1153
- Reutlinger et al. (2018) Reutlinger, A., Hangleiter, D. & Hartmann, S. (2018). Understanding (with) toy models. The British Journal for the Philosophy of Science, 69(4), 1069–1099
- Sanborn & Chater (2016) Sanborn, A. N. & Chater, N. (2016). Bayesian brains without probabilities. Trends in Cognitive Sciences, 20(12), 883–893
- Schwarz et al. (2016) Schwarz, N., Newman, E. & Leach, W. (2016). Making the truth stick & the myths fade: Lessons from cognitive psychology. Behavioral Science & Policy, 2(1), 85–95
- Silva & Yakovenko (2004) Silva, A. C. & Yakovenko, V. M. (2004). Temporal evolution of the “thermal” and “superthermal” income classes in the USA during 1983–2001. EPL (Europhysics Letters), 69(2), 304
- Sirvanci (1993) Sirvanci, M. B. (1993). An empirical study of price thresholds and price sensitivity. Journal of Applied Business Research (JABR), 9(2), 43–49
- Snell et al. (1995) Snell, J., Gibbs, B. J. & Varey, C. (1995). Intuitive hedonics: Consumer beliefs about the dynamics of liking. Journal of Consumer Psychology, 4(1), 33–60
- Snijders (2011) Snijders, T. A. (2011). Statistical models for social networks. Annual Review of Sociology, 37, 131–153
- Stevenson & Duch (2013) Stevenson, R. T. & Duch, R. (2013). The meaning and use of subjective perceptions in studies of economic voting. Electoral Studies, 32(2), 305–320
- Sugden (2009) Sugden, R. (2009). Credible worlds, capacities and mechanisms. Erkenntnis, 70(1), 3–27
- Talaga & Nowak (2020) Talaga, S. & Nowak, A. (2020). Homophily as a process generating social networks: Insights from social distance attachment model. Journal of Artificial Societies and Social Simulation, 23(2), 6
- Tao et al. (2019) Tao, Y., Wu, X., Zhou, T., Yan, W., Huang, Y., Yu, H., Mondal, B. & Yakovenko, V. M. (2019). Exponential structure of income inequality: evidence from 67 countries. Journal of Economic Interaction and Coordination, 14(2), 345–376
- Thal (2017) Thal, A. (2017). Class isolation and affluent Americans’ perception of social conditions. Political Behavior, 39(2), 401–424
- Törnqvist et al. (1985) Törnqvist, L., Vartia, P. & Vartia, Y. O. (1985). How should relative changes be measured? The American Statistician, 39(1), 43–46
- Tóth et al. (2021) Tóth, G., Wachs, J., Di Clemente, R., Jakobi, Á., Ságvári, B., Kertész, J. & Lengyel, B. (2021). Inequality is rising where social network segregation interacts with urban topology. Nature Communications, 12(1), 1–9
- Uzzi & Spiro (2005) Uzzi, B. & Spiro, J. (2005). Collaboration and creativity: The small world problem. American Journal of Sociology, 111(2), 447–504
- Veblen (1899 [2001]) Veblen, T. (1899 [2001]). The Theory of the Leisure Class. New York: The Modern Library
- Watts (1999) Watts, D. J. (1999). Networks, dynamics, and the small-world phenomenon. American Journal of Sociology, 105(2), 493–527
- Watts & Strogatz (1998) Watts, D. J. & Strogatz, S. H. (1998). Collective dynamics of ’small-world’ networks. Nature, 393(6684), 440–442
- Weeden & Cornwell (2020) Weeden, K. A. & Cornwell, B. (2020). The small-world network of college classes: implications for epidemic spread on a university campus. Sociological Science, 7, 222–241
- Zaller (1992) Zaller, J. R. (1992). The nature and origins of mass opinion. Cambridge University Press
- Zell & Alicke (2009) Zell, E. & Alicke, M. D. (2009). Contextual neglect, self-evaluation, and the frog-pond effect. Journal of Personality and Social Psychology, 97(3), 467
- Zhou et al. (2005) Zhou, W.-X., Sornette, D., Hill, R. A. & Dunbar, R. I. (2005). Discrete hierarchical organization of social group sizes. Proceedings of the Royal Society B: Biological Sciences, 272(1561), 439–444