GraphBLAS on the Edge:
Anonymized High Performance Streaming of Network Traffic
††thanks: This material is based upon work supported by the Under Secretary of Defense for Research and Engineering under Air Force Contract No. FA8702-15-D-0001, National Science Foundation CCF-1533644, and United States Air Force Research Laboratory and Artificial Intelligence Accelerator Cooperative Agreement Number FA8750-19-2-1000. Any opinions, findings, conclusions or recommendations expressed in this material are those of the author(s) and do not necessarily reflect the views of the Under Secretary of Defense for Research and Engineering, the National Science Foundation, or the United States Air Force. The U.S. Government is authorized to reproduce and distribute reprints for Government purposes notwithstanding any copyright notation herein.
Abstract
Long range detection is a cornerstone of defense in many operating domains (land, sea, undersea, air, space, ..,). In the cyber domain, long range detection requires the analysis of significant network traffic from a variety of observatories and outposts. Construction of anonymized hypersparse traffic matrices on edge network devices can be a key enabler by providing significant data compression in a rapidly analyzable format that protects privacy. GraphBLAS is ideally suited for both constructing and analyzing anonymized hypersparse traffic matrices. The performance of GraphBLAS on an Accolade Technologies edge network device is demonstrated on a near worse case traffic scenario using a continuous stream of CAIDA Telescope darknet packets. The performance for varying numbers of traffic buffers, threads, and processor cores is explored. Anonymized hypersparse traffic matrices can be constructed at a rate of over 50,000,000 packets per second; exceeding a typical 400 Gigabit network link. This performance demonstrates that anonymized hypersparse traffic matrices are readily computable on edge network devices with minimal compute resources and can be a viable data product for such devices.
Index Terms:
Internet defense, packet capture, streaming graphs, hypersparse matricesI Introduction
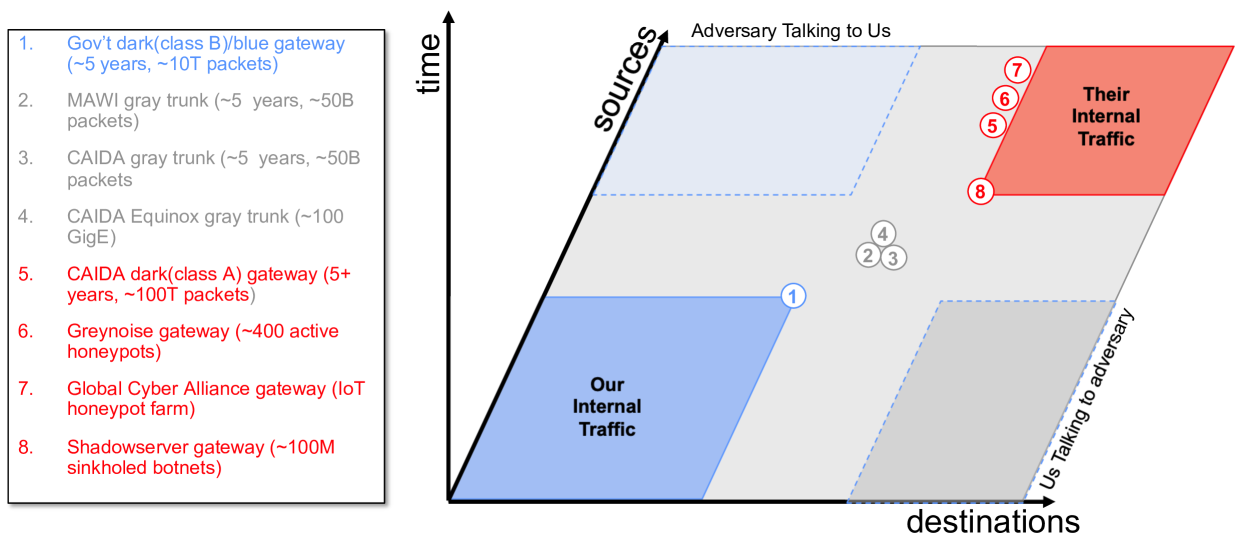
The Internet has become as essential as land, sea, air, and space for enabling activities as diverse as commerce, education, health, and entertainment [1, 2]. Long range detection has been a cornerstone of defense in many operating domains since anitquity [3, 4, 5, 6, 7, 8, 9, 10]. In the cyber domain, observatories and outposts have been constructed to gather data on Internet traffic and provide a starting point for exploring long range detection [11, 12, 13, 14, 15, 16, 17] (see Figure 1). The largest public Internet observatory is the Center for Applied Internet Data Analysis (CAIDA) Telescope that operates a variety of sensors including a continuous stream of packets from an unsolicited darkspace representing approximately 1/256 of the Internet [18, 19, 20, 21]. In general, long range detection requires the analysis of significant network traffic from a variety of observatories and outposts [22, 23].
The data volumes, processing requirements, and privacy concerns of analyzing a significant fraction of the Internet have been prohibitive. The North American Internet generates billions of non-video Internet packets each second [1, 2]. The GraphBLAS standard provides significant performance and compression capabilities which improve the feasibility of analyzing these volumes of data [24, 25, 26, 27, 28, 29, 30, 31, 32, 33, 34, 35, 36, 37, 38]. Specifically, the GraphBLAS is ideally suited for both constructing and analyzing anonymized hypersparse traffic matrices. Prior work with the GraphBLAS has demonstrated rates of 75 billion packets per second (pps) [39], while achieving compressions of 1 bit per packet [17], and enabling the analysis of the largest publicly available historical archives with over 40 trillion packets [40]. Analysis of anonymized hypersparse traffic matrices from a variety of sources has revealed power-law distributions [41, 42], novel scaling relations [17, 40], and inspired new models of network traffic [43].
GraphBLAS anonymized hypersparse traffic matrices represent one set of design choices for analyzing network traffic. Specifically, the use case requiring some data on all packets (no down-sampling), high performance, high compression, matrix-based analysis, anonymization, and open standards. There are a wide range of alternative graph/network analysis technologies and many good implementations achieve performance close to the limits of the underlying computing hardware [44, 45, 46, 47, 48, 49, 50, 51, 52, 53, 54]. Likewise, there are many network analysis tools that focus on providing a rich interface to the full diversity of data found in network traffic [55, 56, 57]. Each of these technologies has appropriate use cases in the broad field of Internet traffic analysis.
Sending large volumes of raw Internet traffic to a central location to construct anonymized hypersparse traffic matrices is prohibitive. To meet the goal of providing some data on all packets without down-sampling requires constructing the anonymized hypersparse traffic matrices in the network itself in order to realize the full data compression benefits. The goal of this paper is to explore the viability of this approach by measuring the performance of GraphBLAS on an on edge network device. The performance is measured on a near worse case traffic scenario using a continuous stream of CAIDA Telescope darknet packets (mostly botnets and scanners) which have an irregular distribution and almost no data payload (i.e., all header).
The outline of the rest of the paper is as follows. First, the CAIDA Telescope test data and some basic network quantities are defined in terms of traffic matrices. Next, the anonymized hypersparse traffic matrix pipeline is described followed by a description of the experimental setup and implementation. Finally, the results, conclusions, and directions for further work are presented.
II Test Data and Traffic Matrices
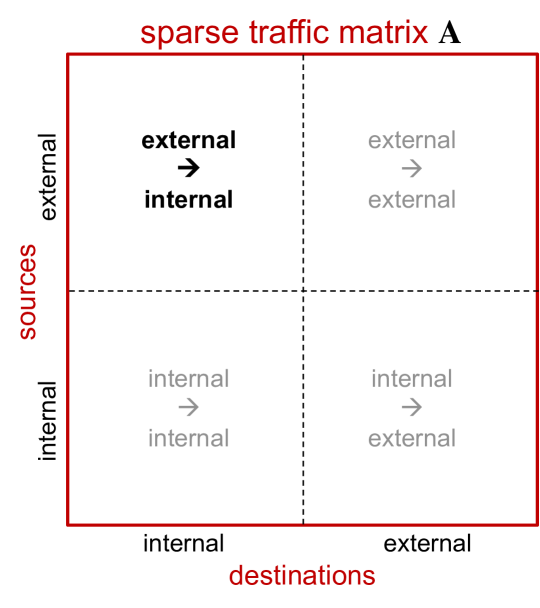
The test data is drawn from the CAIDA Telescope darknet packets (mostly botnets and scanners) and is a near worse case with a highly irregular distribution and almost no data payload (i.e., all header). The CAIDA Telescope monitors the traffic into and out of a set of network addresses providing a natural observation point of network traffic. These data can be viewed as a traffic matrix where each row is a source and each column is a destination. The CAIDA Telescope traffic matrix can be partitioned into four quadrants (see Figure 2). These quadrants represent different flows between nodes internal and external to the set of monitored addresses. Because the CAIDA Telescope network addresses are a darkspace, only the upper left (external internal) quadrant will have data.
Internet data must be handled with care, and CAIDA has pioneered trusted data sharing best practices that combine anonymizing source and destinations using CryptoPAN [58] with data sharing agreements. These data sharing best practices are the basis of the architecture presented here and include the following principles [22]
-
•
Data is made available in curated repositories
-
•
Using standard anonymization methods where needed: hashing, sampling, and/or simulation
-
•
Registration with a repository and demonstration of legitimate research need
-
•
Recipients legally agree to neither repost a corpus nor deanonymize data
-
•
Recipients can publish analysis and data examples necessary to review research
-
•
Recipients agree to cite the repository and provide publications back to the repository
-
•
Repositories can curate enriched products developed by researchers
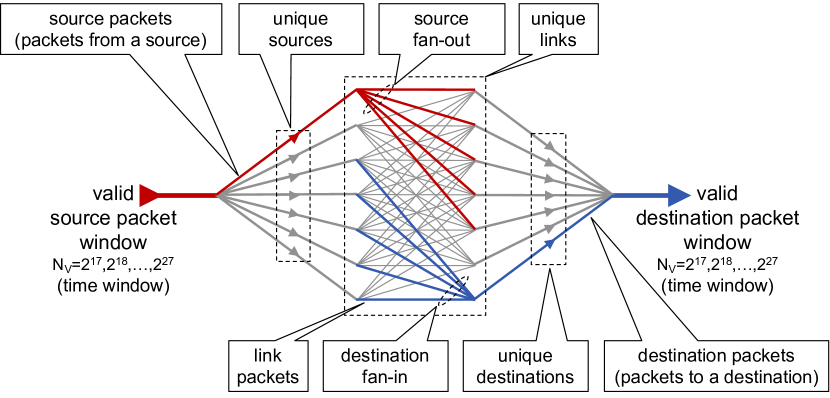
A primary benefit of constructing anonymized hypersparse traffic matrices with the GraphBLAS is the efficient computation of a wide range of network quantities via matrix mathematics. Figure 3 illustrates essential quantities found in all streaming dynamic networks. These quantities are all computable from anonymized traffic matrices created from the source and destinations found in Internet packet headers.
Formulas for computing network quantities from traffic matrix at time in both summation and matrix notation. is a column vector of all 1’s, T is the transpose operation, and is the zero-norm that sets each nonzero value of its argument to 1[59]. These formulas are unaffected by matrix permutations and will work on anonymized data.
| Aggregate | Summation | Matrix |
| Property | Notation | Notation |
| Valid packets | ||
| Unique links | ||
| Link packets from to | ||
| Max link packets () | ||
| Unique sources | ||
| Packets from source | ||
| Max source packets () | ||
| Source fan-out from | ||
| Max source fan-out () | ||
| Unique destinations | ||
| Destination packets to | ||
| Max destination packets () | ||
| Destination fan-in to | ||
| Max destination fan-in () |
The network quantities depicted in Figure 3 are computable from anonymized origin-destination traffic matrices that are widely used to represent network traffic [60, 61, 62, 63]. It is common to filter the packets down to a valid set for any particular analysis. Such filters may limit particular sources, destinations, protocols, and time windows. To reduce statistical fluctuations, the streaming data should be partitioned so that for any chosen time window all data sets have the same number of valid packets [64]. At a given time , consecutive valid packets are aggregated from the traffic into a hypersparse matrix , where is the number of valid packets between the source and destination . The sum of all the entries in is equal to
Constant packet, variable time samples simplify the statistical analysis of the heavy-tail distributions commonly found in network traffic quantities [41, 65, 42]. All the network quantities depicted in Figure 3 can be readily computed from using the formulas listed in Table I. Because matrix operations are generally invariant to permutation (reordering of the rows and columns), these quantities can readily be computed from anonymized data. Furthermore, the anonymized data can be analyzed by subranges of IPs using simple matrix multiplication. For a given subrange represented by an anonymized hypersparse diagonal matrix , where implies source/destination is in the range, the traffic within the subrange can be computed via: . Likewise, for additional privacy guarantees that can be implemented at the edge, the same method can be used to exclude a range of data from the traffic matrix
The contiguous nature of these data allows the exploration of a wide range of packet windows from (sub-second) to (minutes), providing a unique view into how network quantities depend upon time. These observations provide new insights into normal network background traffic that could be used for anomaly detection, AI feature engineering, polystore index learning, and testing theoretical models of streaming networks [66, 67, 68].
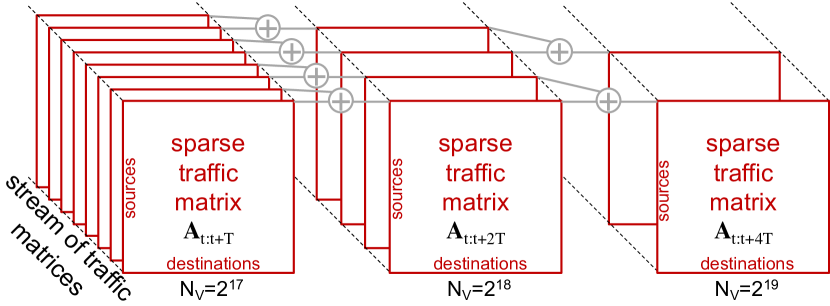
Network traffic is dynamic and exhibits varying behavior on a wide range of time scales. A given packet window size will be sensitive to phenomena on its corresponding timescale. Determining how network quantities scale with provides insight into the temporal behavior of network traffic. Efficient computation of network quantities on multiple time scales can be achieved by hierarchically aggregating data in different time windows [64]. Figure 4 illustrates a binary aggregation of different streaming traffic matrices. Computing each quantity at each hierarchy level eliminates redundant computations that would be performed if each packet window was computed separately. Hierarchy also ensures that most computations are performed on smaller matrices residing in faster memory. Correlations among the matrices mean that adding two matrices each with entries results in a matrix with fewer than entries, reducing the relative number of operations as the matrices grow.
One of the important capabilities of the SuiteSparse GraphBLAS library is direct support of hypersparse matrices where the number of nonzero entries is significantly less than either dimensions of the matrix. If the packet source and destination identifiers are drawn from a large numeric range, such as those used in the Internet protocol, then a hypersparse representation of eliminates the need to keep track of additional indices and can significantly accelerate the computations [39].
III Hypersparse Matrix Pipeline
The aforementioned analysis goals set the requirements for the GraphBLAS hypersparse traffic matrix pipeline. Specifically, the compression benefits are maximized if the GraphBLAS hypersparse traffic matrix is constructed in the network as close to the network traffic as possible as this minimizes the amount of data that needs to be sent over the network. In addition, collection at the network source allows the data owner to construct and own the anonymization scheme and only share anonymized data under trusted data sharing agreements with the parties tasked with analyzing the data [69].
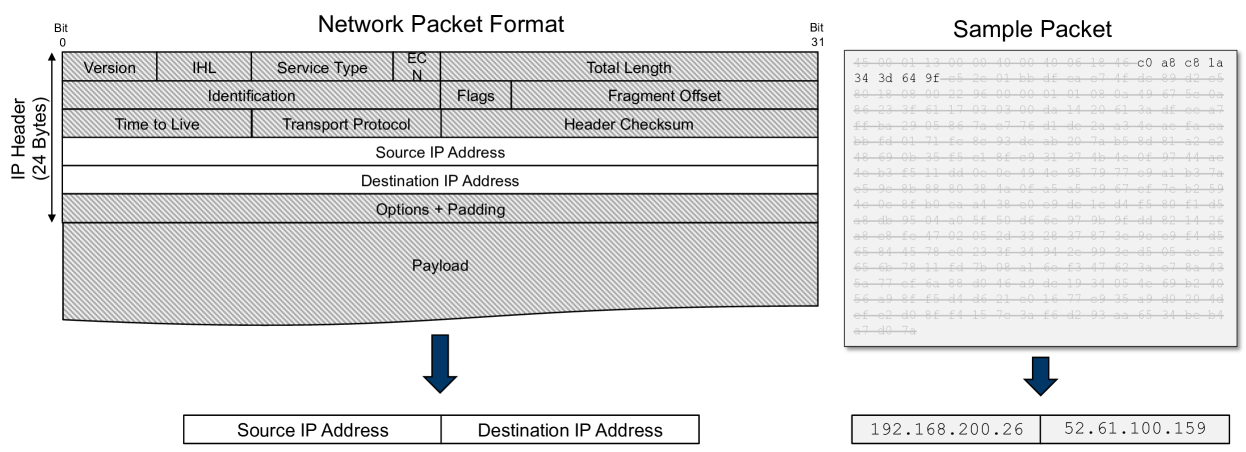
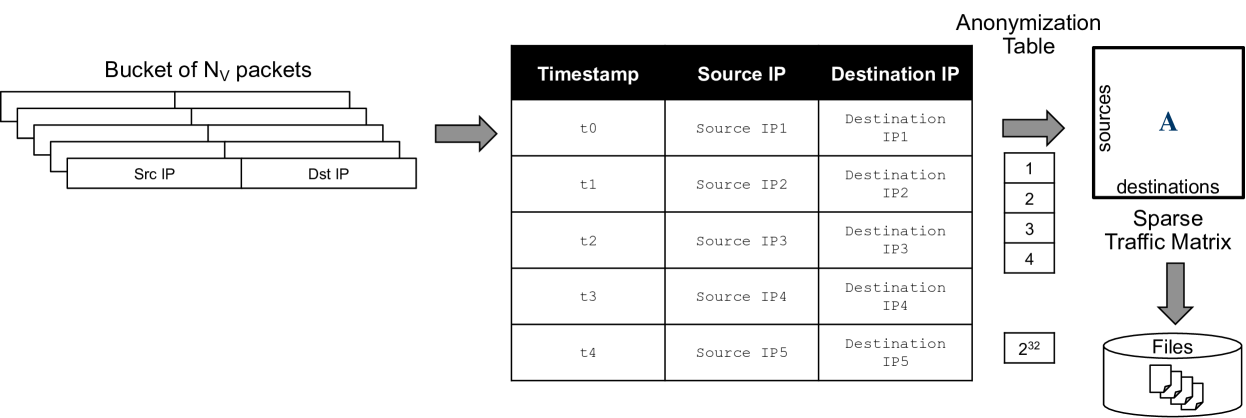
The first step in the GraphBLAS hypersparse traffic matrix pipeline is to capture a packet, discard the data payload, and extract the source and destination Internet Protocol (IP) addresses (Figure 5). For the purposes of the current performance testing, only IPv4 packets are used which are stored as 32 bit unsigned integers. Collections of consecutive packets are then each anonymized using a cryptoPAN generated anonymization table. The resulting anonymized source and destination IPs are then used to construct a hypersparse GraphBLAS matrix. 64 consecutive hypersparse GraphBLAS matrices are each serialized in compressed sparse rows (CSR) format with LZ4 compression and saved to a UNIX TAR file (Figure 6). The TAR files can be further compressed using other compressing methods (if desired) and then transmitted to the appropriate parties tasked for analysis. For example, standard gzip compression reduces file size by 40% but also reduces performance by 80%.
IV Implementation
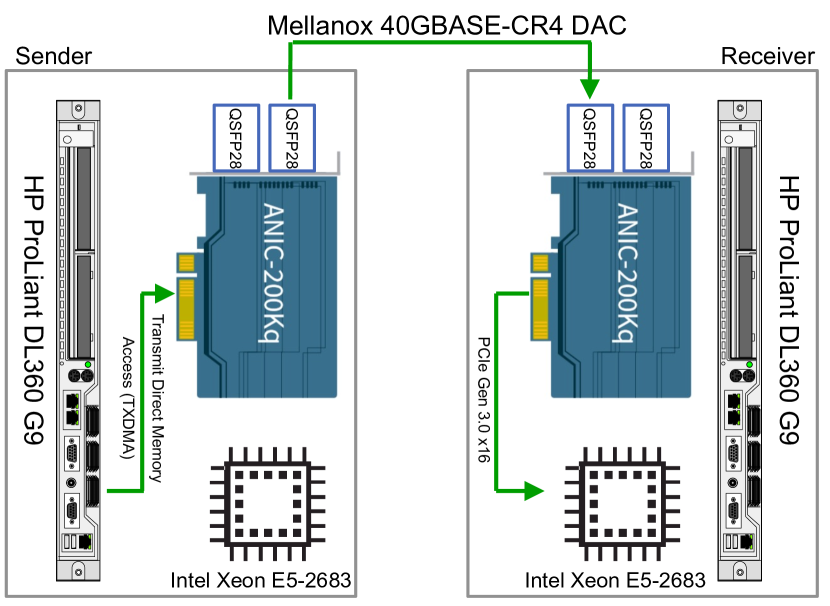
Effective implementation of the GraphBLAS pipeline requires that the anonymization, creation, and saving of the resulting files can keep up with the data rates of typical high bandwidth links. To measure this performance two Accolade Technology ANIC-200Kq dual port 100 gigabit flow classification and shunting adapters were installed into the PCIe slots of two HP Proliant DL360 G9 servers (Figure 7). These servers were connected via a Mellanox 40 gigabit network connection. ANIC-200Kq cards are capable of a wide range of analysis techniques, this experiment only used their data transmission, shunting, and buffering capabilities.
The C implementation of the GraphBLAS hypersparse traffic matrix pipeline shown in Figures 5 and 6 was run on dual Intel Xeon E5-2683 processors in the receiver server. The Accolade card on the receiver server collects packets in ring buffers, the number of which can be set at initialization. Using C pthreads [70] an Accolade worker thread is assigned to each Accolade hardware ring. Within each Accolade worker thread, a block of IPv4 packets are collected and a GraphBLAS worker thread is spawned to process the block in subblocks of packets. Each sublock is anonymized using a cryptoPAN generated anonymization vector and the resulting anonymized sources and destinations are used to construct a GraphBLAS matrix. The matrix is the serialized and appended to a TAR buffer, which is saved to a file after all 64 subblocks have been processed. A more detailed outline of the code is as follows:
__________________________________________________ Main Thread
-
•
Set number of Accolade hardware rings
-
•
Load entry IPv4 anonymization table
-
•
For each Accolade hardware ring
-
–
Launch Accolade Worker thread
-
–
Accolade Worker
-
•
Create libpcap handle to Accolade device
-
•
Allocate 64MB buffer for packet processing
-
•
For each packet
-
–
Retrieve packet from Accolade device buffers
-
–
Append source and destination IP addresses to buffer
-
–
If buffer has packets
-
Launch GraphBLAS Worker thread with pointer to packet buffer
-
Allocate new 64MB buffer for packet processing
-
-
–
GraphBLAS Worker
-
•
Initialize GraphBLAS
-
•
For each subblock of packets
-
–
Create new GraphBLAS matrix
-
–
Create row, column and value vectors
-
–
For each packet in subblock
-
Lookup in anonymization table
-
Insert into row, column and value vectors
-
-
–
Build GraphBLAS matrix from row, column and value vectors; summing duplicate entries
-
–
Serialize and compress GraphBLAS matrix
-
–
Append to TAR buffer
-
–
-
•
Write TAR buffer to file
__________________________________________________
V Results
Using the experimental setup shown in Figure 7, a number of performance experiments were conducted. In these experiments the sender server would load CAIDA Telescope packets into the sender Accolade card and sends the packets at defined rate over the network to the receiver server where the receiver Accolade card loads the packets into its hardware rings. Likewise, on the receiver server the GraphBLAS hypersparse traffic matrix pipeline described in the previous section was executed. The cryptoPAN anonymization table was created offline, stored, and loaded at startup. The reason for this is that the single core cryptoPAN performance is approximately 700,000 IP address per second. The entry cryptoPAN anonymization lookup table dramatically speeds up the performance. Generation of the table is readily run in parallel and can be generated in a few seconds (if desired). The rate of packets being sent was adjusted to achieve the maximum rate without dropped packets, which indicated that the GraphBLAS hypersparse traffic matrix pipeline was able to keep up with the incoming traffic. The number of hardware rings were varied which increase the number of threads/cores being used.
CAIDA Telescope data are a near worse case scenario because almost all of the packets have no payload and very few packets use the same source and destination connection so the resulting hypersparse traffic matrices have very few entries that are greater than 1. An advantage of the few payloads in the CAIDA Telescope data is that it allows the emulation of packet streams that are representative of much higher bandwidth networks than the current experimental setup is capable of.
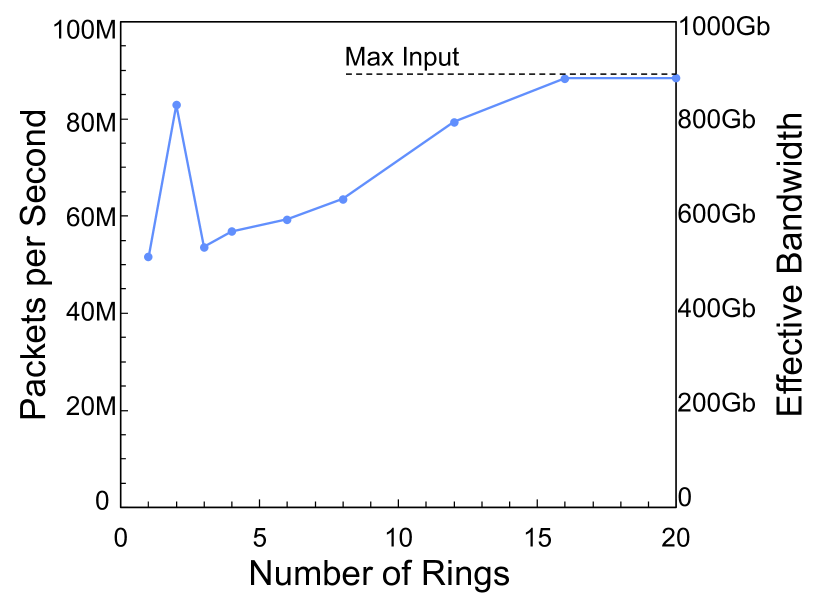
Figure 8 shows the performance in terms packets per second versus the number of hardware rings used. GraphBLAS matrix construction is highly cache sensitive due to the underlying index sorting required. The performance of a single ring using a few processing threads/cores is over 50M packets per second. The performance increases significantly using two rings, and then drops with 3 rings because of cache effects. Using 16 rings makes up for the cache effects with increased parallelism and the performance reaches the maximum number of packets the sender server can send to the receiver (approximately 88M packets per second). The packet performance can be converted into an estimated equivalent bandwidth using a representative packet size of 10,000 bits per packet (see Figure 8 right vertical axis). The performance measurements indicate that a standard server is a capable of constructing anonymized hypersparse traffic matrices at a rate above that corresponding to a typical 400 Gigabit network link.
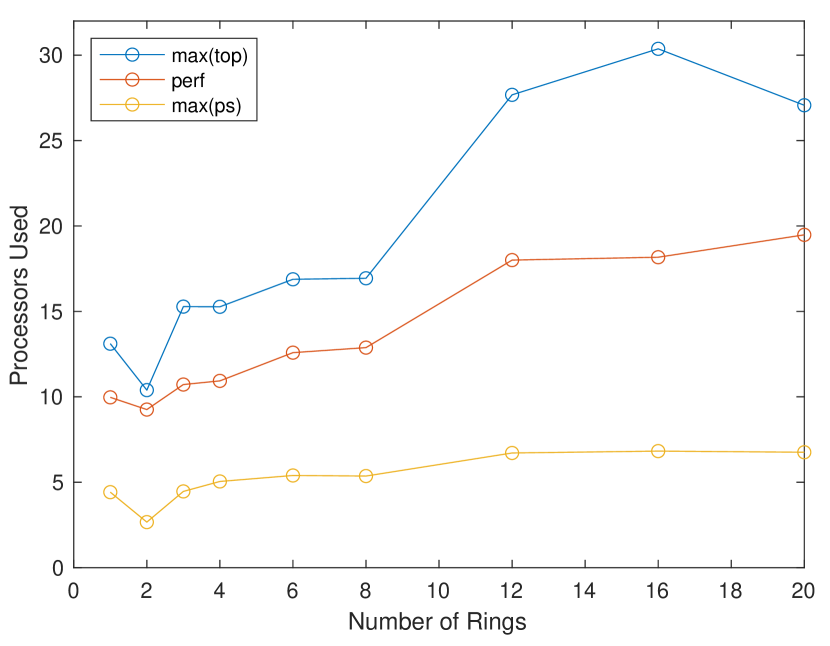
Figure 9 shows the processors used as computed by the max load of the Linux top command, average load of the Linux perf command, and the max load of the Linux ps command. top is a point in time measurement of utilization at the precise moment of polling and was sampled at 1 second intervals. perf is an estimated average of the processor load throughout the process lifetime. ps reports percentage of time spent running during the entire lifetime of the process and was sampled at 1 second intervals. Combined these results indicate that the peak performance achieved using 2 rings (see Figure 8) required only a handful of cores.
VI Conclusions and Future Work
For many operating domains (land, sea, undersea, air, space, ..,) long range detection is a cornerstone of defense. Long range detection in the cyber domain requires significant network traffic to be analyzed from a variety of observatories and outposts. Construction of anonymized hypersparse traffic matrices on edge network devices can be a key enabler by providing significant data compression in a rapidly analyzable format that protects privacy. Constructing and analyzing anonymized hypersparse traffic matrices are operations ideally suited to the GraphBLAS high performance library. Using an Accolade Technologies edge network device the performance of the GraphBLAS is demonstrated on a near worse case traffic scenario using a continuous stream of CAIDA Telescope darknet packets. The performance was explored by varying the number of traffic ring buffers, which are proportional to the number of threads and processor cores used. Rates of over 50,000,000 packets per second for constructing anonymized hypersparse traffic matrices were achieved which exceeds a typical 400 Gigabit network link.
This performance demonstrates that anonymized hypersparse traffic matrices are readily computable on edge network devices with minimal compute resources and can be a viable data product for such devices. This work suggests a variety of future directions that could be pursued (1) exploring additional network cards; (2) develpoing the appropriate key management architecture for multiple observatories and outposts; (3) analysis of spatial temporal patterns in anonymized traffic matrices to identify adversarial activities; (4) cross-correlation of data from different observatories and outposts; (5) development of AI algorithms for classification of background traffic; (6) creation of underlying models of traffic.
Acknowledgments
The authors wish to acknowledge the following individuals for their contributions and support: Bob Bond, Stephen Buckley, Ronisha Carter, Cary Conrad, Alan Edelman, Tucker Hamilton, Jeff Gottschalk, Nathan Frey, Chris Hill, Mike Kanaan, Tim Kraska, Andrew Morris, Charles Leiserson, Dave Martinez, Mimi McClure, Joseph McDonald, Sandy Pentland, Christian Prothmann, John Radovan, Steve Rejto, Daniela Rus, Matthew Weiss, Marc Zissman.
References
- [1] “Cisco Visual Networking Index: Forecast and Trends.” https://newsroom.cisco.com/press-release-content?articleId=1955935.
- [2] “Cisco Visual Networking Index: Forecast and Trends, 2018–2023.” https://www.cisco.com/c/en/us/solutions/collateral/executive-perspectives/annual-internet-report/white-paper-c11-741490.html.
- [3] W. P. Delaney, Perspectives on Defense Systems Analysis. MIT Press, 2015.
- [4] S. Topouzi, A. Sarris, Y. Pikoulas, S. Mertikas, X. Frantzis, and A. Giourou, “Ancient mantineia’s defence network reconsidered through a gis approach,” BAR INTERNATIONAL SERIES, vol. 1016, pp. 559–566, 2002.
- [5] Y. Shu and Y. He, “Research on the historical and cultural value of and protection strategy for rammed earth watchtower houses in chongqing, china,” Built Heritage, vol. 5, no. 1, pp. 1–16, 2021.
- [6] R. Cacciotti, “The ’guardian of the pontifical state’: structural assessment of a damaged coastal watchtower in south lazio,” Master’s thesis, Universidade do Minho, 2010.
- [7] R. A. Watson-Watt, Three Steps to Victory: A Personal Account by Radar’s Greatest Pioneer. London: Odhams Press, 1957.
- [8] W. P. Delaney, “Air defense of the united states: Strategic missions and modern technology,” International Security, vol. 15, no. 1, pp. 181–211, 1990.
- [9] J. Geul, E. Mooij, and R. Noomen, “Modelling and assessment of the current and future space surveillance network,” 7th ECSD, 2017.
- [10] K. W. O’Haver, C. K. Barker, G. D. Dockery, and J. D. Huffaker, “Radar development for air and missile defense,” Johns Hopkins APL Tech. Digest, vol. 34, no. 2, pp. 140–153, 2018.
- [11] “CAIDA Anonymized Internet Traces Dataset (April 2008 - January 2019).” https://www.caida.org/catalog/datasets/passive_dataset/.
- [12] “UCSD Network Telescope.” https://www.caida.org/projects/network_telescope/.
- [13] “Global Cyber Alliance.” https://www.globalcyberalliance.org/.
- [14] “Greynoise.” https://greynoise.io/.
- [15] “MAWI Working Group Traffic Archive.” http://mawi.wide.ad.jp/mawi/.
- [16] “Shadowserver Foundation.” https://www.shadowserver.org/.
- [17] J. Kepner, C. Meiners, C. Byun, S. McGuire, T. Davis, W. Arcand, J. Bernays, D. Bestor, W. Bergeron, V. Gadepally, R. Harnasch, M. Hubbell, M. Houle, M. Jones, A. Kirby, A. Klein, L. Milechin, J. Mullen, A. Prout, A. Reuther, A. Rosa, S. Samsi, D. Stetson, A. Tse, C. Yee, and P. Michaleas, “Multi-temporal analysis and scaling relations of 100,000,000,000 network packets,” in 2020 IEEE High Performance Extreme Computing Conference (HPEC), pp. 1–6, 2020.
- [18] K. Claffy, “Measuring the internet,” IEEE Internet Computing, vol. 4, no. 1, pp. 73–75, 2000.
- [19] B. Li, J. Springer, G. Bebis, and M. H. Gunes, “A survey of network flow applications,” Journal of Network and Computer Applications, vol. 36, no. 2, pp. 567–581, 2013.
- [20] M. Rabinovich and M. Allman, “Measuring the internet,” IEEE Internet Computing, vol. 20, no. 4, pp. 6–8, 2016.
- [21] k. claffy and D. Clark, “Workshop on internet economics (wie 2019) report,” SIGCOMM Comput. Commun. Rev., vol. 50, p. 53–59, May 2020.
- [22] J. Kepner, J. Bernays, S. Buckley, K. Cho, C. Conrad, L. Daigle, K. Erhardt, V. Gadepally, B. Greene, M. Jones, R. Knake, B. Maggs, P. Michaleas, C. Meiners, A. Morris, A. Pentland, S. Pisharody, S. Powazek, A. Prout, P. Reiner, K. Suzuki, K. Takhashi, T. Tauber, L. Walker, and D. Stetson, “Zero botnets: An observe-pursue-counter approach.” Belfer Center Reports, 6 2021.
- [23] S. Weed, “Beyond zero trust: Reclaiming blue cyberspace,” Master’s thesis, United States Army War College, 2022.
- [24] J. Kepner and J. Gilbert, Graph algorithms in the language of linear algebra. SIAM, 2011.
- [25] J. Kepner, D. Bader, A. Buluç, J. Gilbert, T. Mattson, and H. Meyerhenke, “Graphs, matrices, and the graphblas: Seven good reasons,” Procedia Computer Science, vol. 51, pp. 2453–2462, 2015.
- [26] J. Kepner, P. Aaltonen, D. Bader, A. Buluç, F. Franchetti, J. Gilbert, D. Hutchison, M. Kumar, A. Lumsdaine, H. Meyerhenke, S. McMillan, C. Yang, J. D. Owens, M. Zalewski, T. Mattson, and J. Moreira, “Mathematical foundations of the graphblas,” in 2016 IEEE High Performance Extreme Computing Conference (HPEC), pp. 1–9, 2016.
- [27] A. Buluç, T. Mattson, S. McMillan, J. Moreira, and C. Yang, “Design of the graphblas api for c,” in 2017 IEEE International Parallel and Distributed Processing Symposium Workshops (IPDPSW), pp. 643–652, 2017.
- [28] J. Kepner, M. Kumar, J. Moreira, P. Pattnaik, M. Serrano, and H. Tufo, “Enabling massive deep neural networks with the graphblas,” in 2017 IEEE High Performance Extreme Computing Conference (HPEC), pp. 1–10, IEEE, 2017.
- [29] C. Yang, A. Buluç, and J. D. Owens, “Implementing push-pull efficiently in graphblas,” in Proceedings of the 47th International Conference on Parallel Processing, pp. 1–11, 2018.
- [30] T. A. Davis, “Algorithm 1000: Suitesparse:graphblas: Graph algorithms in the language of sparse linear algebra,” ACM Trans. Math. Softw., vol. 45, Dec. 2019.
- [31] J. Kepner and H. Jananthan, Mathematics of big data: Spreadsheets, databases, matrices, and graphs. MIT Press, 2018.
- [32] T. A. Davis, “Algorithm 1000: Suitesparse: Graphblas: Graph algorithms in the language of sparse linear algebra,” ACM Transactions on Mathematical Software (TOMS), vol. 45, no. 4, pp. 1–25, 2019.
- [33] T. Mattson, T. A. Davis, M. Kumar, A. Buluc, S. McMillan, J. Moreira, and C. Yang, “Lagraph: A community effort to collect graph algorithms built on top of the graphblas,” in 2019 IEEE International Parallel and Distributed Processing Symposium Workshops (IPDPSW), pp. 276–284, IEEE, 2019.
- [34] P. Cailliau, T. Davis, V. Gadepally, J. Kepner, R. Lipman, J. Lovitz, and K. Ouaknine, “Redisgraph graphblas enabled graph database,” in 2019 IEEE International Parallel and Distributed Processing Symposium Workshops (IPDPSW), pp. 285–286, IEEE, 2019.
- [35] T. A. Davis, M. Aznaveh, and S. Kolodziej, “Write quick, run fast: Sparse deep neural network in 20 minutes of development time via suitesparse: Graphblas,” in 2019 IEEE High Performance Extreme Computing Conference (HPEC), pp. 1–6, IEEE, 2019.
- [36] M. Aznaveh, J. Chen, T. A. Davis, B. Hegyi, S. P. Kolodziej, T. G. Mattson, and G. Szárnyas, “Parallel graphblas with openmp,” in 2020 Proceedings of the SIAM Workshop on Combinatorial Scientific Computing, pp. 138–148, SIAM, 2020.
- [37] B. Brock, A. Buluç, T. G. Mattson, S. McMillan, and J. E. Moreira, “Introduction to graphblas 2.0,” in 2021 IEEE International Parallel and Distributed Processing Symposium Workshops (IPDPSW), pp. 253–262, IEEE, 2021.
- [38] M. Pelletier, W. Kimmerer, T. A. Davis, and T. G. Mattson, “The graphblas in julia and python: the pagerank and triangle centralities,” in 2021 IEEE High Performance Extreme Computing Conference (HPEC), pp. 1–7, 2021.
- [39] J. Kepner, T. Davis, C. Byun, W. Arcand, D. Bestor, W. Bergeron, V. Gadepally, M. Hubbell, M. Houle, M. Jones, A. Klein, P. Michaleas, L. Milechin, J. Mullen, A. Prout, A. Rosa, S. Samsi, C. Yee, and A. Reuther, “75,000,000,000 streaming inserts/second using hierarchical hypersparse graphblas matrices,” in 2020 IEEE International Parallel and Distributed Processing Symposium Workshops (IPDPSW), pp. 207–210, 2020.
- [40] J. Kepner, M. Jones, D. Andersen, A. Buluç, C. Byun, K. Claffy, T. Davis, W. Arcand, J. Bernays, D. Bestor, W. Bergeron, V. Gadepally, M. Houle, M. Hubbell, A. Klein, C. Meiners, L. Milechin, J. Mullen, S. Pisharody, A. Prout, A. Reuther, A. Rosa, S. Samsi, D. Stetson, A. Tse, C. Yee, and P. Michaleas, “Spatial temporal analysis of 40,000,000,000,000 internet darkspace packets,” in 2021 IEEE High Performance Extreme Computing Conference (HPEC), pp. 1–8, 2021.
- [41] J. Kepner, K. Cho, K. Claffy, V. Gadepally, P. Michaleas, and L. Milechin, “Hypersparse neural network analysis of large-scale internet traffic,” in 2019 IEEE High Performance Extreme Computing Conference (HPEC), pp. 1–11, 2019.
- [42] J. Kepner, K. Cho, K. Claffy, V. Gadepally, S. McGuire, L. Milechin, W. Arcand, D. Bestor, W. Bergeron, C. Byun, M. Hubbell, M. Houle, M. Jones, A. Prout, A. Reuther, A. Rosa, S. Samsi, C. Yee, and P. Michaleas, “New phenomena in large-scale internet traffic,” in Massive Graph Analytics (D. Bader, ed.), pp. 1–53, Chapman and Hall/CRC, 2022.
- [43] P. Devlin, J. Kepner, A. Luo, and E. Meger, “Hybrid power-law models of network traffic,” arXiv preprint arXiv:2103.15928, 2021.
- [44] A. Tumeo, O. Villa, and D. Sciuto, “Efficient pattern matching on gpus for intrusion detection systems,” in Proceedings of the 7th ACM International Conference on Computing Frontiers, CF ’10, (New York, NY, USA), p. 87–88, Association for Computing Machinery, 2010.
- [45] M. Kumar, W. P. Horn, J. Kepner, J. E. Moreira, and P. Pattnaik, “Ibm power9 and cognitive computing,” IBM Journal of Research and Development, vol. 62, no. 4/5, pp. 10–1, 2018.
- [46] J. Ezick, T. Henretty, M. Baskaran, R. Lethin, J. Feo, T.-C. Tuan, C. Coley, L. Leonard, R. Agrawal, B. Parsons, and W. Glodek, “Combining tensor decompositions and graph analytics to provide cyber situational awareness at hpc scale,” in 2019 IEEE High Performance Extreme Computing Conference (HPEC), pp. 1–7, 2019.
- [47] P. Gera, H. Kim, P. Sao, H. Kim, and D. Bader, “Traversing large graphs on gpus with unified memory,” Proceedings of the VLDB Endowment, vol. 13, no. 7, pp. 1119–1133, 2020.
- [48] A. Azad, M. M. Aznaveh, S. Beamer, M. Blanco, J. Chen, L. D’Alessandro, R. Dathathri, T. Davis, K. Deweese, J. Firoz, H. A. Gabb, G. Gill, B. Hegyi, S. Kolodziej, T. M. Low, A. Lumsdaine, T. Manlaibaatar, T. G. Mattson, S. McMillan, R. Peri, K. Pingali, U. Sridhar, G. Szarnyas, Y. Zhang, and Y. Zhang, “Evaluation of graph analytics frameworks using the gap benchmark suite,” in 2020 IEEE International Symposium on Workload Characterization (IISWC), pp. 216–227, 2020.
- [49] Z. Du, O. A. Rodriguez, J. Patchett, and D. A. Bader, “Interactive graph stream analytics in arkouda,” Algorithms, vol. 14, no. 8, p. 221, 2021.
- [50] S. Acer, A. Azad, E. G. Boman, A. Buluç, K. D. Devine, S. Ferdous, N. Gawande, S. Ghosh, M. Halappanavar, A. Kalyanaraman, A. Khan, M. Minutoli, A. Pothen, S. Rajamanickam, O. Selvitopi, N. R. Tallent, and A. Tumeo, “Exagraph: Graph and combinatorial methods for enabling exascale applications,” The International Journal of High Performance Computing Applications, vol. 35, no. 6, pp. 553–571, 2021.
- [51] M. P. Blanco, S. McMillan, and T. M. Low, “Delayed asynchronous iterative graph algorithms,” in 2021 IEEE High Performance Extreme Computing Conference (HPEC), pp. 1–7, IEEE, 2021.
- [52] N. K. Ahmed, N. Duffield, and R. A. Rossi, “Online sampling of temporal networks,” ACM Transactions on Knowledge Discovery from Data (TKDD), vol. 15, no. 4, pp. 1–27, 2021.
- [53] A. Azad, O. Selvitopi, M. T. Hussain, J. R. Gilbert, and A. Buluç, “Combinatorial blas 2.0: Scaling combinatorial algorithms on distributed-memory systems,” IEEE Transactions on Parallel and Distributed Systems, vol. 33, no. 4, pp. 989–1001, 2021.
- [54] D. Koutra, “The power of summarization in graph mining and learning: smaller data, faster methods, more interpretability,” Proceedings of the VLDB Endowment, vol. 14, no. 13, pp. 3416–3416, 2021.
- [55] R. Hofstede, P. Čeleda, B. Trammell, I. Drago, R. Sadre, A. Sperotto, and A. Pras, “Flow monitoring explained: From packet capture to data analysis with netflow and ipfix,” IEEE Communications Surveys & Tutorials, vol. 16, no. 4, pp. 2037–2064, 2014.
- [56] R. Sommer, “Bro: An open source network intrusion detection system,” Security, E-learning, E-Services, 17. DFN-Arbeitstagung über Kommunikationsnetze, 2003.
- [57] P. Lucente, “pmacct: steps forward interface counters,” Tech. Rep., 2008.
- [58] J. Fan, J. Xu, M. H. Ammar, and S. B. Moon, “Prefix-preserving ip address anonymization: measurement-based security evaluation and a new cryptography-based scheme,” Computer Networks, vol. 46, no. 2, pp. 253–272, 2004.
- [59] J. Karvanen and A. Cichocki, “Measuring sparseness of noisy signals,” in 4th International Symposium on Independent Component Analysis and Blind Signal Separation, pp. 125–130, 2003.
- [60] A. Soule, A. Nucci, R. Cruz, E. Leonardi, and N. Taft, “How to identify and estimate the largest traffic matrix elements in a dynamic environment,” in ACM SIGMETRICS Performance Evaluation Review, vol. 32, pp. 73–84, ACM, 2004.
- [61] Y. Zhang, M. Roughan, C. Lund, and D. L. Donoho, “Estimating point-to-point and point-to-multipoint traffic matrices: an information-theoretic approach,” IEEE/ACM Transactions on Networking (TON), vol. 13, no. 5, pp. 947–960, 2005.
- [62] P. J. Mucha, T. Richardson, K. Macon, M. A. Porter, and J.-P. Onnela, “Community structure in time-dependent, multiscale, and multiplex networks,” science, vol. 328, no. 5980, pp. 876–878, 2010.
- [63] P. Tune, M. Roughan, H. Haddadi, and O. Bonaventure, “Internet traffic matrices: A primer,” Recent Advances in Networking, vol. 1, pp. 1–56, 2013.
- [64] J. Kepner, V. Gadepally, L. Milechin, S. Samsi, W. Arcand, D. Bestor, W. Bergeron, C. Byun, M. Hubbell, M. Houle, M. Jones, A. Klein, P. Michaleas, J. Mullen, A. Prout, A. Rosa, C. Yee, and A. Reuther, “Streaming 1.9 billion hypersparse network updates per second with d4m,” in 2019 IEEE High Performance Extreme Computing Conference (HPEC), pp. 1–6, 2019.
- [65] J. Nair, A. Wierman, and B. Zwart, “The fundamentals of heavy tails: Properties, emergence, and estimation,” Preprint, California Institute of Technology, 2020.
- [66] A. J. Elmore, J. Duggan, M. Stonebraker, M. Balazinska, U. Cetintemel, V. Gadepally, J. Heer, B. Howe, J. Kepner, T. Kraska, et al., “A demonstration of the bigdawg polystore system,” Proceedings of the VLDB Endowment, vol. 8, no. 12, p. 1908, 2015.
- [67] T. Kraska, A. Beutel, E. H. Chi, J. Dean, and N. Polyzotis, “The case for learned index structures,” in Proceedings of the 2018 International Conference on Management of Data, SIGMOD 18, (New York, NY, USA), pp. 489–504, Association for Computing Machinery, 2018.
- [68] E. H. Do and V. N. Gadepally, “Classifying anomalies for network security,” in ICASSP 2020 - 2020 IEEE International Conference on Acoustics, Speech and Signal Processing (ICASSP), pp. 2907–2911, 2020.
- [69] S. Pisharody, J. Bernays, V. Gadepally, M. Jones, J. Kepner, C. Meiners, P. Michaleas, A. Tse, and D. Stetson, “Realizing forward defense in the cyber domain,” in 2021 IEEE High Performance Extreme Computing Conference (HPEC), pp. 1–7, IEEE, 2021.
- [70] B. Nichols, D. Buttlar, and J. P. Farrell, Pthreads programming. O’Reilly & Associates, Inc., 1996.