∎
22email: reynar@math.uio.no 33institutetext: A. Jensen 44institutetext: University of Oslo
A method to estimate particle sizes using the open source software OpenPTV.
Abstract
A method to obtain particle sizes from images that are used for particle tracking velocimetry is proposed. This is an open source method, developed to use together with the open source software OpenPTV. First, the analysis of different factors that affect the estimation of the particle size is made. Then, a transformation is proposed to estimate the sizes from information obtained in OpenPTV. The method requires an extra calibration with a flat target containing circles of different sizes, but if the calibration is successful, the sizes of particles can be estimated reliable within certain limits. For example, for solid of non-translucent particles, sizes can be estimated with an error of maximum 10 %, as long as the particle diameter correspond to at least three pixels width in the obtained images. For translucent particles some extra assumptions will be needed in the transformation.
Keywords:
particle size particle tracking open source1 Introduction
In different sciences, the distribution of sizes of observed objects or particles can be important, for example, in the study of multi phase flows. The distribution of the sizes can also be important when estimating source functions of droplets created in the ocean’s boundary layer. In some cases it is also important to combine measurements of the size of particles together with their kinematics, in that way information of the flow that surrounds them can also be obtained. In this case, techniques that follow the particles in a flow, can provide the Lagrangian description of the surrounding flow. Using holography technique, detailed study of size and relative position of the particles can be done, from where tracking of the trajectories can also be done katz2010applications . Laser based methods also allow the measurement of velocity of the particle simultaneously to the size measurements black1996laser ; bachalo1984phase ; koothur2021tracking ; damaschke2002optical . The typical accuracy of the optical techniques range between 5 and 15% black1996laser ; tropea2011optical ; kozul2019scanning . Other alternatives to laser or holography can also be explored. Specially in the case where the experimental setup or location does not allow the use of these techniques and only simple imaging is available.
In later years open source software has become very popular in the scientific community. Open source software has the advantage that the source code and interfaces are made available for the community to explore, modify and distribute. This is important because it facilitates the sharing of the ideas, reduces the costs and time necessary to create a new software with the same characteristics and functionality. In addition, new features can be added and build upon a common platform, which facilitates the reuse of previous codes rather than individual in-house development, which is probably redundant throughout different research groups. In this work, the open source software OpenPTV was used. OpenPTV is the abbreviation for the Open Source Particle Tracking Velocimetry consortium openptv2014openptv . The OpenPTV foundation is a collaborative effort of several research groups to develop a software for Particle Tracking Velocimetry in 3 Dimensions (3DPTV). The method consists in basically three steps: the identification of illuminated tracer particles from multiple camera views, a triangulation of the probable 3D location of the particles, and the link of particle locations in time to form probable particle trajectories. This technique is well-established and have been used for the study of 3D Lagrangian particle motion in turbulent flows maas1993particle ; malik1993particle ; luthi2005lagrangian . To reconstruct particle trajectories, the accurate triangulation of the locations of tracer particles, and the unambiguous link of particles to form trajectories are needed. The goal of establishing such particle tracks is often to calculate Lagrangian velocities and accelerations. Today there exists different software with similar algorithms to perform PTV. But none of them present an extra feature where the sizes of the particles can be analyzed simultaneously.
In the present work, a methodology to find an estimate of the size of particles in addition to the tracking of their trajectories is presented. The calibration procedure and the technique are detailed in the following. The code uses Python as primary coding language and is available to complement the use of the open source software OpenPTV. The sizing not only complements the tracking by PTV but depends also on the quality of the tracking. Some of the error sources are analyzed an presented. This is a first approximation of the procedure which has proved to give large improvements by reducing the error.
2 Methodology
Particle tracking has shown to be a reliable technique to estimate kinematics of particles moving in a flow. When combined with stereoscopic camera vision, it can achieve 3 dimensional tracing of the particles. The uncertainties in the positions of the particles depend primarily on the optical properties of the media involved, the imaging arrangement and quality of the images, and the quality of the calibration dracos1996particle . Therefore, to obtain a successful tracking setup, it is necessary to perform a rigorous and high quality calibration. This calibration, when successful, should allow to obtain an accurate pixel-to-world transformation that can be applied on the retrieved images. Moreover, by using the results of the PTV algorithm we can determine the position of the particles compared to the focal planes of the cameras and determine their sizes more accurately using this information.
To perform PTV, the most common setups include illumination by laser, but in this case the most appropriate illumination technique is back lighting with LED lamps. By using back lighting we can obtain defined contours of the observed particles that can be translated in to real size raffel1998particle ; hagsater2008investigations ; broder2007planar . There are a few disadvantages of LED-back-illumination. Nonetheless, with an appropriate optical setup, these effects can be minimized. For example, LED light might saturate the images easily and without light-camera synchronization, blurry images will be obtained for particles that travel fast compared to the exposure times, this can be avoided if a very quick shutter speed is used. The quality of the optical system can be determined by a series of equations (raffel1998particle, , Chapter 2), where we can establish the minimum measurable particle size.
From the images, the pixel lengths for each particle in the vertical and horizontal axis of the image can be retrieved. From this information we can calculate the diameter or major and minor axis lengths on and . Then, the pixel-to-world transformation –obtained in the calibration– will be applied to retrieve a length estimation along and . The accuracy of the length estimation will depend on the image resoultion and quality, the accuracy of the particle tracking and how well we can defined the optical properties of the system, which depend mainly in the camera and lens characteristics and the illumination. In the following, a description of the proposed methodology will be done as a proof of concept for the development of such measurements.
2.1 Experimental setup
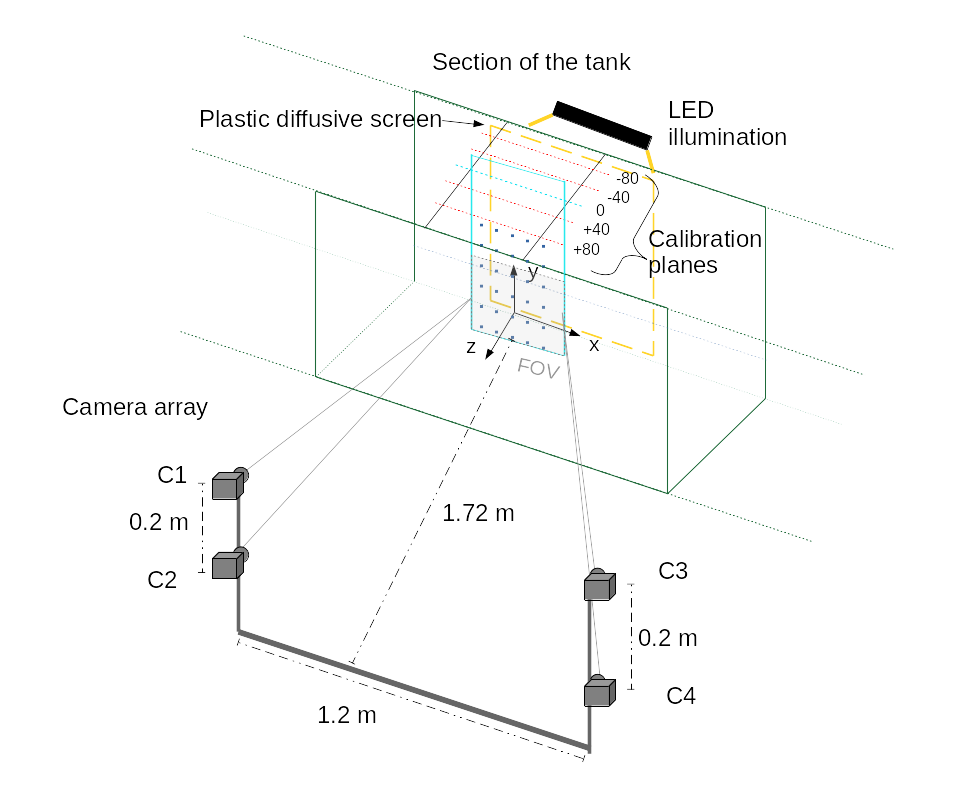
Figure 1 shows a schematic description of the setup. This study has been conducted in the Hydrodynamics Laboratory of the University of Oslo. The setup is situated in a wave tank with dimensions 1 m. For the most part of this development, there has been no water in the tank, because the aim is to visualize water droplets traveling through air. To retrieve the images, four AOS Promon U1000 cameras were positioned in one side of the wave tank. The cameras had a resolution of pixels and produced 8-bit gray scale images with a frame rate of 167 FPS. The positions of the cameras allowed them to capture a similar FOV. The illumination was provided by LED lamps in the opposite side of the tank and a white diffusive plastic sheet was used to distribute the light. According to equations … this optical system is reliable to measure particles with diameters in a volume of approximately 294 mm.
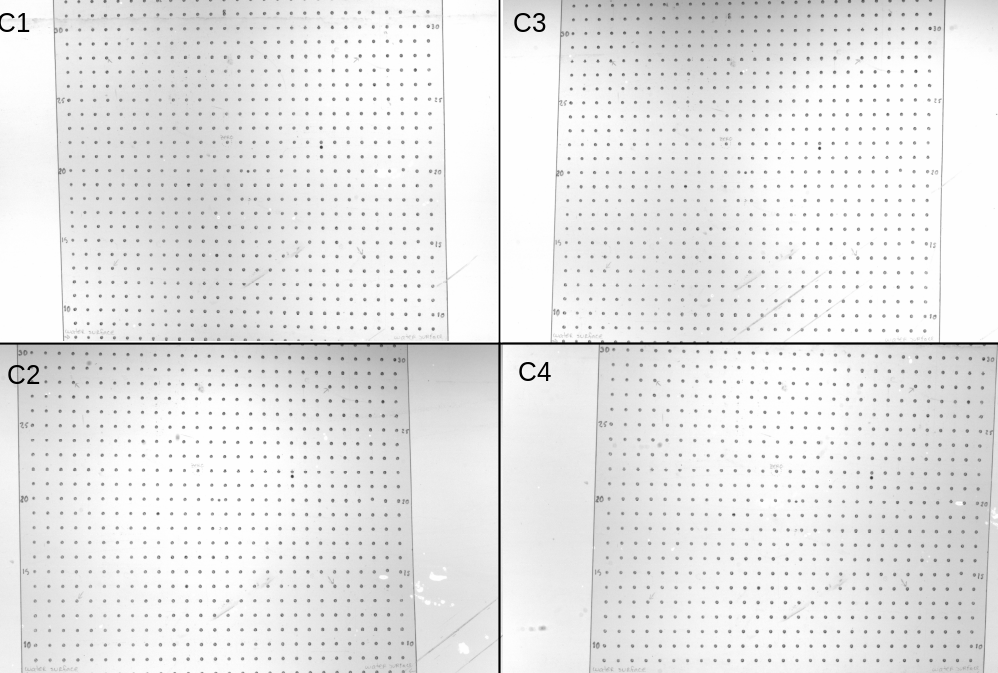
To calibrate the PTV system, the method known as multiple plane calibration was used multiplane1 ; multiplane2 . This method consisted on taking images of a target in different planes of depth, i.e. moving the target in the coordinate. The target consisted on a flat acrylic plate with an array of visible holes, evenly spaced every 10 mm. The positions of the holes in the target in reference to coordinate system are known, therefore by moving the target to different , a swept or scan through the volume was made and the correlation between pixel location in each image with real space location was made by defining the epipolar geometry of the space maas1996contributions .
In the PTV analysis, it is common to use laser illumination and therefore images with dark background and light particles are produced. In contrast, images with light background and dark particles were created with this method, which allowed to obtain defined contours of the particles. To analize the images in the OpenPTV software, there are two possible paths. One is to modify the code to find light particles in dark background, which is possible with open source software, and the second option is to invert the gray scale of the images as to obtain light particles in dark background, then use this images directly in the code. While the first option could be more efficient, it also takes more time to adapt accurately to the code, and its implementation will require a careful development. Therefore, for this work we use the direct inversion of the images as to fit the requirements of the original code. So, the images that are analyzed by the PTV code appear to have light particles in a dark background.
2.2 Determination of system parameters to estimate sizes in the analysis volume
From the PTV algorithm, and , the axis lengths in pixels of the different particles in and , for each camera in the system, , along with the particles’ positions can be obtained. With the proposed methodology we attempt to find a transformation:
| (1) |
where are the parameters determined by the optical system, in particular each camera in the setup , is the position of the particle and D is the diameter of the particle in the expected units (millimeter, meter or other). If the shape of the particles is assumed to be elliptical, we use the unique length measurement to identify particles sizes denominated as equivalent diameter, defined as , where and are the axis lengths of the particle in and approximated as an ellipse in each image. Then, an average of is obtained for all the images. This averaged will be interpreted as the size of the particle.
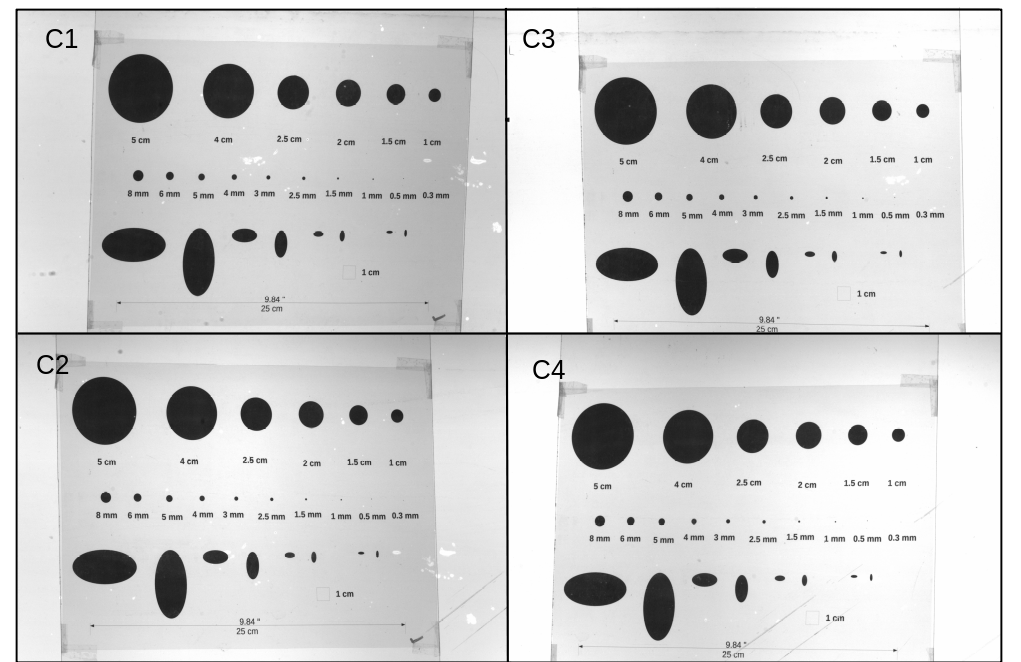
To obtain such transformation , the parameters for the cameras must be found by considering the effects of the optical system. Once the transformation is defined, the estimation of the particle sizes can be made and compared to the real values, in such way the accuracy of the method can be estimated. A validation test was done to estimate the necessary parameters for the sizing methodology and understand the limits of such technique. The test consisted on using a flat target with circles and ellipses of different diameters from 0.3 mm to 50 mm (Fig. 2), the target was positioned in different depths, or values, and OpenPTV was used to detect the positions. Then an estimation of their sizes was made with the proposed procedure and compared to the known sizes. Finally the methodology is tested against a two different 3-dimensional arrays of particles with different sizes distributed over the volume of observation. In the following, the procedure to find some optical parameters will be described and the comparison of the results to the 3D particles will be shown.
2.3 Sources of error in the validation test
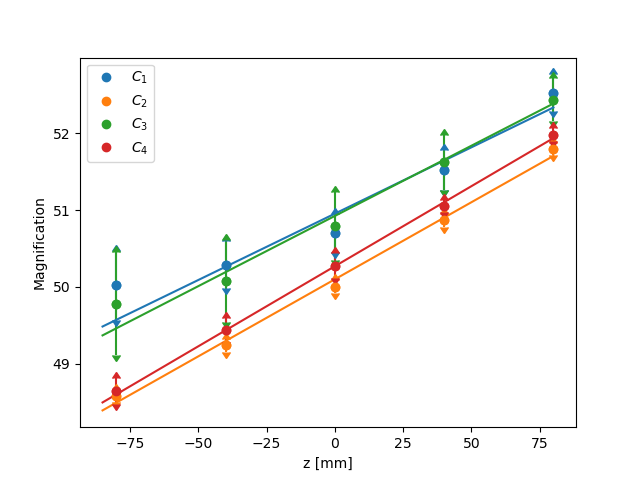
The pixel-to-world transformation in the 3-dimensional space can be affected directly by the focal depth of the lenses, i.e. the magnification of the image depending on the distant to the lens. By using the calibration flat target with equidistant holes, the effects of the depth on the scale of the image can be estimated. The relation pixel size to real size depends on the position of the holes compared to the cameras, in particular the depth position or coordinate. The depth is approximated by the PTV algorithm and with the calibration, the magnification for each camera can be estimated as a function of :
| (2) |
Linear fits as equation 2 were fitted for in the different depths. The results are plotted in figure 3. Then, images of the test target, with circles and ellipses, were obtained to obtain the axis lengths for the different sizes. Without loss of generality, if we choose a particluar camera , the particle axis lengths in real units, and , can be found as:
| (3) |
where are the number of pixels in the axis, and respectively, of the particle. Therefore, using the definition of , the equivalent diameter of some particle can be described as:
| (4) |
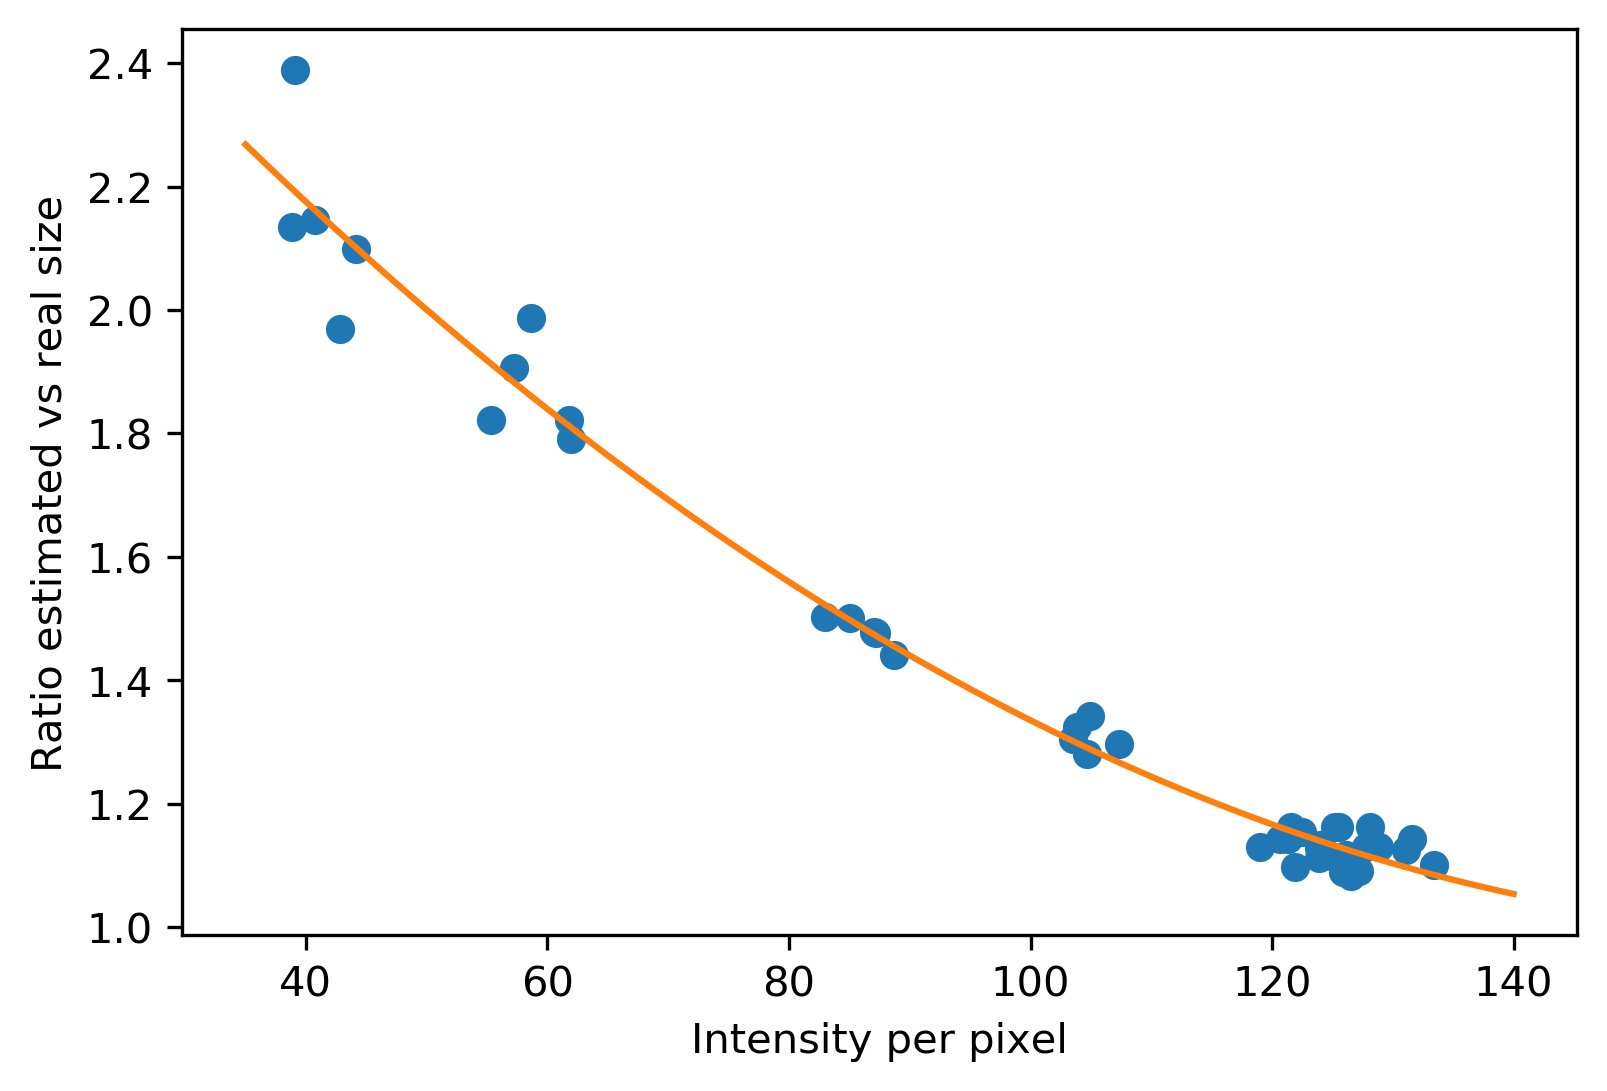
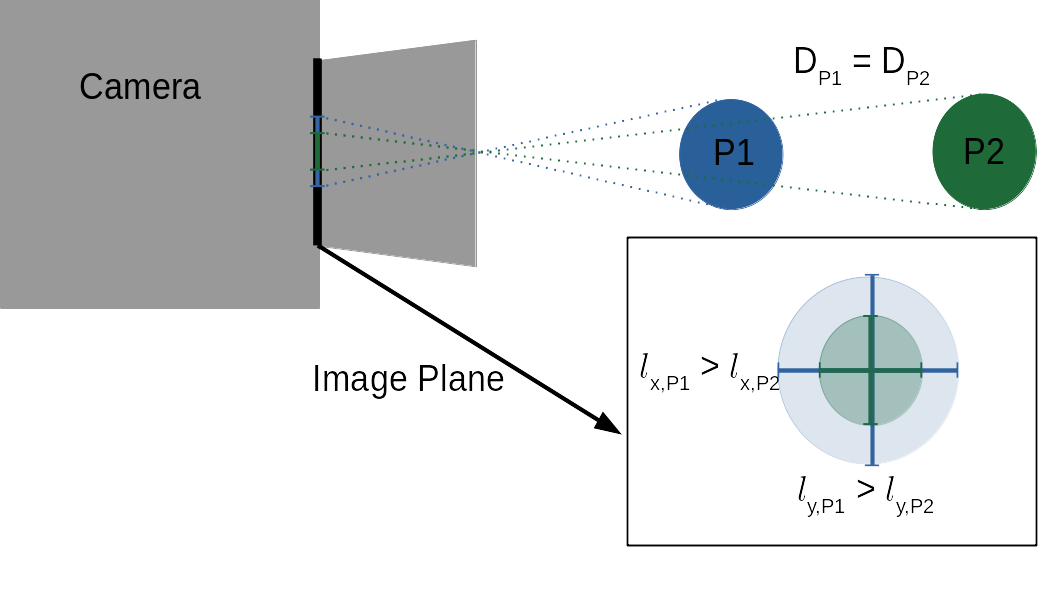
In image processing, the particles are most commonly defined by the detection of blobs or edges in the image together with a threshold in the gray level or intensity. The particles can also be discriminated by pixel area and pixel length in the vertical and horizontal direction. These lengths and area are defined by the intensity or gray scale threshold, a value between 0 and 255 that has been fixed by the user during the image processing, which therefore has a direct impact in the approximated size of the particle. In addition, the further the particles are from the focal plane, the more blurry they get, this means that the detected diameter exceeds the expected value for a sharp-looking particle and a decrease of the mean intensity per pixel will also occur. A particle with diameter at a distance of the focal plane will have a detected diameter and mean intensity per pixel , the value will be smaller than the value of for a sharp particle close to the focal plane, and the value will be larger than the value obtained for a sharp-looking particle of the same size. The ratio of the length estimation between a sharp-looking particle and a blurred particle can be expressed as and when plotting this ratio against of the detected particles, as shown in figure 4, the correlation can be approximated by a second order polynomial:
| (5) |
Then, the equivalent diameter of each particle can be estimated as:
| (6) |
the transformation has been approximated, where the most relevant parameters have been the depth of the particle and its mean intensity per pixel. In figure 5 we show the result of using the proposed transformation which gives percentage errors: .
3 Validation on 3 dimensional particles
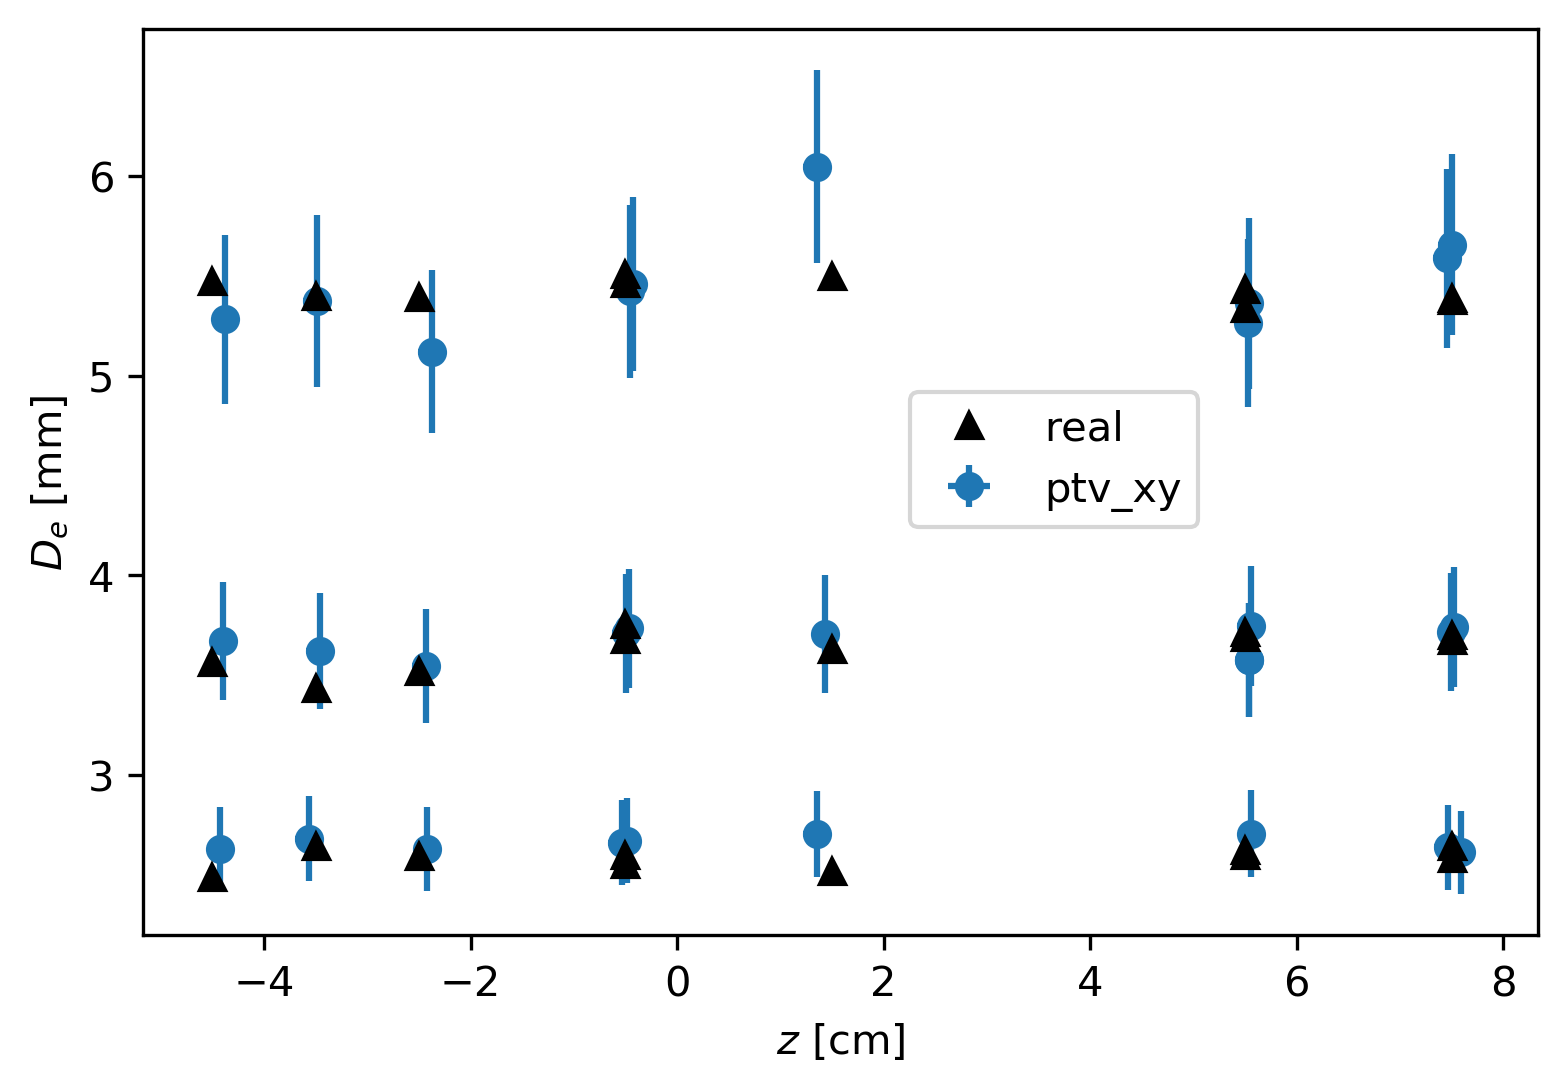
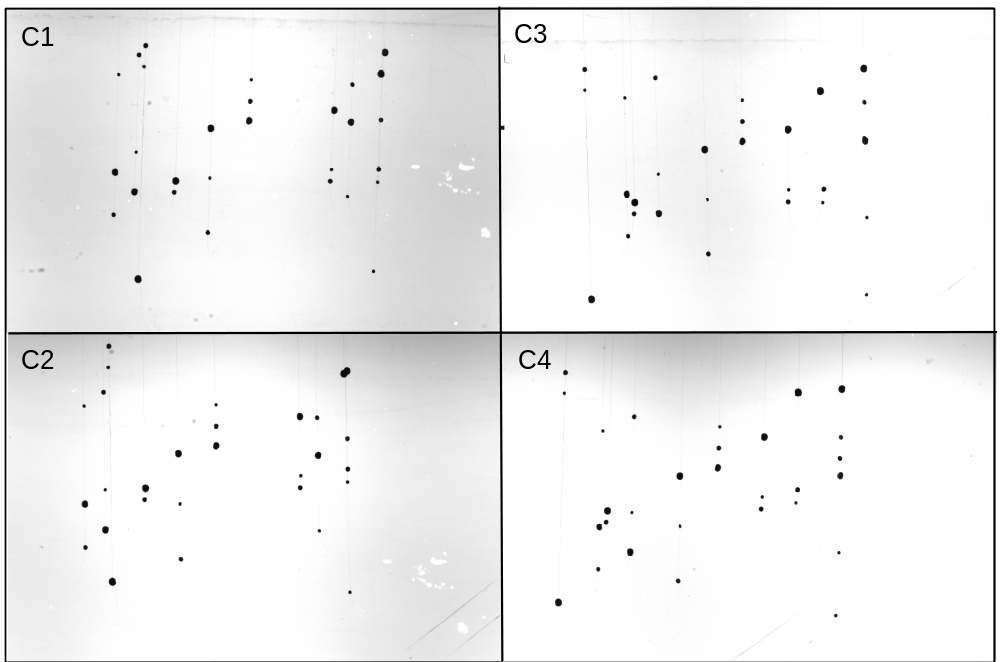
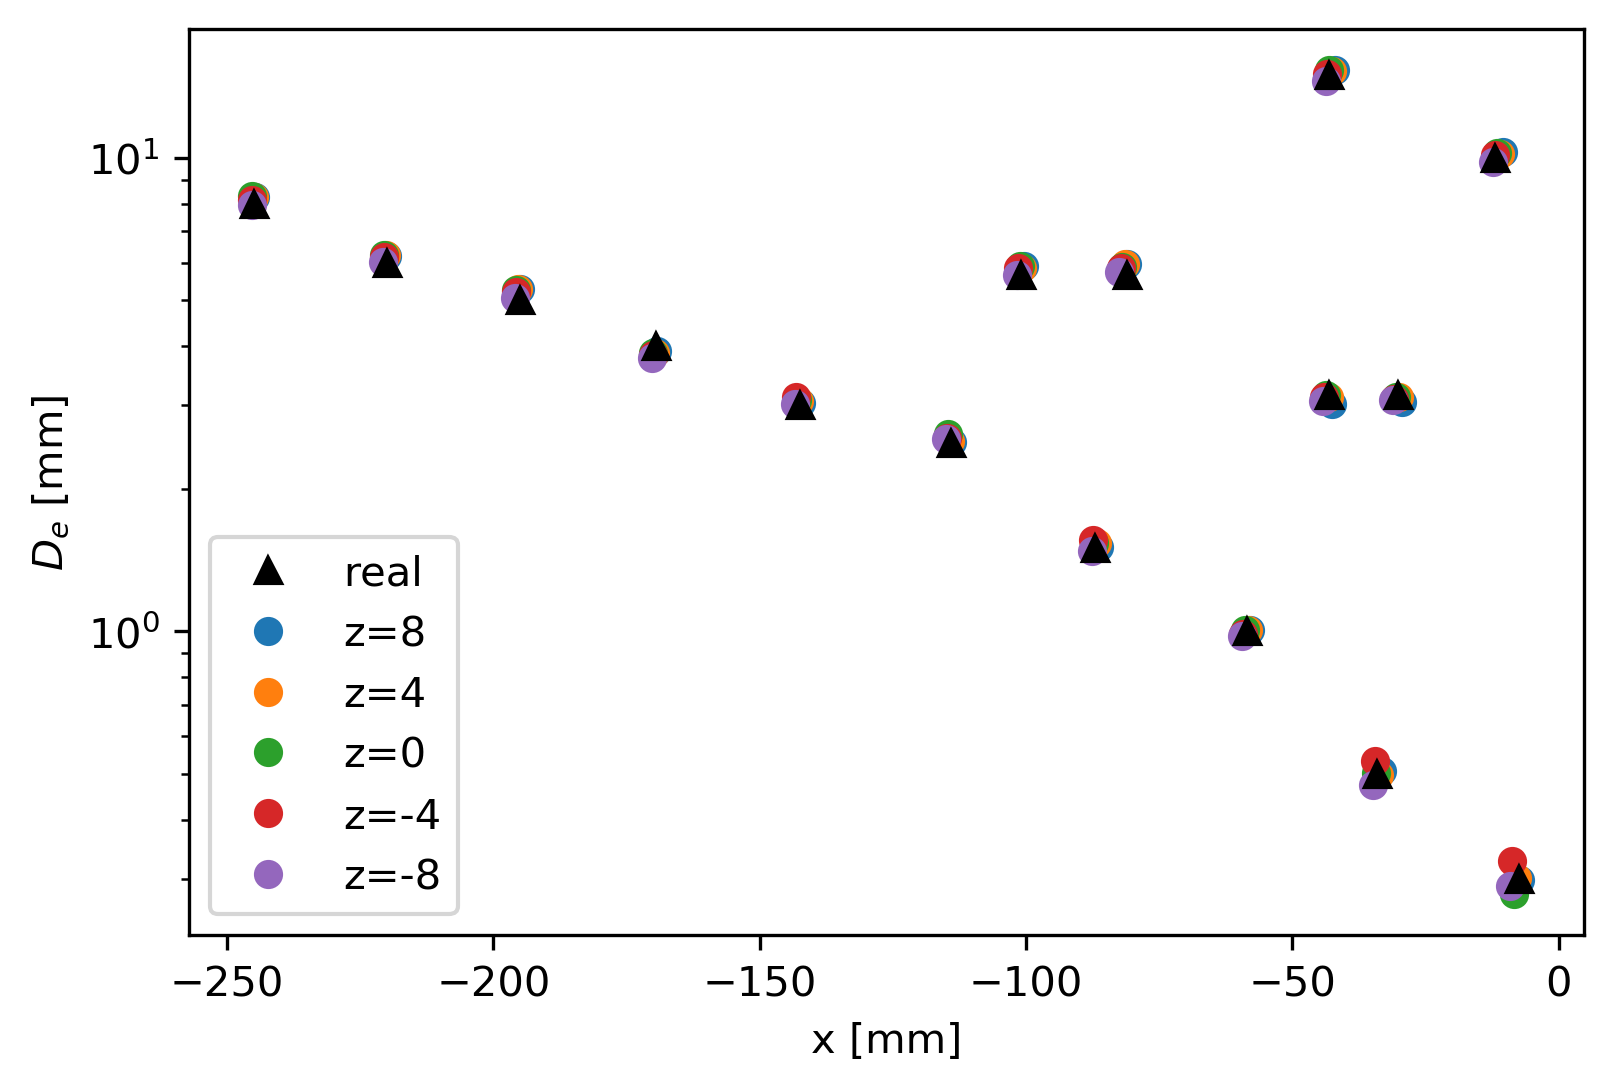
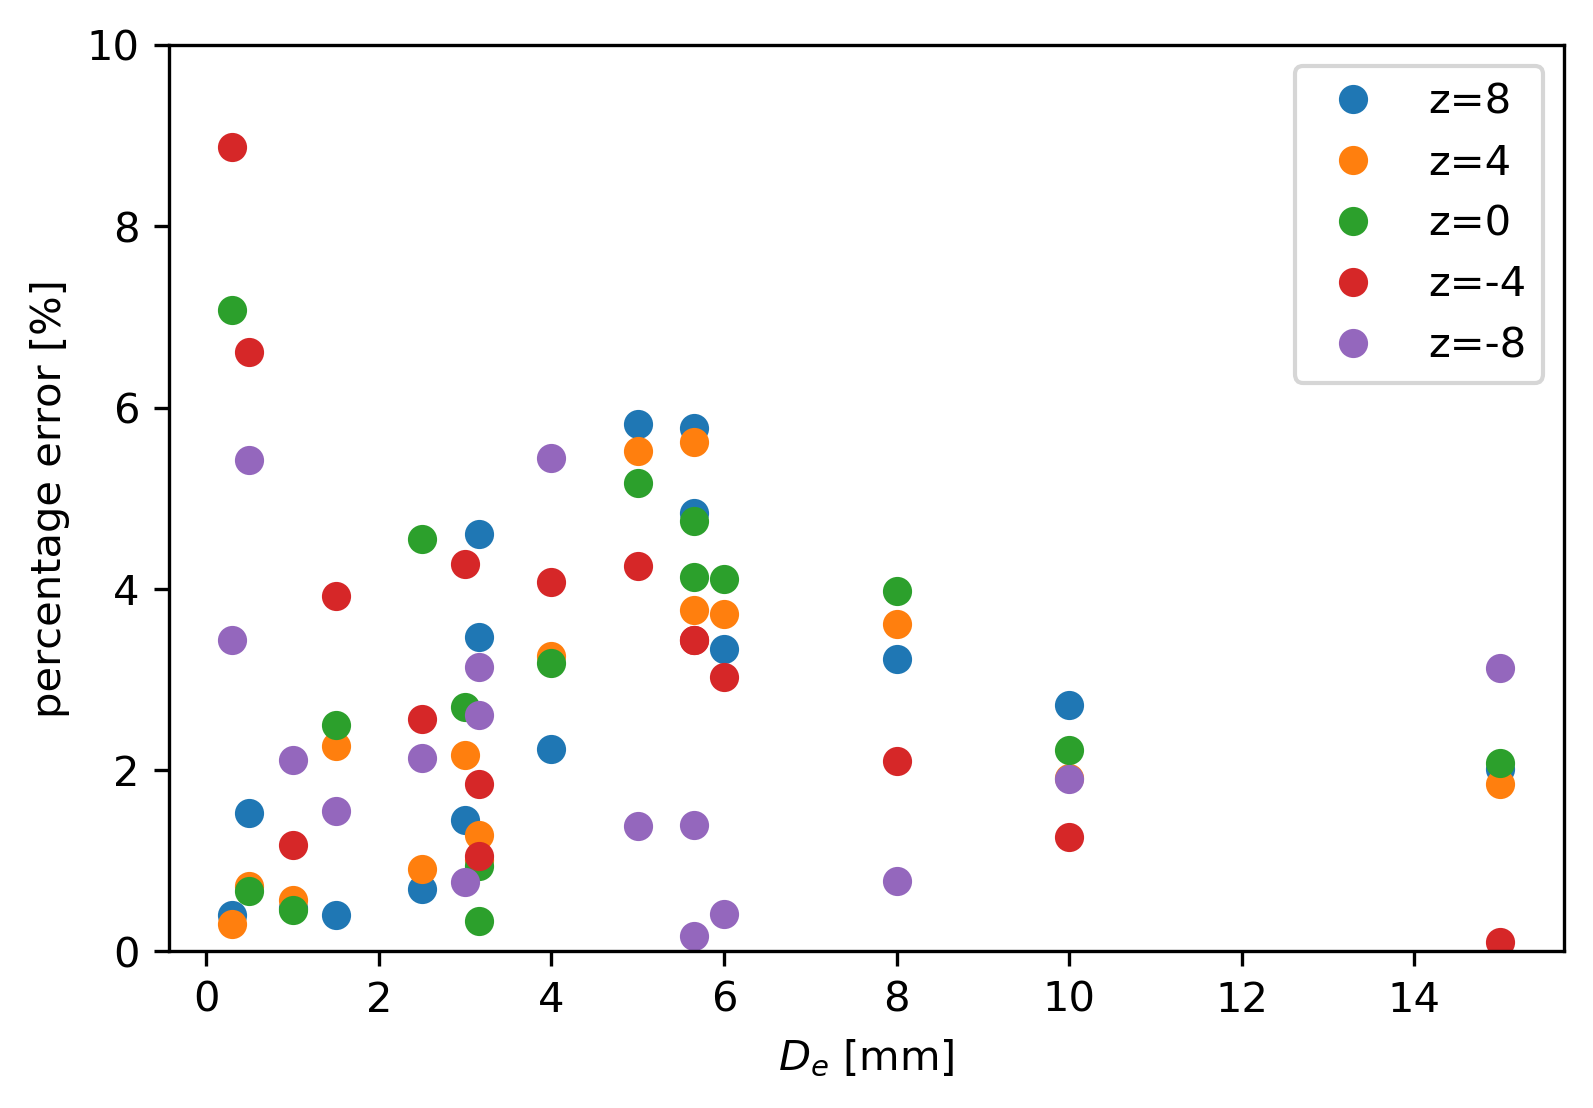
After obtaining the transformation using the flat target with circles and ellipses, we can test the new procedure on 3D particles. In this case, an array of solid particles was created with fishing lead weights of three different sizes. The dimensions of the particles were manually measured to make an equivalent diameter value for each of the particles. The three particle sizes are approximately 2.5, 3.5 and 5.5 mm. Images obtained by the camera array for this particle array can be seen in figure 2. The comparison between the real sizes and the estimated sizes is presented in figure 6, in the first plot we see the position of the particles in compared to the size. And in the second graph the percentage error of the size estimation is presented. The maximum error value is again 10%, which shows that this first approximation to the sizing problem is reliable within certain limitations.
3.1 Other sources of error
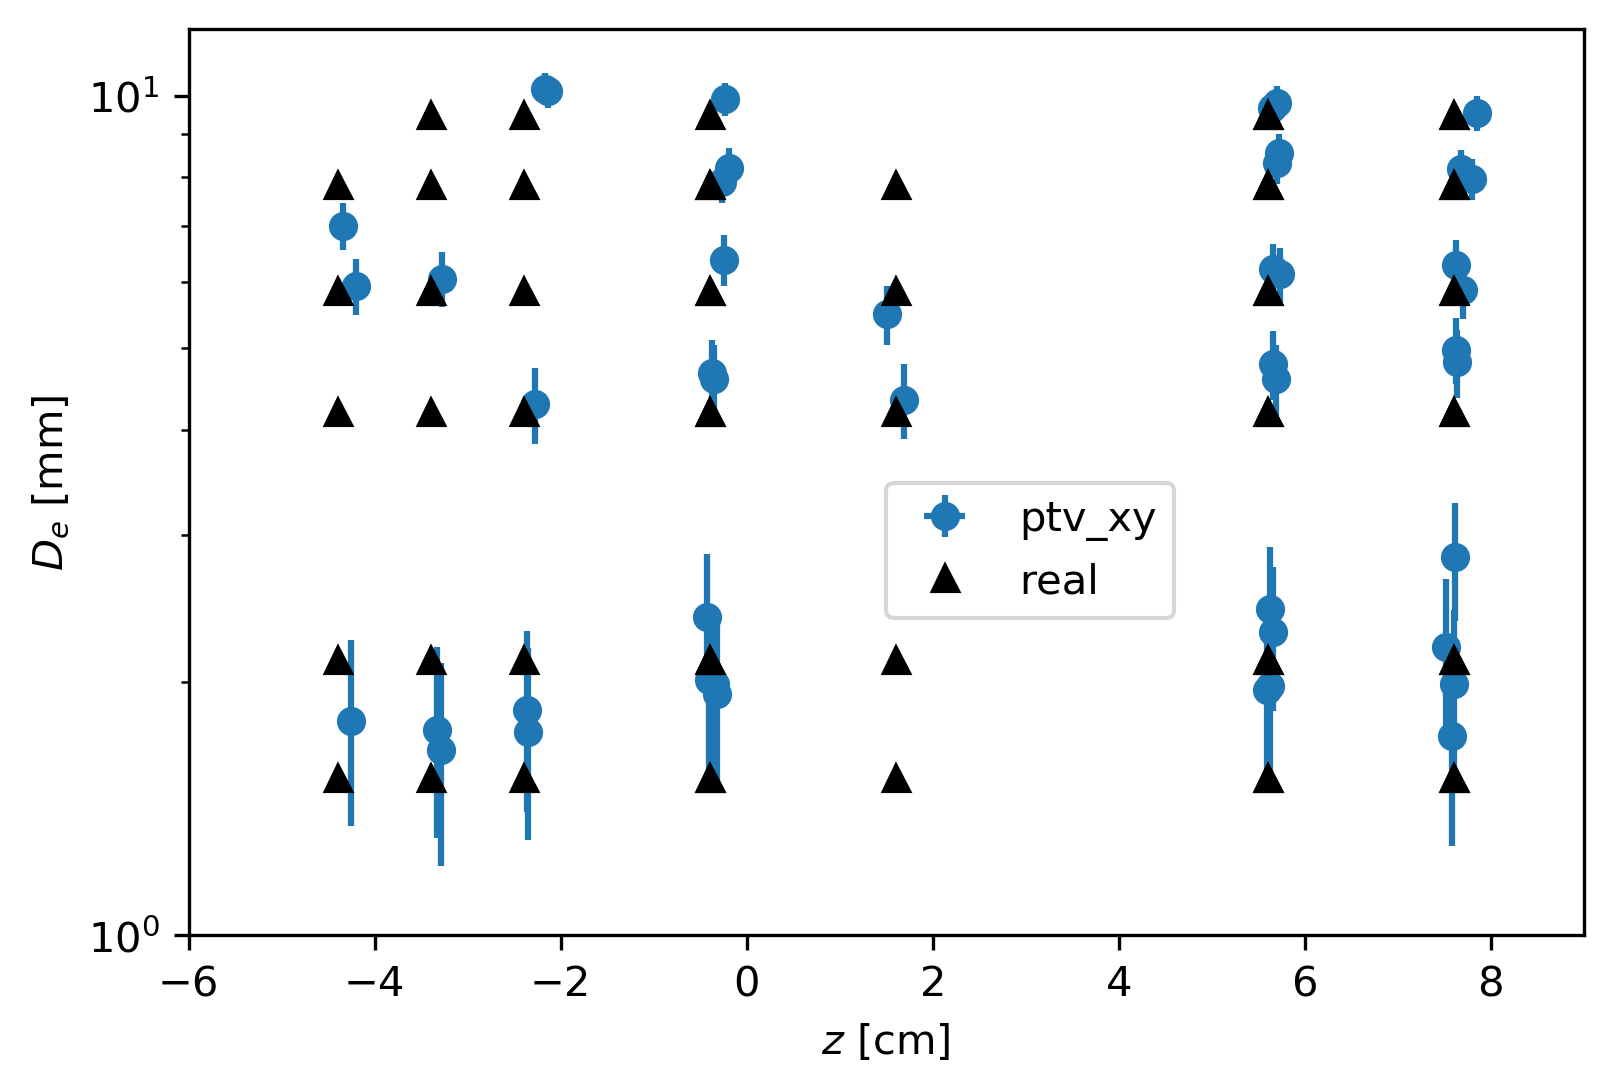
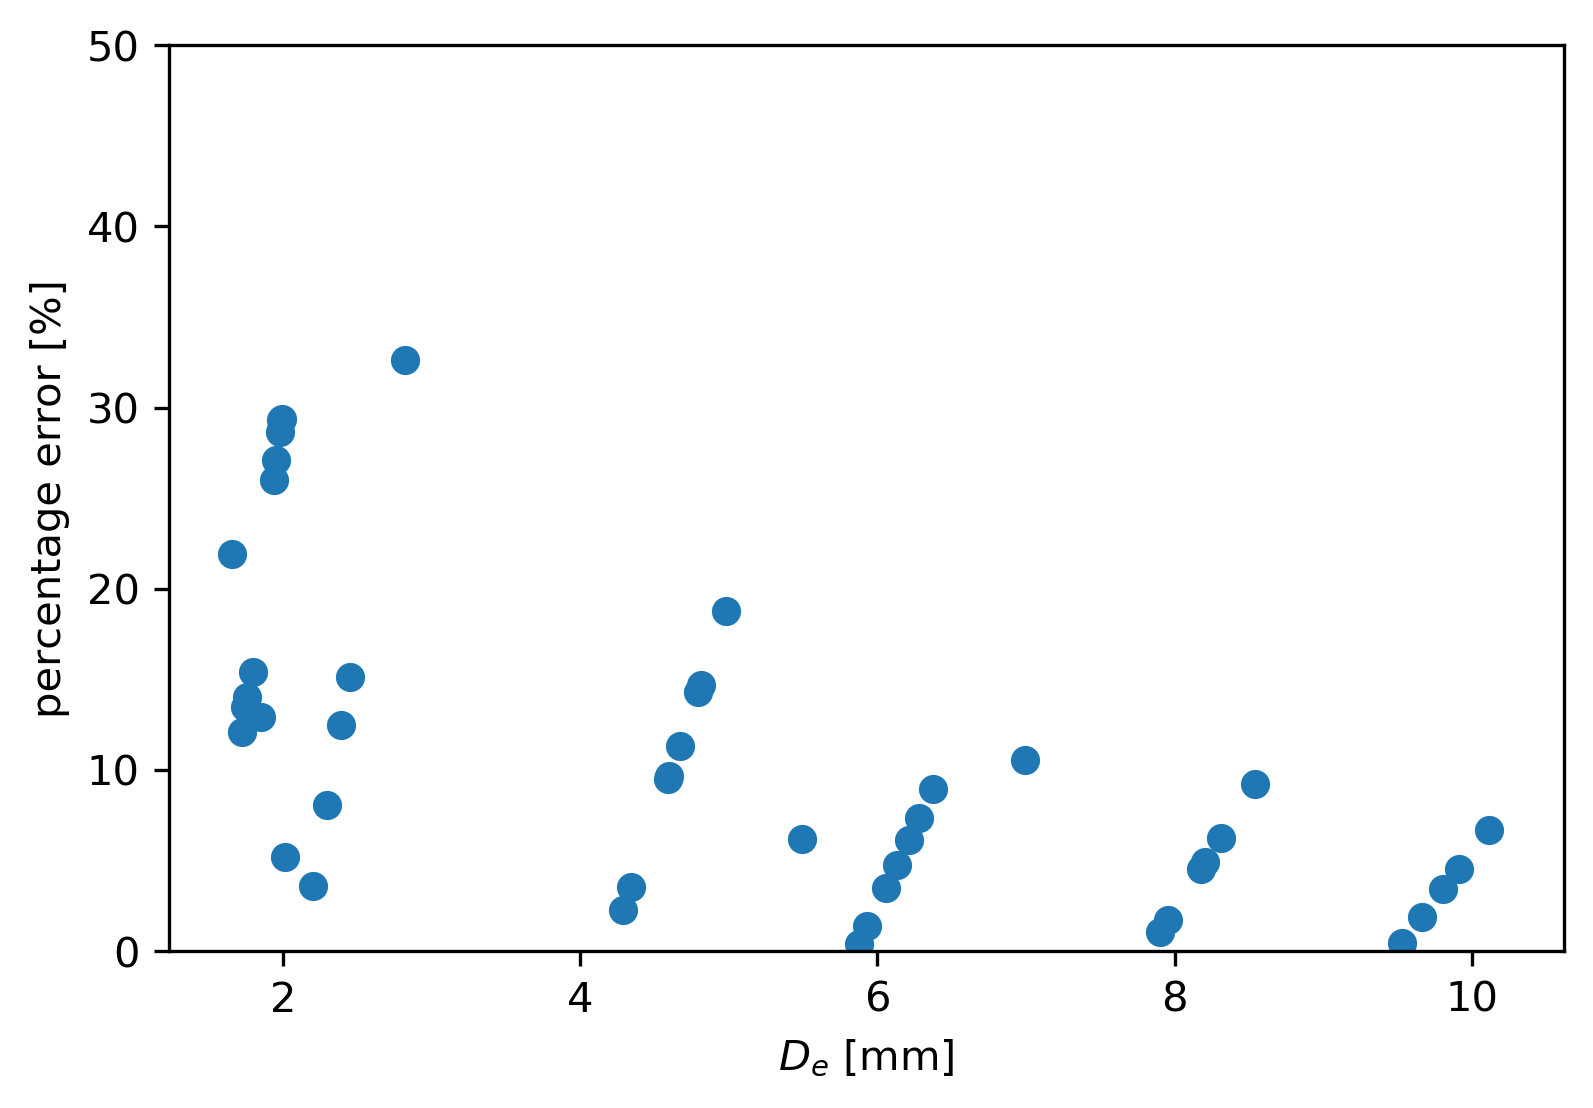
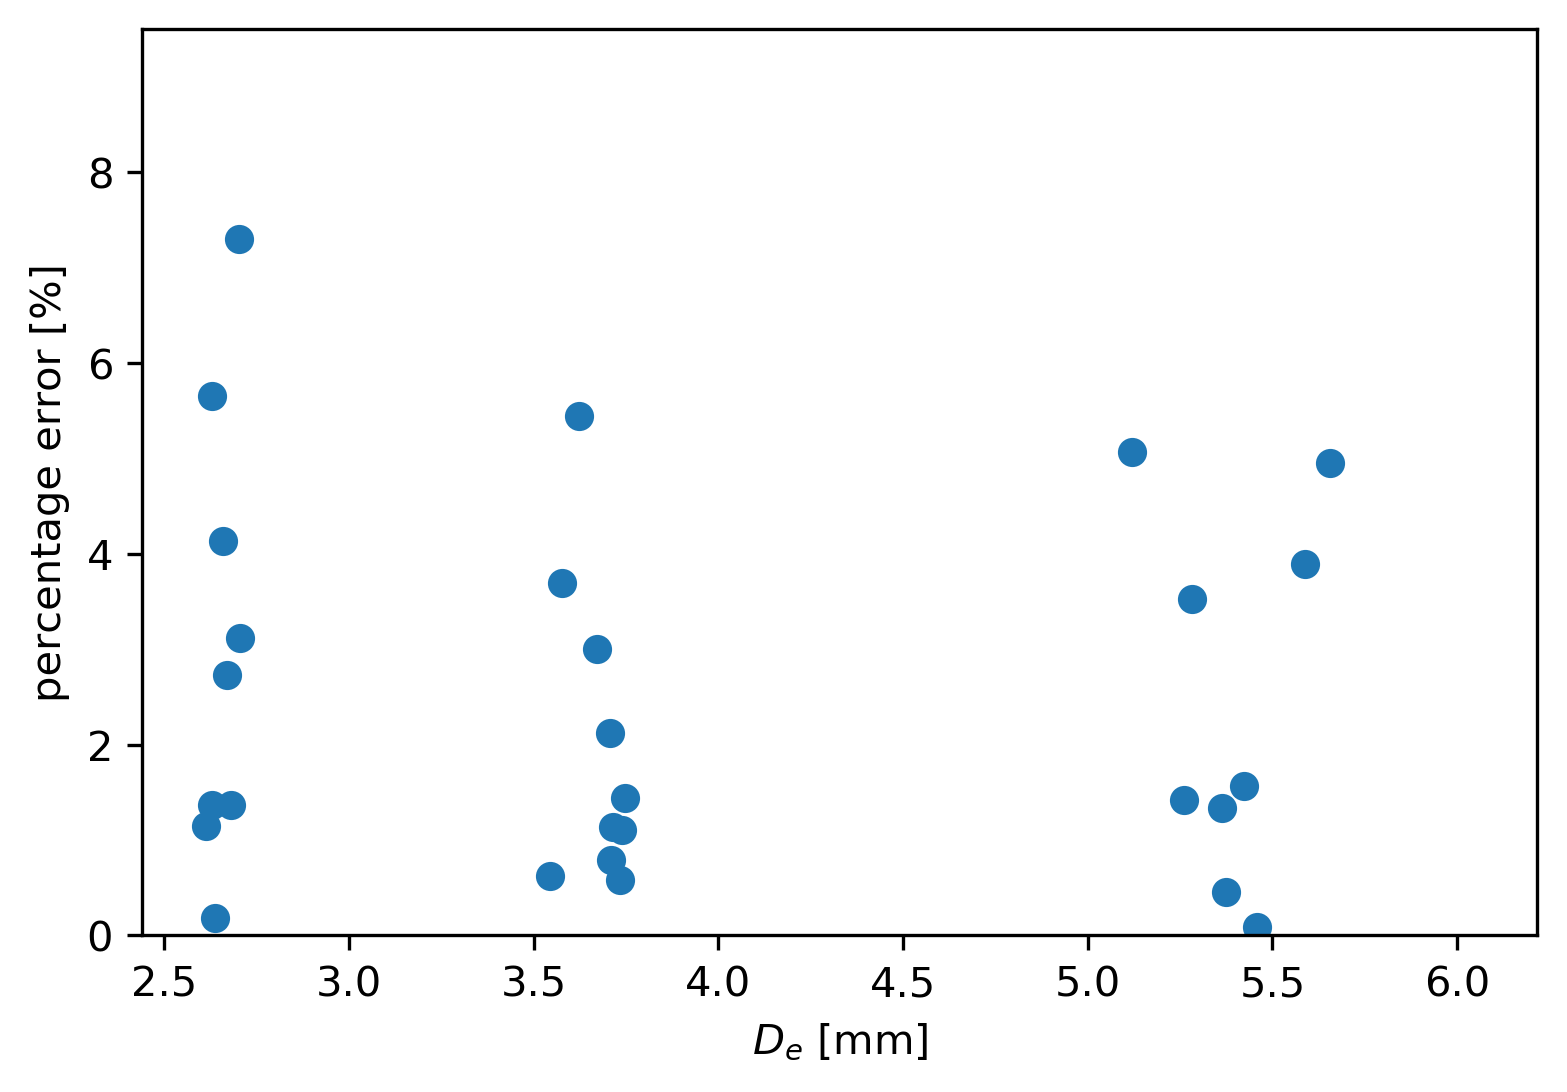
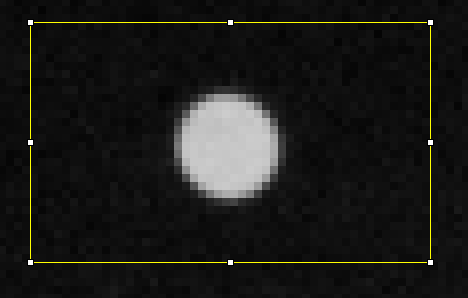
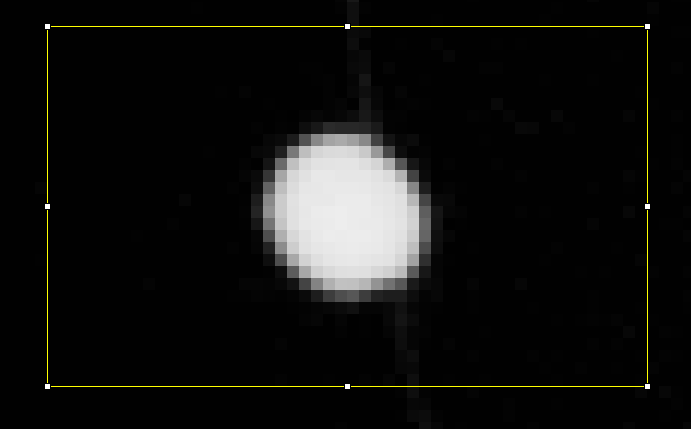
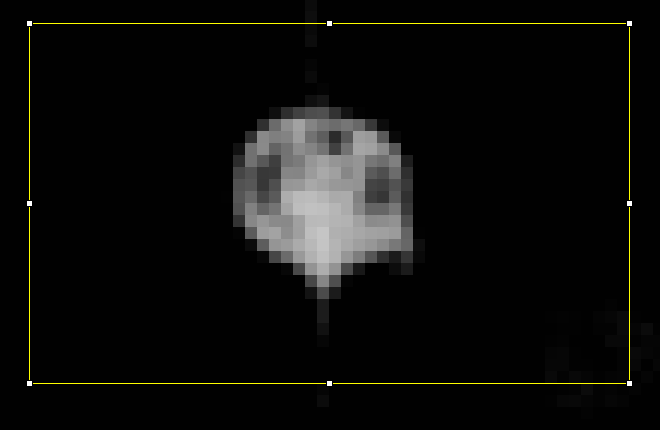
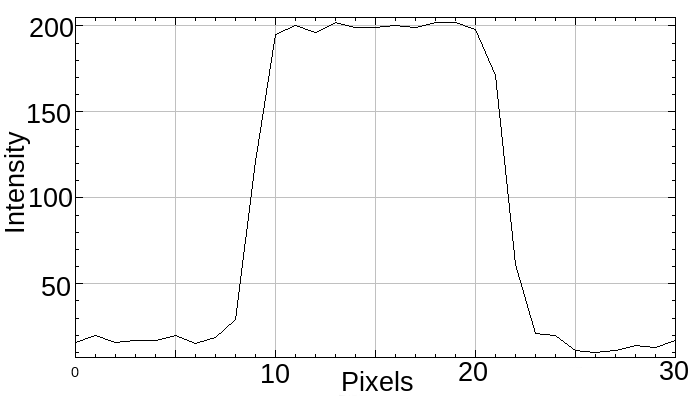
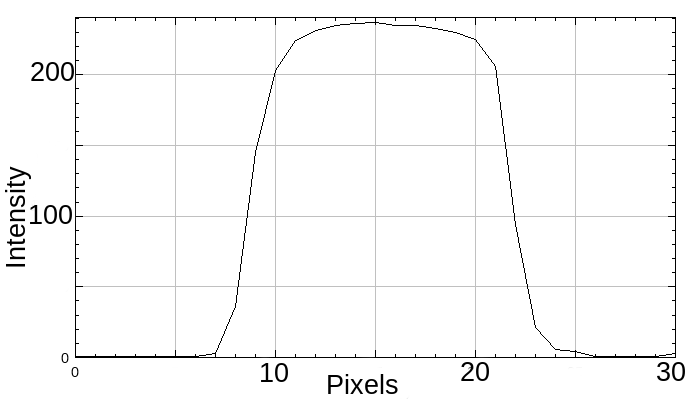
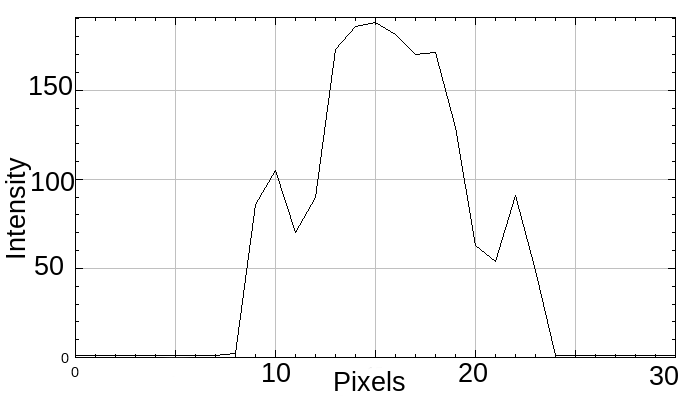
Another 3-dimensional array of particles was made with plastic beads, some of them transparent and some others opaque. In total, 57 particles of 6 different sizes were distributed in the volume. The same procedure was applied to this array, and the results are presented in figure 7. The graph shows that 85% of the particles were tracked accurately by PTV and the maximum error in the size estimation is 35 %. The increase in the error is mainly on the particles with smallest sizes, which are the particles that are transparent. This shows that when the particles are not completely opaque to the light, the correction with the gray level will affect the estimation. Figure 8 shows a comparison between the two 3-D arrays and the circle array for a particle (or circle) with diameter close to 2.5 mm. In all cases, the particle has a similar length in pixels, but in the second 3-d array, where the particle is translucent, the intensity is lower, and therefore the gray value per pixel is lower. For a low the transformation assumes a larger correction shown in figure 4, which in this case will lead to an underestimation of the size.
When obtaining the transformation, the assumption that all the visible particles will be opaque to the light (as the circles) was implicit. In this case, introducing transparent or translucent particles will affect the accuracy of the method. Nonetheless, in the same way that opaque circles were used to obtain the transformation, an array of translucent circles or other features could be used while creating the transformation. Moreover, if the optical characteristics of the particles to analyze are known, the transformation and its correspondent array can be proposed in a way that it will account for these parameters. The main source of error will be the parameters that has not been predicted during the transformation’s acquisition.
4 Concluding remarks
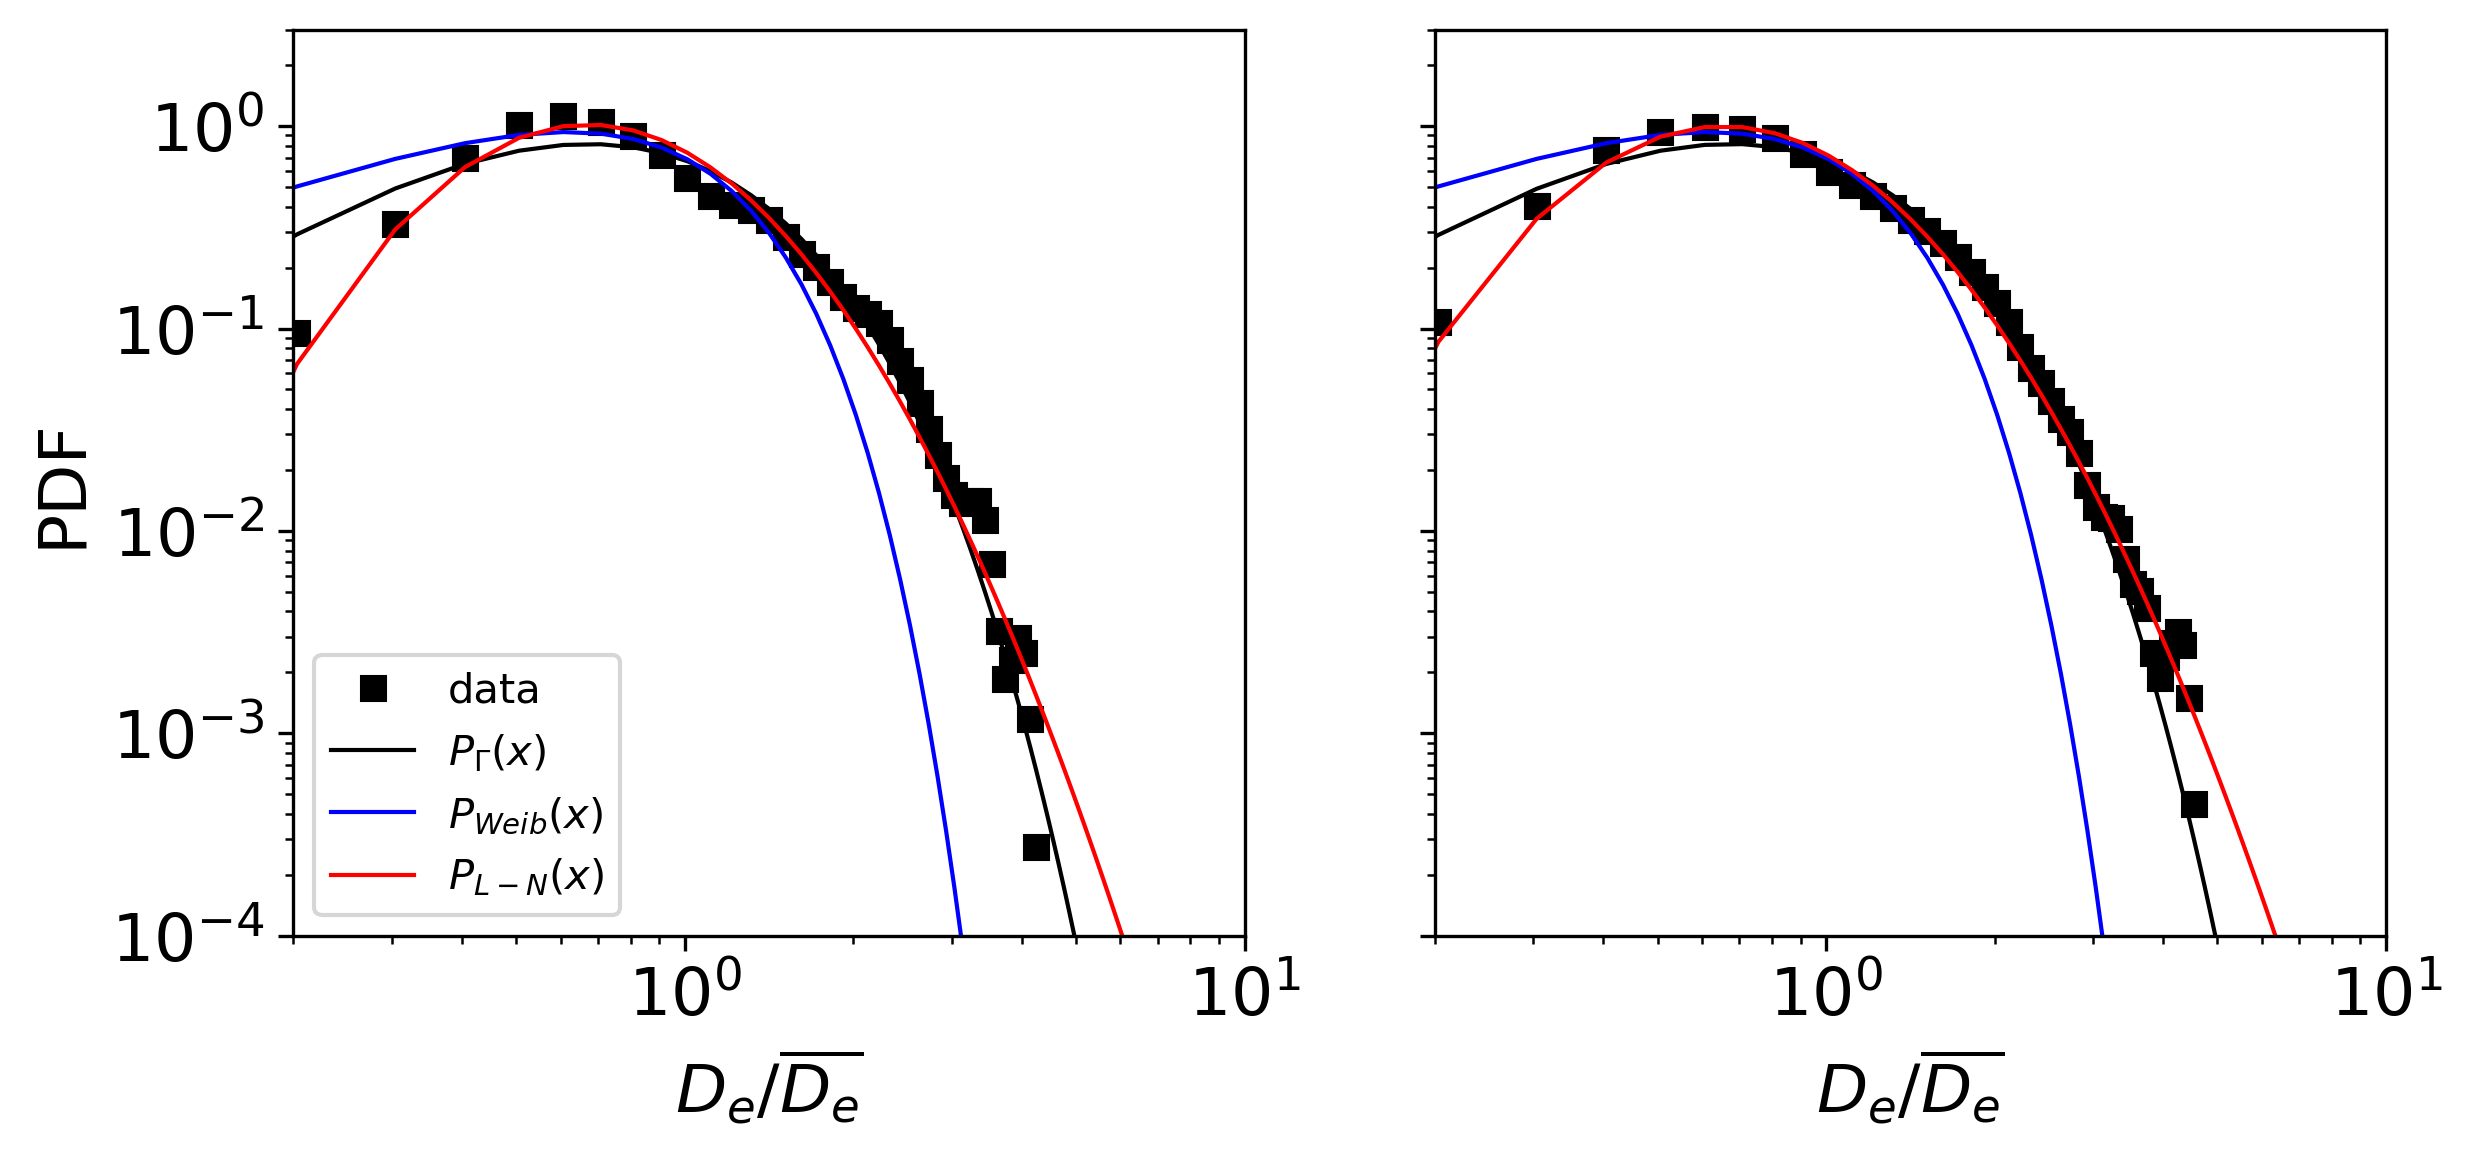
In this paper, we have presented a proof of concept to obtained particle size estimation assisted by a PTV algorithm that is open source. This has been a first approximation to the procedure which has proved to give large improvements by reducing the error of the estimation below 10%. In the future, more sources of uncertainties can be identified and the estimation can be further improved. For example, the warping effects produced by the lens and the sensor can also be taken in to account to obtain a matrix of pixel-to-world scale for the whole field of view. With this methodology it is possible to perform meaningful analysis on 3D particle systems. This methodology has been applied in studies of droplet formation by breaking waves de2021experimental . The results showed that the droplet size distribution estimated with this method was similar to those found by other studies of droplet size distribution as shown in figure 9.
References
- (1) Bachalo, W., Houser, M.: Phase/doppler spray analyzer for simultaneous measurements of drop size and velocity distributions. Optical Engineering 23(5), 235583 (1984)
- (2) Black, D.L., McQuay, M.Q., Bonin, M.P.: Laser-based techniques for particle-size measurement: a review of sizing methods and their industrial applications. Progress in energy and combustion science 22(3), 267–306 (1996)
- (3) Bröder, D., Sommerfeld, M.: Planar shadow image velocimetry for the analysis of the hydrodynamics in bubbly flows. Measurement Science and Technology 18(8), 2513 (2007)
- (4) del Castello, L.: Multi-plane calibration (2007). URL https://openptv-python.readthedocs.io/en/latest/add_doc.html
- (5) Consortium, O., et al.: Openptv (2014)
- (6) Damaschke, N., Nobach, H., Tropea, C.: Optical limits of particle concentration for multi-dimensional particle sizing techniques in fluid mechanics. Experiments in fluids 32(2), 143–152 (2002)
- (7) Dracos, T.: Particle tracking in three-dimensional space. In: Three-dimensional velocity and vorticity measuring and image analysis techniques, pp. 209–227. Springer (1996)
- (8) Goumnerov, H.: Openptv. installation and user manual. (2007). URL https://openptv-python.readthedocs.io/en/latest/add_doc.html
- (9) Hagsäter, S., Westergaard, C., Bruus, H., Kutter, J.: Investigations on led illumination for micro-piv including a novel front-lit configuration. Experiments in fluids 44(2), 211–219 (2008)
- (10) Katz, J., Sheng, J.: Applications of holography in fluid mechanics and particle dynamics. Annual Review of Fluid Mechanics 42, 531–555 (2010)
- (11) Koothur, V.: Tracking and sizing of particles in the mie scattering regime using a laser scanning technique (2021)
- (12) Kozul, M., Koothur, V., Worth, N.A., Dawson, J.R.: A scanning particle tracking velocimetry technique for high-reynolds number turbulent flows. Experiments in Fluids 60(8), 1–14 (2019)
- (13) Lüthi, B., Tsinober, A., Kinzelbach, W.: Lagrangian measurement of vorticity dynamics in turbulent flow. Journal of Fluid mechanics 528, 87–118 (2005)
- (14) Maas, H., Gruen, A., Papantoniou, D.: Particle tracking velocimetry in three-dimensional flows. Experiments in fluids 15(2), 133–146 (1993)
- (15) Maas, H.G.: Contributions of digital photogrammetry to 3-d ptv. In: Three-dimensional velocity and vorticity measuring and image analysis techniques, pp. 191–207. Springer (1996)
- (16) Malik, N., Dracos, T., Papantoniou, D.: Particle tracking velocimetry in three-dimensional flows. Experiments in fluids 15(4), 279–294 (1993)
- (17) Raffel, M., Willert, C.E., Kompenhans, J., et al.: Particle image velocimetry: a practical guide, vol. 2. Springer (1998)
- (18) Roisman, I.V., Horvat, K., Tropea, C.: Spray impact: rim transverse instability initiating fingering and splash, and description of a secondary spray. Physics of Fluids 18(10), 102104 (2006)
- (19) de la Torre, R., Vollestad, P., Jensen, A.: Experimental investigation of droplet generation by post-breaking plunger waves. arXiv preprint arXiv:2112.01396 (2021)
- (20) Tropea, C.: Optical particle characterization in flows. Annual Review of Fluid Mechanics 43, 399–426 (2011)
- (21) Villermaux, E., Marmottant, P., Duplat, J.: Ligament-mediated spray formation. Physical review letters 92(7), 074501 (2004)
- (22) Watanabe, Y., Ingram, D.: Size distributions of sprays produced by violent wave impacts on vertical sea walls. Proceedings of the Royal Society A: Mathematical, Physical and Engineering Sciences 472(2194), 20160423 (2016)