plaintop \restylefloattable
Ab Initio Study of K3Cu3P2 Material for Photovoltaic Applications
Abstract
Search for efficient materials for application in the fields of optoelectronics and photovoltaics are active areas of research across the world. The potential of compounds such as K3Cu3P2 is not yet fully realized. Therefore, we perform the ab initio studies based on density functional theory to investigate the structural, electronic, elastic, and optical properties of K3Cu3P2. Ground state properties were computed in three different scenarios, i.e: with spin-orbit coupling (SOC), without spin-orbit coupling, and with Hubbard U parameter. Direct electronic bandgaps of 1.338 eV, 1.323 eV and 1.673 eV were obtained for K3Cu3P2 without SOC, K3Cu3P2 with SOC and K3Cu3P2 with Hubbard U respectively. In all the cases, Cu-d orbitals were dominant at the top of the valence band. The effect of SOC on the K3Cu3P2 computed lattice constant and bandgap was insignificant. The mechanical stability test indicated that K3Cu3P2 is mechanically stable at zero pressure. The optical band gap was found to increase by 0.635 eV when Hubbard U was taken into consideration. Generally, the inclusion of the Hubbard U parameter in density functional theory improves the predictions of the bandgap and optical properties.
Keywords: DFT + U; Bandgap; Optical properties; Elastic properties; Spin orbit coupling
I Introduction
Interest in ternary semiconductor compounds is on the rise due to their wide range of photovoltaic applications L.Shi et al. (2021). Currently, the semiconductor market is dominated by traditional inorganic materials comprising of Silicon, Germanium, type III-IV compounds and Gallium Arsenide among others M.Usman et al. (2017). These traditional semiconductors have been studied widely and great milestones in terms of performance properties when incorporated to photovoltaic devices have been achieved D.Yang and D.Ma (2019). Due to the rise in global energy demand, the evolution of new semiconductor absorber materials for energy devices is increasing. New class of materials including chalcogenides, oxides, pnictides, and mixed-anion compounds have emerged proving their outstanding performance as compared to their traditional counterparts A.Zakutayev et al. (2021).
Among these materials, pnictides have been less studied with the least power conversion efficiency of 3.4 reported for ZnSnP2 S.Akari et al. (2018). A study was carried out on ZnXPn2 (X = Si, Sn Ge and Pn = P, As) materials C.Sreeparvathy et al. (2016). This study showed that pnictides can be applied as thermoelectric materials. An investigation of thermoelectric properties of ABX2 compounds using high throughput screening method has been carried out previously R.Li et al. (2019). High values of figure of merit predicted from this study were useful for thermoelectric applications. Another study on thermodynamic properties of indium pnictides was carried out using first principles S.D.Dabhi and P.K.Jha (2016). The thermodynamic properties including specific heat, vibrational free energy, internal energy as well as entropy revealed pnictides as good materials for optoelectronics. Recently, first principles study on properties of K3Cu3P2 and K3Ni3P2 pnictides was carried out M.Irfan et al. (2021). The calculated properties from this study revealed the potentiality of these materials for thermoelectric as well as optoelectronic applications. Despite these findings, not much is known about the effect of using different DFT methods on pnictides properties. In this study, we carried out structural, electronic, elastic, and optical properties calculation of K3Cu3P2 using ultrasoft pseudopotentials within generalized gradient approximation (GGA) and GGA + U and compared the results. This work is arranged as follows; section 2 gives the description of the computational methods used, section 3 discusses the major findings and section 4 gives a summary of the computed structural, electronic, elastic, and optical properties.
II Computational Methods
In this study, all the calculations were performed using DFT P.Hohenberg and W.Kohn (1964); W.Kohn and L.J.Sham (1965) method as implemented in Quantum Espresso (QE) package Giannozzi et al. (2009). Perdew–Burke–Ernzerhof (PBE) functionals were used in this study J.P.Perdew et al. (1996). The Hubbard U model was employed to approximate the exchange correlation potential in Kohn-Sham equations S.Dudarev and G.Botton (1998). The DFT+U calculations were performed on highly correlated copper element whose Hubbard U parameter was obtained from the literature N.Rybin et al. (2021). K3Cu3P2 has a trigonal crystal structure with lattice parameters a = b = c = 14.0403 a.u; = = = as obtained from materials project 27 (27). The QE input generator was used to generate the PWscf input file of the K3Cu3P2 crystal structure G.Prandini et al. (2018). The convergence of total energy with cutoff energy, lattice constants as well as k-point sampling was performed to obtain optimum values for further calculations. The variable cell relaxation was performed to optimize atomic positions as well as lattice constants. The optimized properties were used for calculation of ground state structural, electronic, elastic, and optical properties.
III Results and Discussion
III.1 Convergence Tests
The convergence tests were performed on K3Cu3P2 in order to obtain accurate values for optimal performance. The following plot shows the convergence of total energy with the cutoff energy and K-points.
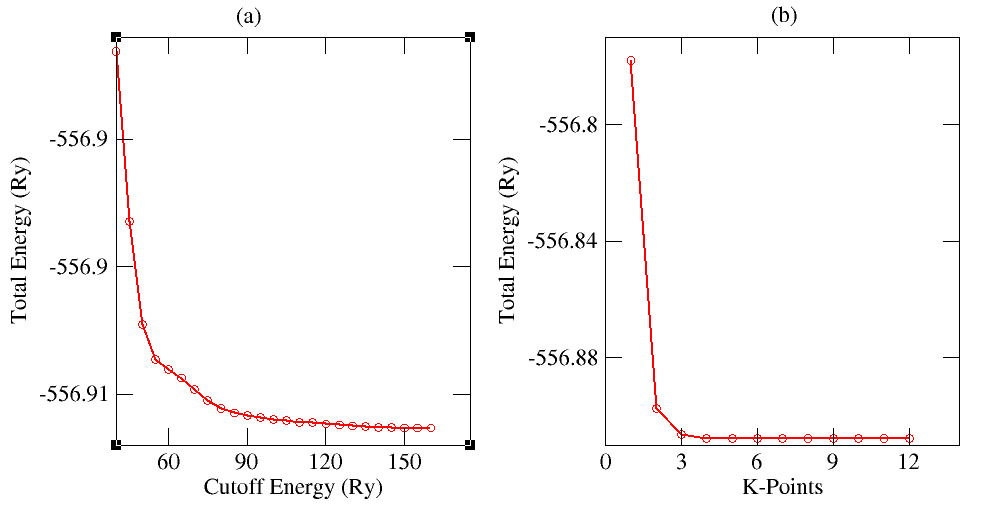
From Figure 1, the total energy converged with cutoff energy at 140 Ry and K-points at 7 x 7 x 7 mesh. The converged values of cutoff energy and k-point mesh were used in the convergence of lattice constants. The output is shown in Figure 2.
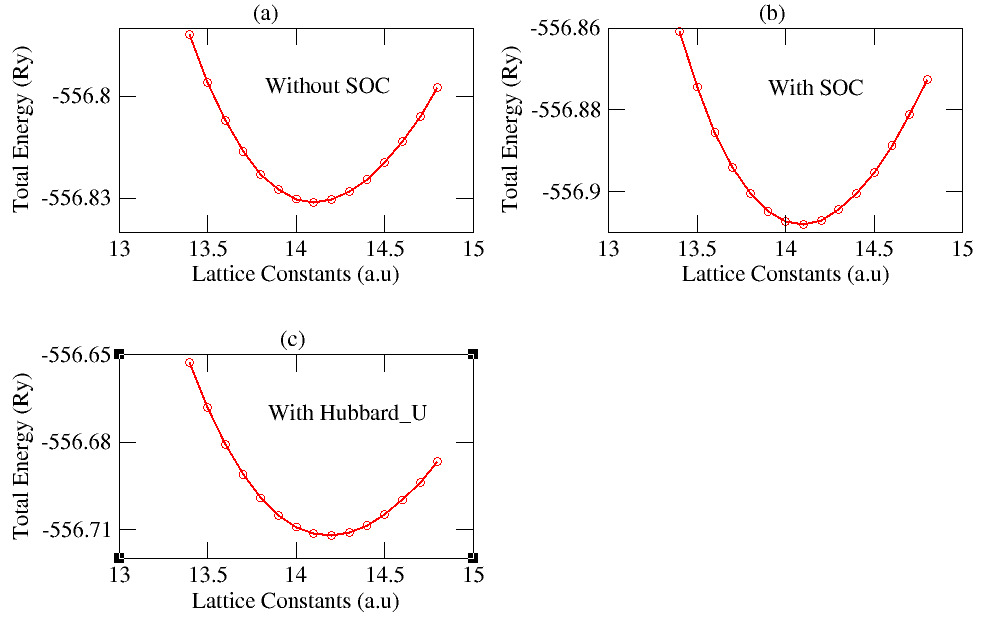
The total energy and the lattice constant values were fitted in Murnaghan equation of state F.Birch (1947) in order to determine the structural properties shown in table 1 below.
| K3Cu3P2 properties | Without SOC | With SOC | With Hubbard U |
|---|---|---|---|
| ao | 14.1043 | 14.0888 | 14.1862 |
| Bo | 19.0 | 19.2 | 17.8 |
| B | 0.4566 | 0.4500 | 0.4516 |
III.2 Structure Optimization
Variable cell relaxation (vc-relax) was performed on K3Cu3P2 without SOC, K3Cu3P2 with SOC and K3Cu3P2 with Hubbard U parameter. The relaxed structures are shown in Figure 3.
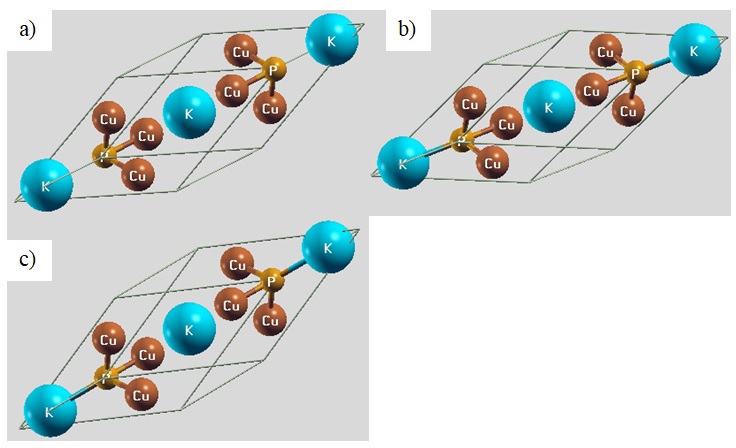
The variation of bond lengths and bond angles of the relaxed structures are shown in the table below.
| K3Cu3P2 Material Bonding | ||||
|---|---|---|---|---|
| Properties | Before vc-relax | (a) | (b) | (c) |
| Bond Lengths (a.u) | ||||
| K – P | 6.2059 | 6.2665 | 6.1987 | 6.2087 |
| P – Cu | 4.2627 | 4.2710 | 4.2675 | 4.2989 |
| Bond Angles (o) | ||||
| K – P – Cu | 132.8 | 132.4 | 132.9 | 132.1 |
| Cu – K – P | 18.9 | 19.0 | 18.9 | 19.3 |
| P – Cu - K | 28.1 | 28.5 | 28.1 | 28.5 |
The bond lengths after relaxation were elongated for K3Cu3P2 without SOC and K3Cu3P2 with Hubbard U parameter and reduced for K3Cu3P2 with SOC as compared to bond lengths before relaxation. Similarly, there was a decrease/increase in bond angles after structure relaxation. This shows that relaxation imposed structural changes on K3Cu3P2 crystal structure.
III.3 Electronic Properties
The optimized parameters obtained from convergence tests as well as variable cell relaxations were used to calculate the band structure and projected density of states (PDOS). The obtained band structure and projected density of states plots for K3Cu3P2 without SOC are shown below.
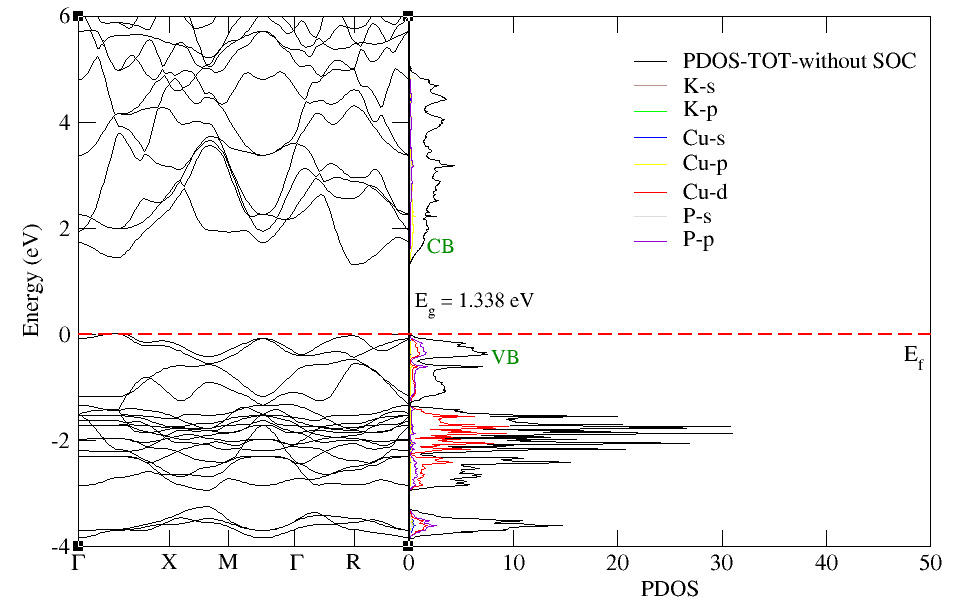
without SOC
From Figure 4, the material has a direct bandgap of 1.338 eV. The Cu-d orbitals were dominant followed by P-p orbitals with little contribution in the valence band. The contribution to electronic transitions in the conduction band was by Cu-p orbitals. Hybridization of the other orbitals showed insignificant contribution to both valence and conduction bands. In the presence of the SOC factor, the band structure and PDOS were calculated and plotted as shown in Figure 5.
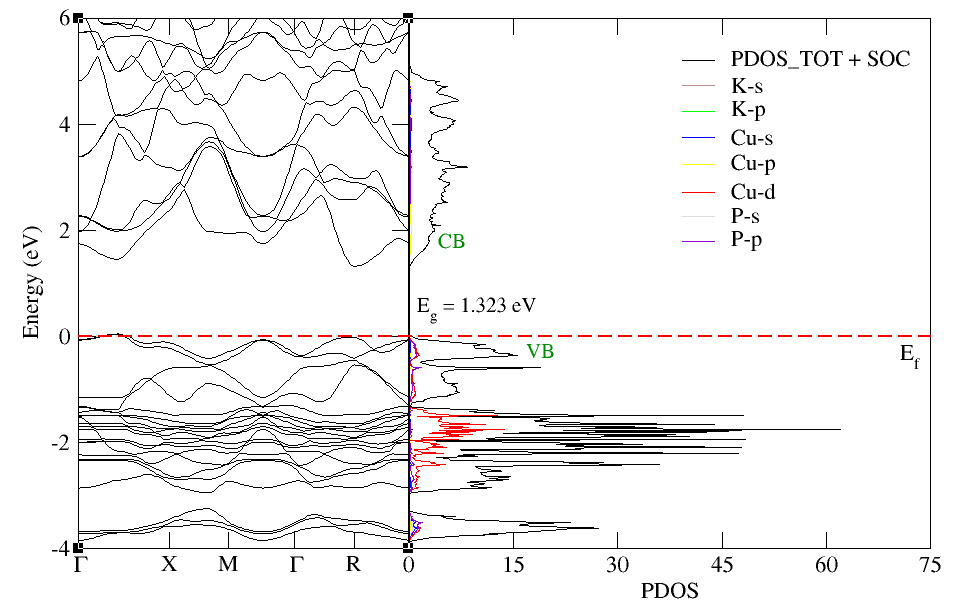
A direct bandgap of 1.323 eV was obtained for K3Cu3P2 with SOC. This value is slightly lower than the value obtained for K3Cu3P2 without SOC. The contribution to the total electron states was majorly by Cu-d and P-p orbitals in the valence band while Cu-p orbitals contributed to the transitions in the conduction band. Hybridization of other orbitals did not contribute significantly to both the valence and conduction bands. The band structure calculation was also done on the material in presence of Hubbard U parameter. The calculated band structure and PDOS are as shown below.
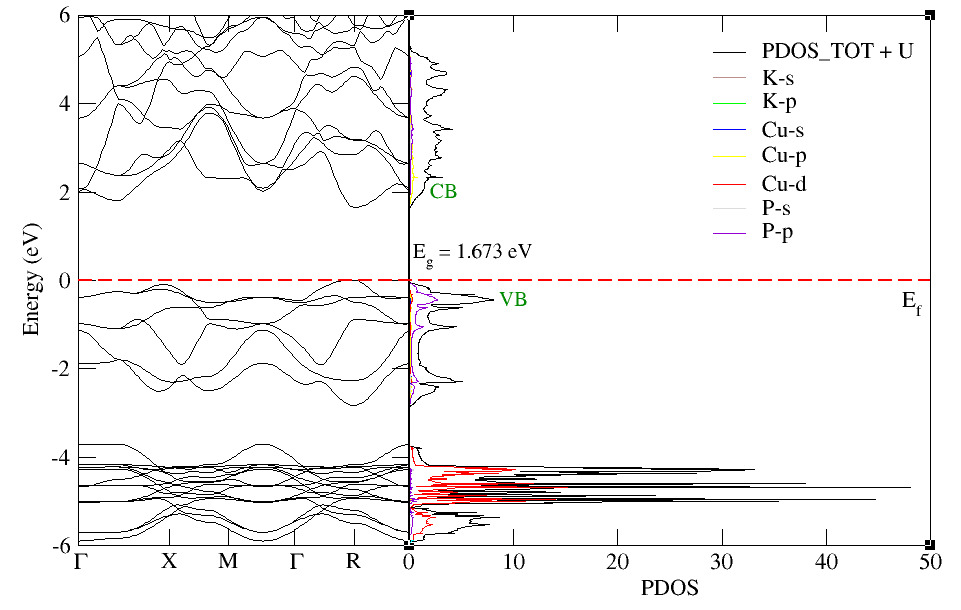
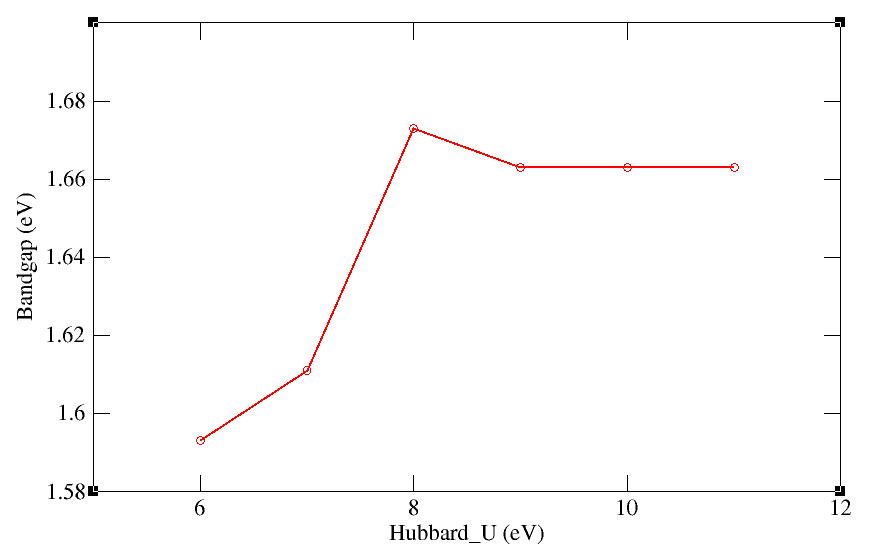
In presence of the Hubbard U, a direct bandgap of 1.673 eV was obtained. This value is higher than the value obtained for K3Cu3P2 without SOC and K3Cu3P2 with SOC. This is because the Hubbard U parameter introduces correction to the underestimated GGA values to more realistic values obtained experimentally R.O.Agbaoye et al. (2021). The bandgap obtained here is slightly below the one reported in the literature M.Irfan et al. (2021). Contribution to the valence band was both by Cu-d and P-p orbitals while contribution to the conduction band was by Cu-p orbitals. The other orbitals contributed insignificantly to both valence and conduction bands. The effect of Hubbard U parameter on bandgap was determined by varying the Hubbard U values as shown below.
III.4 Elastic Properties
K3Cu3P2 adopts the rhombohedral (I) class (Laue class ) crystal structure which features six independent elastic constantsF.Mouhat and F.X.Coudert (2014). And the four necessary and sufficient conditions M.Born and K.Huang (1954); F.Mouhat and F.X.Coudert (2014) for elastic stability in the rhombohedral structure are:
From the values of elastic constants calculated in table 3, all the necessary conditions for elastic stability were attained. This confirms that the K3Cu3P2 rhombohedral phase is mechanically stable. To the best of our knowledge; there are no previous works done on the elastic properties of K3Cu3P2 to compare our findings with.
| 37.9 | |
| 12.1 | |
| 21.3 | |
| 9.8 | |
| 50.0 | |
| 13.9 | |
| B | 25 |
| E | 25 |
| G | 9 |
| 2.59 | |
| n | 0.31 |
The elastic behaviour of materials including ductility and brittleness have been described previously M.M.Hossain and S.H.Naqib (2020). A Pugh’s ratio value of 1.75 determine the ductility/brittleness behaviour. If B/G is less than 1.75, the material is said to be brittle while if B/G is greater than 1.75 the material is termed as ductile. The calculated value of Pugh’s ratio in this study show that the material is ductile. Poisson ratio values within the range of 0.1-0.25 and 0.25-0.5 depict covalent and ionic nature of materials respectively V.Kumar and B.P.Singh (2018). The K3Cu3P2 is ionic with central forces.
III.5 Optical Properties
It is necessary to investigate the optical properties of a material for its prospects in optoelectronic applications. Optical properties describes the frequency response of various optical constants to the incident photon energy S.Azam et al. (2019). The optical constants in materials are determined by complex dielectric function S.Azam et al. (2019); Where and () are frequency dependent real and imaginary parts of dielectric function respectively. The dielectric constants were computed using Sternheimer Equation F.Giustino et al. (2010) and presented in Figure 8 below.
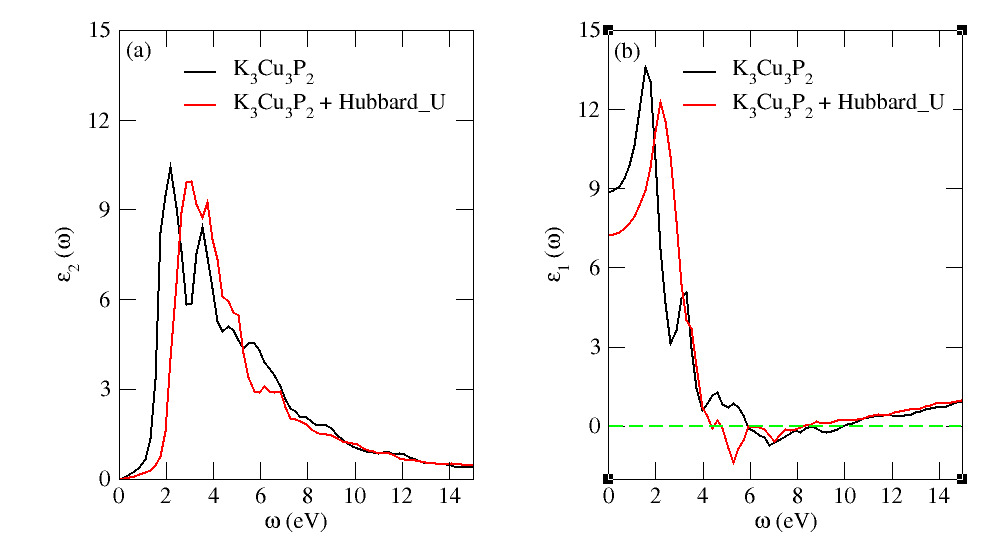
The imaginary part of the dielectric function characterizes the photon absorption phenomenon of materials. The peaks in () plot occur as a result of electron transitions from valence to conduction bands. At = 0 on the y-axis of the () plot, the values are referred to as static and their square root gives the refractive index values S.Azam et al. (2019). The optical bandgaps of K3Cu3P2 with and without Hubbard U were found to be 1.839 eV and 1.204 eV while the refractive indices were found to be 2.85 and 3.08 respectively. The narrower the bandgap, the higher the () and the refractive index values (see Figure 8). These results are in agreement with findings in the previous works M.Irfan et al. (2021). All the other optical constants including the absorption coefficient (), refractive index n(), reflectivity R() and energy loss function L() were obtained from the dielectric constants according to the Equations G.Nazir et al. (2018); F.Okbi et al. (2020); M.S.Yaseen et al. (2021); S.Sahina et al. (2012).
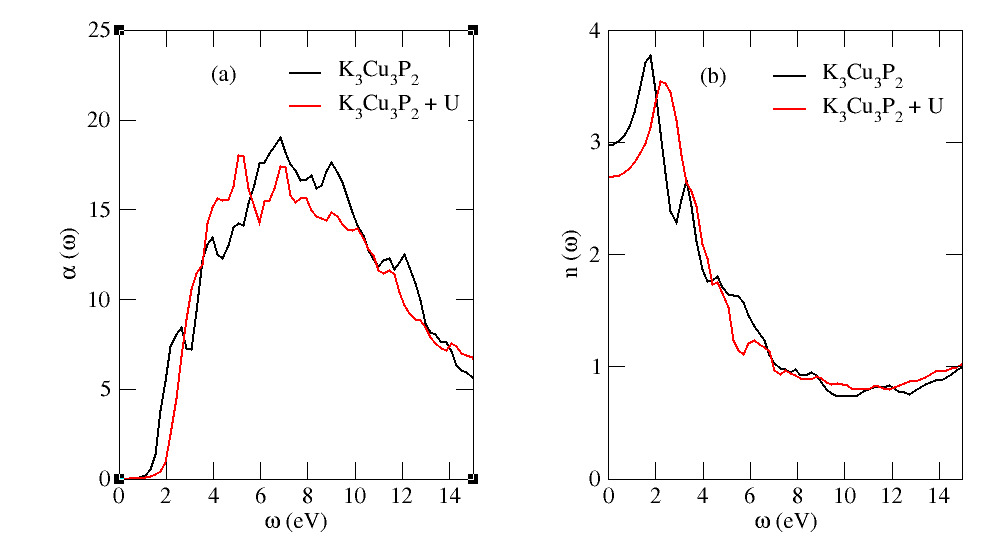
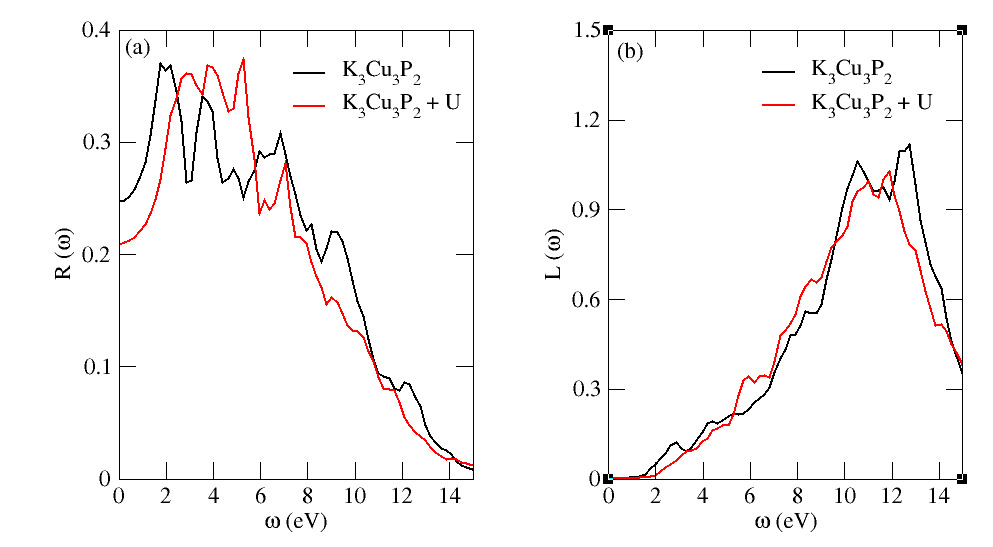
Absorption coefficient measure the quantity of light absorbed by a medium while the refractive index describe both optical and electronic properties of materials M.S.Yaseen et al. (2021). The K3Cu3P2 was found to have a broad absorption spectrum in the range 2-14 eV covering the UV-Vis regions. The major peaks of the refractive index plots were found to lie within the visible region. Reflectivity characterizes the surface behaviour of materials while energy loss spectrum describes the energy lost by fast electrons entering a medium M.S.Yaseen et al. (2021). The main reflectivity peaks were observed at the lower energy regions 2-3 eV. There was a decrease in reflectivity with increase in photon energies. The main peaks of energy loss spectrum were observed at higher energies in the range 10-13 eV. There were no distinct peaks observed in the visible region. The absorption coefficients, refractive indices, reflectivities and energy loss functions of K3Cu3P2 with Hubbard U are lower than those of K3Cu3P2 without Hubbard U (see Figure 9, 10). These findings are in agreement with the results obtained by Irfan et al. M.Irfan et al. (2021).
IV Conclusion
In conclusion, we have investigated the effect of using different DFT approaches on the structural, electronic, elastic and optical properties of K3Cu3P2 ternary pnictide material. The material was found to have good structural stability with the ground state lattice constants of 14.104, 14.089 and 14.186 a.u for K3Cu3P2 without SOC, K3Cu3P2 with SOC and K3Cu3P2 with Hubbard U respectively. Direct electronic bandgaps of 1.338 , 1.323 and 1.673 eV were obtained for K3Cu3P2 without SOC, K3Cu3P2 with SOC and K3Cu3P2 with Hubbard U respectively. These results show that SOC factor did not have a significant effect on the computed structural and electronic properties. The contribution to electron transitions in the valence band was majorly by Cu-d orbitals for K3Cu3P2 without SOC, K3Cu3P2 with SOC and K3Cu3P2 with Hubbard U. Optical bandgaps were found to be 1.204 eV and 1.839 eV for K3Cu3P2 without SOC and K3Cu3P2 with Hubbard U respectively. It is noticeable from the optical absorption coefficients that K3Cu3P2 absorbs the photons in the UV-Vis regions of the electromagnetic spectrum hence potentiality for application in the optoelectronic fields.
Conflict of Interest
Authors declare no competing conflicts of interest.
Acknowledgements
Authors acknowledge the Partnership for Skills in Applied Sciences, Engineering and Technology (PASET) - Regional Scholarship Innovation Fund (RSIF) for the Funding opportunity, the International Programme in Physical Sciences, IPPS Sweden for seed grant for computing resources, Center for High Performance Computing for cluster and software resources, the Kenya Education Network Trust for funding and Masinde Muliro University of Science and Technology Grant No. MMU/URF/2022/1-026.
References
- L.Shi et al. (2021) L.Shi, K.Chen, A.Zhai, G.Li, M.Fan, Y.Hao, F.Zhu, H.Zhang, and Y.Cui, 15, 1 (2021).
- M.Usman et al. (2017) M.Usman, M.Mendiratta, and K.L.Lu, 29, 1 (2017).
- D.Yang and D.Ma (2019) D.Yang and D.Ma, 7, 1 (2019).
- A.Zakutayev et al. (2021) A.Zakutayev, J.D.Major, X.Hao, A.Walsh, J.Tang, T.K.Todorov, L.H.Wong, and E.Saucedo, 3, 2 (2021).
- S.Akari et al. (2018) S.Akari, J.Chantana, S.Nakatsuka, Y.Nose, and T.Minemoto, 174, 412 (2018).
- C.Sreeparvathy et al. (2016) P. C.Sreeparvathy, V.Kanchana, and G.Vaitheeswaran, 119, 1 (2016).
- R.Li et al. (2019) R.Li, X.Li, L.Xi, J.Yang, D.J.Singh, and W.Zhang, 11, 24859 (2019).
- S.D.Dabhi and P.K.Jha (2016) S.D.Dabhi and P.K.Jha, 124, 1341 (2016).
- M.Irfan et al. (2021) M.Irfan, S.Azam, and A.Iqbal, 45, 2980 (2021).
- P.Hohenberg and W.Kohn (1964) P.Hohenberg and W.Kohn, 136, B864–B871 (1964).
- W.Kohn and L.J.Sham (1965) W.Kohn and L.J.Sham, 140, A1133–A1138 (1965).
- Giannozzi et al. (2009) P. Giannozzi, S. Baroni, N.Bonini, M.Calandra, R.Car, C.Cavazzoni, D.Ceresoli, G.L.Chiarotti, M.Cococcioni, I.Dabo, A. Corso, S. Gironcoli, S.Fabris, G.Fratesi, R.Gebauer, U.Gerstmann, C.Gougoussis, A.Kokalj, M.Lazzeri, L.Martin-Samos, N.Marzari, F.Mauri, R.Mazzarello, S.Paolini, A.Pasquarello, L.Paulatto, C.Sbraccia, S.Scandolo, G.Sclauzero, A.P.Seitsonen, A.Smogunov, P.Umari, and R.M.Wentzcovitch, 21, 1 (2009).
- J.P.Perdew et al. (1996) J.P.Perdew, K.Burke, and M.Ernzerhof, 77, 3865 (1996).
- S.Dudarev and G.Botton (1998) S.Dudarev and G.Botton, 57, 1505 (1998).
- N.Rybin et al. (2021) N.Rybin, D.Y.Novoselov, D.M..Korotin, V.I.Anisimov, and A.R.Oganov, 23, 15989 (2021).
- (16) .
- G.Prandini et al. (2018) G.Prandini, A.Marrazzo, I.E.Castelli, N.Mounet, and N.Marzari, 4, 1 (2018).
- F.Birch (1947) F.Birch, 71, 809 (1947).
- R.O.Agbaoye et al. (2021) R.O.Agbaoye, S.Bolarinwa, K.O.Akiode, A.A.Adekoya-Olowofela, L.M.Habeeb, O.M.Balogun, P.O.Adebambo, S.Kenmoe, and G.A.Adebayo, 9, 1 (2021).
- P.Bremner et al. (2016) S. P.Bremner, C.Yi, I.Almansouri, A.Ho-Baillie, and M.A.Green, 135, 750 (2016).
- F.Mouhat and F.X.Coudert (2014) F.Mouhat and F.X.Coudert, 90, 1 (2014).
- M.Born and K.Huang (1954) M.Born and K.Huang, 6, 605 (1954).
- M.M.Hossain and S.H.Naqib (2020) M.M.Hossain and S.H.Naqib, 118, 1 (2020).
- V.Kumar and B.P.Singh (2018) V.Kumar and B.P.Singh, 92, 29 (2018).
- S.Azam et al. (2019) S.Azam, M.Irfan, Z.Abbas, M.Rani, T.Saleem, A.Younus, N.Akhtar, B.Liaqat, M.Shabbir, and A.G.Al-Sehemi, 6, 1 (2019).
- F.Giustino et al. (2010) F.Giustino, M.L.Cohen, and S.G.Louie, 81, 1 (2010).
- G.Nazir et al. (2018) G.Nazir, S.Tariq, A.Afaq, Q.Mahmood, S.Saad, A.Mahmood, and S.Tariq, 133, 105 (2018).
- F.Okbi et al. (2020) F.Okbi, S.Lakel, S.Benramache, and K.Almi, 54, 58 (2020).
- M.S.Yaseen et al. (2021) M.S.Yaseen, J.Sun, H.Fang, G.Murtaza, and D.S.Sholl, 111, 106508 (2021).
- S.Sahina et al. (2012) S.Sahina, Y.O.Ciftcia, K. Colakoglua, and N. Korozlu, 529, 1 (2012).