Pitfalls and Potentials in Simulation Studies
Questionable research practices in
comparative simulation studies allow for spurious claims of superiority
of any method
Abstract
Comparative simulation studies are workhorse tools for benchmarking
statistical methods. As with other empirical studies, the success of
simulation studies hinges on the quality of their design, execution and
reporting. If not conducted carefully and transparently, their
conclusions may be misleading. In this paper we discuss various
questionable research practices which may impact the validity of
simulation studies, some of which cannot be detected or prevented by the
current publication process in statistics journals. To illustrate our
point, we invent a novel prediction method with no expected performance
gain and benchmark it in a pre-registered comparative simulation study.
We show how easy it is to make the method appear superior over
well-established competitor methods if questionable research practices
are employed. Finally, we provide concrete suggestions for researchers,
reviewers and other academic stakeholders for improving the
methodological quality of comparative simulation studies, such as
pre-registering simulation protocols, incentivizing neutral simulation
studies and code and data sharing.
Keywords: benchmarking studies, Monte Carlo experiments,
overoptimism, reproducibility, replicability, transparency
1 Introduction
Simulation studies are to a statistician what experiments are to a scientist (Hoaglin and Andrews,, 1975). They have become a ubiquitous tool for the evaluation of statistical methods, mainly because simulation can be used for studying the statistical properties of methods under conditions that would be difficult or impossible to study theoretically. In this paper we focus on simulation studies where the objective is to compare the performance of two or more statistical methods (comparative simulation studies). Such studies are needed to ensure that previously proposed methods work as expected under various conditions, and to identify conditions under which they fail. Moreover, evidence from comparative simulation studies is often the only guidance available to data analysts for choosing from the plethora of available methods (Boulesteix et al.,, 2013, 2017). Proper design and execution of comparative simulation studies is therefore important, and results of methodologically flawed studies may lead to misinformed decisions in scientific and medical practice.
Figure 1 shows a schematic illustration of an example comparative simulation study. We see that, just like non-simulation based studies, comparative simulation studies require many decisions to be made, for instance: How will the data be generated? How often will a simulation condition be repeated? Which statistical methods will be compared and how are their parameters specified? How will the performance of the methods be evaluated? The degree of flexibility, however, is much higher for simulation studies than for non-simulation based studies as they can often be rapidly repeated under different conditions at practically no additional cost. This is why numerous recommendations and best practices for design, execution and reporting of simulation studies have been proposed (Hoaglin and Andrews,, 1975; Holford et al.,, 2000; Burton et al.,, 2006; Smith and Marshall,, 2010; O'Kelly et al.,, 2016; Monks et al.,, 2018; Elofsson et al.,, 2019; Morris et al.,, 2019; Boulesteix et al.,, 2020; Chipman and Bingham,, 2022). We recommend Morris et al., (2019) for an introduction to state-of-the-art simulation study methodology.
Despite wide availability of such guidelines, statistics articles often provide too little detail about the reported simulation studies to enable quality assessment and replication (see the literature reviews in Burton et al.,, 2006; Morris et al.,, 2019). Journal policies sometimes require the computer code to reproduce the results, but they rarely require or promote rigorous simulation methodology (for instance, the preparation of a simulation protocol). This leaves researchers with considerable flexibility in how they conduct and present simulations studies. As a consequence, readers of statistics papers can rarely be sure of the quality of evidence that a simulation study provides.
Unfortunately, there are many questionable research practices (QRPs) which may undermine the validity of comparative simulations studies and which can easily go undetected under current publishing standards. Figure 1 shows several QRPs that may occur in the exemplary simulation study. There is often a fine line between QRPs and legitimate research practices. For instance, a researcher may choose to selectively report the most relevant simulation conditions, methods and outcomes in order to streamline the results for the reader. These practices only become questionable when they serve to confirm the hopes and beliefs of researchers regarding a particular method. For instance, if only conditions and outcomes are reported where the researcher’s favored method appears superior over competitor methods. Consequently, the results and conclusions of the study will be biased in favor of this method (Nießl et al.,, 2022).
The aim of this paper is to raise awareness about the issue of QRPs in comparative simulation studies, and to highlight the need for the adoption of higher standards. While researchers may make decisions that can make the conclusions of simulation studies misleading, we are not accusing them of doing so intentionally or maliciously. Instead, we highlight how QRPs can occur and possibly be prevented. External pressures, for example, to publish novel and superior methods (Boulesteix et al.,, 2015) or to concisely report large amounts of simulation results, may also lead honest researchers to (unknowingly) employ QRPs. As we will argue, it is not only up to the researchers but also other academic stakeholders to improve on these issues.
This article is structured as follows: We first give an illustrative list of QRPs related to comparative simulation studies (Section 2). With an exemplary simulation study, we then show how easy it is to present a novel, made-up method as an improvement over others if QRPs are employed and a priori simulation plans remain undisclosed (Section 3). The main inspiration for this work is drawn from similar illustrative studies which have been conducted by Yousefi et al., (2009) and Jelizarow et al., (2010) for benchmarking studies, and by Simmons et al., (2011) in the context of -hacking in psychological research. Recently, Nießl et al., (2022) and Ullmann et al., (2022) expanded on QRPs in benchmarking studies with the latter also including simulation studies. In Section 4, we then provide concrete suggestions for researchers, reviewers, editors and funding bodies to alleviate the issues of QRPs and improve the methodological quality of comparative simulation studies. Section 5 closes with limitations and concluding remarks.
2 Questionable research practices in comparative simulation studies
There are various QRPs which threaten the validity of comparative simulation studies (see Table 1 for an overview). QRPs can be categorized with respect to the stage of research at which they can occur and which other QRPs they are related to (Wicherts et al.,, 2016). Typically, QRPs becomes more problematic if they are combined with related QRPs. For example, adapting the data-generating process to achieve a desired outcome (E2) is more problematic when the results based on the adapted process are selectively reported (R2) compared to reporting the results based on both the original and the adapted process. In the following, we describe QRPs from all phases of a simulation study, namely, design, execution and reporting.
| Tag | Related | Type of QRP |
|---|---|---|
| Design | ||
| D1 | E1, R1 | Not/vaguely defining objectives of simulation study |
| D2 | E2, R1 | Not/vaguely defining data-generating process |
| D3 | E3, E4, R1 | Not/vaguely defining which methods will be compared and how their parameters are specified |
| D4 | E1, E5, R1 | Not/vaguely defining estimands of interest |
| D5 | E1, E5, R1 | Not/vaguely defining evaluation criteria |
| D6 | E6, R1 | Not/vaguely defining how to handle missing values (for example, due to non-convergence of methods) |
| D7 | E7, E8, R3 | Not justifying number of simulations |
| Execution | ||
| E1 | D1, R2 | Changing objective of the study to achieve desired outcomes |
| E2 | D2, R2 | Adapting data-generating process to achieve desired outcomes |
| E3 | D3, R2 | Adding/removing comparison methods to achieve desired outcomes |
| E4 | D3, R2 | Selective tuning of method hyperparameters to achieve desired outcomes |
| E5 | D4, D5, R2 | Choosing evaluation criteria to achieve desired outcomes |
| E6 | D6, R2 | Adapting inclusion/exclusion/imputation rules to achieve desired outcomes |
| E7 | D7, R3 | Choosing number of simulations to achieve desired outcomes |
| E8 | D7, R3 | Choosing random number generator seed to achieve desired outcomes |
| Reporting | ||
| R1 | D1–D6 | Justifying design decisions which lead to desired outcomes post hoc |
| R2 | E1–E6 | Selective reporting of results from simulations that lead to desired outcomes |
| R3 | D7, E7, E8 | Failing to report Monte Carlo uncertainty |
| R4 | Failing to assure computational reproducibility (for example, not sharing code and sufficient details about computing environment) | |
| R5 | Failing to assure replicability (for example, not sufficiently reporting design and execution methodology) | |
2.1 QRPs in the design of comparative simulation studies
The a priori specification of research hypotheses, study design and analytic choices is what separates confirmatory from exploratory research. Evidence from confirmatory research is typically considered more robust because study hypotheses, design, and analysis are independent of the observed data (Tukey,, 1980). The line between the two types of research is, however, blurry in simulation studies since they are often iteratively conducted, with each iteration including newly simulated data and building on the results of the previous study. The first simulation study in a sequence of studies may thus be exploratory whereas the subsequent studies may be confirmatory. Yet, one may argue that in many cases a single confirmatory simulation study which is carefully designed and whose design is justified based on external knowledge provides more relevant evidence than a sequence of simulation studies which are iteratively tweaked based on previous results.
To allow readers to distinguish between confirmatory and exploratory research, many non-methodological journals require pre-registration of study design and analysis protocols. For instance, pre-registration is common practice in randomized controlled clinical trials (Angelis et al.,, 2004), and increasingly adopted in experimental psychology (Nosek et al.,, 2018) and epidemiology (Lawlor,, 2007; Loder et al.,, 2010). It is also generally recommended to write and pre-register simulation protocols in simulation studies (Morris et al.,, 2019). Well-defined study aims and methodology are arguably at least as important as in simulation studies compared to non-simulation based studies because the space of possible design and analysis choices is typically much larger (Hoffmann et al.,, 2021). If researchers are vague or fail to define the study goals (D1), the data-generating process (D2), the methods under investigation (D3), the estimands of interest (D4), the evaluation metrics (D5), or how missing values should be handled (D6) a priori a high number of researcher degrees of freedom (Simmons et al.,, 2011) are left open. Researchers can then generate a multiplicity of possible results which may foster overoptimistic impressions if they report only the subset of results aligning with their hopes and beliefs (R2), and for which they can find plausible justifications post hoc (R1).
Another crucial part of rigorous design is simulation size calculation (see Section 5.3 in Morris et al.,, 2019, for an overview). While an arbitrarily chosen, often too small, number of simulations can be executed faster, they yield noisier results. The additional noise is not necessarily problematic if one is only concerned with estimation. However, if the goal is to establish method superiority through statistical tests (for instance, through a confidence interval for the difference in method performance excluding zero), simulation studies with too few repetitions come with undesirable properties, just as any other study with an insufficiently large sample size. For instance, “true” differences in method performance are more likely to remain undetected (increased type II errors), detected differences are more likely to be in the wrong direction (increased “type S” errors, see Gelman and Tuerlinckx,, 2000), and their magnitude is more likely to be overestimated (increased “type M” errors, see van Zwet and Cator,, 2021). Additionally, a researcher may start with a small simulation size and continue to add newly simulated data until superiority is established (optional stopping). This is similar to early stopping of a trial without correction for the interim analysis. Without specialized corrections, optional stopping leads to biased estimates and increased type I error rates (Robertson et al.,, 2023). These biases may also occur when the entire simulation study is rerun with a larger sample size and the seed of the random number generator is left unchanged. The simulated data will be the same up to the additional data (provided the simulation runs deterministically conditional on a seed). From this perspective, researchers should thus change the seed if they want rerun the study and increase the simulation size adaptively.
2.2 QRPs in the execution of comparative simulation studies
During the execution of a simulation study researchers may (often unknowingly) engage in various QRPs that can lead to overoptimism. For instance, the objective of the simulation study may be changed depending on the outcome (E1). For example, an initial comparison of predictive performance may be changed to comparing estimation performance if the results suggest that the favored method performs better at estimation tasks rather than prediction. The data-generating process may also be adapted until conditions are found in which the favored method appears superior (E2). For example, the noise levels, the number of covariates, or the effect sizes could be changed. Competitor methods that are superior to the proposed method may also be excluded from the comparison altogether, or methods which perform worse under the (adapted) data-generating process may be added (E3). The methods under comparison may come with hyperparameters (for instance, regularization parameters in penalized regression models). In this case, the hyperparameters of a favored method may be tuned until the method appears superior, or the hyperparameters of competitor methods may be tuned selectively, for example, left at their default values (E4). Finally, the evaluation criteria for comparing the performance of the investigated methods may also be changed to make a particular method look better than the others (E5). For example, even though the original aim of the study may have been to compare predictive performance among methods using the Brier score, the evaluation criterion of the simulation study may be switched to area under the curve if the results suggest that the favored method performs better with respect to the latter metric. This QRP parallels the well-known outcome-switching problem in clinical trials (Altman et al.,, 2017). It is usually not difficult to find reasonable justification for such modifications and then present them as if they were specified during the planning of the study (R1). As emphasized earlier, iteratively changing simulation goals, conditions, methods under comparison and evaluation criteria can be part of finding out how a method works. These practices become mostly problematic if only the simulations in line with the researchers hopes and beliefs are reported (R2).
There are, however, practices which are considerably more problematic on their own. For instance, in some simulations a method may fail to converge and thus produce missing values in the estimates. If it is not pre-specified how these situations will be handled, different inclusion/exclusion or imputation strategies may be tried out until a favored method appears superior (E6). Choosing an inadequate strategy can result in systematic bias and misleading conclusions. If no a priori simulation size calculation was conducted, the simulation size may also be changed until favorable results are obtained (E7). If in that case the number of simulations is too small, true performance differences are more likely to be missed, their estimated direction is more likely to be incorrect and their magnitude is more likely overestimated, as explained previously. Finally, if only few simulations are conducted (for instance, because the methods under investigation are computationally very expensive), the initializing seed for generating random numbers may have a substantial impact on the result. A particularly questionable practice in this situation is to tune the seed until a value is found for which a preferred method seems superior (E8).
2.3 QRPs in the reporting of comparative simulation studies
In the reporting stage, researchers are faced with the challenge of reporting the design, results, and analyses of their simulation study in a digestible manner. Various QRPs can occur at this stage. For instance, reporting may focus on results in which the method of interest performs best (R2). Failing to mention conditions in which the method was inferior (or at least not superior) to competitors creates overoptimistic impressions, and may lead readers to think that the method uniformly outperforms competitors. Similarly, presenting simulation conditions which were added based on the observed results as pre-planned and justified (R1) fosters overconfidence in the results.
Another crucial aspect of reporting is to adequately show the uncertainty related to the simulation results (Hoaglin and Andrews,, 1975; Van der Bles et al.,, 2019). Failing to report Monte Carlo uncertainty (R3), such as error bars or confidence intervals reflecting uncertainty in the simulation, hampers the readers’ ability to assess the accuracy of the results from the simulation study and it allows one to present random differences in performance as if they were systematic.
Finally, by failing to assure computational reproducibility of the simulation study (R4), for example, by not sharing code and software versions to run the simulation, it is more likely that coding errors remain undetected. By not reporting the design and execution of the study in enough detail (R5), other researchers are unable to replicate and expand on the simulation study. Unclear reporting also makes it harder for readers to identify potentially overoptimistic statements. For instance, if it is reported that all but one method are left at their default parameters, readers can better contextualize this method’s apparent superior performance.
3 Empirical study: The Adaptive Importance Elastic Net (AINET)
To illustrate the application of QRPs from Table 1 we conducted a simulation study. The objective of the study was to evaluate the predictive performance of a made-up regression method termed the adaptive importance elastic net (ainet). The main idea of ainet is to use variable importance measures from a random forest for a weighted penalization of the variables in an elastic net regression model. The hope is that this ad hoc modification of the elastic net model improves predictive performance in clinical prediction modeling settings where penalized regression models are frequently used. Superficially, ainet may seem sensible, however, for the data-generating process considered in our simulation study no advantage over the classical elastic net is expected. For more details on the method, we refer the reader to the simulation protocol (Appendix A). We report the pre-registered333We use the term pre-registered throughout to refer to simulation analyses conducted as pre-specified in the protocol. simulation study results in the online supplement. As expected, the performance of ainet was virtually identical to standard elastic net regression. ainet also did not yield any improvements over logistic regression for the data-generating process that we considered sensible a priori (that is, specified based on typical conditions in clinical prediction modeling and simulation studies from other researchers).
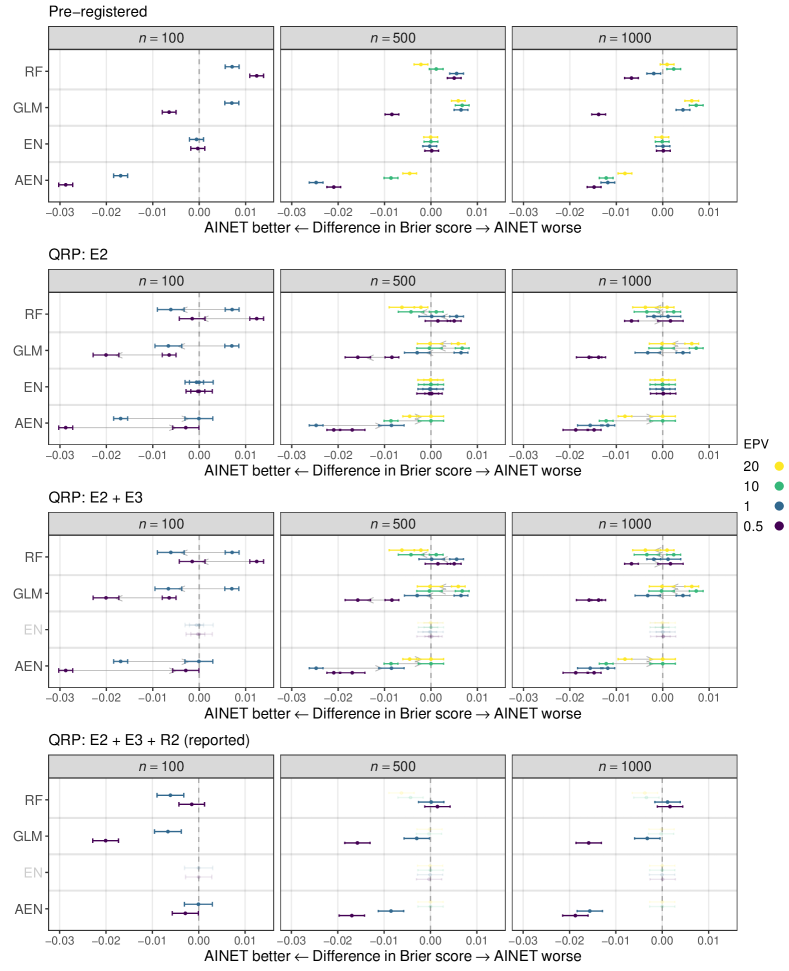
We now show how application of QRPs changes the above pre-registered conclusions. Figure 2 illustrates different types of QRPs sequentially applied to simulation-based evaluation of ainet. The top row depicts the pre-registered differences in Brier score (horizontal axis) between ainet and competitor methods (vertical axis) for a representative subset of the simulation conditions. A negative difference indicates superior performance of ainet. In the second row, the arrows depict the change in the pre-registered results after changing the data-generating process (E2). The third row shows the result after removal of the elastic net competitor (E3). Finally, the bottom row shows the end result where selective reporting of simulation conditions and competitor methods (R2) is applied to give a more favorable impression of ainet. We will now discuss these QRPs in more detail.
Altering the data-generating process (E2)
We could not detect a systematic performance benefit of ainet over standard logistic regression, elastic net regression, or random forest for the scenarios specified in the protocol. For this reason, we tweaked the data-generating process by adding different sparsity conditions and a non-linear effect. We then found that ainet outperforms logistic regression under the following conditions: Only few variables being associated with the outcome (sparsity), a non-linear effect and a low number of events per variable (EPV). Figure 2 (second row) shows the changes in Brier score difference between the pre-registered and the tweaked simulation. As can be seen, the tweaked data-generating process leads to ainet being superior to competitors in some conditions, and at least not inferior in others.
Removing competitor methods (E3)
Despite the adapted data-generating process, we still observed only minor (if any) improvements of ainet over the elastic net. In order to present ainet in a better light we could omit the comparisons with the elastic net (E3), as shown in Figure 2 (third row). This could be justified, for example, by arguing that for neutral comparison it is sufficient to compare a less flexible method (logistic regression, which has no tuning parameters and captures linear effects), a more flexible method (random forest, which has tuning parameters and captures nonlinear relationships), and a comparably flexible method (adaptive elastic net, which has the same tuning parameters as AINET, but differs in the way the penalization weights are chosen).
Selective reporting of simulation results (R2)
After the removal of the competitor elastic net, there are still some simulation conditions under which ainet is not superior to the remaining competitors. To make ainet appear more favorable, we thus report only simulation conditions with low EPV, as shown in Figure 2 (fourth row). This could be justified by the fact that journals require authors to be concise in their reporting. Otherwise, further conditions with low EPV values could be simulated to make the results seem more exhaustive. Focusing primarily on low EPV settings could be justified in hindsight by framing ainet as a method designed for high-dimensional data (low sample size relative to the number of variables).
4 Recommendations
The previous sections painted a rather negative picture of how undisclosed changes in simulation design, analysis and reporting may lead to overoptimistic conclusions. In the following, we summarize what we consider to be practical recommendations for improving the methodological quality of simulation studies; see Table 2 for an overview. Our recommendations are grouped with regards to which stakeholder they concern.
| Researchers |
|---|
| – Write (and possibly pre-register) simulation protocols – Adopt good computational practices (code review, packaging, unit-tests) – Share code and data (possibly in intermediate/summary form to enable secondary analysis) – Report the process of the simulation study fully and transparently (for instance, time-stamped protocol amendments to disclose pilot studies and post hoc modifications) – Perform simulation analysis in a blinded manner – Collaborate with other research groups (possibly familiar with “competing” methods) – Disclose multiplicity and uncertainty of results (for example, with sensitivity analyses) – Teach simulation study methodology in statistics (post)graduate courses Editors and reviewers |
| – Encourage exploration of conditions where methods should be inferior or break down – Encourage (pre-registered) simulation protocols – Provide enough space for description of simulation methodology Journals and funding bodies |
| – Provide incentives for rigorous simulation methodology (such as badges on papers) – Require code and data – Promote standardized reporting – Adopt reproducibility checks – Promote/fund research and software to improve simulation study methodology – Shift focus away from outperforming state-of-the-art methods |
4.1 Recommendations for researchers
Adopting pre-registered simulation protocols is an important measure that researchers can take to prevent themselves from subconsciously engaging in QRPs. Pre-registration enables readers to distinguish between confirmatory and exploratory findings, and it lowers the risk of potentially flawed methods being promoted as an improvement over competitors. While pre-registered simulation protocols may at first seem disadvantageous due to the additional work and possibly lower chance of publication, they provide researchers with the means to differentiate their high-quality simulation studies from the numerous unregistered and possibly less trustworthy simulation studies in the literature. Platforms such as GitHub (https://github.com/), OSF (https://osf.io/), or Zenodo (https://zenodo.org/) can be used for archiving and time-stamping documents. Moreover, pre-registration can also save researchers from some work later on. For instance, large parts of the methodology description can usually be copied from the protocol to the final manuscript.
When pre-registering and conducting simulation studies, we recommend using a robust computational workflow. Such a workflow encompasses packaging the software, writing unit tests and reviewing code (see Schwab and Held,, 2021). Other researchers and the authors themselves then benefit from improved computational reproducibility and less error-prone code. Of course, there are also certain practical limits to computational reproducibility. For instance, if a simulation study requires high performance computing and/or several weeks of running time, the authors should not expect reviewers and journals to replicate their simulation study from scratch. The authors should nevertheless provide the code to run the simulation and, if possible, they should also provide intermediate simulation results (for instance, fitted model objects) so that the simulation study can at least be partially reproduced. Similarly, authors can share the simulated data, either in raw and/or some summarized form (for example, sharing simulated data sets and parameter estimates of fitted models). This allows interested readers and reviewers to do additional analyses. Unlike experiments with human subjects, there are no privacy concerns for sharing simulation data. Furthermore, online tools, such as INTEREST (INteractive Tool for Exploring REsults from Simulation sTudies, Gasparini et al.,, 2021), can be used for interactive exploration of the data set.
While planning a simulation study, it is impossible to think of all potential weaknesses or problems that may arise when conducting the planned simulations. In turn, researchers may be reluctant to tie their hands in a pre-registered protocol. However, a transparently conducted and reported preliminary simulation can obviate most of these problems. We recommend researchers to disclose preliminary results and any resulting changes to the protocol, for example, in a revised and time-stamped version of the protocol. This approach is similar to conducting a small pilot study, as is often done in non-simulation based research. Even if researchers realize that further changes are required after the main simulation study has begun, transparent reporting of when and why post hoc modifications were made allows the reader to better assess the quality of evidence provided by the study. Researchers designing simulation studies may draw inspiration from clinical trials by tracking their protocol modifications and time-stamping versions of their protocol.
A different approach for making post hoc changes to the protocol is to use blinding in the analysis of the simulation results (Dutilh et al.,, 2021). Blinded analysis is a standard procedure in particle physics to prevent data analysts from biasing their result towards their own beliefs (Klein and Roodman,, 2005), and it lends legitimacy to post hoc modifications of the simulation study. For instance, researchers might shuffle the method labels and only unblind themselves after the necessary analysis pipelines are set in place. An alternative blinding approach is to carry out data generation and analysis by different researchers. For instance, the study from Kreutz et al., (2020) involved two independent research groups, one who simulated and one who analyzed the data. A related way for improving simulation studies is to collaborate with other researchers, possibly ones familiar with “competing” methods. This helps to design simulation studies which are more objective and whose results are more useful for making a decision about which method to choose under which circumstances.
We also recommend researchers to disclose the multiplicity and uncertainty inherent to the design and analysis of their simulation studies (Hoffmann et al.,, 2021). For instance, researchers can report sensitivity analyses that show how the study results change for different analysis decisions (for example, Table 4 in van Smeden et al., (2016) shows how the evaluation metrics for different estimators change depending on how convergence of a method is defined). Methods from multivariate statistics can be used for visualizing the influence of different design choices, such as the multidimensional unfolding approach in Nießl et al., (2022).
One reason for the low standards of simulation studies in the statistics literature may be that rigorous simulation methodology is usually not taught in graduate or postgraduate courses (with a few exceptions, such as the course “Using simulation studies to evaluate statistical methods” from the MRC Clinical Trials Unit). To improve training of current and future generations of statisticians, researchers who are involved in teaching should therefore also include simulation study methodology in their curricula. The standards of simulation studies in many statistics related fields (for instance, machine learning, psychometrics, econometrics, or ecology) are arguably not much different. One possible avenue for future research is thus to also promote education and adaptation of simulation study methodology for the special needs in these fields.
4.2 Recommendations for editors and reviewers
Peer review is an important tool for identifying QRPs in research results submitted to methodological journals. For instance, reviewers may demand researchers to include competitor methods which are not part of their comparison yet (or which might have been excluded from the comparison). However, reviewers can only identify a subset of all QRPs since some types are impossible to spot if no pre-registered simulation protocol is in place (for example, a reviewer cannot know whether the evaluation criterion was switched). Even QRPs which can be detected by peer review may be difficult to spot in practice. It is thus important that reviewers and editors promote that authors make simulation protocols and computer code available alongside the manuscript. Moreover, by providing enough space and encouraging authors to provide detailed descriptions of their simulation studies, replicability of the simulation studies can be improved. Finally, reviewers should not be satisfied with manuscripts showing that a method is uniformly superior; they should also encourage authors to explore conditions in which their method is expected to be inferior to other methods or to break down entirely.
4.3 Recommendations for journals and funding bodies
Journals and funding bodies can improve on the status quo by either actively requiring or passively incentivizing more rigorous and neutral simulation study methodology. Actively, journals can make (pre-registered) simulation protocols mandatory for all articles featuring a simulation study. A more passive and less extreme measure would be to indicate with a badge whether an article contains a pre-registered simulation study, or to introduce article types dedicated to neutral comparison studies. Such an approach rewards researchers who take the extra effort. Similar initiatives have led to a large increase in the adoption of pre-registered study protocols in the field of psychology (Kidwell et al.,, 2016). Another measure could be to require standardized reporting of simulation studies, for example, the “ADEMP” reporting structure proposed by Morris et al., (2019). Journals may also employ reproducibility checks to ensure computational reproducibility of the published simulation studies. This is already done, for example, by the Journal of Open Source Software or the Journal of Statistical Software. Moreover, journals and funding bodies can promote or fund research and software to improve simulation study methodology. For instance, a journal might have special calls for papers on simulation methodology. Similarly, a funding body could have special grants dedicated to software development that facilitates sound design, execution and reporting of simulation studies (as White,, 2010; Gasparini,, 2018; Chalmers and Adkins,, 2020). Finally, journals and funding bodies often exert a strong incentive on researchers to publish novel and superior methods. This may lead to articles with non-systematic simulation studies that mainly highlight settings beneficial to the proposed methods. We believe that the above recommendations can shift the incentive structure towards more transparent and neutral simulation studies, and away from the “one method fits all data sets” philosophy (Strobl and Leisch,, 2022).
5 Conclusions
Simulation studies should be viewed and treated analogously to (empirical) experiments from other fields of science. Transparent reporting of methodology and results is essential to contextualize the outcome of such a study. As in other empirical sciences, QRPs in simulation studies can obfuscate the usefulness of a novel method and lead to misleading and non-replicable results.
By deliberately using several QRPs we were able to present a method with no expected benefits and little theoretical justification – invented solely for this article – as an improvement over theoretically and empirically well-established competitors. While such intentional engagement in these practices is far from the norm, unintentional QRPs may have the same detrimental effect. We hope that our illustration will increase awareness about the fragility of findings from simulation studies and the need for higher standards.
While this article focuses on comparative simulation studies, many of the issues and recommendations also apply to neutral comparison studies with real data sets as discussed in Nießl et al., (2022). Some of the noted problems even exist in theoretical research; due to the incentive to publish positive results, researchers often selectively study optimality conditions of methods rather than conditions under which they fail.
Again, it is imperative to note that researchers rarely engage in QRPs with malicious intent but because humans tend to interpret ambiguous information self-servingly, and because they are good at finding reasonable justifications that match their expectations and desires (Simmons et al.,, 2011). As in other domains of science, it is easier to publish positive results in methodological research, that is, novel and superior methods (Boulesteix et al.,, 2015). Thus, methodological researchers will typically desire to show the superiority of a method rather than to neutrally disclose its strengths and weaknesses.
We provide several recommendations involving various stakeholders in the research community which we believe may help incentivize researchers to perform well-designed simulation studies. Most importantly, we think that reviewers, journals and funders should raise the standards for simulation studies by promoting pre-registered simulation protocols and rewarding researchers who invest the extra effort. Although there is evidence for the effectiveness of protocols in preventing QRPs in other fields, it is unclear whether this effect translates to simulation studies. Indeed, there are many reasons to believe that simulation studies will not benefit in a similar way as studies with human or animal subjects, due to the nature of simulations studies. For instance, requiring pre-registered protocols cannot prevent researchers engaging in QRPs until they find their desired results and only then writing and registering a protocol. In addition, there is currently no tradition of pre-registration in simulation studies, no best-practices guidance and no dedicated platform to publish protocols. For example, Kipruto and Sauerbrei, (2022) published the pre-registration of their simulation protocol as a journal article, whereas the pre-registration of the protocol from our study was uploaded to GitHub. Both protocols use the ADEMP reporting structure from Morris et al., (2019), yet the field could benefit from reporting guidelines developed by a consortium of simulation experts similar to the guidelines for health research promoted by the EQUATOR Network (Altman et al.,, 2008). Similarly, the field could benefit from a centralized pre-registration platform tailored to simulation studies (similar to https://clinicaltrials.gov for clinical trials). Regardless of the (unknown) effectiveness of pre-registered simulation protocols, we personally think that they are an important step toward improving simulation studies since they promote a minimum degree of transparency and credibility. For this reason, we think that they are especially important for “late-stage” methodological studies (Heinze et al.,, 2023) where the objective is to neutrally compare different methods and generate robust evidence.
Software and data
The simulation study was conducted in the R language for statistical computing (R Core Team,, 2020) using the version 4.1.1. The method ainet is implemented in the ainet package and available on GitHub (https://github.com/LucasKook/ainet). We provide scripts for reproducing the different simulation studies in the electronic appendix. Due to the computational overhead, we also provide the resulting data so that the analyses can be conducted without rerunning the simulations. The data can be downloaded from Zenodo (https://doi.org/10.5281/zenodo.6364574). We used pROC version 1.18.0 to compute the AUC (Robin et al.,, 2011). Random forests were fitted using ranger version 0.13.1 (Wright and Ziegler,, 2017). For penalized likelihood methods, we used glmnet version 4.1.2 (Friedman et al.,, 2010; Simon et al.,, 2011). The SimDesign package version 2.7.1 was used to set up simulation scenarios (Chalmers and Adkins,, 2020).
Acknowledgements
We thank Eva Furrer, Malgorzata Roos and Torsten Hothorn for helpful discussion and comments on the simulation protocol and drafts of the manuscript. We also thank the anonymous referees and the associate editor for constructive and valuable comments that improved the manuscript substantially. Our acknowledgment of these individuals does not imply their endorsement of this article. The authors declare that they do not have any conflicts of interest. SP acknowledges financial support from the Swiss National Science Foundation (Project #189295). The funder had no role in study design, data collection, data analysis, data interpretation, decision to publish, or preparation of the manuscript.
Appendix A Simulation protocol
Below, we include an excerpt of the final version of the protocol for the simulation-based evaluation of ainet. All time-stamped versions of the protocol are available at https://doi.org/10.5281/zenodo.6364574.
A.1 Aims
The aim of this simulation study is to systematically study the predictive performance of ainet for a binary prediction task. The simulation conditions should resemble typical conditions found in the development of prediction models in biomedical research. In particular we want to evaluate the performance of ainet conditional on
-
•
low- and high-dimensional covariates
-
•
(un-)correlated covariates
-
•
small and large sample sizes
-
•
varying baseline prevalences
ainet will be compared to other (penalized) binary regression models from the literature, namely
-
•
Binary logistic regression: the simplest and most popular method for binary prediction
-
•
Elastic net: a generalization of LASSO and ridge regression, the most widely used penalized regression methods
-
•
Adaptive elastic net: a generalization of the most popular weighted penalized regression method (adaptive LASSO)
-
•
Random forest: a popular, more flexible method. This method is related to ainet, see Section A.4.
These cover a wide range of established methods with varying flexibility and serve as a reasonable benchmark for ainet. There are many more extensions of the adaptive elastic net in the literature (see e.g., the review by Vidaurre et al.,, 2013). However, most of these extensions focus on variable selection and estimation instead of prediction, which is why we restrict our focus only on the four methods above.
A.2 Data-generating process
In each simulation , we generate a data set consisting of realizations, i.e., . A datum consists of a binary outcome and -dimensional covariate vector . The binary outcomes are generated by
with and the covariate vectors are generated by
with covariance matrix that may vary across simulation conditions (see below). The baseline prevalence is . The coefficient vector is generated from
once per simulation. Finally, the simulation parameters are varied fully factorially (except for the removal of some unreasonable conditions) as described below, leading to a total of 128 scenarios.
Sample size
The sample size used in the development of predictions models varies widely (Damen et al.,, 2016). We will use , which span typical values occurring in practice. Note that previous simulation studies usually chose sample size based on the implied number of events together with the number of covariates in the model for easier interpretation (van Smeden et al.,, 2018; Riley et al.,, 2018). We will use this approach in reverse to determine the dimensionality of the parameters below.
Dimensionality
Previous simulation studies showed that events per variable () rather than the absolute sample size and dimensionality influences the predictive performance of a method. We will therefore define the dimensionality via EPV by
and If the above formula gives non-integer values, the next larger integer will be used for . When the formula gives values above 100 or below 2, this simulation condition will be removed from the design. This is done because prediction models are in practice only multivariable models (), but at the same time the number of predictors is rarely larger than (Kreuzberger et al.,, 2020; Seker et al.,, 2020; Wynants et al.,, 2020). The exception are studies considering complex data, such as images, omics, or text data which are not the focus here. The values are chosen to cover scenarios with small to large number of covariates (see van Smeden et al.,, 2018).
Collinearity in
We distinguish between no, low, medium and high collinearity. The diagonal elements of are given by and the off-diagonal elements are set to , . These values cover the typical (positive) range of correlations.
Baseline prevalence
Different baseline prevalences are considered, reflecting a reasonable range of prevalences for rare to common diseases/adverse events.
Test data
In order to test the out-of-sample predictive performance, we generate a test data set of data points in each simulation .
A.3 Estimands
We will estimate different quantities to evaluate overall predictive performance, calibration, and discrimination, respectively. All methods will be evaluated on independently generated test data.
A.3.1 Primary estimand
-
•
Brier score. We compute the Brier score as
where . Lower values indicate better predictive performance in terms of calibration and sharpness. A prediction is well-calibrated if the observed proportion of events is close to the predicted probabilities. Sharpness refers to how concentrated a predictive distribution is (e.g., how wide/narrow a prediction interval is), and the predictive goal is to maximize sharpness subject to calibration (Gneiting,, 2008). The Brier score is a proper scoring rule, meaning that it is minimized if a predicted distribution is equal to the data-generating distribution (Gneiting and Raftery,, 2007). Proper scoring rules thus encourage honest predictions. The Brier score is therefore a principled choice for our primary estimand.
A.3.2 Secondary estimands
-
•
Scaled Brier score. The scaled Brier score (also known as Brier skill score) is computed as
with and the observed prevalence in the data set. The scaled Brier score takes into account that the prevalence varies across simulation conditions. Hence, the scaled Brier score can be compared between conditions (Schmid and Griffith,, 2005; Steyerberg et al.,, 2019).
-
•
Log-score. We compute the log-score on independently generated test data,
will be used as a secondary measure of overall predictive performance. Lower values indicate better predictive performance in terms of calibration and sharpness. The log-score is a strictly proper scoring rule, however, it is more sensitive to extreme predicted probabilities compared to the Brier score (Gneiting and Raftery,, 2007).
-
•
AUC. The AUC is the area under the receiver-operating-characteristic (ROC) curve (Steyerberg et al.,, 2019). It will be used as a measure of discrimination and values closer to one indicate better discriminative ability. Discrimination describes the ability of a prediction model to discriminate between cases and non-cases. Other discrimination measures, such as accuracy, sensitivity, specificity, etc., are not considered because we want to evaluate predictive performance in terms of probabilistic predictions instead of point predictions/classification.
-
•
Calibration slope . The calibration slope is obtained by regressing the test data outcomes on the models’ predicted logits , i.e.,
This measure will be used to assess calibration and deviations of from one indicate miscalibration (Steyerberg et al.,, 2019).
-
•
Calibration in the large . We inspect calibration in the large on independently generated test data, from the model
This measure will also be used to assess calibration and deviations of from zero indicate miscalibration (Steyerberg et al.,, 2019).
To facilitate comparison between simulation conditions, all estimands will also be corrected by the oracle version of the estimand, e.g., the Brier score will be computed from the ground truth parameters and the simulated data , subsequently the oracle Brier score will be subtracted from the estimated Brier score.
A.4 Methods
A.4.1 ainet
We now present the mock-method and give a superficial motivation why it could lead to improved predictive performance: Choosing the vector of penalization weights in the adaptive LASSO becomes difficult in high-dimensional settings. For instance, using absolute LASSO estimates as penalization weights omits the importance of several predictors by not selecting them, especially in the case of highly correlated predictors (Algamal and Lee,, 2015). The adaptive importance elastic net (ainet) circumvents this problem by employing a random forest to estimate the penalization weights via an a priori chosen variable importance measure. In this way, the importance of all variables enter the penalization weights simultaneously.
The penalized log-likelihood for ainet for a single observation is defined as
where
denotes the log-likelihood of a binomial GLM and is derived from a random forest variable importance measure as
where we transform to be non-negative via
and is a hyperparameter for the influence of the weights similar to hyperparameter of the adaptive elastic net. ainet is fitted by maximizing its penalized log-likelihood assuming i.i.d. observations , i.e.,
Per default, we choose mean decrease in the Gini coefficient for . Hyperparameters of the random forest are not tuned, but kept at their default values (e.g., mtry, ntree). The hyperparameter will stay constant for all simulations.
ainet is supposed to seem like a reasonable method at first glance. However, ainet cannot be expected to share desirable theoretical properties with the usual adaptive LASSO, such as oracle estimation (Zou,, 2006). This is because the penalization weights do not meet the required consistency assumption. Also in terms of prediction performance, ainet is not expected to outperform methods of comparable complexity.
A.4.2 Benchmark methods
-
•
Binary logistic regression (McCullagh and Nelder,, 2019) with and without ridge penalty for high- and low-dimensional settings, respectively. In case a ridge penalty is needed, it is tuned via 5-fold cross-validation by following the “one standard error” rule as implemented in glmnet (Friedman et al.,, 2010).
-
•
Elastic net (Zou and Hastie,, 2005), for which the penalized log-likelihood is given by
Here, and are tuned via 5-fold cross-validation by following the “one standard error” rule.
-
•
Adaptive elastic net (Zou,, 2006), with penalized loss function
Here, the penalty weights are inverse coefficient estimates from a binary logistic regression
where and are tuned via 5-fold cross-validation by following the “one standard error” rule. The hyperparameter will stay constant for all simulations. In case , we estimate the penalty weights using a ridge penalty, tuned via an additional nested 5-fold cross-validation by following the “one standard error” rule.
- •
A.5 Performance measures
The distribution of all estimands from Section A.3 will be assessed visually with box- and violin-plots that are stratified by method and simulation conditions. We will also compute mean, median, standard deviation, interquartile range, and 95% confidence intervals for each of the estimands. Moreover, instead of “eye-balling” differences in predictive performance across methods and conditions, we will formally assess them by regressing the estimands on the method and simulation conditions (cf. Skrondal,, 2000). To do so, we will use a fully interacted model with the interaction between the methods and the 128 simulations conditions, i.e., in R notation: estimand 0 + method:scenario. We will rank pairwise comparison between two methods within a single condition by their -values, to more easily identify conditions where methods show differences in predictive performance. The choice of a significance level at which a method is deemed superior will be determined based on preliminary simulations. We set this level to 5%, where -values will be adjusted using the single-step method (Hothorn et al.,, 2008) within a single simulation condition for comparisons between ainet and any other method.
A.6 Determining the number of simulations
We determine the number of simulation such that the Monte Carlo standard error of the primary estimand, the mean Brier score , is sufficiently small. The variance of is given by
and could be decomposed further (Bradley et al.,, 2008). However, the resulting expression is difficult to evaluate for our data-generating process as it depends on several of the simulation parameters. We therefore follow a similar approach as in Morris et al., (2019) and estimate from an initial small simulation run with 100 simulations per condtion to get an upper bound for worst-case variance across all simulation conditions. Therefore, the number of simulations is then given by
Since we decide that we require the Monte Carlo standard error of to be lower than four significant digits, .
The initial simulation run led to an estimated worst case variance of . Therefore, we compute that
replications are required to obtain Brier score estimates with the desired precision.
A.7 Handling exceptions
It is inevitable that convergence issues and other problems will arise in the simulation study. We will handle them as follows:
-
•
If a method fails to converge, the simulation will be excluded from the analysis. The failing simulations will not be replaced with new simulations that successfully converge as convergence may be impossible for some scenarios.
-
•
We will report the proportion of simulations with convergence issues for each method and discuss the potential reasons for their emergence.
-
•
In case of severe convergence issues or other problems (more than 10% of the simulations failing within a setting), we may adjust the simulation parameters post hoc. This will be indicated in the discussion of the results.
-
•
Convergence may be possible for certain tuning parameters of a method (e.g., cross-validation of LASSO may fail for some values while it could work for others). In this case we will choose a parameter value where the method still converges, as one would usually do with a real data set.
References
- Algamal and Lee, (2015) Algamal, Z. Y. and Lee, M. H. (2015). Penalized logistic regression with the adaptive LASSO for gene selection in high-dimensional cancer classification. Expert Systems with Applications, 42(23):9326–9332. doi:10.1016/J.ESWA.2015.08.016.
- Altman et al., (2017) Altman, D. G., Moher, D., and Schulz, K. F. (2017). Harms of outcome switching in reports of randomised trials: CONSORT perspective. BMJ, 356:j396. doi:10.1136/bmj.j396.
- Altman et al., (2008) Altman, D. G., Simera, I., Hoey, J., Moher, D., and Schulz, K. (2008). EQUATOR: Reporting guidelines for health research. The Lancet, 371(9619):1149–1150. doi:10.1016/s0140-6736(08)60505-x.
- Angelis et al., (2004) Angelis, C. D., Drazen, J. M., Frizelle, F. A., Haug, C., Hoey, J., Horton, R., Kotzin, S., Laine, C., Marusic, A., Overbeke, A. J. P., Schroeder, T. V., Sox, H. C., and Weyden, M. B. V. D. (2004). Clinical trial registration: A statement from the international committee of medical journal editors. New England Journal of Medicine, 351(12):1250–1251. doi:10.1056/nejme048225.
- Boulesteix et al., (2017) Boulesteix, A.-L., Binder, H., Abrahamowicz, M., and Sauerbrei, W. (2017). On the necessity and design of studies comparing statistical methods. Biometrical Journal, 60(1):216–218. doi:10.1002/bimj.201700129.
- Boulesteix et al., (2020) Boulesteix, A.-L., Groenwold, R. H., Abrahamowicz, M., Binder, H., Briel, M., Hornung, R., Morris, T. P., Rahnenführer, J., and Sauerbrei, W. (2020). Introduction to statistical simulations in health research. BMJ Open, 10(12):e039921. doi:10.1136/bmjopen-2020-039921.
- Boulesteix et al., (2013) Boulesteix, A.-L., Lauer, S., and Eugster, M. J. A. (2013). A plea for neutral comparison studies in computational sciences. PLOS ONE, 8(4):e61562. doi:10.1371/journal.pone.0061562.
- Boulesteix et al., (2015) Boulesteix, A.-L., Stierle, V., and Hapfelmeier, A. (2015). Publication bias in methodological computational research. Cancer Informatics, 14s5:CIN.S30747. doi:10.4137/cin.s30747.
- Bradley et al., (2008) Bradley, A. A., Schwartz, S. S., and Hashino, T. (2008). Sampling uncertainty and confidence intervals for the Brier score and Brier skill score. Weather and Forecasting, 23(5):992–1006. doi:10.1175/2007waf2007049.1.
- Breiman, (2001) Breiman, L. (2001). Random Forests. Machine Learning, 45(1):5–32. doi:10.1023/a:1010933404324.
- Burton et al., (2006) Burton, A., Altman, D. G., Royston, P., and Holder, R. L. (2006). The design of simulation studies in medical statistics. Statistics in Medicine, 25(24):4279–4292. doi:10.1002/sim.2673.
- Chalmers and Adkins, (2020) Chalmers, R. P. and Adkins, M. C. (2020). Writing effective and reliable Monte Carlo simulations with the SimDesign package. The Quantitative Methods for Psychology, 16(4):248–280. doi:10.20982/tqmp.16.4.p248.
- Chipman and Bingham, (2022) Chipman, H. and Bingham, D. (2022). Let’s practice what we preach: Planning and interpreting simulation studies with design and analysis of experiments. Canadian Journal of Statistics, 50(4):1228–1249. doi:10.1002/cjs.11719.
- Damen et al., (2016) Damen, J. A. A. G., Hooft, L., Schuit, E., Debray, T. P. A., Collins, G. S., Tzoulaki, I., Lassale, C. M., Siontis, G. C. M., Chiocchia, V., Roberts, C., Schlüssel, M. M., Gerry, S., Black, J. A., Heus, P., van der Schouw, Y. T., Peelen, L. M., and Moons, K. G. M. (2016). Prediction models for cardiovascular disease risk in the general population: Systematic review. BMJ, 353:i2416. doi:10.1136/bmj.i2416.
- Dutilh et al., (2021) Dutilh, G., Sarafoglou, A., and Wagenmakers, E.-J. (2021). Flexible yet fair: Blinding analyses in experimental psychology. Synthese, 198(Suppl 23):5745–5772. doi:10.1007/s11229-019-02456-7.
- Elofsson et al., (2019) Elofsson, A., Hess, B., Lindahl, E., Onufriev, A., van der Spoel, D., and Wallqvist, A. (2019). Ten simple rules on how to create open access and reproducible molecular simulations of biological systems. PLOS Computational Biology, 15(1):e1006649. doi:10.1371/journal.pcbi.1006649.
- Friedman et al., (2010) Friedman, J., Hastie, T., and Tibshirani, R. (2010). Regularization Paths for Generalized Linear Models via Coordinate Descent. Journal of Statistical Software, 33(1):1–22. doi:10.18637/jss.v033.i01.
- Gasparini, (2018) Gasparini, A. (2018). rsimsum: Summarise results from Monte Carlo simulation studies. Journal of Open Source Software, 3(26):739. doi:10.21105/joss.00739.
- Gasparini et al., (2021) Gasparini, A., Morris, T. P., and Crowther, M. J. (2021). INTEREST: INteractive tool for exploring REsults from simulation sTudies. Journal of Data Science, Statistics, and Visualisation, 1(4). doi:10.52933/jdssv.v1i4.9.
- Gelman and Tuerlinckx, (2000) Gelman, A. and Tuerlinckx, F. (2000). Type S error rates for classical and Bayesian single and multiple comparison procedures. Computational Statistics, 15(3):373–390. doi:10.1007/s001800000040.
- Gneiting, (2008) Gneiting, T. (2008). Editorial: Probabilistic forecasting. Journal of the Royal Statistical Society: Series A (Statistics in Society), 171(2):319–321. doi:10.1111/j.1467-985x.2007.00522.x.
- Gneiting and Raftery, (2007) Gneiting, T. and Raftery, A. E. (2007). Strictly proper scoring rules, prediction, and estimation. Journal of the American Statistical Association, 102(477):359–378. doi:10.1198/016214506000001437.
- Heinze et al., (2023) Heinze, G., Boulesteix, A.-L., Kammer, M., Morris, T. P., and and, I. R. W. (2023). Phases of methodological research in biostatistics–building the evidence base for new methods. Biometrical Journal, page 2200222. doi:10.1002/bimj.202200222.
- Hoaglin and Andrews, (1975) Hoaglin, D. C. and Andrews, D. F. (1975). The reporting of computation-based results in statistics. The American Statistician, 29(3):122–126. doi:10.1080/00031305.1975.10477393.
- Hoffmann et al., (2021) Hoffmann, S., Schönbrodt, F., Elsas, R., Wilson, R., Strasser, U., and Boulesteix, A.-L. (2021). The multiplicity of analysis strategies jeopardizes replicability: Lessons learned across disciplines. Royal Society Open Science, 8(4). doi:10.1098/rsos.201925.
- Holford et al., (2000) Holford, N. H. G., Kimko, H. C., Monteleone, J. P. R., and Peck, C. C. (2000). Simulation of clinical trials. Annual Review of Pharmacology and Toxicology, 40(1):209–234. doi:10.1146/annurev.pharmtox.40.1.209.
- Hothorn et al., (2008) Hothorn, T., Bretz, F., and Westfall, P. (2008). Simultaneous inference in general parametric models. Biometrical Journal, 50(3):346–363. doi:10.1002/bimj.200810425.
- Jelizarow et al., (2010) Jelizarow, M., Guillemot, V., Tenenhaus, A., Strimmer, K., and Boulesteix, A.-L. (2010). Over-optimism in bioinformatics: An illustration. Bioinformatics, 26(16):1990–1998. doi:10.1093/bioinformatics/btq323.
- Kidwell et al., (2016) Kidwell, M. C., Lazarević, L. B., Baranski, E., Hardwicke, T. E., Piechowski, S., Falkenberg, L.-S., Kennett, C., Slowik, A., Sonnleitner, C., Hess-Holden, C., Errington, T. M., Fiedler, S., and Nosek, B. A. (2016). Badges to acknowledge open practices: A simple, low-cost, effective method for increasing transparency. PLOS Biology, 14(5):e1002456. doi:10.1371/journal.pbio.1002456.
- Kipruto and Sauerbrei, (2022) Kipruto, E. and Sauerbrei, W. (2022). Comparison of variable selection procedures and investigation of the role of shrinkage in linear regression-protocol of a simulation study in low-dimensional data. PLOS ONE, 17(10):e0271240. doi:10.1371/journal.pone.0271240.
- Klein and Roodman, (2005) Klein, J. R. and Roodman, A. (2005). Blind analysis in nuclear and particle physics. Annual Review of Nuclear and Particle Science, 55(1):141–163. doi:10.1146/annurev.nucl.55.090704.151521.
- Kreutz et al., (2020) Kreutz, C., Can, N. S., Bruening, R. S., Meyberg, R., Mérai, Z., Fernandez-Pozo, N., and Rensing, S. A. (2020). A blind and independent benchmark study for detecting differentially methylated regions in plants. Bioinformatics, 36(11):3314–3321. doi:10.1093/bioinformatics/btaa191.
- Kreuzberger et al., (2020) Kreuzberger, N., Damen, J., Trivella, M., Estcourt, L. J., Aldin, A., Umlauff, L., Vazquez-Montes, M., Wolff, R., Moons, K., Monsef, I., Foroutan, F., Kreuzer, K., and Skoetz, N. (2020). Prognostic models for newly-diagnosed chronic lymphocytic leukaemia in adults: A systematic review and meta-analysis. Cochrane Database of Systematic Reviews, 7:CD012022. doi:10.1002/14651858.CD012022.pub2.
- Lawlor, (2007) Lawlor, D. A. (2007). Quality in epidemiological research: Should we be submitting papers before we have the results and submitting more hypothesis-generating research? International Journal of Epidemiology, 36(5):940–943. doi:10.1093/ije/dym168.
- Loder et al., (2010) Loder, E., Groves, T., and MacAuley, D. (2010). Registration of observational studies. BMJ, 340:c950. doi:10.1136/bmj.c950.
- McCullagh and Nelder, (2019) McCullagh, P. and Nelder, J. A. (2019). Generalized Linear Models. Routledge.
- Monks et al., (2018) Monks, T., Currie, C. S. M., Onggo, B. S., Robinson, S., Kunc, M., and Taylor, S. J. E. (2018). Strengthening the reporting of empirical simulation studies: Introducing the STRESS guidelines. Journal of Simulation, 13(1):55–67. doi:10.1080/17477778.2018.1442155.
- Morris et al., (2019) Morris, T. P., White, I. R., and Crowther, M. J. (2019). Using simulation studies to evaluate statistical methods. Statistics in Medicine, 38(11):2074–2102. doi:10.1002/sim.8086.
- Nießl et al., (2022) Nießl, C., Herrmann, M., Wiedemann, C., Casalicchio, G., and Boulesteix, A.-L. (2022). Over-optimism in benchmark studies and the multiplicity of design and analysis options when interpreting their results. WIREs Data Mining and Knowledge Discovery, 12(2):e1441. doi:10.1002/widm.1441.
- Nosek et al., (2018) Nosek, B. A., Ebersole, C. R., DeHaven, A. C., and Mellor, D. T. (2018). The preregistration revolution. Proceedings of the National Academy of Sciences, 115(11):2600–2606. doi:10.1073/pnas.1708274114.
- O'Kelly et al., (2016) O'Kelly, M., Anisimov, V., Campbell, C., and Hamilton, S. (2016). Proposed best practice for projects that involve modelling and simulation. Pharmaceutical Statistics, 16(2):107–113. doi:10.1002/pst.1789.
- R Core Team, (2020) R Core Team (2020). R: A Language and Environment for Statistical Computing. R Foundation for Statistical Computing, Vienna, Austria. URL https://www.R-project.org/.
- Riley et al., (2018) Riley, R. D., Snell, K. I., Ensor, J., Burke, D. L., Jr, F. E. H., Moons, K. G., and Collins, G. S. (2018). Minimum sample size for developing a multivariable prediction model: PART II – binary and time-to-event outcomes. Statistics in Medicine, 38(7):1276–1296. doi:10.1002/sim.7992.
- Robertson et al., (2023) Robertson, D. S., Choodari-Oskooei, B., Dimairo, M., Flight, L., Pallmann, P., and Jaki, T. (2023). Point estimation for adaptive trial designs I: A methodological review. Statistics in Medicine, 42(2):122–145. doi:10.1002/sim.9605.
- Robin et al., (2011) Robin, X., Turck, N., Hainard, A., Tiberti, N., Lisacek, F., Sanchez, J.-C., and Müller, M. (2011). pROC: An open-source package for R and S+ to analyze and compare ROC curves. BMC Bioinformatics, 12:77. doi:10.1186/1471-2105-12-77.
- Schmid and Griffith, (2005) Schmid, C. H. and Griffith, J. L. (2005). Multivariate classification rules: Calibration and discrimination. In Armitage, P. and Colton, T., editors, Encyclopedia of Biostatistics, volume 5, pages 3491–3497. Wiley, 2nd edition.
- Schwab and Held, (2021) Schwab, S. and Held, L. (2021). Statistical programming: Small mistakes, big impacts. Significance, 18(3):6–7. doi:10.1111/1740-9713.01522.
- Seker et al., (2020) Seker, B. O., Reeve, K., Havla, J., Burns, J., Gosteli, M., Lutterotti, A., Schippling, S., Mansmann, U., and Held, U. (2020). Prognostic models for predicting clinical disease progression, worsening and activity in people with multiple sclerosis. Cochrane Database of Systematic Reviews, (5). doi:10.1002/14651858.CD013606.
- Simmons et al., (2011) Simmons, J. P., Nelson, L. D., and Simonsohn, U. (2011). False-positive psychology: Undisclosed flexibility in data collection and analysis allows presenting anything as significant. Psychological Science, 22(11):1359–1366. doi:10.1177/0956797611417632.
- Simon et al., (2011) Simon, N., Friedman, J., Hastie, T., and Tibshirani, R. (2011). Regularization Paths for Cox’s Proportional Hazards Model via Coordinate Descent. Journal of Statistical Software, 39(5):1–13. doi:10.18637/jss.v039.i05.
- Skrondal, (2000) Skrondal, A. (2000). Design and analysis of Monte Carlo experiments: Attacking the conventional wisdom. Multivariate Behavioral Research, 35(2):137–167. doi:10.1207/s15327906mbr3502_1.
- Smith and Marshall, (2010) Smith, M. K. and Marshall, A. (2010). Importance of protocols for simulation studies in clinical drug development. Statistical Methods in Medical Research, 20(6):613–622. doi:10.1177/0962280210378949.
- Steyerberg et al., (2019) Steyerberg, E. W. et al. (2019). Clinical Prediction Models. Springer.
- Strobl and Leisch, (2022) Strobl, C. and Leisch, F. (2022). Against the “one method fits all data sets” philosophy for comparison studies in methodological research. Biometrical Journal, 00:1–8. doi:10.1002/bimj.202200104.
- Tukey, (1980) Tukey, J. W. (1980). We need both exploratory and confirmatory. The American Statistician, 34(1):23–25. doi:10.1080/00031305.1980.10482706.
- Ullmann et al., (2022) Ullmann, T., Beer, A., Hünemörder, M., Seidl, T., and Boulesteix, A.-L. (2022). Over-optimistic evaluation and reporting of novel cluster algorithms: An illustrative study. Advances in Data Analysis and Classification. doi:10.1007/s11634-022-00496-5.
- Van der Bles et al., (2019) Van der Bles, A. M., Van Der Linden, S., Freeman, A. L., Mitchell, J., Galvao, A. B., Zaval, L., and Spiegelhalter, D. J. (2019). Communicating uncertainty about facts, numbers and science. Royal Society Open Science, 6(5):181870. doi:10.1098/rsos.181870.
- van Smeden et al., (2016) van Smeden, M., de Groot, J. A. H., Moons, K. G. M., Collins, G. S., Altman, D. G., Eijkemans, M. J. C., and Reitsma, J. B. (2016). No rationale for 1 variable per 10 events criterion for binary logistic regression analysis. BMC Medical Research Methodology, 16:163. doi:10.1186/s12874-016-0267-3.
- van Smeden et al., (2018) van Smeden, M., Moons, K. G., de Groot, J. A., Collins, G. S., Altman, D. G., Eijkemans, M. J., and Reitsma, J. B. (2018). Sample size for binary logistic prediction models: Beyond events per variable criteria. Statistical Methods in Medical Research, 28(8):2455–2474. doi:10.1177/0962280218784726.
- van Zwet and Cator, (2021) van Zwet, E. W. and Cator, E. A. (2021). The significance filter, the winner’s curse and the need to shrink. Statistica Neerlandica, 75(4):437–452. doi:10.1111/stan.12241.
- Vidaurre et al., (2013) Vidaurre, D., Bielza, C., and Larrañaga, P. (2013). A survey of regression. International Statistical Review, 81(3):361–387. doi:10.1111/insr.12023.
- White, (2010) White, I. R. (2010). Simsum: Analyses of simulation studies including monte carlo error. The Stata Journal: Promoting communications on statistics and Stata, 10(3):369–385. doi:10.1177/1536867x1001000305.
- Wicherts et al., (2016) Wicherts, J. M., Veldkamp, C. L. S., Augusteijn, H. E. M., Bakker, M., van Aert, R. C. M., and van Assen, M. A. L. M. (2016). Degrees of freedom in planning, running, analyzing, and reporting psychological studies: A checklist to avoid -hacking. Frontiers in Psychology, 7:1832. doi:10.3389/fpsyg.2016.01832.
- Wright and Ziegler, (2017) Wright, M. N. and Ziegler, A. (2017). ranger: A fast implementation of random forests for high dimensional data in C++ and R. Journal of Statistical Software, 77(1):1–17. doi:10.18637/jss.v077.i01.
- Wynants et al., (2020) Wynants, L., Calster, B. V., Collins, G. S., Riley, R. D., Heinze, G., Schuit, E., Bonten, M. M. J., Dahly, D. L., Damen, J. A., Debray, T. P. A., de Jong, V. M. T., Vos, M. D., Dhiman, P., Haller, M. C., Harhay, M. O., Henckaerts, L., Heus, P., Kammer, M., et al. (2020). Prediction models for diagnosis and prognosis of covid-19: Systematic review and critical appraisal. BMJ, 369:m1328. doi:10.1136/bmj.m1328.
- Yousefi et al., (2009) Yousefi, M. R., Hua, J., Sima, C., and Dougherty, E. R. (2009). Reporting bias when using real data sets to analyze classification performance. Bioinformatics, 26(1):68–76. doi:10.1093/bioinformatics/btp605.
- Zou, (2006) Zou, H. (2006). The adaptive lasso and its oracle properties. Journal of the American Statistical Association, 101(476):1418–1429. doi:10.1198/016214506000000735.
- Zou and Hastie, (2005) Zou, H. and Hastie, T. (2005). Regularization and variable selection via the elastic net. Journal of the Royal Statistical Society: Series B (Statistical Methodology), 67(2):301–320. doi:10.1111/j.1467-9868.2005.00503.x.
See pages 1-3 of manuscriptSup.pdf See pages 4-9 of manuscriptSup.pdf