Nobeyama Survey of Inward Motions toward Cores in Orion Identified by SCUBA-2
Abstract
In this study, 36 cores (30 starless and 6 protostellar) identified in Orion were surveyed to search for inward motions. We used the Nobeyama 45 m radio telescope, and mapped the cores in the transitions of HCO+, H13CO+, N2H+, HNC, and HN13C. The asymmetry parameter , which was the ratio of the difference between the HCO+ and H13CO+ peak velocities to the H13CO+ line width, was biased toward negative values, suggesting that inward motions were more dominant than outward motions. Three starless cores (10% of all starless cores surveyed) were identified as cores with blue-skewed line profiles (asymmetric profiles with more intense blue-shifted emission), and another two starless cores (7%) were identified as candidate blue-skewed line profiles. The peak velocity difference between HCO+ and H13CO+ of them was up to 0.9 km s-1, suggesting that some inward motions exceeded the speed of sound for the quiescent gas ( K). The mean of of the five aforementioned starless cores was derived to be 0.50.3. One core, G211.1619.33North3, observed using the ALMA ACA in DCO+ exhibited blue-skewed features. Velocity offset in the blue-skewed line profile with a dip in the DCO+ line was larger ( km s-1) than that in HCO+ ( km s-1), which may represent gravitational acceleration of inward motions. It seems that this core is at the last stage in the starless phase, judging from the chemical evolution factor version 2.0 (CEF2.0).
1 INTRODUCTION
The formation of stars has been a topic of considerable research attention. It has been suggested that denser cores have shorter lifetimes in units of free-fall time; the lifetime of a core with an H2 density of 104 cm-3 is approximately 106 yr, which is longer than the free-fall time ( yr), whereas that of a core with an H2 density of 106 cm-3 seems close to the free-fall time ( yr) (Jessop & Ward-Thompson, 2000; André et al., 2014; Könyves et al., 2015; Tokuda et al., 2020). Here, the lifetime is estimated from the fraction of cores that contain protostars or young stellar objects (YSOs). Starless cores with an H2 density of 104-5 cm-3 do not appear to be collapsing dynamically, and may exhibit dynamically stable equilibrium states. If such stable cores finally form stars, a mechanism may arise to make them unstable. Mass inflow into cores is one such mechanism (Gómez et al., 2007). Hence, it is a matter of interest to determine when starless cores initiate inward motions. For terminology, we adopt that of Padoan et al. (2020), i.e., inward motions on scales of 110 pc (filaments to cores), 0.010.1 pc (inside cores), and 1001000 au (disks to stars) are called inflow, infall, and accretion, respectively. Infall within the core may form a protostar or protostars. B335 and L1544 provided the first observational examples of infall in the protostellar and starless phases, respectively (Zhou et al., 1993; Tafalla et al., 1998). Time evolution of infall motions in isothermal spheres differs with different initial radial density distributions (Larson, 1969; Shu, 1977; Hunter, 1977; Zhou, 1992; Foster & Chevalier, 1993). For example, Tatematsu et al. (2021) suggested that the SCUBA-2 core in Orion studied by Yi et al. (2018) had radial density profiles with a power-lar index considerably shallower than 2. Our aim was to detect inward motions of either inflow into cores or infall in cores by investigating kinematics on scales of 0.1 pc, mainly for starless cores.
This required the estimation of the evolutionary stage of a core. Tatematsu et al. (2017) and Kim et al. (2020) developed a chemical evolution factor (CEF), a measure of the evolution of the starless core based on the logarithmic deuterium fraction of N2D+ and DNC. It is known that the deuterium fractions of molecules formed in the gas phase (e.g., DNC/HNC and N2D+/N2H+) increase monotonically with core evolution during the starless core phase (Crapsi et al., 2005; Hirota & Yamamoto, 2006; Emprechtinger et al., 2009; Feng et al., 2019).
Another tracer for starless core evolution is the distribution of density. The ACA (Atacama Compact Array; a.k.a. the Morita Array) of the ALMA (Atacama Large Millimeter/submillimeter Array) is sensitive to the gas concentration near the core center. Tokuda et al. (2020) used detectability in the dust continuum emission using the ALMA ACA; detection of strong continuum with a 65 (980 au at 150 pc distance) suggested the existence of structures with densities of cm-3, and is considered to represent later stages in the starless core phase. Sahu et al. (2021) reported the detection of five centrally concentrated dense structures with sizes of 2000 au using the ALMA 12 m Array (300 au resolution), which most likely represent the last stages of starless cores. Inflow of matter into cores along and/or across filaments was also studied (Hacar & Tafalla, 2011; Friesen et al., 2013; Palmeirim et al., 2013; Lu et al., 2018; Chen et al., 2020; Sanhueza et al., 2021).
There have been surveys in various star-forming regions for inward motions, which include Wang et al. (1995), Mardones et al. (1997), Lee et al. (1999), Gregersen et al. (2000a), Gregersen et al. (2000b), Fuller et al. (2005), Velusamy et al. (2008), Reiter et al. (2011), Contreras et al. (2018), Jackson et al. (2019), and Yi et al. (2021). A popular method is to search for a blue-skewed line profile with a dip in optically thick lines, such as HCO+. Blue-skewed profiles are asymmetric profiles with more intense blue-shifted emission in an optically thicker line with respect to those in an optically thinner line. Gregersen et al. (2000a), who conducted an inward-motion survey toward Class 0 and Class I protostars using HCO+ , concluded that it was difficult to make unambiguous claims regarding infall, because that infall velocities were roughly the same speed or less than turbulent and outflow motions, and also because the beam size was not high enough to separate outflow from infall. Clear cases of the signature of infall in terms of redshifted absorption include observations using the ALMA by Evans et al. (2015), Yang et al. (2020), and Olguin et al. (2021). There is a need to investigate whether the observed profiles truly represent inward motions from various aspects. Contrarily, it is true that a gas with inward motions may not disclose its signature in the observations due to limitation of sensitivity and so on.
We selected cores in the Orion molecular clouds that have been previously observed using the ALMA in the ALMA Survey of Orion Planck Galactic Cold Clumps (ALMASOP) collaboration (Dutta et al., 2020) and/or using the Nobeyama 45 m telescope (Kim et al., 2020; Tatematsu et al., 2021). These cores were originally taken from the catalog of cores identified by the Submillimetre Common-User Bolometer Array 2 (SCUBA-2) inside Planck Galactic cold clumps (PGCCs) in Orion (Yi et al., 2018). All the SCUBA-2 cores identified in PGCCs in the SCOPE (SCUBA-2 Continuum Observations of Pre-protostellar Evolution) collaboration (Liu et al., 2015, 2018) were cataloged by Eden et al. (2019). Temperatures of PGCCs run from 10 to 17 K. Please refer to Planck Collaboration et al. (2011) and Planck Collaboration et al. (2016) for PGCCs. SCUBA-2 cores in Orion have similar distances (42040 pc, Kounkel et al., 2017; Getman et al., 2019) such that we can avoid distance-dependent effects, e.g., different beam dilutions (Kim et al., 2020). We mainly selected 30 starless cores at the Nobeyama resolution. In addition, we also included six protostellar cores at the Nobeyama resolution which were found to be starless cores at the ALMA ACA resolution (these are treated as protostellar cores in this paper). Prior to our study, Velusamy et al. (2008) surveyed inward motions toward starless cores in Orion; however, in reality, the samples did not show overlapping except for one core. They surveyed two sub-regions in the Ori A cloud, whereas we selected the cores in wider Orion areas containing the Ori region, Ori A cloud, and Ori B cloud. We selected cores in PGCCs, which are known to have low temperatures, suggesting earlier core evolutionary stages, whereas Velusamy et al. (2008) did not use such a selection. In addition, at the time the aforementioned study was conducted, information on YSOs was limited. Presently, more sensitive YSO information, such as Furlan et al. (2016) is available. For example, HOPS-10, -11, -12, -87, -88, -89, -91, -92, -178, -182, and -380 are associated with cores that were regarded as starless by Velusamy et al. (2008). We found that 52% of their starless cores are actually associated with YSOs, and 59% are associated with YSOs or YSO candidates. If we exclude YSOs and YSO candidates, eleven out of their 27 starless cores (41%) are still starless on the basis of the current YSO information. Then, overlapping is actually small. Using the KVN (Korean VLBI Network) 21 m telescope (30 beam), Yi et al. (2021) surveyed inward motions in HCO+ ( = 10) toward 80 cores (45 starless and 35 protostellar) out of the 119 SCUBA-2 cores in Orion (Yi et al., 2018). The current observations demonstrate 1.8 times better spatial resolution. Observations by Yi et al. (2021) were made in single pointing toward SCUBA-2 cores, whereas this study mapped cores. We will examine their work later in this paper.
2 OBSERVATIONS
We carried out mapping observations of 33 fields containing 36 SCUBA-2 cores using the 45 m radio telescope of the Nobeyama Radio Observatory111Nobeyama Radio Observatory is a branch of the National Astronomical Observatory of Japan, National Institutes of Natural Sciences (program ID = CG201001; PI = Gwanjeong Kim). Table 1 summarizes the numbers of clumps and cores in the related studies. The observed lines and their rest frequencies are listed in Table 2. The critical and effective densities are adopted from Shirley et al. (2015). Observations were conducted from 2020 December to 2021 February. For the receiver frontend, the “FOREST” (FOur-beam REceiver System on the 45 m Telescope, Minamidani et al., 2016) was employed for simultaneous observations of up to four lines. HCO+, H13CO+, HNC, and HN13C were observed simultaneously. The half-power beam width (HPBW) and main-beam efficiency at 86 GHz were 183 (0.037 pc at 420 pc distance) and 50.4% 3.2%, respectively. For the receiver backend, the “SAM45” (Spectral Analysis Machine for the 45 m telescope, Kamazaki et al., 2012) was employed with a spectral resolution of 30.52 kHz, which corresponds to 0.1 km s-1 at 82 GHz. Table 2 provides the precise values of the velocity resolution.
On-the-fly (OTF) mapping observations (Sawada et al., 2008) of 33 fields, were performed in the R.A. and decl. directions in most cases to minimize striping effects. However, 30% of the OTF observations were made only in one direction. The map size was 3′ 3′. Three neighboring cores (cores 6, 12, and 21) were mapped simultaneously with cores 5, 11, and 20, respectively. The JCMT SCUBA-2 core names and their coordinates were taken from Yi et al. (2018); they are summarized in Table 3. The association with YSOs was obtained from Kim et al. (2020), who made observations using the Nobeyama 45 m telescope. 30 cores out of the 36 observed cores were found to be starless, whereas the remaining six cores were protostellar cores. However, identification of either starless or protostellar cores depends on observational spatial resolutions. These six protostellar cores were classified as starless with offset YSOs by Dutta et al. (2020) using the ALMA ACA at a spatial resolution of . For the current study, we adopted classification by Kim et al. (2020), who used the same telescope. The position switching mode was employed, and the reference positions were (R.A., decl.) = , and from the reference center of the map, for cores 112, 1316, 1718, and 1936, respectively. It took approximately 3 h to achieve an rms noise level of 0.1 K for a 3′ 3′ map. The typical system temperature was 200 K. The telescope pointing calibration was performed at 1.01.5 h intervals toward the SiO maser source, Orion KL, which resulted in a pointing accuracy of 5.
Linear baselines were subtracted from the spectral data, and the data were stacked on a grid of 6 with the BesselGauss function in the NOSTAR program of the Nobeyama Radio Observatory (Sawada et al., 2008). The R.A. and decl. scan data were basket-weaved using the method proposed by Emerson & Graeve (1988). The line intensity was expressed in terms of the antenna temperature corrected for atmospheric extinction using standard chopper wheel calibration.
We also used the N2H+ data from our previous observations reported in Tatematsu et al. (2021) in this analysis to avoid redundant N2H+ observations. In addition, we adopted the SCUBA-2 core properties such as the HWHM (half-width-at-half-maximum) radius, mass, and density from Yi et al. (2018) (Table 3). We converted the FWHM (full-width-at-half-maximum) diameter of Yi et al. (2018) to HWHM radius by dividing by two. Yi et al. (2018) adopted distances of 380 pc and 420 pc for the Ori region and the Ori A and B regions taken from Perryman et al. (1997) and a combination of Jeffries (2007) and Sandstrom et al. (2007), respectively; we adopted their physical parameters based on these assumed distances.
| Category | Clump Number | Core Number | Reference |
|---|---|---|---|
| PGCC | 13188 | . . . | Planck Collaboration et al. (2016) |
| SCUBA-2 core in PGCC (SCOPE) | 558 | 3528 | Eden et al. (2019) |
| SCUBA-2 core in Orion | 40 | 119 | Yi et al. (2018) |
| SCUBA-2 core in Orion studied here | . . . | 36 | This work |
| Line | Frequency | Frequency Reference | Velocity Resolution | Upper Energy Level | Critical Density at 10 K | Effective Density at 10 K |
|---|---|---|---|---|---|---|
| GHz | km s-1 | K | cm-3 | cm-3 | ||
| HCO+ = 10 | 89.1885230 | Pickett et al. (1998) | 0.103 | 4.3 | 6.8 | 9.5 |
| H13CO+ = 10 | 86.7542884 | Pickett et al. (1998) | 0.105 | 4.2 | 6.2 | 3.9 |
| HNC = 10 | 90.6635930 | Pickett et al. (1998) | 0.101 | 4.4 | 1.4 | 1.0 |
| HN13C = 10 | 87.0908500 | Pickett et al. (1998) | 0.105 | 4.2 | . . . | . . . |
| N2H+ = 10 | 93.1737767 | Caselli et al. (1995) | 0.098 | 4.5 | 6.1 | 6.8 |
| Core Number | JCMT Core Name | R.A. (J2000) | Decl. (J2000) | YSO Ass. | ALMA Source Name | |||
|---|---|---|---|---|---|---|---|---|
| h m s | pc | 105 cm-3 | ||||||
| 1 | G191.9011.21North | 5 31 28.99 | 12 58 55.0 | starless | G191.9011.21N | 0.050 | 0.34 0.07 | 0.8 0.2 |
| 2 | G198.6909.12North1 | 5 52 29.61 | 8 15 37.0 | starless | G198.6909.12N1 | 0.045 | 0.43 0.07 | 2.0 0.4 |
| 3 | G198.6909.12North2 | 5 52 25.30 | 8 15 8.8 | starless | G198.6909.12N2 | 0.030 | 0.21 0.02 | 2.1 0.4 |
| 4 | G201.7211.22 | 5 50 54.53 | 4 37 42.6 | starless | . . . | 1.125 | 1.83 0.21 | 1.3 0.4 |
| 5 | G203.2111.20East2 | 5 53 47.90 | 3 23 8.9 | starless | G203.2111.20E2 | 0.060 | 2.65 1.73 | 10.3 0.7 |
| 6 | G203.2111.20East1 | 5 53 51.11 | 3 23 4.9 | starless | G203.2111.20E1 | 0.060 | 2.50 0.43 | 9.8 0.6 |
| 7 | G205.4614.56North1 | 5 46 5.49 | 0 9 32.4 | starless | G205.4614.56M3 | 0.015 | 0.39 0.06 | 17.0 1.9 |
| 8 | G206.2116.17North | 5 41 39.28 | -1 35 52.9 | starless | G206.2116.17N | 0.105 | 4.97 0.05 | 4.7 0.8 |
| 9 | G206.2116.17South | 5 41 34.23 | -1 37 28.8 | starless | G206.2116.17S | 0.055 | 1.05 0.46 | 3.6 0.8 |
| 10 | G206.9316.61East1 | 5 41 40.54 | -2 17 4.3 | starless | G206.9316.61E1 | 0.060 | 5.37 0.54 | 17.1 2.9 |
| 11 | G206.9316.61West4 | 5 41 25.84 | -2 19 28.4 | starless | . . . | 0.040 | 1.25 0.67 | 9.0 0.2 |
| 12 | G206.9316.61West5 | 5 41 28.77 | -2 20 4.3 | starless | G206.9316.61W4 | 0.055 | 7.10 0.72 | 23.5 1.6 |
| 13 | G207.3619.82North2 | 5 30 50.67 | -4 10 15.6 | protostellar | G207.3619.82N2 | 0.020 | 0.44 0.14 | 4.9 0.9 |
| 14 | G207.3619.82North4 | 5 30 44.81 | -4 10 27.6 | starless | G207.3619.82N4 | 0.015 | 0.15 0.05 | 4.2 0.8 |
| 15 | G207.3619.82South | 5 30 46.81 | -4 12 29.4 | starless | G207.3619.82S | 0.095 | 2.01 0.91 | 1.1 0.2 |
| 16 | G208.6819.20North2 | 5 35 20.45 | -5 0 53.0 | protostellar | G208.6819.20N2 | 0.025 | 2.22 1.15 | 18.9 3.6 |
| 17 | G209.0519.73North | 5 34 3.96 | -5 32 42.5 | starless | . . . | 0.115 | 2.83 0.15 | 0.9 0.6 |
| 18 | G209.0519.73South | 5 34 3.12 | -5 34 11.0 | starless | . . . | 0.070 | 1.65 0.29 | 1.6 0.4 |
| 19 | G209.2919.65North1 | 5 35 0.25 | -5 40 2.4 | starless | G209.2919.65N1 | 0.035 | 0.70 0.10 | 2.4 0.8 |
| 20 | G209.2919.65South1 | 5 34 55.99 | -5 46 3.2 | starless | G209.2919.65S1 | 0.035 | 1.49 0.26 | 5.1 0.4 |
| 21 | G209.2919.65South2 | 5 34 53.81 | -5 46 12.8 | starless | G209.2919.65S2 | 0.040 | 2.31 0.97 | 6.2 0.5 |
| 22 | G209.5519.68North2 | 5 35 7.01 | -5 56 38.4 | starless | G209.5519.68N2 | 0.025 | 0.28 0.07 | 3.1 0.6 |
| 23 | G209.7719.40West | 5 36 21.19 | -6 1 32.7 | starless | G209.7719.40W | 0.045 | 0.50 0.07 | 1.7 0.2 |
| 24 | G209.7719.40East2 | 5 36 32.19 | -6 2 4.7 | starless | G209.7719.40E2 | 0.035 | 1.20 0.56 | 6.4 0.9 |
| 25 | G209.7719.40East3 | 5 36 35.94 | -6 2 44.7 | starless | G209.7719.40E3 | 0.020 | 0.26 0.12 | 5.4 0.7 |
| 26 | G209.9419.52North | 5 36 11.55 | -6 10 44.8 | protostellar | G209.9419.52N | 0.065 | 2.81 0.28 | 3.1 0.5 |
| 27 | G209.7919.80West | 5 35 11.19 | -6 14 0.7 | starless | G209.7919.80W | 0.135 | 7.06 2.56 | 4.4 0.4 |
| 28 | G209.9419.52South1 | 5 36 24.96 | -6 14 4.7 | starless | G209.9419.52S1 | 0.080 | 3.52 0.09 | 2.5 0.2 |
| 29 | G210.3719.53North | 5 36 55.03 | -6 34 33.2 | starless | G210.3719.53N | 0.030 | 0.28 0.02 | 1.1 0.2 |
| 30 | G210.8219.47North2 | 5 37 59.84 | -6 57 9.9 | starless | G210.8219.47N2 | 0.030 | 0.15 0.05 | 0.7 0.1 |
| 31 | G211.1619.33North5 | 5 38 46.00 | -7 10 41.9 | protostellar | G211.1619.33N5 | 0.060 | 0.64 0.18 | 1.2 0.2 |
| 32 | G211.1619.33North3 | 5 39 2.26 | -7 11 7.9 | starless | G211.1619.33N3 | 0.050 | 0.41 0.12 | 1.0 0.1 |
| 33 | G211.1619.33North4 | 5 38 55.67 | -7 11 25.9 | protostellar | G211.1619.33N4 | 0.065 | 0.51 0.04 | 0.7 0.1 |
| 34 | G211.7219.25South1 | 5 40 19.04 | -7 34 28.8 | starless | G211.7219.25S1 | 0.060 | 1.15 0.82 | 1.3 0.5 |
| 35 | G212.1019.15North1 | 5 41 21.56 | -7 52 27.7 | protostellar | G212.1019.15N1 | 0.090 | 3.52 1.68 | 3.1 0.4 |
| 36 | G215.4416.38 | 5 56 58.45 | -9 32 42.3 | starless | G215.4416.38 | 0.030 | 0.19 0.04 | 1.0 0.2 |
3 RESULTS
3.1 Infall Velocity and Asymmetry Parameter
We searched for observational evidence of inward motions. The double-peaked profile due to absorption by foreground lower excitation-temperature gas is called “self-reversal” (Loren, 1976; Blitz & Thaddeus, 1980). The “self-reversal” profile contains a dip (suppression) between two emission peaks. If the cloud or cloud core has systematic motions with respect to the core center such as inward or outward motions, the profile of an optically thick line will exhibit asymmetry in shape. The profile may also have an absorption dip. Identification of inward or outward motions needs careful investigation through a comparison of line profiles on the optically thick and thin lines and also through spatial distribution of the line profile shape across the sky. Later, we explained how we investigated these motions. Cases of infall were explained in detail by Zhou (1992) and Zhou et al. (1993). In such cases, we will see blue-skewed line profiles with dips, whose lower-velocity (blue) peaks are brighter than its higher-velocity (red) peaks. Starless cores are likely to have kinetic-temperature gradients decreasing inward toward the core center (Evans et al., 2001); however, if the radial density gradient decreasing outward is adequately steep, cores may have excitation-temperature gradients decreasing outward, which will cause self-reversal or blue-skewed line profiles with dips.
Table 4 summarizes the peak intensities and peak velocities (velocities of the peak intensities) of the molecular lines toward the SCUBA-2 core centers. The peak was determined from the spectrum without any fitting; thus, the nominal peak velocity accuracy is equal to the spectral resolution (0.1 km s-1). Differences between the line velocities facilitate identification of possible inward or outward motions. Table 5 summarizes velocity differences. The HCO+ line is often optically thick, based on a comparison with the H13CO+ emission in intensity and line shape, and is considered to represent gas motions in the line shape such as line profile asymmetry (Gregersen et al., 2000a, b; Fuller et al., 2005; Velusamy et al., 2008; Reiter et al., 2011; Jackson et al., 2019; Yi et al., 2021). The velocity difference between the HCO+ and H13CO+ peak velocities might reflect whether the gas may move inward or outward, if the sign of the velocity difference is negative or positive, respectively. Some cores may oscillate (Lada et al., 2003; Aguti et al., 2007), although the spatial resolution of the current observations with respect to the core size may be insufficient to identify it. As an independent measure, we also used velocity differences between HCO+ and N2H+ ( = 0, 11, 2) and between HNC and HN13C. The N2H+ ( = 0, 11, 2) and HN13C line emissions are optically thinner than the HCO+ and HNC line emissions, respectively. The N2H emission exhibits hyperfine splitting (Caselli et al., 1995), and we adopted the isolated hyperfine component ( = 0, 11, 2) to avoid overlapping with neighboring components. The absolute value of the velocity difference ranged up to 0.9 km s-1. Lee et al. (1999) concluded that inward motions in low-mass starless cores were subsonic, which is not consistent with our conclusion. Fuller et al. (2005) studied cores associated with candidate high-mass protostars and obtained large values of inward motions of 0.11 km s-1. Core properties including velocity differences may depend on the core radius and mass. We compared the radii and masses of these samples. The HWHM radius and mass of our Orion cores, which are located in an intermediate mass star-forming region, were 0.0151.125 pc (with a mean of 0.083 pc and a median of 0.050 pc) and 0.15 (with a mean of 1.8 and a median of 1.2 ), respectively. Mardones et al. (1997), Lee et al. (1999), and Gregersen et al. (2000b) studied cores in low-mass star-forming regions, and some of them were observed by Kirk et al. (2005) with the SCUBA-2. The HWHM radius and mass of these cores were found to be 0.0080.37 pc (with a mean of 0.020 pc and a median of 0.020 pc) and 0.201.6 (with a mean of 0.55 and a median of 0.35 ), respectively. Our Orion cores were larger and more massive than their dark cloud cores. The cores in high-mass star-forming regions that were studied by Fuller et al. (2005) were mostly distributed in a mass range of 0 with a distribution tail to an even higher mass, and thus, they were more massive than our Orion cores.
It is to be noted that we need to consider various aspects to determine whether spectra mean inward or outward motions. It is possible that all the observed velocity shifts may not represent the velocity field of a single core. The existence of multiple velocity components may affect the velocity difference. Table 6 lists the number of velocity components observed in H13CO and N2H+ ( = 0, 11, 2). Later, we investigated the molecular line spectra to determine the effects of multiple velocity components.
We adopted the asymmetry parameter (Mardones et al., 1997), which is the velocity difference between the optically thicker and thinner lines, normalized to the FWHM line width of the optically thinner line. Significant detection of inward/outward motions is judged to be achieved if the absolute value of the asymmetry parameter exceeds the criterion of 0.25. The criterion of 0.25 was chosen by them to screen out random contributions, and has often been used by following researches based on the asymmetry parameter. We defined our asymmetry parameter as (HCO+)(H13CO+)]/(H13CO+), and listed it in Table 5. Here, is the FWHM line width. The number in parentheses indicates that multiple velocity components are observed in H13CO+. The error in mainly originates from the velocity difference [(HCO+)(H13CO+)]. The uncertainty in is approximately 30%, considering the nominal velocity resolution (0.1 km s-1), the effect of the signal-to-noise (S/N) ratio on the accuracy of the velocity difference, the accuracy in velocity of H13CO+ Gaussian fitting ( 0.1 km s-1), and the typical H13CO+ line width. The absolute values of our asymmetry parameters ranging up to 1.38 were similar to those in Mardones et al. (1997), who studied low-mass molecular cloud cores containing candidate protostars at a convolved spatial resolution of 37 (0.027 pc at a distance of 150 pc). Their maximum absolute value was 1.16. Gregersen et al. (2000b) studied starless cores at a spatial resolution of 26 (0.019 pc at 150 pc distance) and the maximum absolute value of the asymmetry parameter was 0.68, which was smaller than our maximum absolute value. Figure 1 shows the histogram of the asymmetry parameter for the starless and protostellar cores. The distribution was more skewed to negative values, suggesting that inward motions are more dominant than outward motions. Lee et al. (1999) studied low-mass starless cores with a spatial resolution of 27 (0.020 pc at 150 pc distance), and obtained a similar negative bias in the asymmetry parameter. The asymmetry parameter runs from 1.3 to 0.7, which is similar to our range. Velusamy et al. (2008) studied 27 cores in Orion in HCO+ = 32 and reported inward motions in nine cores and outward motions in ten cores at a spatial resolution of 26 (0.053 pc at 420 pc distance). Their ranged from 1.25 to 0.86 with a bimodal distribution of blue and red. They regarded all the observed cores as starless; however, protostellar cores could be detected if we used the updated YSO information as noted previously. There is only one core overlapping between our and their Orion cores. Their ORI1_9 and core 16 are the same protostellar cores, and they consistently show red asymmetry suggesting expansion. The values obtained for them are 0.35 and 0.40, respectively, which are judged to be consistent. Jackson et al. (2019) studied high-mass, dense molecular clumps and reported an overall blue asymmetry with a large sample of 1093 sources at a spatial resolution of 38.

We started our research with starless cores. We attempted to identify evidence of inward motion in the starless cores. First, we investigated inward motions by comparing the peak velocities of the optically thick and thin lines. We focused on cores whose (HCO+)(H13CO+) and (HCO+)(N2H+) are both km s-1. We assume that negative shifts more than twice the velocity resolution (0.1 km s-1) are significant. Starless cores 5, 10, 11, 14, 17, 18, 20, 21, 23, 27, 28, and 32 (a total of 12 cores out of 30, or 40%) satisfy this condition. Measurements of peak velocities were rather straightforward. The velocity differences between (HCO+)(H13CO+), (HCO+)(N2H+), and (HNC)(HN13C) in the Nobeyama observations (Table 5) were rather consistent. Then, we judged that the S/N ratio would not significantly affect the measurements of the velocity differences. We judged that the velocity difference was measured with precision corresponding to the instrumental velocity resolution.
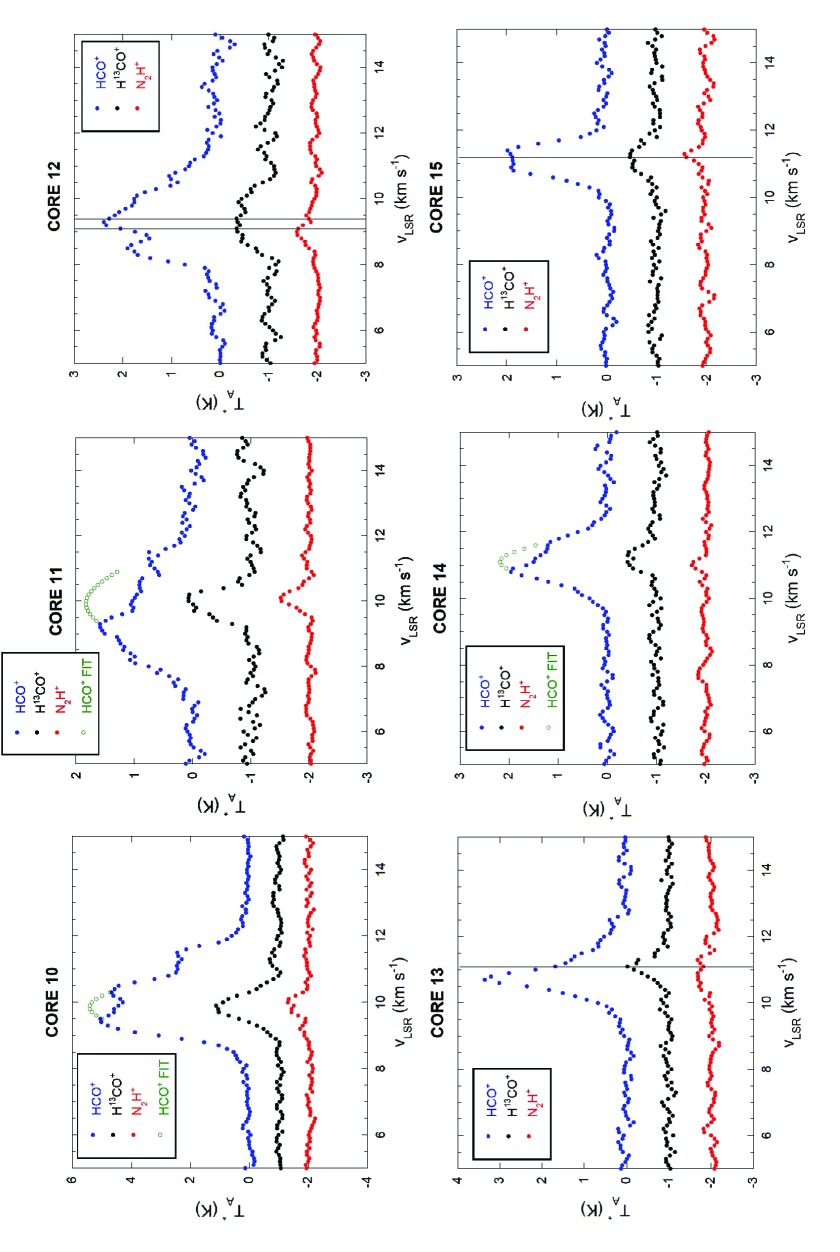
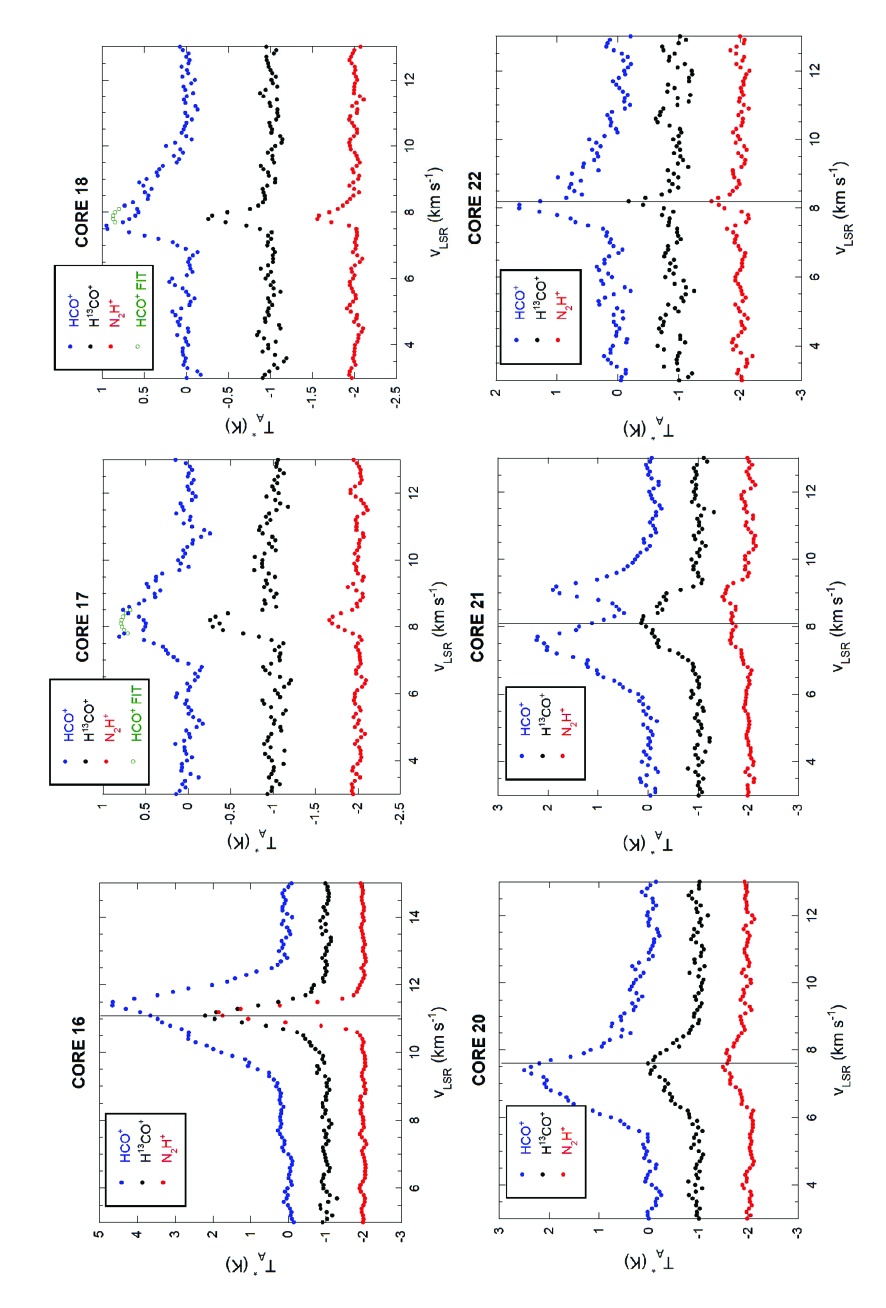
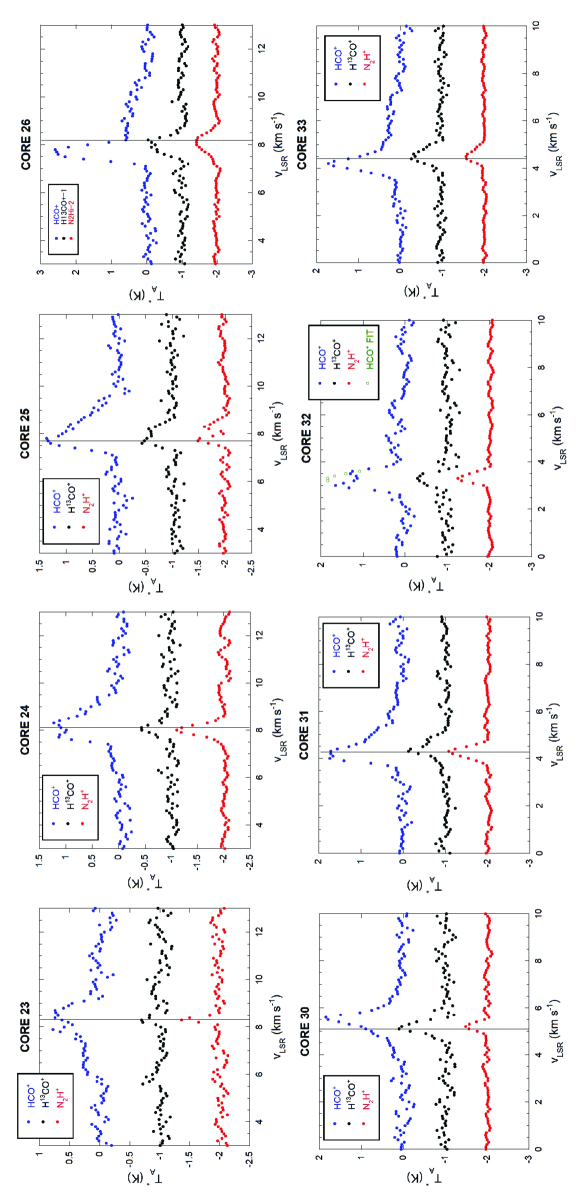
Second, we investigated the HCO+, H13CO+, and N2H+ profiles. To improve the S/N ratio, we collected data within a radius of 10, which is slightly larger than the telescope beam , on the Bessel–Gauss stacked pixel data. If the absorption is not sufficiently strong, absorption may cause line asymmetry without a dip in the profile. The blue-skewed line profile with a dip provides stronger evidence of possible inward motion than simple line profile asymmetry. Figures 2 to 4 shows the HCO+, H13CO+, and N2H+ ( = 0, 11, 2) profiles toward cores which possibly show either blue-skewed or red-skewed HCO+ profiles. Table 7 summarizes which figure corresponds to which core. The relative intensity of the 1st and 2nd intense peaks would be reliable, and we judged either blue-skewed or red-skewed if the intensity difference was significant w.r.t. the noise level. For possibly blue-skewed profiles, we tried Gaussian interpolation by fixing the Gaussian central velocity to that of optically thin H13CO+ emission. When we obtained successful Gaussian interpolation, we judged that the profile had a dip. Toward cores 16-18, the H13CO+ emission could be optically thick, because their intensities were close to those of HCO+. Exceptionally, cores 12 and 25 had inconsistent velocity differences of (HCO+)(H13CO+) and (HCO+)(N2H+). Core 12 had fairly different line shapes and line widths between H13CO+ and N2H+. Core 25 had two velocity components in H13CO+ and N2H+, and it seems that different optical depths of the lines result in different velocity differences. Among the 12 starless cores mentioned in the previous paragraph, we saw hints of the blue-skewed line profile in cores 10, 11, 14, 18, 21, and 32.
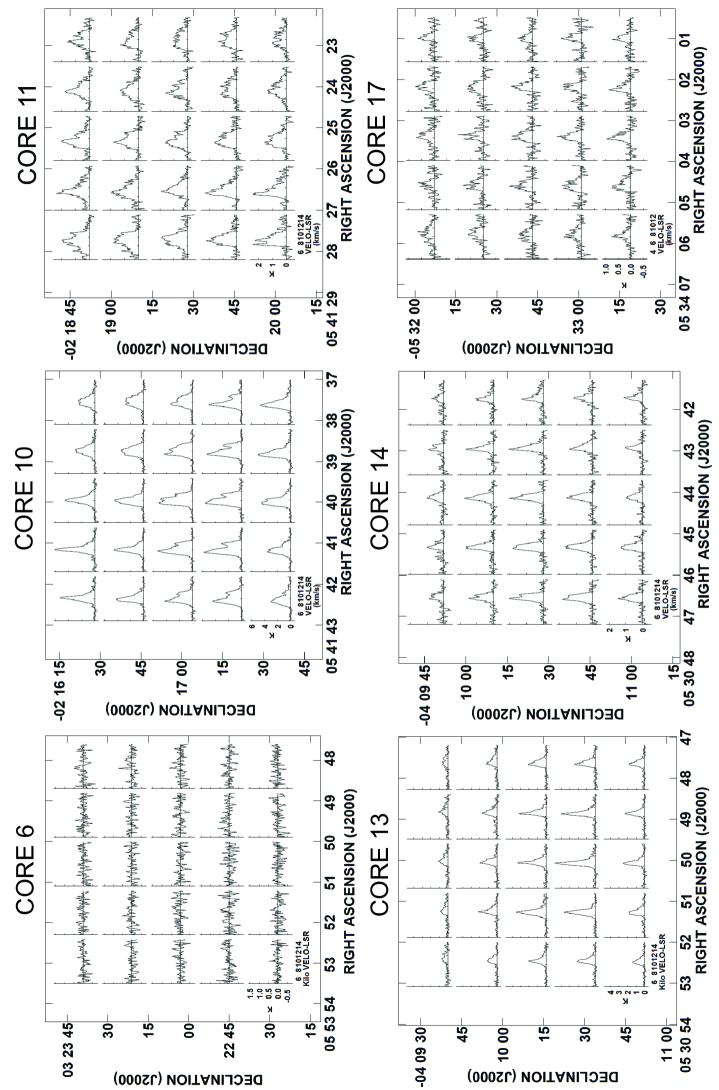
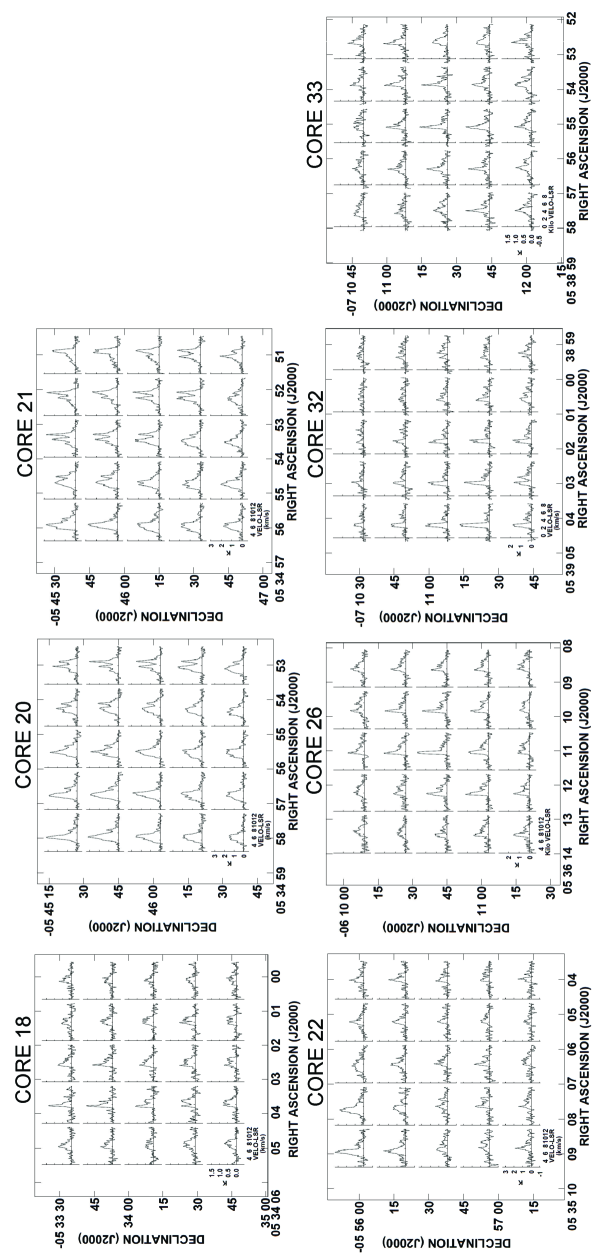
Third, we investigated stamp maps illustrating the spatial distribution of the HCO+ profiles on a grid of the sky coordinates. Figures 5 and 6 show 55 stamp maps of HCO+ profiles on a grid of 18 (approximately equal to the telescope beam size) centered at the core center position, for cores including the seven cores mentioned above. The spectra were taken from the Bessel–Gauss stacked pixel data. The sky coordinates are shown as the intersection point of the profile coordinate axes. Cores 20 and 21 observed in the same field showed two velocity components. Core 21 was thought to have two velocity components rather than a blue-skewed line profile with a dip. The N2H+ spectrum toward core 21 shown in Figure 3 supported this interpretation. Subsequently, we had five cores (cores 10, 11, 14, 18, and 32) out of the 30 starless cores (or 17%) as the HCO+ blue-skewed candidates. All the five starless cores showed dips in the HCO+ spectra. However, for cores 18 and 32, the S/N ratios in the HCO+ spectra were not sufficiently high or the sense of line asymmetry was not observed consistently around the core center. Finally, we identified starless cores 10, 11, and 14 to have the HCO+ “blue-skewed line profiles,” whereas cores 18 and 32 were identified as “candidate blue-skewed line profiles.” When the HCO+ profile showed clear dips, we interpolated the line profile from the outer part (open green circles in Figures 2 to 4). We here fixed the HCO+ Gaussian peak velocity to the value obtained from the Gaussian fitting to the optically thinner, H13CO+ emission. We determined the velocity range of absorption by comparing the HCO+ and H13CO+ profiles. In other cases, we indicate the vertical lines of the H13CO+ peak velocity (velocity corresponding to the intensity maximum), to illustrate the velocity difference of (HCOH13CO. Core 12 in Figure 3 has two vertical lines because the H13CO+ profile has two maxima. All our starless cores showing blue-skewed and candidate blue-skewed profiles satisfied the significance criterion for the asymmetry parameter of . Out of the 30 observed starless cores, three cores (10 %) were identified as cores having HCO+ (solid) “blue-skewed” profiles, and another two cores (7 %) were identified as “candidate blue-skewed.” For the five starless cores with blue-skewed and candidate blue-skewed profiles, the mean of the asymmetry parameter was 0.50.3. The core masses of these five blue-skewed starless cores including candidate identification had a mean of 1.77 , a median of 1.25 , a minimum of 0.15 , and a maximum of 5.4 , whereas all the 30 starless cores had a mean of 1.81 , a median of 1.18 , a minimum of 0.15 , and a maximum of 7.1 . There is no preferred tendency in mass for the blue-skewed starless cores.
We then considered the protostellar cores. Out of the six protostellar cores, four had significantly negative , one (core 35) had = 0, and the remaining one (core 16) had a significantly positive . Although the sample number of the protostellar core was small, we observed more cases with inward motions. It seems that inward motions dominate outward motions implying outflow even in the protostellar phase in our observations. The protostellar cores showing blue-skewed profiles have no dips in their spectra. Core 26 seemed to have a strong redshifted absorption, but also exhibits a prominent redshifted wing emission, which probably represents a molecular outflow.
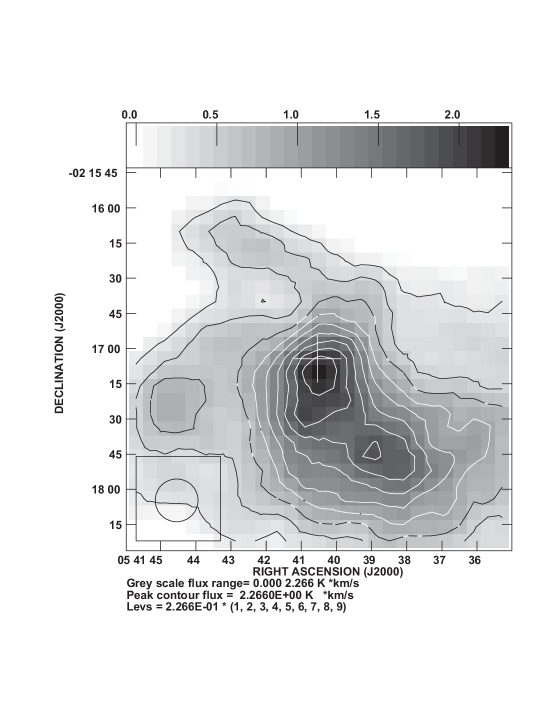
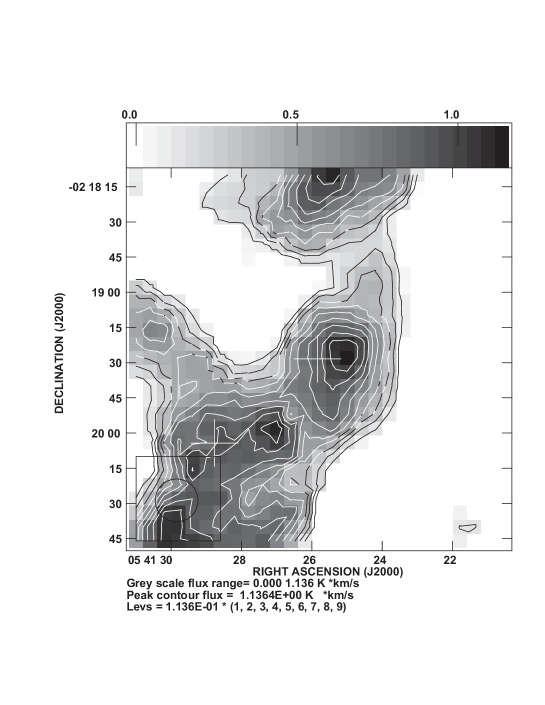
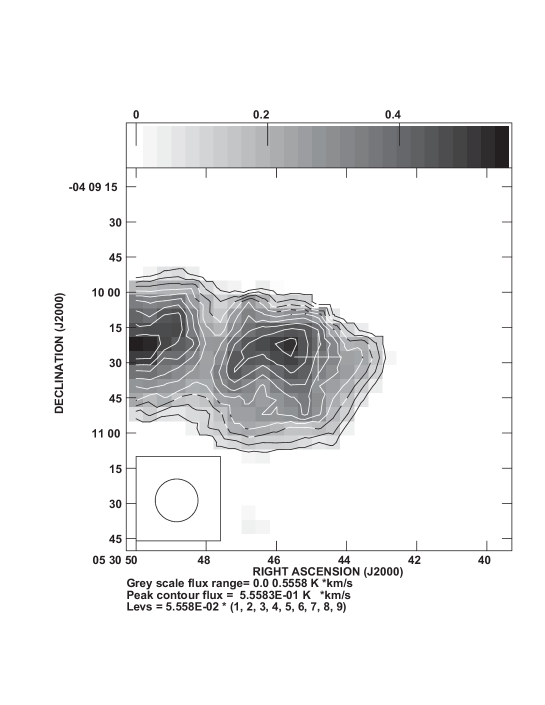
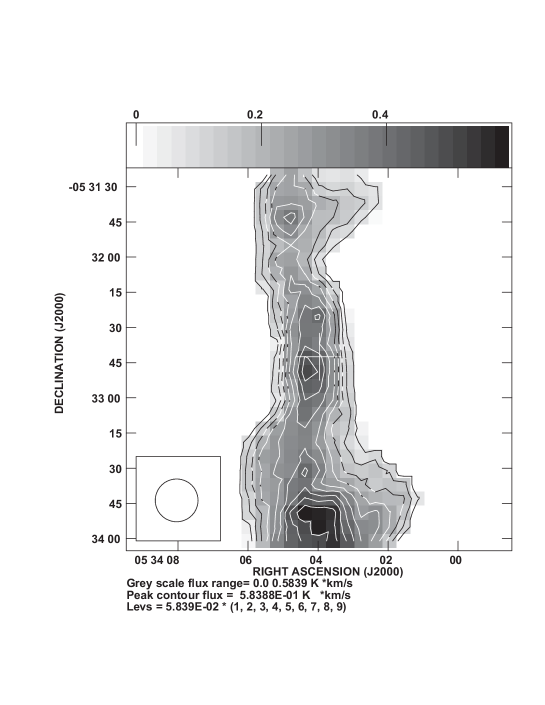
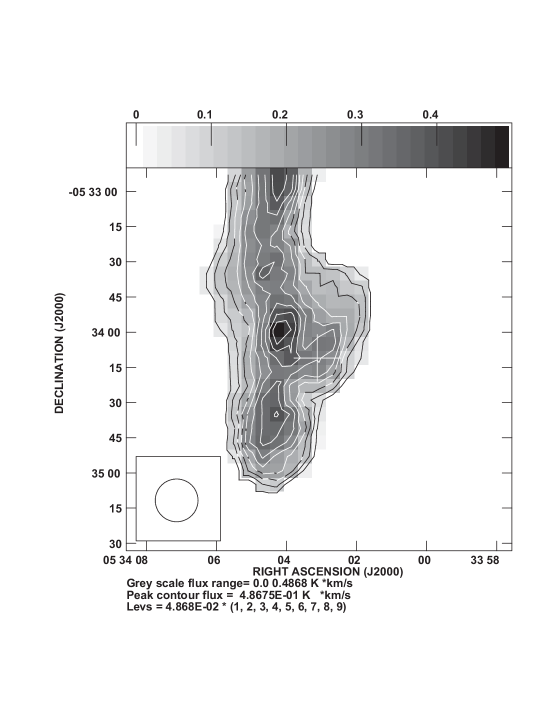
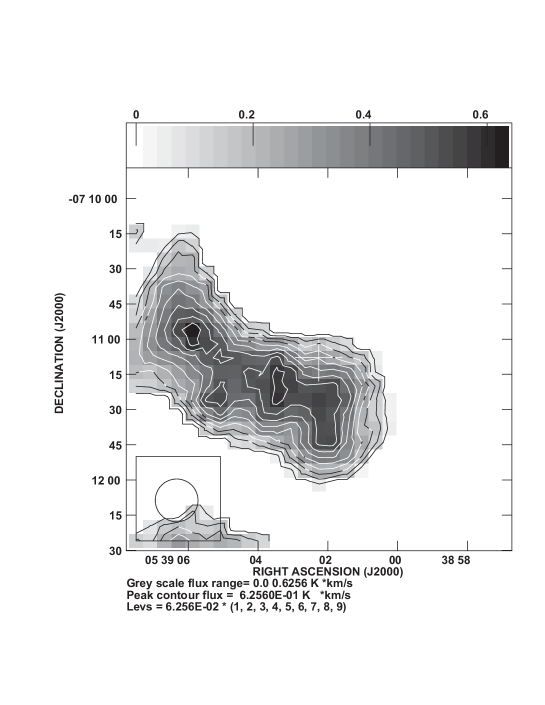
Finally, we investigated the core properties that are assumed to be related to the core evolutionary stages: the association with the core in H13CO+ emission, detection in the dust continuum using the ALMA ACA, and the CEF, based on the deuterium fraction (Table 8). The association of the core in H13CO+ emission is indicated if there is a clear H13CO+ emission peak within 30 from the SCUBA-2 position. For the association of the core in H13CO+ emission, ‘1’ means that the SCUBA-2 core is associated with the core in H13CO+ emission, and ‘0’ means that it is not. We often observe offsets between the H13CO+ emission peak and the SCUBA-2 position. It is possible that the depletion (Aikawa et al., 2001; Bergin & Tafalla, 2002) of H13CO+ affects its distribution. More generally, variation in the abundance, including but not restricted to depletion, as well as variation in excitation affects the distributions of molecular lines. Tatematsu et al. (2021) compared the distributions of the SCUBA-2 850 dust continuum, the transitions of N2H+ and HC3N, and the and transitions of CCS in the SCUBA-2 cores in Orion, and found that molecular emission distributions were often offset from the continuum peak. We continued to use the SCUBA-2 position as the core center to avoid the effect of spatial variation in abundance and excitation. We adopted CEF2.0 (CEF version 2.0), which is a measure of the chemical core evolution based on the logarithmic abundance ratio of DNC/HNC and N2D+/N2H+ for starless cores. The values of CEF2.0 were taken from Kim et al. (2020) and Tatematsu et al. (2021). The CEF2.0 values of the starless cores with HCO+ blue-skewed profiles or candidate blue-skewed profiles run from 41 to 20. Note that the CEF2.0 values for the overall SCUBA-2 cores in Orion run from to (Kim et al., 2020; Tatematsu et al., 2021). The association of the core in H13CO+ emission, detection status in the 1.3 mm continuum with the ALMA/ACA, and CEF2.0 are listed in Table 8. The detectability in the dust continuum with the ACA seems particularly effective to identify the core evolutionary stage (Tokuda et al., 2020). The detection status in the 1.3 mm dust continuum using the ALMA ACA was obtained from Dutta et al. (2020) (RMS noise level = 0.62 mJy beam-1). Table 3 lists ALMA core names used by Dutta et al. (2020) as well as those obtained from the ALMA Science Portal222almascience.org for the sources that have been observed using the ALMA but have not been published yet. In addition, we adopted the ACA detection status in the 1.2 mm continuum for core 32 from Tatematsu et al. (2020) (RMS noise level = 0.24 mJy beam-1). The detection status in the ALMA in the combined image from configuration TM2 and the ACA in the 1.3 mm continuum was reported by Sahu et al. (2021), and is listed as ‘TM2+ACA Detection.’ Figures 7 to 12 show the velocity-integrated intensity map of the H13CO+ emission toward the starless cores with HCO+ blue-skewed profiles or candidate blue-skewed profiles. All five starless cores of the blue-skewed or candidate blue-skewed line profiles with dips accompany H13CO+ cores.
The association with the core in H13CO+ emission may suggest that the five starless cores are at a relatively late stage of the starless phase (Onishi et al., 2002; Tokuda et al., 2020), but using the CEF2.0 values, we cannot conclude that they are predominantly at extremely late stages. Regarding the ACA detectability (Tokuda et al., 2020), two cores (cores 14 and 32) out of the five starless cores with blue-skewed or candidate blue-skewed profiles were observed using the ALMA ACA by Dutta et al. (2020) in the ALMASOP collaboration and Tatematsu et al. (2020), and these cores were detected in the dust continuum. However, core 14 was not detected in the ALMA TM2+ACA by Dutta et al. (2020).
To summarize the statistics on blue-skewed profiles, five starless cores out of 30 showed blue-skewed or candidate blue-skewed profiles, whereas four protostellar cores out of six showed blue-skewed profiles.
| Core Number | HCO+ | H13CO+ | HNC | HN13C | N2H+ | |||||
|---|---|---|---|---|---|---|---|---|---|---|
| K | km s-1 | K | km s-1 | K | km s-1 | K | km s-1 | K | km s-1 | |
| 1 | 1.2 | 9.8 | 0.34 | . . . | 0.6 | 10.8 | 0.32 | . . . | . . . | . . . |
| 2 | 2.3 | 11.0 | 0.9 | 11.1 | 1.2 | 11.1 | 0.27 | . . . | 0.23 | . . . |
| 3 | 1.4 | 10.9 | 0.5 | 10.8 | 0.9 | 10.9 | 0.31 | . . . | 0.28 | . . . |
| 4 | 0.5 | 9.7 | 0.7 | 9.4 | 1.2 | 10.0 | 0.5 | 9.4 | 0.3 | 9.4 |
| 5 | 0.6 | 9.7 | 0.8 | 10.0 | 1.2 | 9.8 | 0.6 | 10.2 | 0.4 | 10.2 |
| 6 | 0.33 | . . . | 0.5 | 9.9 | 1.2 | 9.7 | 0.4 | 10.5 | 0.3 | 10.4 |
| 7 | 0.40 | . . . | 0.40 | . . . | 0.39 | . . . | 0.34 | . . . | 0.23 | . . . |
| 8 | 3.5 | 9.9 | 1.0 | 9.8 | 2.7 | 9.7 | 0.30 | . . . | 1.1 | 9.8 |
| 9 | 0.8 | 9.6 | 0.27 | . . . | 0.4 | 9.2 | 0.28 | . . . | 0.27 | . . . |
| 10 | 5.0 | 9.5 | 2.1 | 9.9 | 3.5 | 9.7 | 0.30 | . . . | 0.7 | 10.0 |
| 11 | 1.6 | 9.3 | 1.1 | 10.2 | 0.9 | 9.6 | 0.27 | . . . | 0.5 | 10.1 |
| 12 | 2.4 | 9.3 | 0.7 | 9.4 | 1.4 | 9.9 | 0.4 | 9.7 | 0.4 | 9.0 |
| 13 | 3.4 | 10.7 | 1.0 | 11.1 | 1.6 | 10.9 | 0.25 | . . . | 0.3 | 10.9 |
| 14 | 1.9 | 10.9 | 0.6 | 11.1 | 1.0 | 10.9 | 0.23 | . . . | 0.3 | 11.0 |
| 15 | 2.0 | 11.4 | 0.5 | 11.2 | 1.3 | 11.4 | 0.27 | . . . | 0.4 | 11.3 |
| 16 | 4.7 | 11.4 | 3.2 | 11.1 | 3.7 | 11.4 | 0.9 | 11.1 | 3.9 | 11.2 |
| 17 | 0.8 | 7.7 | 0.7 | 8.2 | 1.0 | 8.4 | 0.25 | . . . | 0.3 | 8.2 |
| 18 | 1.0 | 7.6 | 0.7 | 7.8 | 0.9 | 7.6 | 0.22 | . . . | 0.4 | 7.8 |
| 19 | 1.9 | 8.4 | 0.5 | 8.6 | 1.3 | 8.5 | 0.4 | 8.8 | 0.7 | 8.5 |
| 20 | 2.5 | 7.4 | 1.0 | 7.6 | 1.0 | 7.0 | 0.29 | . . . | 0.4 | 7.9 |
| 21 | 2.2 | 7.6 | 1.1 | 8.1 | 1.6 | 7.5 | 0.25 | . . . | 0.5 | 8.9 |
| 22 | 1.6 | 8.0 | 0.8 | 8.2 | 1.1 | 8.0 | 0.44 | . . . | 0.5 | 8.2 |
| 23 | 0.8 | 7.9 | 0.3 | 8.3 | 1.1 | 8.9 | 0.27 | 0.6 | 8.3 | |
| 24 | 1.2 | 8.3 | 0.6 | 8.1 | 1.3 | 8.6 | 0.5 | 7.9 | 0.9 | 8.0 |
| 25 | 1.4 | 7.8 | 0.6 | 7.6 | 1.6 | 7.6 | 0.4 | 8.3 | 0.5 | 7.7 |
| 26 | 2.6 | 7.8 | 1.0 | 8.2 | 2.7 | 7.8 | 0.6 | 8.0 | 0.6 | 8.1 |
| 27 | 3.3 | 5.5 | 1.1 | 5.9 | 2.4 | 5.5 | 0.4 | 5.7 | 0.4 | 5.8 |
| 28 | 1.5 | 7.4 | 1.2 | 8.1 | 2.3 | 7.3 | 0.7 | 8.1 | 0.5 | 8.2 |
| 29 | 1.8 | 6.4 | 0.4 | 6.4 | 1.3 | 6.4 | 0.37 | . . . | 0.2 | 6.3 |
| 30 | 1.8 | 5.6 | 1.1 | 5.1 | 1.9 | 5.4 | 0.4 | 5.4 | 0.5 | 5.2 |
| 31 | 1.7 | 4.0 | 0.9 | 4.3 | 2.1 | 4.0 | 0.4 | 4.5 | 0.9 | 4.3 |
| 32 | 1.7 | 3.0 | 0.7 | 3.3 | 1.6 | 3.1 | 0.4 | 3.4 | 0.7 | 3.3 |
| 33 | 1.7 | 4.2 | 0.7 | 4.4 | 1.5 | 4.2 | 0.30 | 4.3 | 0.4 | 4.5 |
| 34 | 0.39 | 0.39 | . . . | 0.39 | . . . | 0.50 | . . . | 0.18 | . . . | |
| 35 | 1.5 | 3.9 | 0.9 | 3.9 | 2.5 | 4.0 | 0.7 | 4.0 | 0.5 | 4.2 |
| 36 | 1.1 | 11.2 | 0.47 | . . . | 1.2 | 11.2 | 0.55 | . . . | 0.5 | 11.5 |
| Core Number | YSO Ass. | (HCOH13CO | (HCON2H | (HNC)(HN13C) | H13CO | |
|---|---|---|---|---|---|---|
| km s-1 | km s-1 | km s-1 | km s-1 | |||
| 1 | starless | . . . | . . . | . . . | . . . | . . . |
| 2 | starless | -0.1 | . . . | . . . | 0.45 | -0.22 |
| 3 | starless | 0.1 | . . . | . . . | 0.77 | 0.13 |
| 4 | starless | 0.3 | 0.3 | 0.6 | 0.50 | 0.59 |
| 5 | starless | -0.3 | -0.5 | -0.4 | 1.28 | -0.23 |
| 6 | starless | . . . | . . . | -0.8 | 1.07 | . . . |
| 7 | starless | . . . | . . . | 0.0 | . . . | . . . |
| 8 | starless | 0.1 | 0.1 | . . . | 0.60 | 0.17 |
| 9 | starless | . . . | . . . | . . . | . . . | . . . |
| 10 | starless | -0.4 | -0.5 | . . . | 0.92 | -0.44 |
| 11 | starless | -0.9 | -0.8 | . . . | 0.89 | -1.01 |
| 12 | starless | -0.1 | 0.3 | 0.2 | 1.44 | ( -0.07 ) |
| 13 | protostellar | -0.4 | -0.2 | . . . | 0.70 | -0.57 |
| 14 | starless | -0.2 | -0.1 | . . . | 0.80 | ( -0.25 ) |
| 15 | starless | 0.2 | 0.1 | . . . | 0.89 | ( 0.22 ) |
| 16 | protostellar | 0.3 | 0.2 | 0.3 | 0.75 | 0.40 |
| 17 | starless | -0.5 | -0.5 | . . . | 0.57 | -0.88 |
| 18 | starless | -0.2 | -0.2 | . . . | 0.43 | -0.47 |
| 19 | starless | -0.2 | -0.1 | -0.3 | 0.63 | -0.32 |
| 20 | starless | -0.2 | -0.5 | . . . | 1.69 | -0.12 |
| 21 | starless | -0.5 | -1.3 | . . . | 1.52 | ( -0.33 ) |
| 22 | starless | -0.2 | -0.2 | . . . | 0.34 | -0.59 |
| 23 | starless | -0.4 | -0.4 | . . . | 0.29 | -1.38 |
| 24 | starless | 0.2 | 0.3 | 0.7 | 0.57 | 0.35 |
| 25 | starless | 0.2 | 0.1 | -0.7 | 0.82 | ( 0.24 ) |
| 26 | protostellar | -0.4 | -0.3 | -0.2 | 0.72 | -0.56 |
| 27 | starless | -0.4 | -0.3 | -0.2 | 0.85 | -0.47 |
| 28 | starless | -0.7 | -0.8 | -0.8 | 1.09 | ( -0.64 ) |
| 29 | starless | 0.0 | 0.1 | . . . | 0.37 | 0.00 |
| 30 | starless | 0.5 | 0.4 | 0.0 | 0.50 | 0.99 |
| 31 | protostellar | -0.3 | -0.3 | -0.5 | 0.79 | -0.38 |
| 32 | starless | -0.3 | -0.3 | -0.3 | 0.54 | -0.55 |
| 33 | protostellar | -0.2 | -0.3 | -0.1 | 0.73 | -0.27 |
| 34 | starless | . . . | . . . | . . . | . . . | . . . |
| 35 | protostellar | 0.0 | -0.3 | 0.0 | 0.75 | 0.00 |
| 36 | starless | . . . | -0.3 | . . . | 0.67 | . . . |
| Core Number | H13CO+ | N2H+ |
|---|---|---|
| 1 | . . . | . . . |
| 2 | 1 | . . . |
| 3 | 1 | . . . |
| 4 | 1 | 1 |
| 5 | 1 | 1 |
| 6 | 2 | 1 |
| 7 | . . . | . . . |
| 8 | 1 | 1 |
| 9 | . . . | . . . |
| 10 | 1 | 1 or 2 |
| 11 | 1 | 1 |
| 12 | 2 | 1 |
| 13 | 1 | 1 or 2 |
| 14 | 1 or 2 | 1 |
| 15 | 1 or 2 | 1 |
| 16 | 1 | 1 |
| 17 | 1 | 1 |
| 18 | 1 | 1 |
| 19 | 1 | 1 |
| 20 | 1 | 1 |
| 21 | complicated | 1-3 |
| 22 | 1 | 1 |
| 23 | 1 | 1 |
| 24 | 1 | 1 |
| 25 | 2 | 2 |
| 26 | 1 | 1 |
| 27 | 1 | 1 |
| 28 | 3 | 2 |
| 29 | 1 | . . . |
| 30 | 1 | 1 |
| 31 | 1 | 1 |
| 32 | 1 | 1 |
| 33 | 1 | 1 |
| 34 | . . . | 1 |
| 35 | 1 | 1 |
| 36 | 1 | 1 |
| Core Number | starless/protostellar | Feature | Figure | Chapter |
|---|---|---|---|---|
| 6 | starless | no HCO+ | 5 | 3.4 |
| 10 | starless | blue-skewed | 2, 5 | 3.2 |
| 11 | starless | blue-skewed | 2, 5 | 3.2 |
| 12 | starless | complicated HCO+ | 2 | |
| 13 | protpstellar | blue-skewed | 2, 5 | 3.3 |
| 14 | starless | blue-skewed | 2, 5 | 3.2 |
| 15 | starless | flat-top HCO+ | 2 | |
| 16 | protostellar | red-skewed | 3 | |
| 17 | starless | dip, skewness is not clear | 3, 5 | 3.2 |
| 18 | starless | candidate blue-skewed | 3, 6 | 3.2 |
| 20 | starless | two velocity components | 3, 6 | 3.1 |
| 21 | starless | two velocity components | 3, 6 | 3.1 |
| 22 | starless | suspicious but not convincing | 3, 6 | |
| 23 | starless | two peaks without skew | 4 | 3.4 |
| 24 | starless | red-skewed | 4 | |
| 25 | starless | wing-like | 4 | |
| 26 | protostellar | blue-skewed | 4, 6 | 3.3 |
| 30 | starless | red-skewed | 4 | |
| 31 | protostellar | blue-skewed | 4 | 3.3 |
| 32 | starless | candidate blue-skewed | 4, 6 | 3.2 |
| 33 | protostellar | blue-skewed | 4, 6 | 3.3 |
| Core Number | Core in H13CO+ Emission | SCUBA-2 Filament | ACA Detection | TM2+ACA Detection | CEF2.0 |
|---|---|---|---|---|---|
| 1 | . . . | 0 | NO (weak?) | NO | . . . |
| 2 | 1 | 0 | NO | NO | . . . |
| 3 | 1 | 0 | NO (weak?) | NO | . . . |
| 4 | 1 | 0 | . . . | . . . | -43 27 |
| 5 | 1 | 1 | NO (weak?) | NO | . . . |
| 6 | 0 | 1 | YES | NO | . . . |
| 7 | 0 | 1 | YES | YES | . . . |
| 8 | 1 | 1 | YES | NO | . . . |
| 9 | 0 | 1 | YES | NO | . . . |
| 10 | 1 | 0 | . . . | . . . | -41 27 |
| 11 | 1 | 1 | . . . | . . . | -27 14 |
| 12 | 1 | 1 | NO | NO | -34 3 |
| 13 | 1 | 1 | YES | NO | . . . |
| 14 | 1 | 1 | YES | NO | . . . |
| 15 | 1 | 0 | NO | NO | -41 8 |
| 16 | 1 | 1 | YES | YES | . . . |
| 17 | 1 | 1 | . . . | . . . | -19 15 |
| 18 | 1 | 1 | . . . | . . . | -20 19 |
| 19 | 0 | 1 | YES (weak?) | NO | -58 17 |
| 20 | 1 | 1 | YES | YES | -42 5 |
| 21 | 1 | 1 | NO (weak?) | NO | . . . |
| 22 | 0 | 1 | YES | NO | -27 15 |
| 23 | 0 | 0 | . . . | . . . | -56 27 |
| 24 | 0 | 1 | NO | NO | -50 27 |
| 25 | 0 | 1 | YES | NO | . . . |
| 26 | 1 | 1 | YES | YES | . . . |
| 27 | 1 | 0 | NO (weak?) | NO | -37 14 |
| 28 | 1 | 1 | YES (weak?) | NO | -22 20 |
| 29 | 0 | 0 | YES | NO | -7 28 |
| 30 | 0 | 1 | YES | NO | -24 14 |
| 31 | 1 | 1 | YES | NO | . . . |
| 32 | 1 | 1 | YES | . . . | -22 5 |
| 33 | 1 | 1 | YES (weak) | NO | . . . |
| 34 | . . . | 1 | . . . | . . . | . . . |
| 35 | 1 | 1 | YES | YES | . . . |
| 36 | 0 | 0 | YES (weak?) | NO | . . . |
| Core Number | Dip Integ. Intensity | Dip Width | HCO+ Fit Intensity |
|---|---|---|---|
| K km s-1 | km s-1 | K | |
| 10 | 0.52 | 0.10 | 5.42 |
| 11 | 1.09 | 0.60 | 1.83 |
| 14 | 0.52 | 0.23 | 2.28 |
| 17 | 0.11 | 0.14 | 0.79 |
| 18 | 0.11 | 0.13 | 0.88 |
| 32 | 0.18 | 0.10 | 1.86 |
3.2 Individual Starless Cores with Blue-skewed or Possibly Blue-skewed Profiles
(a) Core 10 (G206.9316.61East1)
This starless core belongs to NGC 2023 in the Orion B cloud. Figure 5 shows complicated profiles. It appears that this region contains another velocity component at 11.5 km s-1 in HCO+. However, we observe double-peaked profile separately and clearly with peaks at 9.5 and 10.3 km s-1 in HCO+, and the peak velocity of the H13CO+ emission well corresponds to that of the dip. Table 6 lists one or two velocity components in H13CO+; however, the velocity difference between the two velocity components is very small. This will not affect our interpretation as a core with a HCO+ blue-skewed profile with a dip.
(b) Core 11 (G206.9316.61West4)
This starless core belongs to NGC 2023 in the Orion B cloud and is close to core 10. This is a clear case of a blue-skewed line profile with a dip in HCO+. Figure 2 shows that the peak velocities of the H13CO+ and N2H+ emissions are consistent. However, that of the HCO+ emission is blue-shifted.
(c) Core 14 (G207.3619.82North4)
This starless core is located in the northern end of the Orion A cloud and is close to core 13. This is a clear case of a blue-skewed line profile with a dip. Figure 5 shows double-peaked profile around the core center. We also see it on the eastern side of the figure.
(d) Core 17 (G209.0519.73North)
This starless core belongs to OMC-4 in the integral-shaped filament in the Orion A cloud. Figure 5 shows that the dip in the observed spectrum is detected with an S/N ratio of 3.6. Figure 3 shows that the blue peak of the double-peaked HCO+ profile is only slightly brighter than the red peak, and the intensity difference between the two peaks is smaller than RMS noise level (an S/N ratio of 0.6). The existence of a dip is clear, but the skewness is not clear. We exclude this core from the candidate blue-skewed profile. Figure 3 shows that the peak velocity of the H13CO+ emission well corresponds to that of the dip. The peak velocities of the H13CO+ and N2H+ emission are consistent.
(e) Core 18 (G209.0519.73South)
This starless core belongs to OMC-4 in the integral-shaped filament in the Orion A cloud and is close to core 17. Figure 5 shows that the S/N ratio of the dip in the observed spectrum is 3.8. The intensity difference of the two peaks is marginally detected with an S/N ratio of 3.0. This source is classified a candidate blue-skewed profile. Figure 3 shows that the peak velocities of the H13CO+ and N2H+ emissions are consistent whereas that of the HCO+ emission is blue-shifted, suggesting a blue-skewed profile with a dip.
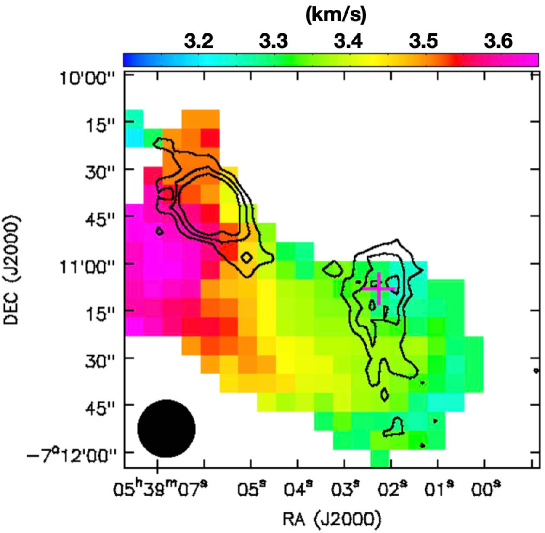
(f) Core 32 (G211.1619.33North3)
This starless core belongs to L1641 in the Orion A cloud. Figure 6 shows that we observe double-peaked profiles at the core center and on the eastern side of the figure. The sense of asymmetry is blue-skewed toward the core center; however it is opposite at the neighboring positions. This core was previously observed using the ALMA ACA (Tatematsu et al., 2020), and a blue-skewed line profile with a dip was detected in DCO+ .
3.3 Individual Protostellar Cores with Blue-skewed Profiles
(a) Core 13 (G207.3619.82North2)
This protostellar core is located in the northern end of the Orion A cloud. This is a clear case of a blue-skewed line profile without a dip.
(b) Core 26 (G209.9419.52North)
This protostellar core belongs to L1641 in the Orion A cloud. It is a clear case of a blue-skewed line profile without a dip. We saw red wing emission in HCO+ as pointed out earlier.
(c) Core 31 (G211.1619.33North5)
This protostellar core belongs to L1641 in the Orion A cloud. It is a clear case of a blue-skewed line profile without a dip.
(d) Core 33 (G211.1619.33North4)
This protostellar core belongs to L1641 in the Orion A cloud. It is a clear case of a blue-skewed line profile without a dip.
3.4 Notes on Other Specific Cores
Toward starless core 6 (G203.2111.20East1), we did not detect HCO+ emission, although we detected H13CO+ emission. It appears that the HCO+ intensity sharply drops toward the east around R.A. = 5h53m50s. We observed an absorption dip in HCO+ 18 west of the center of core 6 with an S/N ratio of 4.5 (Figure 5), suggesting contamination of the line emission at the reference off position. Li et al. (2021) observed a similar situation in their observation using the ALMA that the cold core M1 in NGC6334S showed strong H13CO+ emission, but did not exhibit HCO+ emission.
Starless core 9 (G206.2116.17South) does not show H13CO+ emission. The intensities of the HCO+ and N2H+ emission are weak (0.8 K and 0.2 K, respectively). Instead, a local peak in the 850 m continuum and N2H+ emissions 30 is located south-east of the SCUBA-2 core coordinates of Yi et al. (2018) (Figure 19.3 in Tatematsu et al., 2021). Dutta et al. (2020) identified the continuum emission using the ALMA ACA toward this south-eastern position as G206.2116.17S. We do not see a hint of the blue/red-skewed profile in HCO+ even around this south-eastern position (figures are omitted).
Starless core 23 (G209.7719.40West) has a large velocity difference between HCO+ and H13CO+. It has two velocity peaks in HCO+. However, the profile does not show a blue-skewed profile. We do not identify a core in H13CO+ emission here.
4 DISCUSSION
4.1 HCO+ Absorption Strength and Likely Epochs of Infall Motions
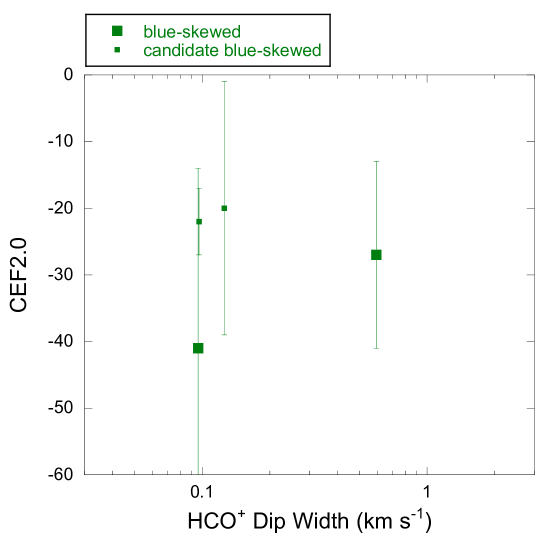
We attempted to determine if inward motions occur at specific epochs in the starless core phase. With regards to the core evolutionary stages, we used the core density and CEF2.0. Both these values are considered to increase with evolution. We adopted the integrated intensity of the absorption dip in the HCO+ spectrum as the strength of absorption. We measured the integrated intensity enclosed between the HCO+ profile (filled blue circles) and the interpolated profiles (open green circles) in Figures 2, 3, and 4. The integration velocity range for the dip was chosen to be the portion sandwiched by the two velocity ranges used for Gaussian interpolation, which were chosen by eye. We also calculated the dip width, which was the dip integrated intensity divided by the HCO+ peak intensity estimated from the interpolated Gaussian fitting. The dip width is a kind of the “equivalent width” expressed in velocity units. Table 9 lists the dip integrated intensity and dip width in the HCO+ emission.
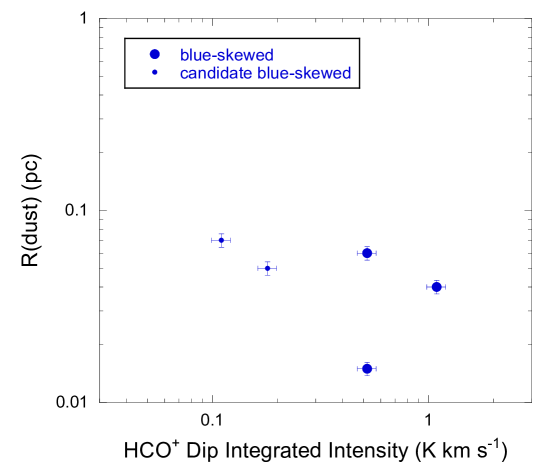
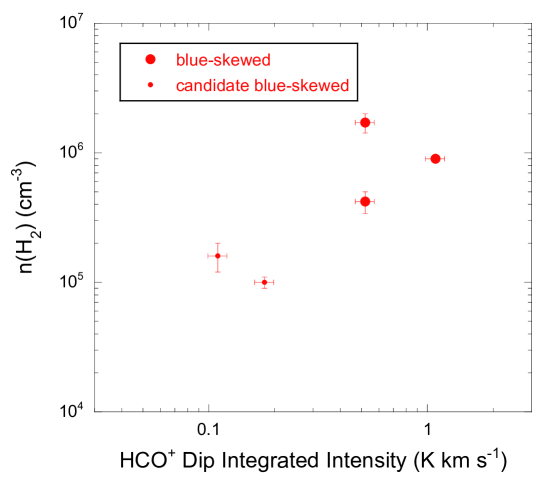
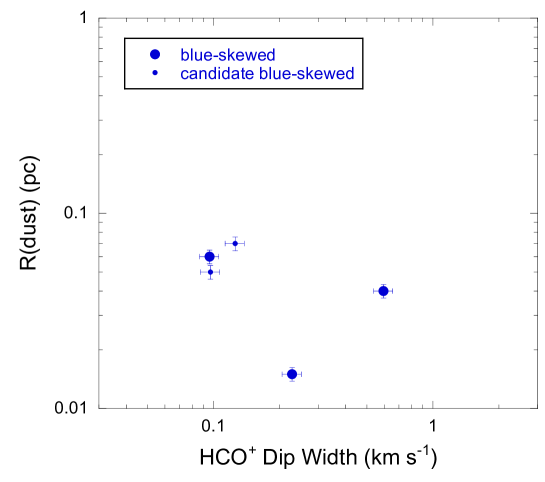
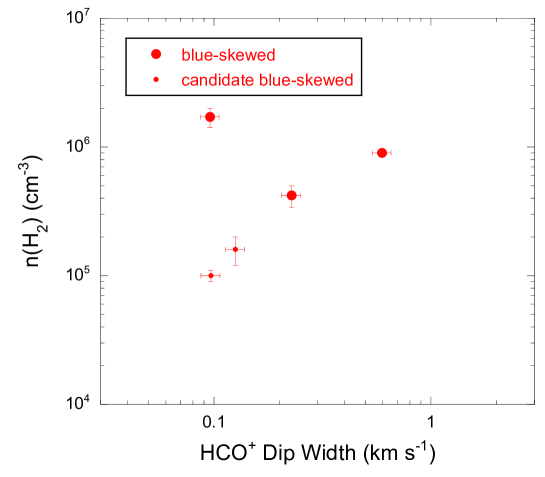
Figures 13 and 14 plot the core radius and density from the SCUBA-2 observations against the HCO+ dip integrated intensity. Larger symbols represent blue-skewed cores, whereas smaller symbols represent candidate blue-skewed cores. It was observed that the core radius decreases and the core density increases with increasing HCO+ dip integrated intensity. If we assume that the increase in the core density represents the core evolution, the HCO+ dip integrated intensity increases with core evolution, and the core radius decreases with core evolution. However, if we considere only the blue-skewed cores, the aforementioned trend is not very clear. Figures 15 and 16 are the same as Figures 13 and 14 but for the dip width as an abscissa axis; however, the trend is not very clear. We conclude that we do not observe strong evidence of evolutionary change in HCO+ absorption strength.
Next, we investigated the speed of inward motions. Three-dimensional fields of density and velocity of inward motions and their relationship with the line of sight as well as radiative transfer will determine the actual line profile. For simplicity, we take the velocity difference, (HCO+)(H13CO+), as a velocity extent of inward motions. Apparently, this is not always true, because gas with inward motions is not necessarily observed as absorption. If the inward-motion velocity increases toward the center of the core, the maximum line-of-sight velocity may appear as a maximum velocity offset from the systemic velocity in the emission. We adopted the above simple measure of the velocity of the identifiable inward motion, although we might overlook even faster components. The absolute values of (HCO+)(H13CO+) of the five starless cores with the blue-skewed lines or candidate blue-skewed line profiles range from 0.2 to 0.9 km s-1. Here, (HCO+) adopted corresponds to more intense peaks of the double peaks. Moreover, the lower limit of 0.2 km s-1 comes from the significance criterion, and we cannot detect subsonic motions well. The sound speed of the gas at temperatures of 1017 K (Eden et al., 2019) of a mean molecular weight per particle of 2.33 and the corresponding FWHM velocity width are 0.190.25 km s-1 and 0.440.58 km s-1, respectively. Then, the absolute value of the (HCO+)(H13CO+) suggested that inward motions may include supersonic values.
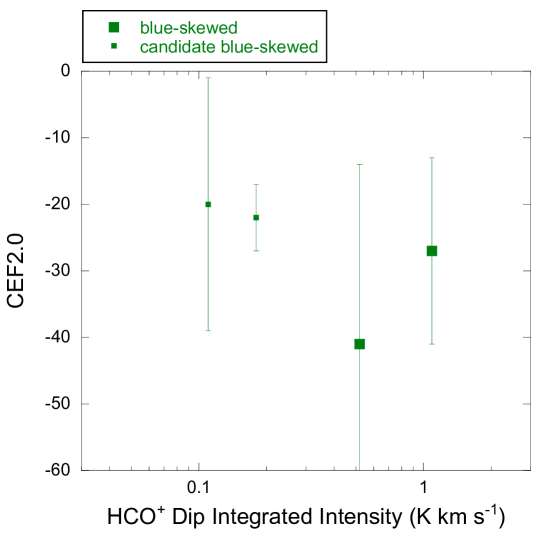
Figures 17 and 18 plot CEF2.0 against the dip integrated intensity and dip width, respectively. Note that CEF2.0 is defined as an increasing function of time evolution such that CEF2.0 in starless cores ranges from to 0. We did not note any clear correlation. Given that CEF2.0 represents core evolution, the dip integrated intensity or dip width does not appear at specific epochs during the evolution of the starless core phases. Therefore, we have no strong evidence to prove that inward motion phenomena are observed predominantly at the last stage in the starless phase.
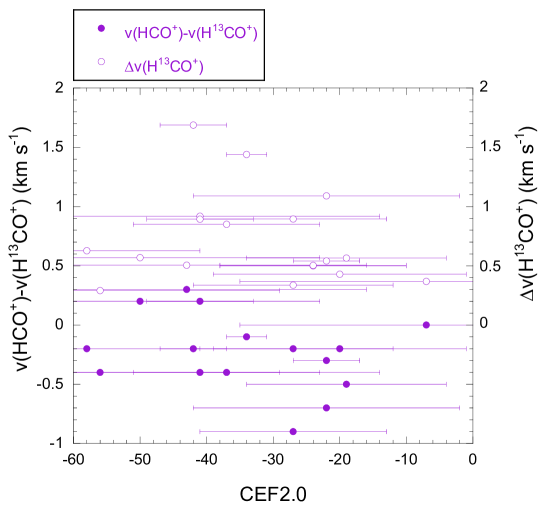
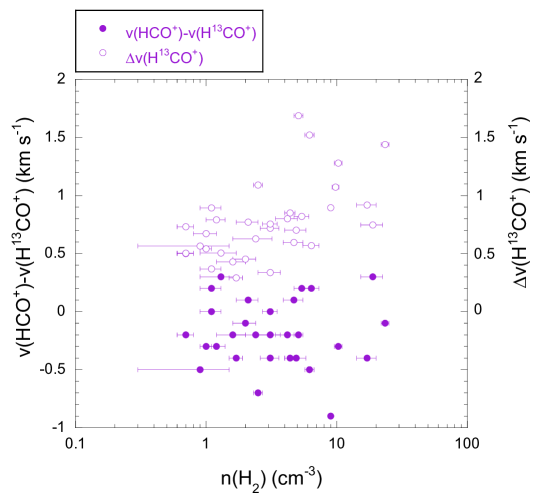
For starless dark cloud cores, Shirley et al. (2005) suggested an evolutionary sequence of L1521B, L1498, and L1544 in this order on the basis of chemical evolution signatures (Lee et al., 2003), central density (Evans et al., 2001), and density structure. Hirota & Yamamoto (2006) showed that the deuterium fraction increased in this order for these objects, and suggested the same evolutionary sequence for them. CEF2.0 is defined as an increasing function of the deuterium fraction. However, Figure 19 does not show that the density increases with CEF2.0 which traces the deuterium fraction. We then attempted to determine if starless Orion cores evolved like starless dark cloud cores. Figures 20 and 21 show the relationship between CEF2.0, core density, the velocity difference between HCO+ and H13CO+, and the H13CO+ line width. No outstanding trends are observed except for the H13CO+ line width against density; the H13CO+ line width appears to increase with increasing density. Least-squares fitting led to (H13CO+)/km s-1 = 0.43 log ((H2)/105 cm-3) +0.57 with a correlation coefficient of 0.55. If starless cores dissipate turbulence toward star formation, the line width may decrease with time. If the density increases during starless core evolution, Figure 21 suggests that the line width also increases. We may need to investigate the best evolutionary tracer for the evolution of starless cores in Orion. The density range suggested by Shirley et al. (2005) approximately runs from cm-3 to cm-3. By contrast, the density range studied by Yi et al. (2018) runs only from cm-3 to cm-3. Crapsi et al. (2005) compared the deuterium fraction based on N2D+ from observations and chemical simulations and it appears that the observed values match simulations from cm-3 to cm-3. Density may depend on core evolution stages as well as local environments for cores. Thus, it is likely that a variation in the core density within a narrower range may have limited reliability as an evolutionary stage tracer.

4.2 Reliability and Implication of the Blue-skewed Line Profile with Dip
Signatures of the candidate blue-skewed line profiles with dips in the present study are not as convincing. Independent observations of relevant molecules and in appropriate transitions are desirable. Chira et al. (2014) suggested using optically thicker high-J transitions, such as , , and , of HCN and HCO+. Contreras et al. (2018) suggested that HCO+ may be a better tracer of inward motions among other lines.
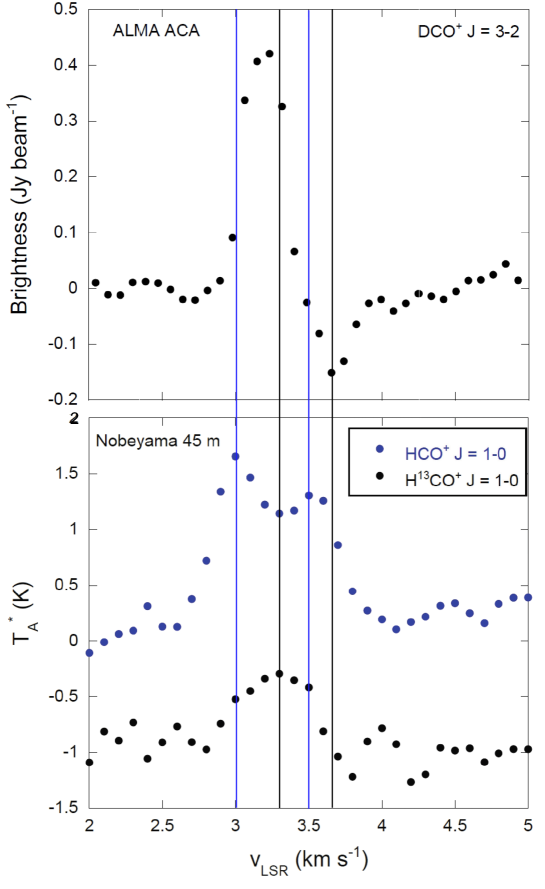
We have data for core 32. Tatematsu et al. (2020) pointed out the possibility that G211.1619.33North3 (core 32) showed a hint of the red-shifted dip in the DCO+ emission using the ALMA ACA 7 m Array. The profile is the inverse P Cygni-like, possibly because the ALMA ACA did not include the Total Power Array. Probably, the core is mostly resolved out with the 7 m Array, whereas a part of the emission from the core (center) and foreground absorption of gas with inward motion are resolved using it. In the current observations, we found that this core showed a candidate blue-skewed line profile with a dip in the HCO+ emission (Fig. 22). The peak velocity of DCO+ coincides with that of the H13CO+ ( km s-1). The velocity of the absorption dip in DCO+ was km s-1. Those of the first and secondary peaks of HCO+ were km s-1 and km s-1, respectively. It seems that inward motions traced by DCO+ observed with a telescope beam of 25 (1050 au), have a larger velocity offset ( km s-1) from the systemic velocity than that traced by HCO+ ( km s-1) observed with a telescope beam of 9 (3800 au). If we take the maximum velocity offset the DCO+ dip at km s-1 the offset from the DCO+ peak emission is 0.6 km s-1. Using two independent observations with the ACA and Nobeyama 45 m telescope, core 32 (G211.1619.33North3) might show better evidence of inward motions. We decided to study the implications of these different velocity offsets. Different inward velocities at different radii may represent acceleration due to gravity. The “inside-out” collapse of Shu (1977) may have inward velocities of 0.5 and 0.2 km s-1 at radii of and cm (or 1000 and 4000 au), respectively (Figure 2 of Zhou, 1992). The absorption features of core 32 might represent the motions of the inside-out infall of Shu (1977). However, the Shu infall will form a detectable protostar quickly ( yr from the start of infall) (Tafalla et al., 1998). Core 32 is starless, and might not be consistent with combination of expected velocities and infall elapse time from the Shu infall. If we employ the initial density distribution obtained by multiplying the equilibrium density distribution of the critical Bonnor-Ebert sphere by a constant factor, we can delay the formation of a protostar, but instead it is hard to see decreasing infall velocity with increasing radius for au because mass has not been accumulated enough at the center through infall (Aikawa et al., 2005; Keto et al., 2015; Foster & Chevalier, 1993). One possibility is that the core has a static central compact “kernel” with enough mass to accelerate the surrounding gas inward but has not formed a protostar (Myers, 1998; Caselli et al., 2019). The SCUBA-2 mass of core 32 is . CEF2.0 of core 32 is , which corresponds to the late starless core stage close to the onset of star formation. If CEF2.0 reflects the core evolution well, the core density distribution may have become centrally peaked.
4.3 Comparison with Yi et al. (2021)
We compared of Yi et al. (2021) with a spatial resolution of 30 with that in the present study with a resolution of 182. There are 22 overlapping cores between their cores with the estimate and those in this study. Their values of the 22 cores had a mean of and a median of -0.04, whose absolute values are smaller than those in the present study (mean = , median = 0.26). Their H13CO+ line widths (mean = 0.860.35 km s-1, median = 0.88 km s-1 for the overlapping 22 cores) are slightly larger than ours (mean = 0.780.34 km s-1, median = 0.74 km s-1). It is possible that different spatial resolutions are one of the main reasons for the slightly different line widths, because it is known that the line width increases with increasing radius for molecular clouds (Larson, 1981) Figure 23 compares the values obtained by them and those obtained in the present study. Correlation is observed to be poor.
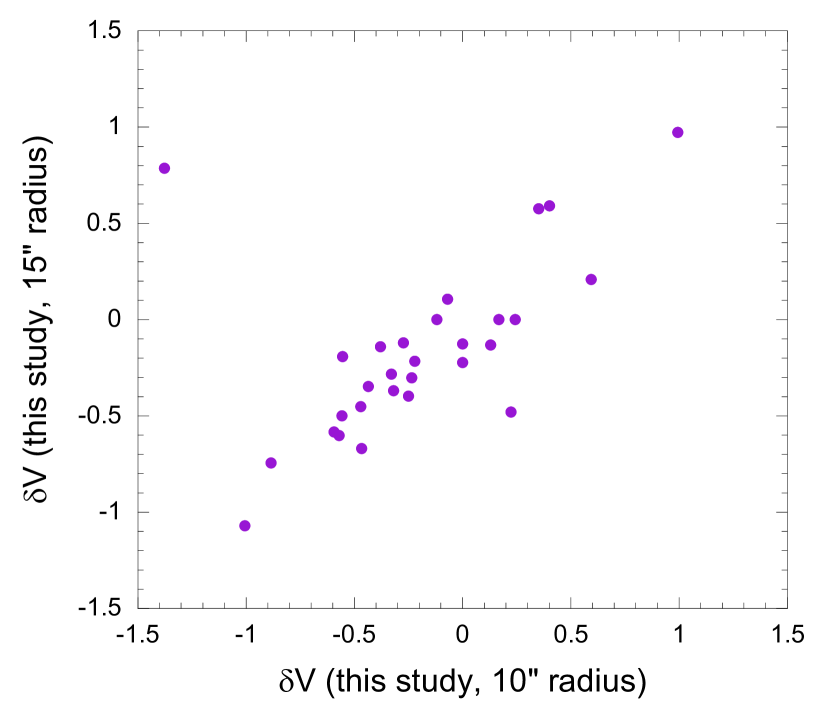
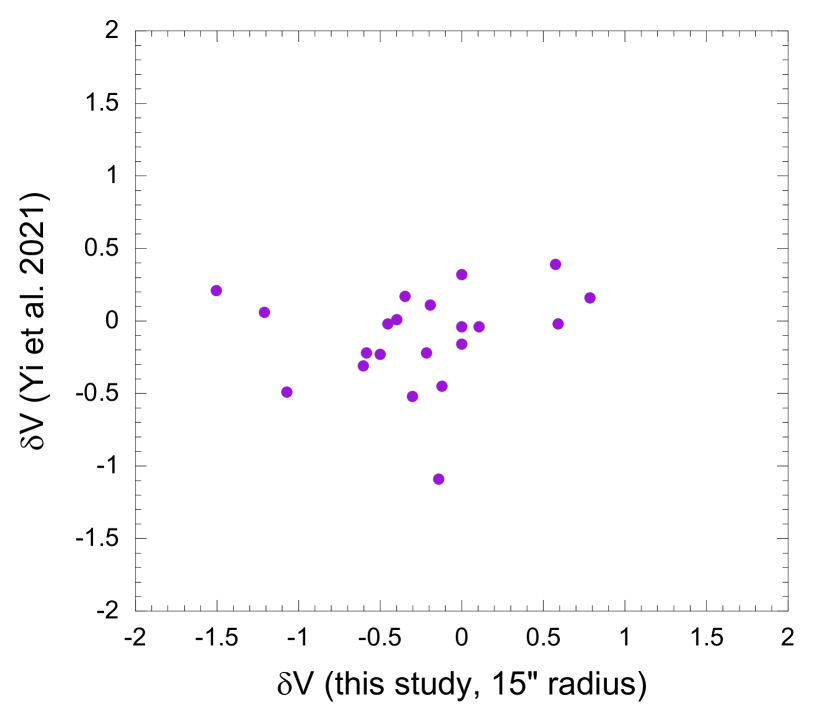
As shown earlier, the velocity differences between (HCO+)(H13CO+), (HCO+)(N2H+), and (HNC)(HN13C) in the Nobeyama observations (Table 5) are rather consistent, and seems reliable. To test the above interpretation, we collected data within a radius of 15, which corresponds to the telescope beam employed by Yi et al. (2021). Table 10 lists the peak velocities, 13CO+ line widths, and asymmetry parameters. The ratio of the asymmetry parameter of the 15 radius sampling to that of the original 10 radius sampling had a mean of 0.6 and a median of 0.9. The ratio of the asymmetry parameter of that of Yi et al. (2021) to that of our original 10 radius sampling had a mean of 0.6 and a median of 0.4. These values are not far different. Figure 24 compares the values obtained with 15 radius sampling and those with 10 radius sampling. The correlation is rather good. An outlier at (this study, 10 radius) = 1.38 corresponds to core 24, which has two HCO+ peaks with similar line strengths (Figure 4). Adoption of a different sampling radius led to a different choice from the two peaks. Figure 25 compares the values by Yi et al. (2021) and those with 15 radius sampling. The correlation is poor. We concluded that differences between beam sizes could not fully explain the poor correlation between the asymmetry parameters of Yi et al. (2021) and ours.
The observations in Yi et al. (2021) were made in single pointing toward the SCUBA-2 cores, whereas this study mapped the areas around the cores. Thus, the identification of blue-skewed cores in this study is thought to be more reliable because of spatial information.

| Core Number | (HCO | H13CO | H13CO | |
|---|---|---|---|---|
| km s-1 | km s-1 | km s-1 | ||
| 2 | 11.0 | 11.1 | 0.46 | -0.2 |
| 3 | 10.7 | 10.8 | 0.76 | -0.1 |
| 4 | 9.7 | 9.6 | 0.48 | 0.2 |
| 5 | 9.6 | 10.0 | 1.32 | -0.3 |
| 8 | 9.8 | 9.8 | 0.61 | 0.0 |
| 9 | 9.6 | 9.8 | 0.17 | -1.2 |
| 10 | 9.5 | 9.8 | 0.86 | -0.3 |
| 11 | 9.1 | 10.0 | 0.84 | -1.1 |
| 12 | 9.3 | 9.1 | 1.88 | 0.1 |
| 13 | 10.7 | 11.1 | 0.66 | -0.6 |
| 14 | 10.8 | 11.1 | 0.75 | -0.4 |
| 15 | 10.9 | 11.3 | 0.83 | -0.5 |
| 16 | 11.5 | 11.1 | 0.68 | 0.6 |
| 17 | 7.7 | 8.2 | 0.67 | -0.7 |
| 18 | 7.6 | 7.9 | 0.45 | -0.7 |
| 19 | 8.4 | 8.6 | 0.54 | -0.4 |
| 20 | 7.4 | 7.4 | 1.70 | 0.0 |
| 21 | 7.6 | 8.1 | 1.76 | -0.3 |
| 22 | 8.0 | 8.2 | 0.34 | -0.6 |
| 23 | 8.6 | 8.3 | 0.38 | 0.8 |
| 24 | 8.3 | 8.0 | 0.52 | 0.6 |
| 25 | 7.7 | 7.7 | 0.82 | 0.0 |
| 26 | 7.8 | 8.2 | 0.80 | -0.5 |
| 27 | 5.5 | 5.9 | 0.88 | -0.5 |
| 28 | 7.4 | 8.1 | 0.47 | -1.5 |
| 29 | 6.4 | 6.5 | 0.45 | -0.2 |
| 30 | 5.6 | 5.1 | 0.51 | 1.0 |
| 31 | 4.2 | 4.3 | 0.71 | -0.1 |
| 32 | 3.1 | 3.2 | 0.52 | -0.2 |
| 33 | 4.3 | 4.4 | 0.83 | -0.1 |
| 34 | 4.8 | 3.7 | 0.34 | 3.2 |
| 35 | 3.9 | 4.0 | 0.79 | -0.1 |
| 36 | 11.2 | 11.2 | 0.64 | 0.0 |
4.4 Association with Filaments
Tatematsu et al. (2021) investigated whether core properties such as radius, velocity dispersion, core mass, and virial parameter depended on the association with filaments; no clear differences between the cores associated with filaments and those not associated with filaments were found. We judged the association with filaments with the SCUBA-2 maps of Yi et al. (2018) by eye. Table 8 summarizes association with filaments. 20 out of the 30 starless cores (66%) are associated with filaments. We found that four (except for core 10) out of the five starless cores (80%) showing blue-skewed or candidate blue-skewed profiles were associated with filaments. The current result does not suggest any outstanding statistics regarding the percentage of filament association in the cores showing blue-skewed or candidate blue-skewed line profiles with dips.
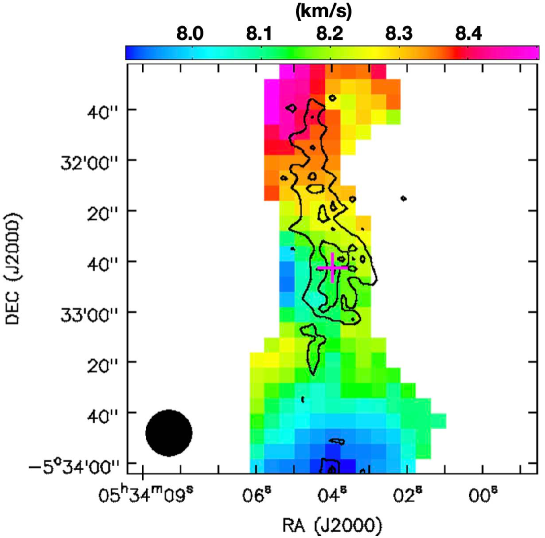
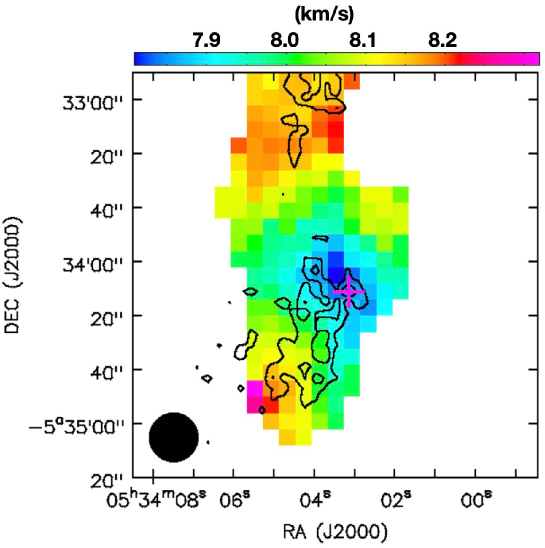
It is not easy to relate the filament dynamics and the cores showing blue-skewed or candidate blue-skewed line profiles with dips. Figure 26 to 28 show moment 1 (intensity-weighted velocity) maps toward the three cores with a hint of the velocity gradient along the filament.
One outstanding example is the filament connecting cores 17 and 18 (Figures 26 and 27, respectively). A velocity gradient along the north–south filament is clearly seen. If we can assume that this velocity gradient represents inflows, these cores showing the candidate blue-skewed line profiles with dips may accrete the material along the filament. Another example is core 32 (Figure 28). For comparison, Figure 18 of Tatematsu et al. (2021) illustrated the N2H+ moment 1 map toward this core. From these figures, we see an east–west velocity gradient consistently; however the velocity field shown in the latter for a wider area seems more complicated.
4.5 Mass Rates of Inward Motions
Without detailed models of each source, we offered only two complementary estimates for the mass rates of inward motions. (1) We assumed that the cores were in or near a state of equilibrium. This is plausible if they are isolated dense cores just at the beginning of infall, but the model is more general. (2) We assumed that all the mass of the core was flowing freely at constant velocity and used the crossing time. This will correspond to the inertial inflow model of Padoan et al. (2020)
(1) The mass inflow rate for any cloud that is initially in approximate hydrostatic equilibrium with magnetic fields and turbulence as well as thermal pressure is proportional to (Hunter, 1977; Stahler et al., 1980; McKee &Ostriker, 2007), where is the gravitational constant and is the effective sound speed. The coefficient for is known to be of order unity, and we simply assumed unity. To estimate , we adopted the total line width (Fuller & Myers, 1992), which is a sum of the nonthermal line width and the thermal contribution corresponding to the mean molecular weight in quadrature, to obtain the effective speed of sound from the line width of the H13CO+ line, which is optically thinner, by assuming a kinetic temperature of = 15 K;
| (1) |
| (2) |
and
| (3) |
where , , and are the observed FWHM line width, the mass of the molecule H13CO+ and the mean molecular mass per particle (2.33 ), respectively. The mass rate (equilibrium) in this method for the five (candidate) blue-skewed starless cores ranges from yr-1 to yr-1. For all 36 cores, it was yr-1 (the mean value and standard deviation in the sample).
(2) Second, we estimated another mass inflow rate using the crossing time. We estimated the crossing time by dividing the SCUBA-2 core radius by the effective sound speed above, and then estimated the mass rate by dividing mass by the crossing time. We obtained the mass rate (vcross) in this method for the five (candidate) blue-skewed starless cores to be yr-1. For all 36 cores, it range from yr-1 to yr-1. The mean of (vcross) was yr-1 (the mean value and standard deviation in the sample). The standard deviation is larger than the mean value, because of the very large range of values.
For comparison, the ratio of the mass rate in these two methods, (vcross)/ (equilibrium) for all 36 cores was 1.00.8. The estimates from these two different methods are similar. If the mean value of the ratio is larger than unity, it may be because the second method assumes freely flowing gas with no pressure support. Alternatively, if the ratio is smaller than unity, freely flowing matter does not deliver mass to a core a great deal faster than infall onto a star could process it. Approximately, it seems that freely flowing matter delivers mass to a core so that infall onto a star could process it.
For the filament connecting cores 17 (with a dip but no skewness) and 18 (candidate blue-skewed), we estimated the possible inflow rate along the filament assuming that the velocity gradient of the filament represents inflow. We estimated the local thermodynamic equilibrium (LTE) mass of the filament to be 4 from the H13CO+ data with an excitation temperature of 5 K and an H13CO+ abundance of (Ikeda et al., 2007, and references therein). The velocity gradient along the filament was 1 km s-1 pc-1. We estimated an inflow timescale of 106 yr from the velocity gradient, and then estimated the rate by dividing mass by the inflow timescale. The inflow rate along the filament, which may be fed into the core, could be of the order of yr-1.
These values may provide us the order of magnitude estimate of the rate for inflows along filaments and infall toward the core center, if they exist.
5 SUMMARY
We searched for inward motions toward the 36 SCUBA-2 cores (30 starless cores and 6 protostellar cores) in Orion. We used the Nobeyama 45 m radio telescope, and mapped them in the transitions of HCO+, H13CO+, N2H+, HNC, and HN13C. The asymmetry parameter (normalized velocity difference) , which is the ratio of the velocity difference between HCO+ and H13CO+, to the H13CO+ line width is biased toward negative values, suggesting that inward motions are more dominant than outward motions. Three starless cores (10%) were found to have HCO+ blue-skewed line profiles and two more starless cores (7%) had candidate blue-skewed line profiles. The peak velocity difference between HCO+ and H13CO+ reaches 0.9 km s-1, suggesting that inward motions are at least partially supersonic. The mean of of the aforementioned five starless cores was derived to be 0.50.3. All these cores were found to be associated with cores with H13CO+ emission. G211.1619.33North3 also observed using the ALMA ACA in DCO+ showed blue-skewed features. The velocity offset of gas with inward motions in the ALMA ACA observations was larger than that in the Nobeyama 45 m telescope observations, which can be explained in terms of gravitational acceleration of inward motions. Although there was no clear indication that inward motions were observed predominantly at a specific phase in general, it seems that this core is at the last stage in the starless phase.
References
- Aguti et al. (2007) Aguti, E. D., Lada, C. J., Bergin, E. A., Alves, J. F., & Birkinshaw, M. 2007, ApJ, 665, 457
- Aikawa et al. (2001) Aikawa Y., Ohashi, N., Inutsuka, S., Herbst, E., & Takakuwa, S. 2001, ApJ, 552, 639
- Aikawa et al. (2005) Aikawa, Y., Herbst, E., Roberts, H., & Caselli, P. 2005, ApJ, 620, 330
- André et al. (2014) André, P., Di Francesco, J., Ward-Thompson, D., et al. 2014, in Protostars and Planets VI, 27
- Bergin & Tafalla (2002) Bergin, E. A.; Alves, J., Huard, T., & Lada, C. J. 2002, ApJ, 570, L101
- Blitz & Thaddeus (1980) Blitz, L., & Thaddeus, P. 1980, ApJ, 241, 676
- Caselli et al. (1995) Caselli, P., Myers, P. C., & Thaddeus, P. 1995, ApJ, 455, L77
- Caselli et al. (2019) Caselli, P., Pineda, J. E., Zhao, B., et al. 2019, ApJ, 874, 89
- Chen et al. (2020) Chen, M. C.-Y., Di Francesco, J., & Rosolowsky, E. 2020, ApJ, 891, 84
- Chira et al. (2014) Chira, R.-A., Smith, R. J., Klessen, R. S., Stutz, A. M., & Shetty, R. 2014, MNRAS, 444, 874
- Contreras et al. (2018) Contreras, Y., Sanhueza, P., Jackson, J. M., et al. 2018, ApJ, 861, 14
- Crapsi et al. (2005) Crapsi, A., Caselli, P., Walmsley, C. M., et al. 2005, ApJ, 619, 379
- Dutta et al. (2020) Dutta, S., Lee, C.-F., Hirano, N., et al. 2020, ApJS, 251, 20
- Eden et al. (2019) Eden, D. J., Liu, T., Kim, K.-T., et al. 2019, MNRAS, 485, 2895
- Emerson & Graeve (1988) Emerson, D. T. & Graeve, R. 1988, A&A, 190, 353
- Emprechtinger et al. (2009) Emprechtinger, M., Caselli, P., Volgenau, N. H., Stutzki, J., & Wiedner, M. C. 2009, A&A, 493, 89
- Evans et al. (2001) Evans, N. J., II, Rawlings, J. M. C., Shirley, Y. L. & Mundy, L. G. 2001, ApJ, 557, 193
- Evans et al. (2015) Evans, N. J., II, Di Francesco, J., Lee, J.-E., et al. 2015, ApJ, 814, 22
- Feng et al. (2019) Feng, S., Caselli, P., Wang, K., et al. 2019, ApJ, 883, 202
- Friesen et al. (2013) Friesen, R. K., Medeiros, L., Schnee, S., et al., 2013, MNRAS, 883, 1513.
- Foster & Chevalier (1993) Foster, P. N., & Chevalier, R. A. 1993 ApJ, 416, 303
- Fuller & Myers (1992) Fuller, G. A., & Myers, P. C. 1992, ApJ, 384, 523
- Fuller et al. (2005) Fuller, G. A., Williams, S. J. & Sridharan, T. K. 2005, A&A, 442, 949
- Furlan et al. (2016) Furlan, E., Fischer, W. J., Ali, B., et al. 2016, ApJS, 224, 5
- Getman et al. (2019) Getman, K. V., Feigelson, E. D., Kuhn, M. A., & Garmire, G. P. 2019, MNRAS, 487, 2977
- Gómez et al. (2007) Gómez, G. C., Vazquez Semadeni, E., Shadmehri, M., & Ballesteros Paredes, J. 2007, ApJ, 669, 1042
- Gregersen et al. (2000a) Gregersen E. M., Evans, N. J., II, Mardones, D., & Myers, P. C. 2000 ApJ, 533, 440
- Gregersen et al. (2000b) Gregersen E. M., & Evans, N. J., II 2000 ApJ, 538, 260
- Hacar & Tafalla (2011) Hacar, A., & Tafalla, M. 2011, A&A, 533, 34
- Hirota & Yamamoto (2006) Hirota, T., & Yamamoto, S. 2006, ApJ, 646, 258
- Hunter (1977) Hunter, C. 1977, ApJ, 218, 834
- Ikeda et al. (2007) Ikeda, N., Sunada, K., & Kitamura, Y. 2007, ApJ, 665, 1194
- Jackson et al. (2019) Jackson, J. M., Whitaker, J. S., Rathborne, J. M., et al. 2019, ApJ, 870, 5
- Jeffries (2007) Jeffries, R. D. 2007, MNRAS, 376, 1109
- Jessop & Ward-Thompson (2000) Jessop, N. E., & Ward-Thompson, D. 2000, MNRAS, 311, 63
- Kamazaki et al. (2012) Kamazaki, T., Okumura, S. K., Chikada, Y., et al. 2012, PASJ, 64, 29
- Keto et al. (2015) Keto, E., Caselli, P., & Rawlings, J. 2015, MNRAS, 446, 3731
- Kim et al. (2020) Kim, G., Tatematsu, K., Liu, T., et al. 2020, ApJS, 249, 33
- Kirk et al. (2005) Kirk, J. M., Ward-Thompson, D., & André, P. 2005, MNRAS, 360, 1506
- Könyves et al. (2015) Könyves, V., André, P., Men’shchikov, A., et al. 2015, A&A, 584, A91
- Kounkel et al. (2017) Kounkel, M., Hartmann, L., Loinard, L., et al. 2017, ApJ, 834, 142
- Lada et al. (2003) Lada, C. J., Bergin, E. A., Alves, J. F., & Huard, T. L. 2003, ApJ, 586, 286
- Larson (1969) Larson, R. B. 1969, MNRAS, 145, 271
- Larson (1981) Larson, R. B. 1981, MNRAS, 194, 809
- Lee et al. (1999) Lee, C. W., Myers, P. C., & Tafalla, M. 1999, ApJ, 526, 788
- Lee et al. (2003) Lee, J.-E., Evans, N. J. I., Shirley, Y. L., & Tatematsu, K. 2003, ApJ, 583, 789
- Li et al. (2021) Li, S., Lu, X., Zhang, Q., et al., ApJ, 912, L7
- Liu et al. (2015) Liu, T., Wu, Y., Mardones, D., et al., 2015, Publications of the Korean Astronomical Society, 30, 79
- Liu et al. (2018) Liu, T., Kim, K.-T., Juvela, M., et al. 2018, ApJS, 234, 28
- Loren (1976) Loren, R. B. 1976, ApJ, 209, 466
- Lu et al. (2018) Lu, X., Zhang, Q., Liu, H. B., et al. 2018, ApJ, 855, 9
- Mardones et al. (1997) Mardones, D., Myers, P. C., Tafalla, M., Wilner, D. J., Bachiller, R., & Garay, G. 1997, ApJ, 489, 719
- McKee &Ostriker (2007) McKee, C. F., & Ostriker, E. C. 2007, ARA&A, 45, 565
- Minamidani et al. (2016) Minamidani, T., Nishimura, A., Miyamoto, Y., et al. 2016, Millimeter, Submillimeter, and Far-Infrared Detectors and Instrumentation for Astronomy VIII, 9914, 99141Z
- Myers (1998) Myers, P. C. 1998, ApJ, 496, L109
- Olguin et al. (2021) Olguin, F. A., Sanhueza, P., Guzmán, A. E., et al. 2021, ApJ, 909, 199
- Onishi et al. (2002) Onishi, T., Mizuno, A., Kawamura, A., Tachihara, K., & Fukui, Y. ApJ, 575, 950
- Padoan et al. (2020) Padoan, P., Pan, L., Juvela, M., Haugbølle, T., & Nordlund, Å. 2020 ApJ, 900, 82
- Palmeirim et al. (2013) Palmeirim, P.; André, P., Kirk, J., et al. 2013. A&A, 550, 38
- Penston (1969) Penston M. V. 1969, MNRAS, 144, 425
- Perryman et al. (1997) Perryman, M. A. C., Lindegren, L., Kovalevsky, J., et al. 1997, A&A, 323, L49
- Pickett et al. (1998) Pickett, H. M., Poynter, R. L., Cohen, E. A., & and, M. D. S. 1998, JQRST, 60, 883
- Planck Collaboration et al. (2011) Planck Collaboration, Ade, P. A. R., Aghanim, N., et al. 2011, A&A, 536 A23
- Planck Collaboration et al. (2016) Planck Collaboration, Ade, P. A. R., Aghanim, N., et al. 2016, A&A, 594, A28
- Reiter et al. (2011) Reiter, M., Shirley, Y., Wu, J.,; Brogan, C., et al. ApJ, 740, 40
- Sahu et al. (2021) Sahu, D., Liu, S.-Y., Liu, T., et al. 2021, ApJ, 907, L15
- Sandstrom et al. (2007) Sandstrom, K. M., Peek, J. E. G., Bower, G. C., Bolatto, A. D. & Plambeck, R. L. 2007, ApJ, 667, 1161
- Sanhueza et al. (2021) Sanhueza, P., Girart, J. M., Padovani, M. 2021, ApJ, 915, L10
- Sawada et al. (2008) Sawada, T., Ikeda, N., Sunada, K., et al. 2008, PASJ, 60, 445
- Shirley et al. (2005) Shirley, Y. L., Nordhaus, M. K., Grcevich, J. M., et al. 2005, ApJ, 632, 982
- Shirley et al. (2015) Shirley, Y. L., PASP, 127, 299
- Shu (1977) Shu, F. H. 1977, ApJ, 214, 488
- Stahler et al. (1980) Stahler, S. W., Shu, F. H., & Taam, R. E. 1980, ApJ, 241, 637
- Tafalla et al. (1998) Tafalla, M., Mardones, D., Myers, P. C., et al. 1998, ApJ, 504, 900
- Tatematsu et al. (2014) Tatematsu, K., Ohashi, S., Umemoto, T., et al. PASJ, 66, 16
- Tatematsu et al. (2017) Tatematsu, K., Liu, T., Ohashi, S., et al. 2017, ApJS, 228, 12
- Tatematsu et al. (2020) Tatematsu, K., Liu, T., Kim, G., et al. 2020, ApJ, 895, 119
- Tatematsu et al. (2021) Tatematsu, K., Kim, G., Liu, T., et al. 2021, ApJS, 256, 25
- Tokuda et al. (2020) Tokuda, K., Fujishiro, K., Tachihara, K., et al., 2020, ApJ, 899, 10
- van Moorsel et al. (1996) van Moorsel, G., Kemball, A., & Greisen, E., 1996 in A. S. P. Conf. Ser. 101, Astronomical Data Analysis Software and Systems V, ed. G. H. Jacoby & J. Barnes (San Francisco, CA: ASP), 37
- Velusamy et al. (2008) Velusamy, T., Peng, R., Li, D., Goldsmith, P. F., and Langer, W. D. 2008, ApJ, 688, L87
- Wang et al. (1995) Wang, Y., Evans, N. J., II, Zhou, S., & Clemens, D. P. 1995, ApJ454, 217
- Yang et al. (2020) Yang, Y.-L., Evans, N. J., II, Smith, A., et al. 2020, ApJ, 891, 61
- Yi et al. (2018) Yi, H.-W., Lee, J.-E., Liu, T., et al. 2018, ApJS, 236, 51
- Yi et al. (2021) Yi, H.-W., Lee, J.-E., Kim, K.-T., et al. 2021, ApJS,254, 14
- Zhou (1992) Zhou, S. 1992, ApJ, 394, 204
- Zhou et al. (1993) Zhou, S, Evans, N. J., II, Kömpe, C. & Walmsley, C. M. 1993, ApJ, 404, 232