Critical behavior in the Mn5Ge3 ferromagnet
Abstract
High-Curie-temperature ferromagnets are promising candidates for designing new spintronic devices. Here we have successfully synthesized a single-crystal sample of the itinerant ferromagnet Mn5Ge3 used flux method and its critical properties were investigated by means of bulk dc-magnetization at the boundary between the ferromagnetic (FM) and paramagnetic (PM) phase. Critical exponents with a critical temperature K and with K are obtained by the modified Arrott plot, whereas is deduced by a critical isotherm analysis at K. The self-consistency and reliability of these critical exponents are verified by the Widom scaling law and the scaling equations. Further analysis reveals that the spin coupling in Mn5Ge3 exhibits three-dimensional Ising-like behavior. The magnetic exchange is found to decay as and the spin interactions are extended beyond the nearest neighbors, which may be related to different set of Mn–Mn interactions with unequal magnitude of exchange strengths. Additionally, the existence of noncollinear spin configurations in Mn5Ge3 results in a small deviation of obtained critical exponents from those for standard 3D-Ising model.
I Introduction
Itinerant ferromagnets have been extensively studied due to their exotic physical properties, for example, unconventional superconductivity, non-Fermi-liquid behavior, exotic magnetic states, or quantum critical behavior (Shimizu, 1981; Saxena et al., 2000; Aoki et al., 2001; Rößler et al., 2006; Pfleiderer et al., 2001; Manyala et al., 2000; Pfleiderer et al., 1997). The transition of paramagnetic (PM) to ferromagnetic (FM) phase with decreasing temperature is regarded as a canonical example of a second order phase transition. Specifically, many experimental and theoretical studies have looked at enigmatic phenomena related to a quantum phase transition (QPT) between FM and PM states. Furthermore, a second order (critical) QPT in itinerant-electron systems are believed to be responsible for enigmatic quantum phases like magnetically mediated superconductivity and non-Fermi liquid behavior in materials such as URhAl (Tateiwa et al., 2018), MnSi (Pfleiderer et al., 1997; Zhang et al., 2015), and UGe2 (Pfleiderer and Huxley, 2002). Here we focus on a classical critical behavior of the magnetization around a ferromagnetic transition temperature from which the type of the magnetic phase transition and the nature of spin-spin interactions can be studied(Liu et al., 2017; Zhang et al., 2016).
In Mn–based materials, Mn5Ge3 is prominent ferromagnet with the magnetic ordering at K, close to the room temperature (Tawara and Sato, 1963). Due to its considerable spin-polarization(Panguluri et al., 2005) and the possibility to epitaxially grow on semiconductors, Mn5Ge3 has been subjected to wide investigation as a potential candidate for efficient spin injector in spintronics(Dung et al., 2013; Picozzi et al., 2004). Furthermore, the fundamental properties of Mn5Ge3, especially its magnetic structure, have been investigated in detail(Jackson et al., 1965; Tawara and Sato, 1963; Kappel et al., 1976; Forsyth and Brown, 1990). Mn5Ge3 holds structure same as Mn5Si3 with the space group P63/mcm, and the unit cell contains 6 Ge and 10 Mn atoms. Mn atom occupies two different Wyckoff positions: 4d (MnI) and 6g (MnII) with the magnetic moments of 1.96 and 3.23 , respectively(Forsyth and Brown, 1990). The magnetic moment direction of MnI and MnII atoms has been reported to be parallel to the c axis of the hexagonal structure from to around 70 K(Xie et al., 2021). The difference among various Mn–Mn interactions leads to an anisotropic exchange and complex magnetic ordering in different temperature regimes.
The theoretical calculations have demonstrated that Mn5Ge3 has two competing phases with collinear and noncollinear spin configurations (Stroppa and Peressi, 2007). The transition temperature from collinear to noncollinear magnetism in Mn5Ge3 is about 70 K (Zeng et al., 2003; Tang et al., 2012), quite similiar as the situation in Mn5Si3 where its magnetic transition from a “high-temperature” collinear AFM spin state to a low-temperature noncollinear antiferromagnetic (AFM) spin state occurs at almost the same temperature (66 K)(Brown et al., 1992; Brown and Forsyth, 1995; Sürgers et al., 2014). Furthermore, the density-functional theory (DFT) calculations reveal that in general the interaction between the nearest neighbors MnI–MnI is ferromagnetic and it is much stronger than the interaction between the MnI–MnII or MnII–MnII atoms. Neighboring MnII atoms are ferromagnetically coupled in the fully relaxed unit cell. Nevertheless, by applying compressive strain, the MnII–MnII atomic distance decreases and the corresponding FM coupling is suppressed, then transformed into AFM coupling (Xie et al., 2021; Slipukhina et al., 2009). In addition, it is believed that the coexistence of AFM and FM coupling observed at low temperature may lead to the low-temperature noncollinear spin configuration which is commonly observed in Mn5Ge3 thin film or nanowire (Xie et al., 2021; Zeng et al., 2003; Tang et al., 2012; Slipukhina et al., 2009).
Mn5Ge3 has been widely studied for its magnetocaloric properties due to the large effect near room temperature, which makes it a potential candidate for magnetic refrigeration with the advantage of being environment friendly (Zheng et al., 2013; Toliński and Synoradzki, 2014; Kang et al., 2017; Lalita et al., 2021). Though the magnetothermal properties of Mn5Ge3 have been extensively investigated, further studies are desired to understand the intrinsic magnetic interactions, especially the critical behavior in Mn5Ge3 single crystal. In this paper, we investigate the critical behavior of flux-grown Mn5Ge3 crystal with various techniques, such as modified Arrott plot, Kouvel–Fisher plot, and critical isotherm analysis. Our analyses indicate that the obtained critical exponents [ ( K), ( K), and ( K)] are close to those values obtained from the renormalization group calculation for the three-dimensional Ising model(Kaul, 1985). The spin interaction decays with distance as , indicating that the spin interaction is extended beyond the nearest neighbors (NN)(Fisher et al., 1972), which may result from the different Mn–Mn interactions with unequal magnitude of exchange strengths. Subsequently, the existence of noncollinear spin configurations in Mn5Ge3 leads to a small deviation of obtained critical exponents from those for standard 3D-Ising model.
II experimental details
High-quality Mn5Ge3 single crystals were grown by the flux method starting from a mixture of pure elements Mn powder, Ge powder, and In granular with a molar ratio of . The starting materials were loaded into corundum crucible which was sealed in an evacuated quartz tube. Then the tube was put into furnace and heated to 950 over 10 h, held for 20 h, then slowly cooled down to 350 at a rate of 2 / h. Finally, crystals with metallic luster were obtained by centrifugation to remove excess flux at 350 . Elemental analysis was performed using energy dispersive X-ray spectroscopy (EDX, Oxford X-Max 50). The determined atomic proportion was consistent with the composition of Mn5Ge3 within instrumental error. The single crystal and powder X-ray diffraction (XRD) patterns were carried out by a Bruker D8 Advance X-ray diffractometer using Cu Kα radiation. TOPAS-4.2 was employed for the refinement. The measurements of resistivity and magnetic properties were performed on the Quantum Design physical property measurement system (QD PPMS-14T) and magnetic property measurement system (MPMS-3). The M(H) curves are measured at interval = 1 K, and = 0.5 K when approaching . The applied magnetic field has been corrected into the internal field as , where is the measured magnetization and is the demagnetization factor. The corrected was used for the analysis of critical behavior.
III Results and discussions
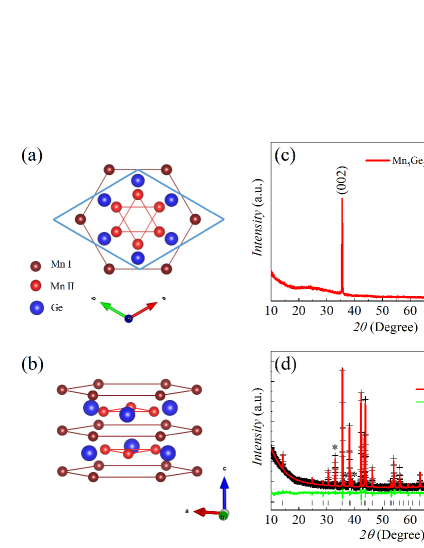
The intermetallic compound Mn5Ge3 is ferromagnetic below its Curie temperature, and its crystal structure is of the type as shown in Figs. 1(a) and (b), with lattice parameters Å and Å at ambient temperature. The local environment of the Mn atoms in Mn5Ge3 is illustrated in Figs.1 (a) and (b): MnI has two NN MnI (at 2.522 Å) and six next nearest neighbours (NNN) MnII (at 3.059 Å), whereas MnII has two NN MnII (at 2.976 Å), four NNN MnII (at 3.051 Å), and four NNN MnI (at 3.059 Å)(Forsyth and Brown, 1990). Fig. 1(c) presents the single-crystal XRD pattern, where only () peaks are detected, indicating the crystal surface is normal to c-axis and the hexagon-shaped surface is parallel to the plane. The inset shows the picture of as grown Mn5Ge3 crystal after handling with dilute HCl acid (7 wt %) to remove the residual flux on the sample surface. Furthermore, the powder XRD pattern of Mn5Ge3 is shown in Fig. 1(d), in which the observed peaks are well fitted with the P63/mcm space group. Indium flux is also observed on the pattern since the XRD experiments are carried out on the powders from crushing small single crystals.
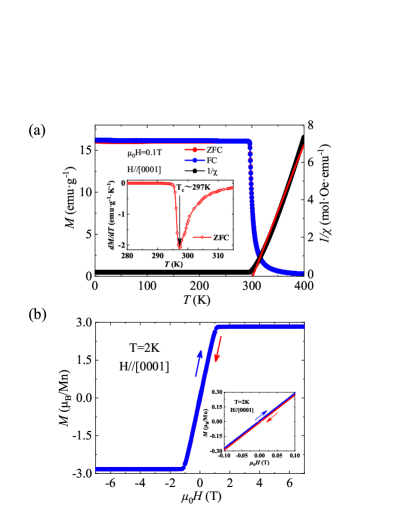
The critical temperature can be roughly determined by the temperature dependence of magnetization . Fig. 2(a) shows the curves for Mn5Ge3 under zero-field-cooling (ZFC) and field-cooling (FC) with an applied field T, which is parallel to the axis. The curve exhibits an abrupt decline with the increase of temperature, corresponding to the FM-PM transition. The inset of Fig. 2(a) presents vs. , where K is determined from the minimum of the curve. The corresponding -dependence of the inverse susceptibility is also shown in Fig. 2(a). Excellent fitting to the data in the high-temperature range was obtained using the modified Curie-Weiss law
| (1) |
where is the temperature-independent susceptibility, is the Curie-Weiss constant, and is the Weiss temperature. The values of the parameters obtained from the fitting are emu K/molOe, K, and emu/molOe with . The positive confirms the FM interaction among Mn atoms. Also, effective magnetic moment per Mn atom of Mn5Ge3 is , which can be calculated from Curie’s constant through, , with being number of moment bearing ions per formula unit (here ). Fig. 2(b) displays the isothermal magnetization measured at K, and the saturation moment estimated by linear extrapolation of high field magnetic isotherm is /Mn, which is consistent with previously reported value(Zeng et al., 2006). The inset in Fig. 2(b) shows the in the low-field region and the little hysteresis with the coercive forces Oe has been observed. On the other hand, the number of magnetic carriers () deduced from the effective Bohr magneton number (, effective moment =) using, with (the effective spin per atom), is 4.53. The Rhodes-Wohlfarth ratio (RWR) defined as , where is also the number of magnetic carriers per atom deduced from direct low temperature measurements of the saturation magnetization, is usually estimated to figure out whether the magnetism is localized or itinerant in origin. The RWR equals 1 for a localized system and larger in an itinerant system (P. and P., 1963; Wohlfarth, 1978; Moriya, 1979). In Mn5Ge3, the RWR equals 1.61 indicating a possible weak itinerant character.
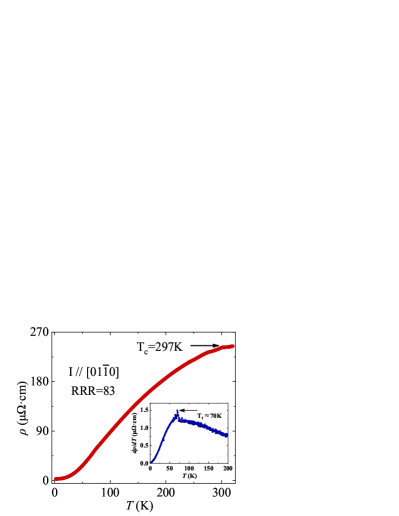
The temperature dependence of resistivity for the Mn5Ge3 single crystal is shown in Fig. 3, and the resistivity monotonically decreases from about 245 cm at 320 K down to about 2.9 cm at 2 K, confirming the metallic characteristic of Mn5Ge3. The residual resistivity ratio (RRR), (300 K) / (2 K) 83, indicates high quality of the sample. There is a clear kink at 297 K in the T curve, which is mainly ascribed to the transition from paramagnetic to ferromagnetic state, consistent with the result of the curve.
In addition to the magnetic phase transition at Curie temperature, there is a cusp near K, which is clearly shown in the d / dT curve. Such a cusp is commonly observed in Mn5Ge3 thin films and nanostructures but never observed in bulk crystal before(Zeng et al., 2003; Tang et al., 2012; Xie et al., 2021). For the first time, we observed it in the single crystals. The appearance of the cusp is usually considered as the emergence of another magnetic ordering. The spatial distribution of magnetization density in Mn5Ge3 has been determined from a polarized neutron diffraction study on single crystals, which revealed two crystallographically nonequivalent Mn sublattices (MnI and MnII)(Forsyth and Brown, 1990). The DFT calculations also suggest the coexistence of two competing ferromagnetic states, collinear and noncollinear spin configurations, in the Mn5Ge3 lattice(Stroppa and Peressi, 2007). Here, the observed cusp in the d / dT curve is attributed to a possible magnetic transition between collinear and noncollinear ferromagnetic states. A similar scenario occurs in the antiferromagnetic Mn5Si3, where a magnetic transition from collinear to noncollinear antiferromagnetic spin states occurrs at K, almost the same as in MnGe3. For Mn5Si3, the noncollinear magnetic structure of the AF1 phase is stable below 66 K, where the noncollinearity is attributed to topological frustration, and the collinear AF2 phase between 66 K and 99 K show the collinear AFM spin configurations(Brown et al., 1992; Brown and Forsyth, 1995; Leciejewicz et al., 2008; Sürgers et al., 2014).
It is well known that the critical behavior for a second-order phase transition can be characterized by a series of interrelated critical exponents. In the vicinity of the critical point, the divergence of correlation length leads to universal scaling laws for the spontaneous magnetization and initial susceptibility . The spontaneous magnetization below , the inverse initial susceptibility above , and the measured magnetization at are characterized by a series of critical exponents , , and , respectively. Subsequently, the mathematical definitions of the exponents from magnetization are described as(Fisher, 1967; Stanley, 1971):
| (2) |
| (3) |
| (4) |
where is the reduced temperature, and , , and are the critical amplitudes. Generally, in the asymptotic critical region (), these critical exponents should follow the Arrott–Noakes equation of state (Arrott and Noakes, 1967):
| (5) |
where is a constant.
According to the fitting of and curves by the modified Arrott plot of vs. , the critical exponents and are obtained. Moreover, is yielded directly by the at the critical temperature based on the Eq.(4).
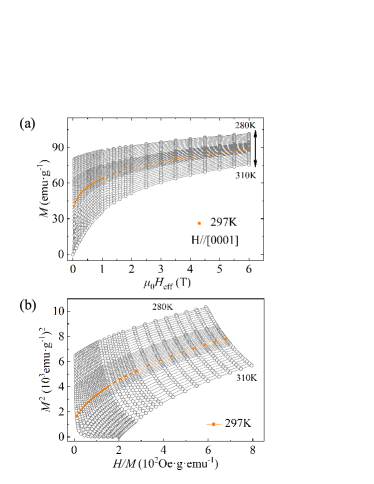
In order to clarify the nature of the PM–FM transition in Mn5Ge3, we measured the isothermal in the temperature range from K to K, as shown in Fig. 4(a). Universally, the critical exponents can be determined by the Arrott plot (Arrott, 1957). For the Landau mean-field model with and (Kaul, 1985), the Arrott–Noakes equation of state evolves into Arrott equation . The Arrott plot of vs. for Mn5Ge3 is depicted in Fig. 4(b). According to Banerjee’s criterion (Banerjee, 1964), the slope of line in the Arrott plot can estimate the order of magnetic transition: the negative slope corresponds to the first-order transition while the positive corresponds to the second order. Therefore, the concave downward curvature clearly indicates that the PM–FM transition in Mn5Ge3 is the second-order phase transition, in agreement with the specific heat measurement (Toliński and Synoradzki, 2014). According to the Arrott plot, isotherms plotted in the form of vs. constitute a series of parallel straight lines around , and the isotherm at the critical temperature should pass through the origin (Arrott, 1957). At the same time, and can be directly obtained from the intercepts on the axis and positive axis, respectively. All the vs. curves in Fig. 4(b) show quasi-straight line with positive slops in high field range. However, all lines show a downward curvature and are not parallel to each other, indicating that the framework of the Landau mean-field model is not applicable in Mn5Ge3.
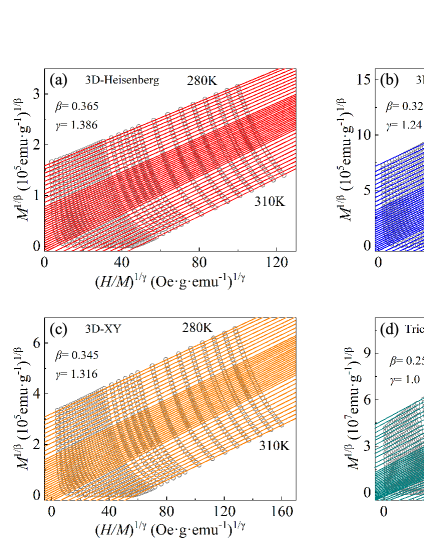
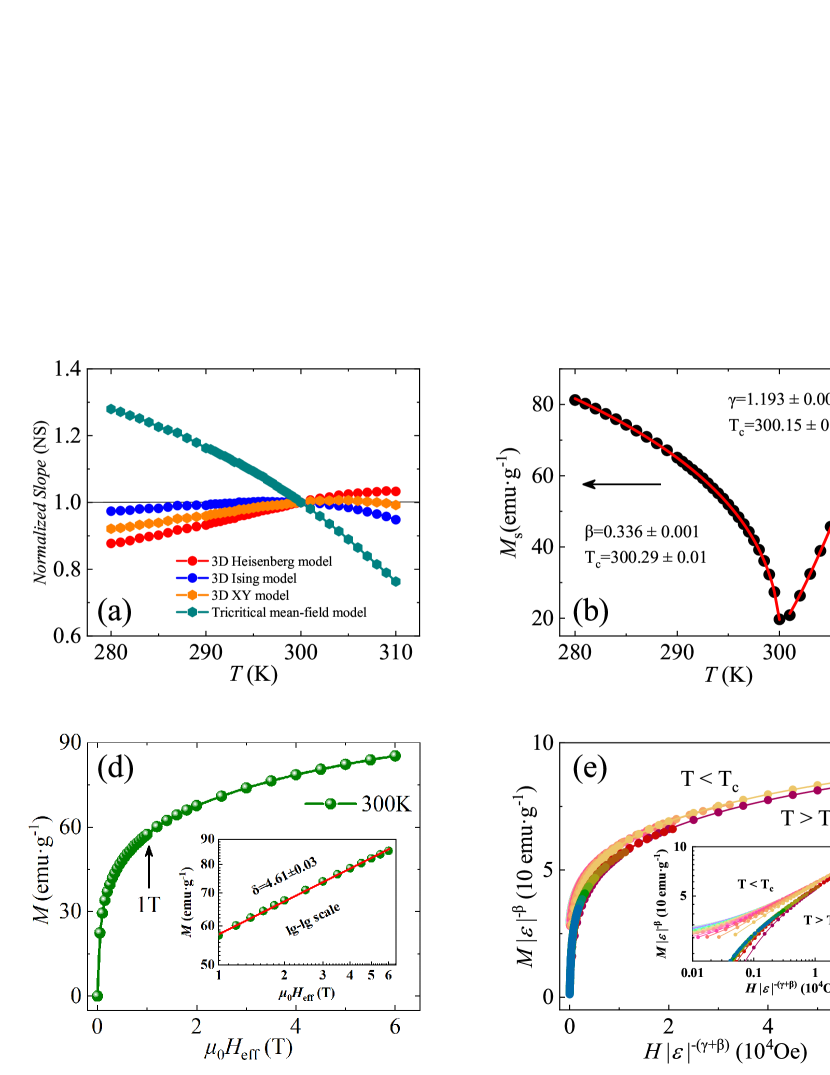
Thus, a modified Arrott plot of vs. is necessary (Arrott and Noakes, 1967), and the modified Arrott plot is given by the Arrott–Noakes equation of state presented in Eq.5. As shown in Figs.5(a–d), the modified Arrott plots are constructed based on four kinds of possible exponents in the 3D-Heisenberg model (), 3D-Ising model (), 3D-XY model (), and tricritical mean-field model () (Kaul, 1985; Zhang et al., 2016). All these four constructions exhibit quasi-straight lines in high field region. Obviously, the unparallel lines in Fig. 5(d) indicate that the tricritical mean-field model is also not satisfied. However, all lines in the modified Arrott plots Figs.5(a–c) are almost parallel to each other. Actually, in an appropriate model, a series of parallel lines with the same slope in high field are obtained, where the slope . Furthermore, the normalized slope (NS) is defined as , which enables us to identify the most suitable model by comparing the with the ideal value “1”(Fan et al., 2010). Plot of vs. for the four different models is shown in Fig. 6(a). Obviously, the of 3D-XY model almost equals 1 above , while that of 3D-Ising model is near 1 below , indicating the critical behavior of Mn5Ge3 may not belong to a single universality class.
The iteration method is employed to extract the precise critical exponents and (Pramanik and Banerjee, 2009). The linear extrapolation from the high field region to the intercepts with the axes and yields reliable values of spontaneous magnetization and inverse initial susceptibility , which are plotted as a function of temperature. According to the fitting of data following the Eqs.(2) and (3), a set of and are obtained, which are used to reconstruct a new modified Arrott plot. Hence, new and are yielded from the linear extrapolation in the high field region. Then another set of and can be obtained. This procedure is repeated until the values of and do not change. Based on this method, the obtained critical exponents are independent on the initial parameters, which confirms these critical exponents are reliable and intrinsic. In this way, the final and with solid fitting curve are presented in Fig. 6(b). The critical exponents with K, and with K for Mn5Ge3, are obtained.
In order to check the accuracy of above analysis, the Kouvel–Fisher (KF) method is employed to fit the critical exponents and critical temperature, which is expressed as(Pramanik and Banerjee, 2009; Kouvel and Fisher, 1964):
| (6) |
| (7) |
The straight lines with slopes and are obtained from vs. and vs. , respectively. The advangtage of KF plot is that no prior knowledge of is required, which is directly defined as the intercept of such fitted straight lines on temperature axis. The KF plot for this sample is presented in Fig. 6(c). From the fitted straight lines, the estimated exponents and are , K and , K, which is consistent with the values from modified Arrott plot as shown in Table I. This implys the estimated values are self-consistent and reliable.
The critical exponents and are given by the iterative modified Arrott plot, while can be obtained according to the Eq.(4). Fig. 6(d) shows the isothermal magnetization at the critical temperature K, and the corresponding lg-lg scale plot is presented in the inset of Fig. 6(d), which gives a straight line with slope according to Eq.(4). By this means, is obtained. To check the reliability of such analysis, is also calculated by using the Widom scaling relation:(Kadanoff, 1966; Widom, 1965, 1964)
| (8) |
which gives and , by using the and obtained from modified Arrott plot and Kouvel–Fisher plot, respectively, which are coincident with those fitted by using Eq.(4). From above analysis, the critical exponents ( and ) are self-consistent and unambiguous.
It is essential to check the reliability of the obtained critical exponents and by scaling analysis. According to the scaling hypothesis, in the asymptotic critical region, the magnetic equation of state is written as:
| (9) |
where are regular functions denoted as for and for . Defining the renormalized magnetization as , and the field as , the scaling equation Eq.(9) can be expressed as
| (10) |
The scaled plotted as a function of scaled will fall on two universal curves: one above and the other below , when the value of and is chosen correctly. It is an crucial criterion for the critical regime.
| Composition | Technique | Reference | (K) | |||||
| Mn5Ge3 | MAP | This work | 300.29 0.01 | 0.336 0.001 | 1.193 0.003 | 4.55 0.009a | ||
| KF | 300.21 0.05 | 0.332 0.002 | 1.18 0.01 | 4.55 0.01a | ||||
| Critical isotherm | 4.61 0.03 | |||||||
| 3D-Heisenberg | Theory | (Kaul, 1985) | 0.365 | 1.386 | 4.8 | |||
| 3D-Ising | Theory | (Kaul, 1985) | 0.325 | 1.24 | 4.82 | |||
| 3D-XY | Theory | (Kaul, 1985) | 0.345 | 1.316 | 4.81 | |||
| Tricritical mean field | Theory | (Banerjee, 1964) | 0.25 | 1.0 | 5.0 |
-
Calculated from Widon scaling relation
Based on the scaling equation Eq.(10), scaled vs. scaled is plotted in Fig. 6(e) with the corresponding lg-lg scale plot in the inset. Prominently, all the data does show two separate branches below and above . The exponents and are further ensured with more rigorous method by plotting vs. (Kaul, 1985), as shown in Fig. 6(f), where all data also falls on two independent branches. In addition, the interactions get properly renormalized in a critical regime following the scaling equation of state, which is expressed as another form,
| (11) |
where is the scaling function. According to Eq.(11), all experimental curves will collapse into a single curve. The inset of Fig. 6(f) shows the vs. for Mn5Ge3, where the experimental data collapse into a single curve with locating at the zero point of the horizontal axis. The reliability of the obtained critical exponents are further checked by the well-rescaled curves(Liu et al., 2017).
The critical exponents of Mn5Ge3, obtained from different analysis techniques and different theoretical models, are listed in Table I for comparison. Previous study (Taroni et al., 2008) has shown that the critical exponent for a 2D magnet should be bounded within a window 0.1 0.25 . The value of in Mn5Ge3 is apparently larger than 0.25, thus exhibiting obvious 3D critical phenomenon, namely, . One can see that the critical exponent of Mn5Ge3 is close to that of 3D-Ising model, and approaches to that of 3D-XY or 3D-Ising model, indicating the critical behavior of Mn5Ge3 may not belong to a single universality class. Anyhow, 3D-XY and 3D-Ising models both indicate the existence of short-range magnetic interaction in Mn5Ge3. Subsequently, it is essential to understand the nature as well as the range of interaction in this compound. It is well known that the universality class of the magnetic phase transition is dictated by in the homogeneous magnet. This kind of magnetic ordering has been treated as an attractive interaction of spins, where a renormalization group theory analysis suggests decays with distance as (Fisher et al., 1972):
| (12) |
where stands for the spatial dimensionality and is a positive constant. Additionally, the susceptibility exponent is predicted as
| (13) | ||||
where and , is the spin dimensionality. As , the Heisenberg model applies to the 3D isotropic magnet, where decreases faster than . As , the mean-field model is satisfied, where decreases slower than . To obtain the values of , , and for Mn5Ge3, the method described in Ref.(Fisher et al., 1972) is adopted in this work, where is initially adjusted according to Eq.(13) with several sets of to get a proper that is close to the experimental value ( 1.193). The obtained is then used to calculate other critical exponents by the following equations: , , , and . This procedure is repeated for different sets of . Finally, and give the critical exponents of , , and , which match well with experimental values. The value of locates between and , which means that the spin interactions decay with distance as . Thus, the interactions are extended beyond the nearest neighbors, which may be ascribed to the almost same interatomic distance for NN MnI–MnII, NN MnII–MnII, NNN MnII–MnII ( Å)) and the unequal magnitude of exchange strengths in Mn–Mn interactions.
Early specific heat investigation shows that the transition temperature shifts slightly towards lower temperatures with an increasing field applied below T, similar to an antiferromagnetic transition (Toliński and Synoradzki, 2014). Besides the most positive exchange constants between Mn atoms, DFT calculations with the relaxed or the rigid model for Mn5Ge3 both demonstrate that there also exist a small negative exchange constant indicating the existence of antiferromagnetic interactions(Slipukhina et al., 2009). As is known, difference in distances between Mn atoms lead to instability of the moment, and different set of Mn–Mn interactions with unequal magnitude of exchange strengths exist in Mn5Ge3 (Forsyth and Brown, 1990). Accordingly, the non-collinearity of Mn5Ge3 may be attributed to the combined effects of Mn moment instability and the coexistence of FM and small AFM coupling. These results are consistent with our resistivity measurements and previous studies(Zeng et al., 2003; Tang et al., 2012; Truong et al., 2015). Subsequently, the existence of noncollinear spin configurations leads to a small deviation of obtained critical exponents from those for standard 3D-Ising model [see Table I]. Therefore, our results indicate that the spin interaction in Mn5Ge3 is of 3D-Ising type coupling.
IV Conclusions
In summary, we have investigated the magnetic critical behavior in vicinity of the PM to FM phase transition in the itinerant ferromagnet Mn5Ge3, with its at about 300 K. The estimated critical exponents and values from various techniques and theoretical models show good consistency with each other and follow the scaling behavior well, confirming that the obtained exponents are unambiguous and intrinsic. The critical exponents suggest a second order phase transition and are close to the values for the 3D-Ising model. The magnetic exchange is found to decay as and the spin interactions are extended beyond the nearest neighbors, which may be related to the close interatomic distance among Mn atoms and different set of Mn-Mn interactions with unequal magnitude of exchange strengths. Furthermore, the existence of noncollinear spin configurations in Mn5Ge3 leads to a small deviation of obtained critical exponents from those for standard 3D-Ising model.
V Acknownledgments
This work is supported by the National Natural Science Foundation of China (Grant Nos. 11874422 and 12074425), the National Key R&D Program of China (Grant No. 2019YFA0308602), and the Research Funds of Renmin University of China (Grant No. 19XNLG18).
References
- Shimizu (1981) M. Shimizu, Rep. Prog. Phys. 44, 329 (1981).
- Saxena et al. (2000) S. S. Saxena, P. Agarwal, K. Ahilan, F. M. Grosche, R. K. W. Haselwimmer, M. J. Steiner, E. Pugh, I. R. Walker, S. R. Julian, P. Monthoux, G. G. Lonzarich, A. Huxley, I. Sheikin, D. Braithwaite, and J. Flouquet, Nature 406, 587 (2000).
- Aoki et al. (2001) D. Aoki, A. Huxley, E. Ressouche, D. Braithwaite, J. Flouquet, J.-P. Brison, E. Lhotel, and C. Paulsen, Nature 413, 613 (2001).
- Rößler et al. (2006) U. K. Rößler, A. N. Bogdanov, and C. Pfleiderer, Nature 442, 797 (2006).
- Pfleiderer et al. (2001) C. Pfleiderer, S. R. Julian, and G. G. Lonzarich, Nature 414, 427 (2001).
- Manyala et al. (2000) N. Manyala, Y. Sidis, J. F. DiTusa, G. Aeppli, D. P. Young, and Z. Fisk, Nature 404, 581 (2000).
- Pfleiderer et al. (1997) C. Pfleiderer, G. J. McMullan, S. R. Julian, and G. G. Lonzarich, Phys. Rev. B 55, 8330 (1997).
- Tateiwa et al. (2018) N. Tateiwa, J. c. v. Pospíšil, Y. Haga, and E. Yamamoto, Phys. Rev. B 97, 064423 (2018).
- Zhang et al. (2015) L. Zhang, D. Menzel, C. Jin, H. Du, M. Ge, C. Zhang, L. Pi, M. Tian, and Y. Zhang, Phys. Rev. B 91, 024403 (2015).
- Pfleiderer and Huxley (2002) C. Pfleiderer and A. D. Huxley, Phys. Rev. Lett. 89, 147005 (2002).
- Liu et al. (2017) Y. Liu, V. N. Ivanovski, and C. Petrovic, Phys. Rev. B 96, 144429 (2017).
- Zhang et al. (2016) L. Zhang, H. Han, M. Ge, H. Du, C. Jin, W. Wei, J. Fan, C. Zhang, L. Pi, and Y. Zhang, Sci. Rep. 6, 22397 (2016).
- Tawara and Sato (1963) Y. Tawara and K. Sato, J. Phys. Soc. Japan 18, 773 (1963).
- Panguluri et al. (2005) R. P. Panguluri, C. Zeng, H. H. Weitering, J. M. Sullivan, S. C. Erwin, and B. Nadgorny, Phys. Status Solidi B, 242, R67 (2005).
- Dung et al. (2013) D. D. Dung, D. Odkhuu, L. Thanh Vinh, S. Cheol Hong, and S. Cho, J. Appl. Phys. 114, 073906 (2013).
- Picozzi et al. (2004) S. Picozzi, A. Continenza, and A. J. Freeman, Phys. Rev. B 70, 235205 (2004).
- Jackson et al. (1965) R. F. Jackson, R. G. Scurlock, D. B. Utton, and E. M. Wray, Proc. Phys. Soc. 85, 127 (1965).
- Kappel et al. (1976) G. Kappel, G. Fischer, and A. Jaéglé, Phys. Status Solidi A, 34, 691 (1976).
- Forsyth and Brown (1990) J. B. Forsyth and P. J. Brown, J. Phys. Condens. Matter 2, 2713 (1990).
- Xie et al. (2021) Y. Xie, Y. Yuan, M. Birowska, C. Zhang, L. Cao, M. Wang, J. Grenzer, D. Kriegner, P. Doležal, Y.-J. Zeng, X. Zhang, M. Helm, S. Zhou, and S. Prucnal, Phys. Rev. B 104, 064416 (2021).
- Stroppa and Peressi (2007) A. Stroppa and M. Peressi, Phys. Status Solidi A, 204, 44 (2007).
- Zeng et al. (2003) C. Zeng, S. C. Erwin, L. C. Feldman, A. P. Li, R. Jin, Y. Song, J. R. Thompson, and H. H. Weitering, Appl. Phys. Lett. 83, 5002 (2003).
- Tang et al. (2012) J. Tang, C.-Y. Wang, W. Jiang, L.-T. Chang, Y. Fan, M. Chan, C. Wu, M.-H. Hung, P.-H. Liu, H.-J. Yang, H.-Y. Tuan, L.-J. Chen, and K. L. Wang, Nano Lett. 12, 6372 (2012).
- Brown et al. (1992) P. J. Brown, J. B. Forsyth, V. Nunez, and F. Tasset, J. Phys. Condens. Matter 4, 10025 (1992).
- Brown and Forsyth (1995) P. J. Brown and J. B. Forsyth, J. Phys. Condens. Matter 7, 7619 (1995).
- Sürgers et al. (2014) C. Sürgers, G. Fischer, P. Winkel, and H. v. Löhneysen, Nat. Commun. 5, 3400 (2014).
- Slipukhina et al. (2009) I. Slipukhina, E. Arras, P. Mavropoulos, and P. Pochet, Appl. Phys. Lett. 94, 192505 (2009).
- Zheng et al. (2013) T. F. Zheng, Y. G. Shi, J. B. Li, J. Y. Fan, D. N. Shi, L. Y. Lv, and S. L. Tang, Phys. Status Solidi B, 250, 1445 (2013).
- Toliński and Synoradzki (2014) T. Toliński and K. Synoradzki, Intermetallics 47, 1 (2014).
- Kang et al. (2017) K. H. Kang, J. H. Kim, Y. Oh, E. J. Kim, and C. S. Yoon, J. Alloys Compd. 696, 931 (2017).
- Lalita et al. (2021) Lalita, A. Rathi, Pardeep, A. K. Verma, B. Gahtori, A. Gautam, R. Pant, P. Babu, and G. Basheed, J. Alloys Compd. 876, 159908 (2021).
- Kaul (1985) S. Kaul, J. Magn. Magn. Mater. 53, 5 (1985).
- Fisher et al. (1972) M. E. Fisher, S.-k. Ma, and B. G. Nickel, Phys. Rev. Lett. 29, 917 (1972).
- Zeng et al. (2006) C. Zeng, Y. Yao, Q. Niu, and H. H. Weitering, Phys. Rev. Lett. 96, 037204 (2006).
- P. and P. (1963) R. P. and W. E. P., Proc. R. Soc. Lond. A 273, 247 (1963).
- Wohlfarth (1978) E. Wohlfarth, J. Magn. Magn. Mater. 7, 113 (1978).
- Moriya (1979) T. Moriya, J. Magn. Magn. Mater. 14, 1 (1979).
- Leciejewicz et al. (2008) J. Leciejewicz, B. Penc, A. Szytuła, A. Jezierski, and A. Zygmunt, Acta Phys. Pol. 113, 1193 (2008).
- Fisher (1967) M. E. Fisher, Rep. Prog. Phys. 30, 615 (1967).
- Stanley (1971) H. E. Stanley, Phase transitions and critical phenomena (Clarendon Press, Oxford, 1971).
- Arrott and Noakes (1967) A. Arrott and J. E. Noakes, Phys. Rev. Lett. 19, 786 (1967).
- Arrott (1957) A. Arrott, Phys. Rev. 108, 1394 (1957).
- Banerjee (1964) B. Banerjee, Physics Letters 12, 16 (1964).
- Fan et al. (2010) J. Fan, L. Ling, B. Hong, L. Zhang, L. Pi, and Y. Zhang, Phys. Rev. B 81, 144426 (2010).
- Pramanik and Banerjee (2009) A. K. Pramanik and A. Banerjee, Phys. Rev. B 79, 214426 (2009).
- Kouvel and Fisher (1964) J. S. Kouvel and M. E. Fisher, Phys. Rev. 136, A1626 (1964).
- Kadanoff (1966) L. P. Kadanoff, Physics Physique Fizika 2, 263 (1966).
- Widom (1965) B. Widom, J. Chem. Phys. 43, 3898 (1965).
- Widom (1964) B. Widom, J. Chem. Phys. 41, 1633 (1964).
- Taroni et al. (2008) A. Taroni, S. T. Bramwell, and P. C. W. Holdsworth, J. Phys. Condens. Matter 20, 275233 (2008).
- Truong et al. (2015) A. Truong, A. O. Watanabe, P. A. Mortemousque, K. Ando, T. Sato, T. Taniyama, and K. M. Itoh, Phys. Rev. B 91, 214425 (2015).