COOL-LAMPS II. Characterizing the Size and Star Formation History of a Bright Strongly Lensed Early-Type Galaxy at Redshift 1.02
Abstract
We present COOL J1323+0343, an early-type galaxy at , strongly lensed by a cluster of galaxies at . This object was originally imaged by DECaLS and noted as a gravitational lens by COOL-LAMPS, a collaboration initiated to find strong-lensing systems in recent public optical imaging data, and confirmed with follow-up data. With ground-based imaging and optical spectroscopy from the Las Campanas Observatory and the Nordic Optical Telescope, we derive a stellar mass, metallicity, and star-formation history from stellar-population synthesis modeling. The lens modeling implies a total magnification of 113. The median remnant stellar mass in the source plane is M and the median star-formation rate in the source plane is SFR M⊙ yr-1 (log sSFR = -13.4 yr-1) in the youngest two age bins (0-100 Myr), closest to the epoch of observation. Our measurements place COOL J1323+0343 below the characteristic mass of the stellar mass function, making it an especially compelling target that could help clarify how intermediate mass quiescent galaxies evolve. We reconstruct COOL J1323+0343 in the source plane and fit its light profile. This object is below the expected size-evolution of early-type galaxy at this mass with an effective radius r 0.5 kpc. This extraordinarily magnified and bright lensed early-type galaxy offers an exciting opportunity to study the morphology and star formation history of an intermediate mass early-type galaxy in detail at 1 .
1 Introduction
Untangling the mechanisms that fuel the evolution of early-type galaxies (ETGs) is a key component to understanding how the diverse population of galaxies in the local Universe formed. The discovery that ETGs at are much more compact than those in the local Universe, with radii between 3-5 times smaller without much change in mass, is a challenge to our understanding of galaxy evolution (Daddi et al., 2005, Trujillo et al., 2006, Trujillo et al., 2007, van Dokkum et al., 2008, Newman et al., 2010). There are two theories proposed to explain this growth. First, mergers with small, gas-poor satellite galaxies—known as minor mergers. Second, internal mechanisms like adiabatic expansion. Minor dry mergers would increase the radii of ETGs without requiring the addition of a proportional amount of mass (Bezanson et al., 2009, Naab et al., 2009) and some studies found that they are consistent with observations of ETGs at (Belli et al., 2014). Minor mergers may explain the evolution seen at low redshifts, but they are insufficient to explain the rapid evolution and the scatter in radii at higher redshifts (Fan et al., 2010, Newman et al., 2012, Nipoti et al., 2012). Furthermore, surveys have struggled to find the number of companion satellites required (Newman et al., 2012). Adiabatic expansion triggered by AGN feedback, in combination with dry mergers, might resolve these inconsistencies (Fan et al., 2010).
Another potential explanation is progenitor bias—the idea that the processes that quench ETGs at lower redshifts are different from those at and, as a result, latecomers to the ETG population have larger radii. Number density studies found strong evidence that progenitor bias is not sufficient to explain the growth of massive ETGs (Newman et al., 2010, Belli et al., 2014, Belli et al., 2015). For intermediate-mass ETGs (those with 10.5 < logM∗ < 11), some studies found that progenitor bias explains the majority of the observed evolution after (Carollo et al., 2013, Fagioli et al., 2016). However, many other studies found evidence that individual growth is needed, at least in part, to explain the growth of intermediate-mass ETGs (Cassata et al., 2011, Newman et al., 2012, Whitaker et al., 2012, Belli et al., 2014, van der Wel et al., 2014, Belli et al., 2015).
The mechanisms that fuel the evolution of ETGs after they quench affects the morphology of evolving objects. Dry mergers with low mass objects result in central regions that have similar densities to very compact ETGs at , with an envelope of low-density material, high Sérsic indices (), and negative metallicity gradients (Hopkins et al., 2009, Hilz et al., 2013). Adiabatic processes caused by quasar feedback would make the central regions of ETGs less dense in the local Universe than they are at (Fan et al., 2010). In-depth morphological studies will also provide clues to how ETGs quench in the first place. Simulations suggest galaxies that quenched "inside-out" through a central starburst have younger central stars than those on the edge (Wellons et al., 2015). However, galaxies that quenched "outside-in" through cold gas accretion have stellar ages that are the same throughout or older central stars (Feldmann et al., 2016).
Spatially resolved imaging and spectroscopy targeting ETGs from should allow us to understand how they quench and what processes drive their structural evolution after star formation ceases. It is difficult to spatially resolve the most compact systems that may be little-modified descendants of compact high-redshift ETGs (e.g., Stockton et al., 2014). Strong gravitational lensing enables study of more representative quiescent galaxies with better spatial resolution and signal-to-noise (e.g., Oldham et al., 2017, Akhshik et al., 2020, Akhshik et al., 2021, Man et al., 2021). Taking advantage of lensing magnification, Akhshik et al. (2020, 2021) were able to measure the age gradients and SFHs across seven spatial bins in a massive quiescent galaxy at . More examples of lensed ETGs, particularly with large magnifications that enable detailed studies, is key to further progress.
We discuss here the discovery and initial characterization of COOL J1323+0343: a compact intermediate mass ETG with old stellar populations which would be near impossible to study in-depth without strong gravitational lensing. COOL J1323+0343 extraordinary magnification of offers the opportunity to study a representative ETG at , and makes it an especially compelling target for more detailed follow-up imaging and spectroscopy.
This paper is structured as follows. Section 2 briefly describes the discovery of COOL J1323+0343. Section 3 describes the follow-up imaging and spectroscopy of COOL J1323+0343. In Section 4, we report the results of stellar-population synthesis modeling. The lens modeling and source plane reconstruction are described in Section 5. Section 6 puts COOL J1323+0343 in context with other ETGs and discusses what we expect to learn from detailed follow-up.
All reported magnitudes are calibrated to the AB system. The fiducial cosmology model used assumes a standard flat cold dark-matter model with a cosmological constant ( CDM), corresponding to WMAP9 observations (Hinshaw et al., 2013). For inferred parameters with uncertainties, we report 16th, 50th and 84th percentile values, unless otherwise specified.
2 Discovery
COOL J1323+0343 (hereafter CJ1323) (13h23m04.12s 03∘43’19.4") was discovered in a search for strong lenses in the Dark Energy Camera Legacy Survey (DECaLS) Data Release 8 (DR8, Dey et al., 2019) by COOL-LAMPS - ChicagO Optically-selected strong Lenses - Located At the Margins of Public Surveys. Details about this search and results will be described in a future publication, so we only provide brief details here.
We found CJ1323 as part of a comprehensive visual search of the northern galactic cap portion of the southern DECaLS dataset. Specifically, CJ1323 was found in a search that examined lines of sight centered on luminous red galaxies, out to a photometric redshift of . Both the foreground lensing cluster and the lensed source were immediately apparent in the DECaLS images; six co-authors examined this particular field yielding an aggregate score of 2.4 on a scale of 0 to 3, where a score of 3 signifies a definite lens.
The foreground lens was first noted as a cluster by Hao et al. (2010) and was included in several other more recent cluster catalogs (e.g., Rykoff et al., 2014, Hilton et al., 2021). CJ1323 was independently discovered as a strong lensing candidate by Huang et al. (2021), and noted as DESI-200.7678+03.7216. They first searched DR7 with a residual neural network (Lanusse et al., 2018) using a training sample consisting of only observed images, but did not find this lens (Huang et al., 2020). Using an improved "shielded" model with a larger training set on the complete DR8 dataset, the neural net presented in Huang et al. (2021) gave CJ1323 a probability of 0.34, well above their threshold of 0.1. Through visual inspection, it was assigned a final grade of 4 on a scale of 1 to 4, which indicates it is among the systems showing the clearest evidence of strong lensing.
3 Follow-Up Observations and Analysis
3.1 Imaging
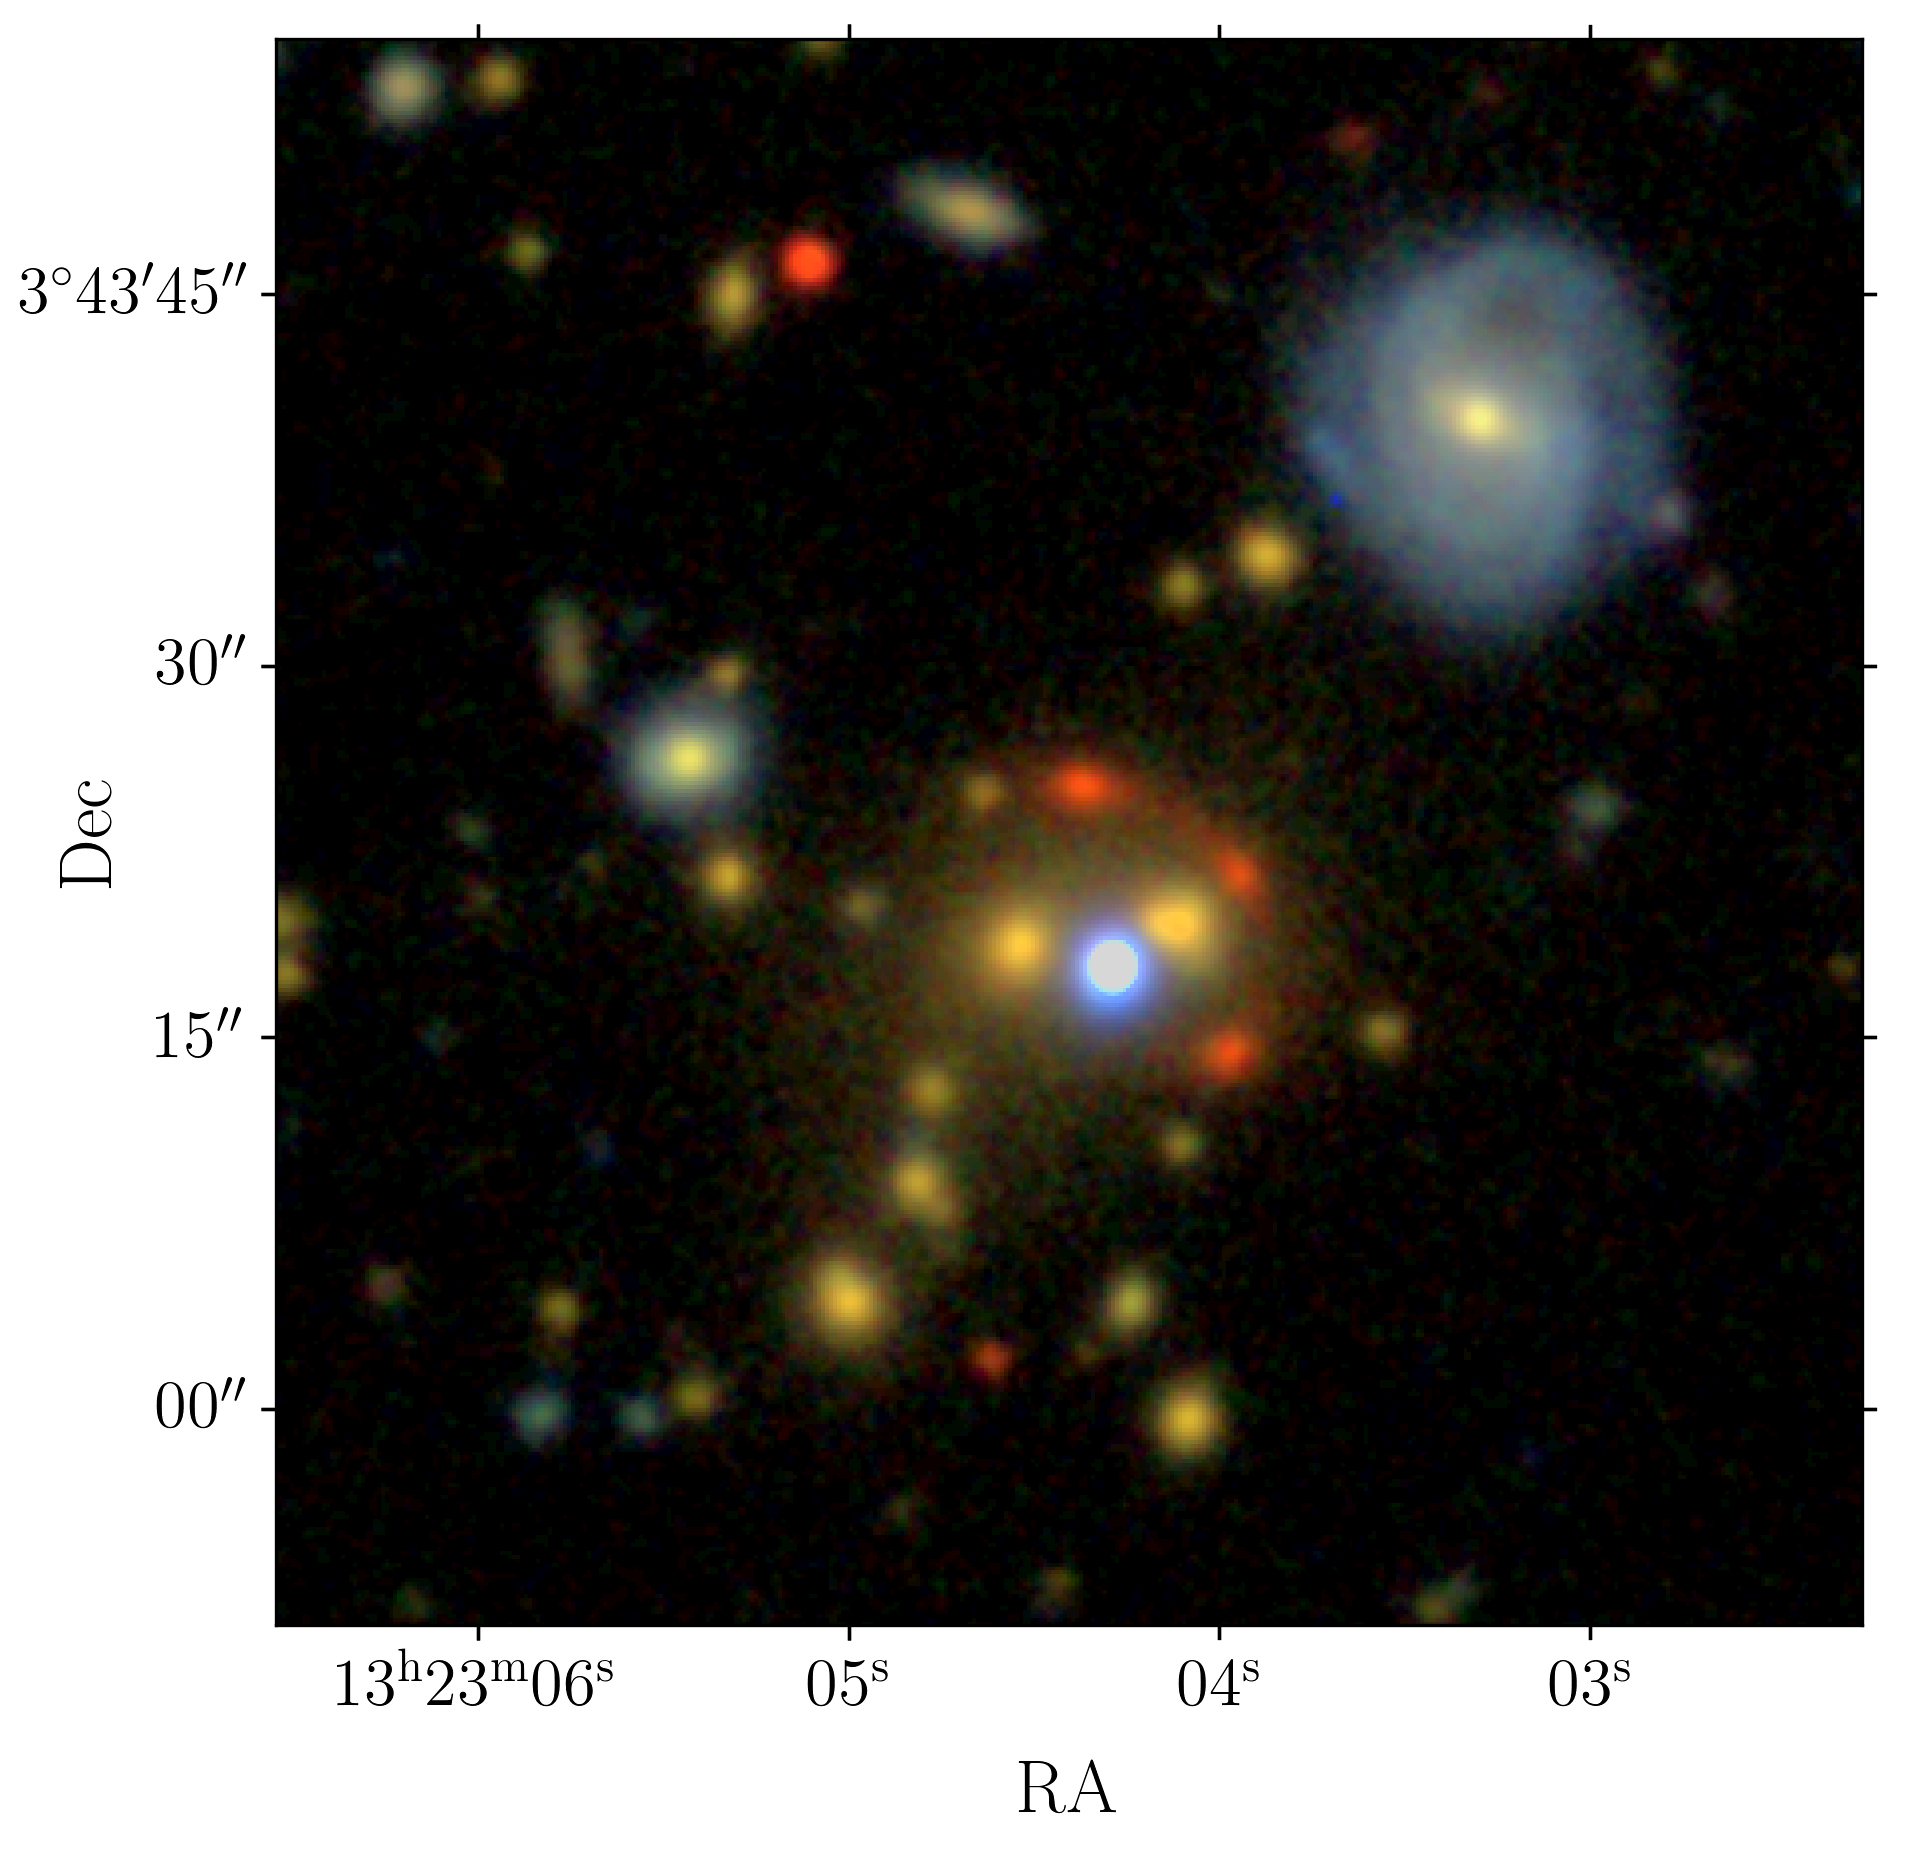
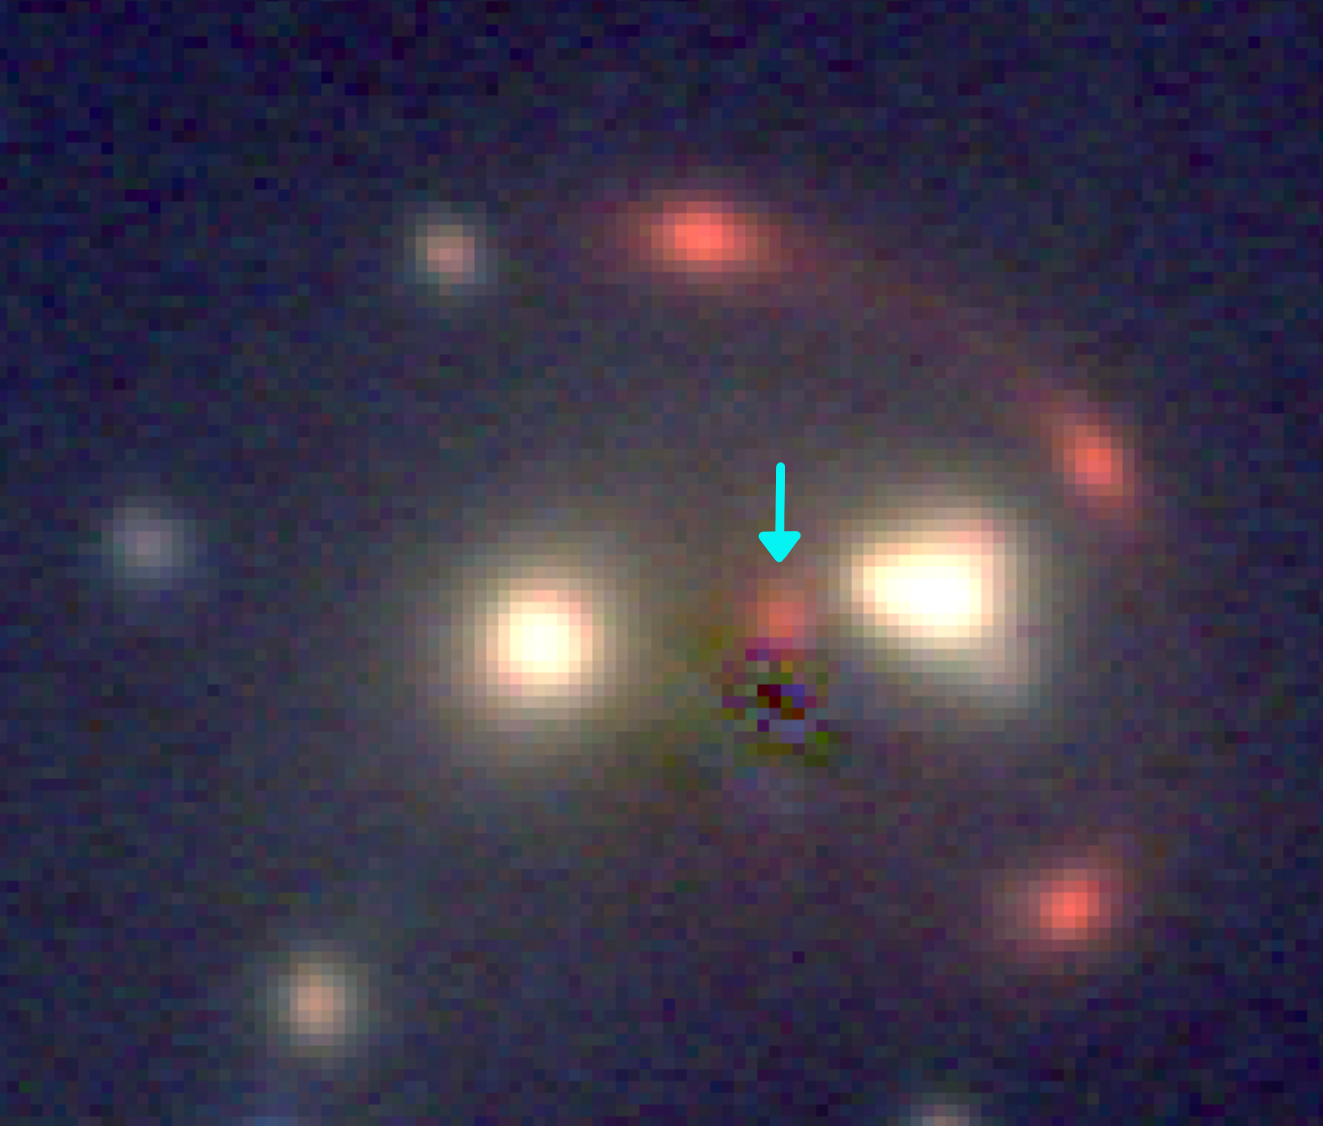
Near-infrared imaging of CJ1323 in the -band was obtained using the FourStar Infrared Camera (FOURSTAR; Persson et al., 2008) on the Magellan/Baade telescope, Chile, on February 22nd, 2020. The total integration time was 183s; the apparent brightness despite the briefness of this total time is a testament to the brightness of the lensed source images. We reduced the data to final astrometrically- and photometrically-calibrated stacked images using a custom pipeline built via IRAF (Tody, 1986, Tody, 1993) and PHOTPIPE (Rest et al., 2005, Garg et al., 2007, Miknaitis et al., 2007). We show a color image combining the -band image with the DECaLS data in Figure 1.
The -band image was calibrated to 2MASS stars (Skrutskie et al., 2006) within the field of view, with the calibration derived automatically by PHOTPIPE routines. Uncertainty on the zeropoint relative to 2MASS is magnitudes. We used the provided zeropoints for the DECaLs data; the uncertainties on these values were insignificant compared to other measurement uncertainties.
While the photometric analysis in this paper was completed primarily with the DECaLs optical imaging and FOURSTAR near-IR imaging, late in the preparation of this manuscript we obtained -band imaging. The images were taken with the Low Dispersion Survey Spectrograph (LDSS-3111http://www.lco.cl/?epkb_post_type_1=ldss-3-user-manual) on the Magellan/Baade telescope, Chile, on January 16th, 2021, for a total integration time of 360s per filter, in subarcsecond seeing conditions. These higher resolution images were used to confirm the lensing configuration implied by the earlier data, as described in Section 5.
3.2 Spectroscopy
Spectroscopic observations of CJ1323 were obtained on April 19th, 2020, using the Alhambra Faint Object Spectrograph and Camera (ALFOSC) at the 2.56m Nordic Optical Telescope (NOT). Two 2400s exposures were obtained using Grism #20 (, Å), using a 13 longslit. Halogen lamps were used for spectroscopic flat fielding, and wavelength solutions were calibrated using HeNe and ThAr arc lamps. Spectrophotometric calibration was performed using observations of the standard star SP1045378. The longslit was placed to sample the most northern and most southern apparent images of the lensed source, and a dither along the slit was made between the two exposures sufficient to place both spectra of the source on slit regions that were clear of other objects.
Reduction to one dimensional wavelength- and flux-calibrated spectra was accomplished using standard routines in IRAF. Sky-subtraction was ultimately accomplished using A-B subtraction of the two dithered spectra; while we explored sky-subtraction using adjacent sky apertures, we found they gave poor results. Light from the star and lens galaxy in between the two source images (see Figure 1) contaminates regions that might otherwise be used as sky apertures and limits the accuracy with which the sky can be subtracted in this case.
3.3 Redshifts
CJ1323 is lensed by GMBCG J2007+03722 (Hao et al., 2010), a galaxy cluster indicated by the abundance of red-sequence galaxies (Gladders & Yee, 2000) easily visible in Figure 1 as elliptical galaxies with a similar orange hue. The two brightest of these galaxies near the cluster center have redshifts reported in the SDSS Legacy Survey at (York et al., 2000; Strauss et al., 2002) and by BOSS at (Eisenstein et al., 2011; Dawson et al., 2013) for the east and west galaxies, respectively. We took the cluster redshift as the average of these two values.
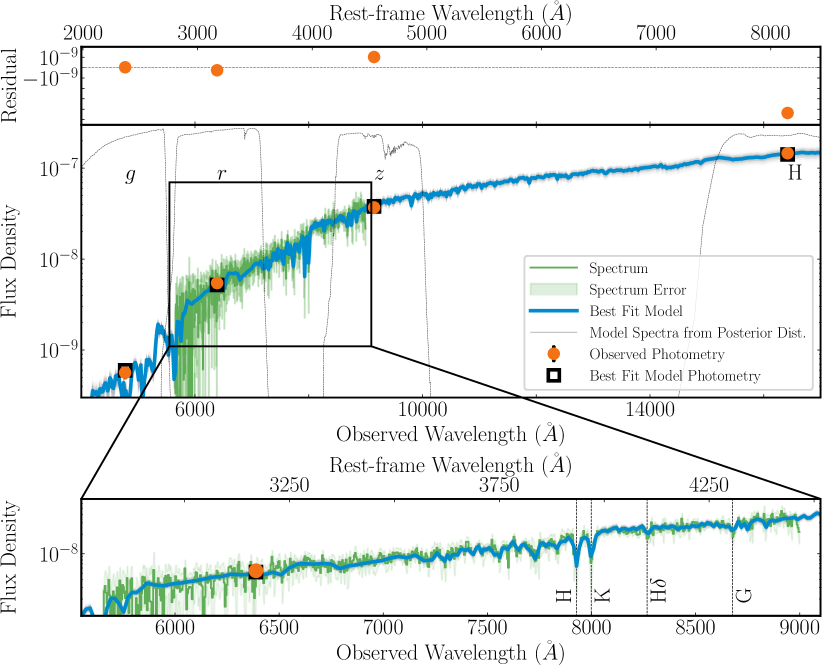
The redshift of the lensed galaxy CJ1323 is , based on Ca H & K, H-, and G-band features clearly visible in the NOT-ALFOSC spectrum shown in the bottom panel of Figure 2.
3.4 Model Photometry with GALFIT
We used the parametric fitting code GALFIT (Peng et al., 2002, 2010) to fit light profiles to lensing cluster galaxies, other line-of-sight contaminants, and the targets of interest. For the -band, we followed the process for making point-spread functions (PSFs) and utilizing GALFIT as described in Khullar et al. (2021). We used one or more 2D Sérsic components to model the light of the components of the arc, galaxy cluster, and other objects. The foreground star between the cluster galaxies was fit with a PSF and an additional Sérsic component to account for residual differences between this star and nearby isolated stars that were used to construct a reference PSF. Statistical magnitude uncertainties were measured as described in Khullar et al. (2021), with the final best fit model image injected into blank regions of the image, and then refit, with the distributions of results from these inject-and-recover tests providing the uncertainties. Additionally, models were built independently by three co-authors, and we found that the systematic uncertainties induced by the decision process inherent in this type of iterative model building was insignificant for the -band measurements.
However, a similar initial analysis of the coarser DECaLS imaging indicated a significant issue with modeling systematics. Due to the overlapping mosaic of sampling from individual integrations that comprise the DECaLS images, there was no nearby isolated bright star to use as a reference, and hence in these data we were forced to use the star in the center of the field as a PSF reference. This was accomplished by first fitting the central region with a GALFIT model, absent any PSF convolution, with the star itself described by a two-component Moffat profile. The best fit model of the star was then extracted and used as a PSF reference for a complete GALFIT model of field. This limitation was possibly the source of the observed systematic differences between completed models. To investigate this further, we used GALFIT to fit nearby galaxies and stars with the targeted lensed images masked so that, after modeling, only the arc remained in the residual image. The photometry was then measured from this residual image using complex arc-like apertures at various scales, in order to measure the photometric curve of growth and a total lensed image magnitude (e.g., Wuyts et al., 2010). This second approach produced results consistent with other methods. In the following analysis, we used the resulting photometry from this method for the filters.
We accounted for Galactic extinction by adjusting our photometry using the values reported in Schlafly & Finkbeiner (2011) as implemented by the NASA/IPAC Extragalactic Database’s extinction calculator.222The NASA/IPAC Extragalactic Database (NED) is funded by the National Aeronautics and Space Administration and operated by the California Institute of Technology. Finally, zeropoint uncertainties and the statistical and systematic uncertainties estimated as above were combined in quadrature to compute total uncertainties for each measurement of each physical object. Table 1 shows total magnitudes for the sum of the three lensed images visible in Figure 1.
| H | ||||
|---|---|---|---|---|
| Arc | 23.12 | 20.66 | 18.58 | 17.09 |
Note. — Data in AB magnitudes. band imaging from DECaLS. -band imaging from Magellan/FOURSTAR infrared imager.
4 Stellar Populations in CJ1323
We derived the properties of stellar populations in CJ1323 by jointly fitting the spectra and photometry in the image plane with Prospector, an MCMC-based stellar population synthesis and parameter inference framework (Conroy & Gunn, 2010; Foreman-Mackey et al., 2013; Johnson & Leja, 2017; Leja et al., 2017). We assumed a non-parametric star formation history (SFH). We used seven age bins: , , , , , , and Myr in lookback time, with 5800 Myr being the age of the Universe at . The age bins were represented by the parameters log(SFR ratios n), referring to the ratio of total star formation in adjacent time bins. These ratios were fit with a continuity prior (see Leja et al., 2019 for details). We ran our model with 1024 walkers, 1024 iterations, and a burn in = [8192, 4096, 2048, 1024, 512].
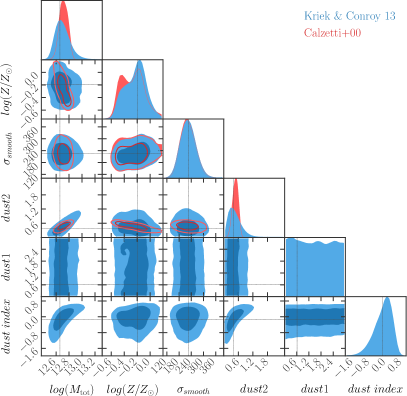
We show corner plots constructed via pyGTC (Bocquet & Carter, 2016) for two different attenuation curves in Figure 3—the Kriek & Conroy (2013) (K&C13) attenuation curve is blue and the Calzetti et al. (2000) (C+00) attenuation curve is red. We show the results of both models to give an idea of the systemic uncertainty introduced by how we model the dust attenuation. For both models, in addition to the star formation ratios, we simultaneously fit the following free parameters: total mass formed in the galaxy (Mtot, in units of M⊙), stellar metallicity log (where ), velocity smoothing in units of kms-1, and spectrum normalization (the ratio of flux between the spectrum and photometry) to account for uncertainties in flux and spectral response calibration. For each chain in the MCMC analysis, we calculated the remnant stellar mass M∗,remnant. This accounted for mass loss from stars that have moved off the main-sequence, as well as stellar mass locked in stellar remnants, and is used as the mass throughout this paper. For the model using the C+00 attenuation curve, dust2 was a free parameter, which sets the overall normalization regardless of the age of stars, in units of opacity at 5500Å. For the model using the K&C13 attenuation curve, dust1 and dust2 were free parameters, which describe the attenuation of stellar light younger and older than years, respectively. Finally, for the K&C13 model, dustindex (dust slope) was a free parameter, which corresponds to the strength of the 2175 Å UV bump. The stellar mass and metallicity distributions of both models are similar. However, the C+00 model’s SFH suggests a slightly slower quenching than the K&C13 model (see Figure 3). Furthermore, for the C+00 model, star formation declines up to the epoch of observation, while the K&C13 model shows a slight rejuvenation in the most recent bin.
We show the best fit SED model using the K&C13 dust attenuation curve in Figure 2 and use the results of this model throughout the paper. The stellar mass and SFH of the arc are found to be robust when fixing stellar metallicity at the best fit value, log = -0.19. The median value for the remnant stellar mass (M∗) in the image plane (i.e., the current value) is log(M/M⊙) = 12.48 and the best fit SFR in the image plane is SFR = 1.98 yr-1, averaged in the two youngest age bins (0-100 Myr). The median SFR = yr-1. (The mismatch between the median and best fit is due the SFR having a strong negative skew, as shown in the top right panel of Figure 4). We find that the best fit dust index is negative as seen in other quiescent and low mass galaxies (e.g., Salim et al., 2018, Whitaker et al., 2021), indicating that the attenuation curve is steeper than the Calzetti et al. (2000) curve, where dustindex = 0.
5 Lens Modeling and Source Plane Reconstruction
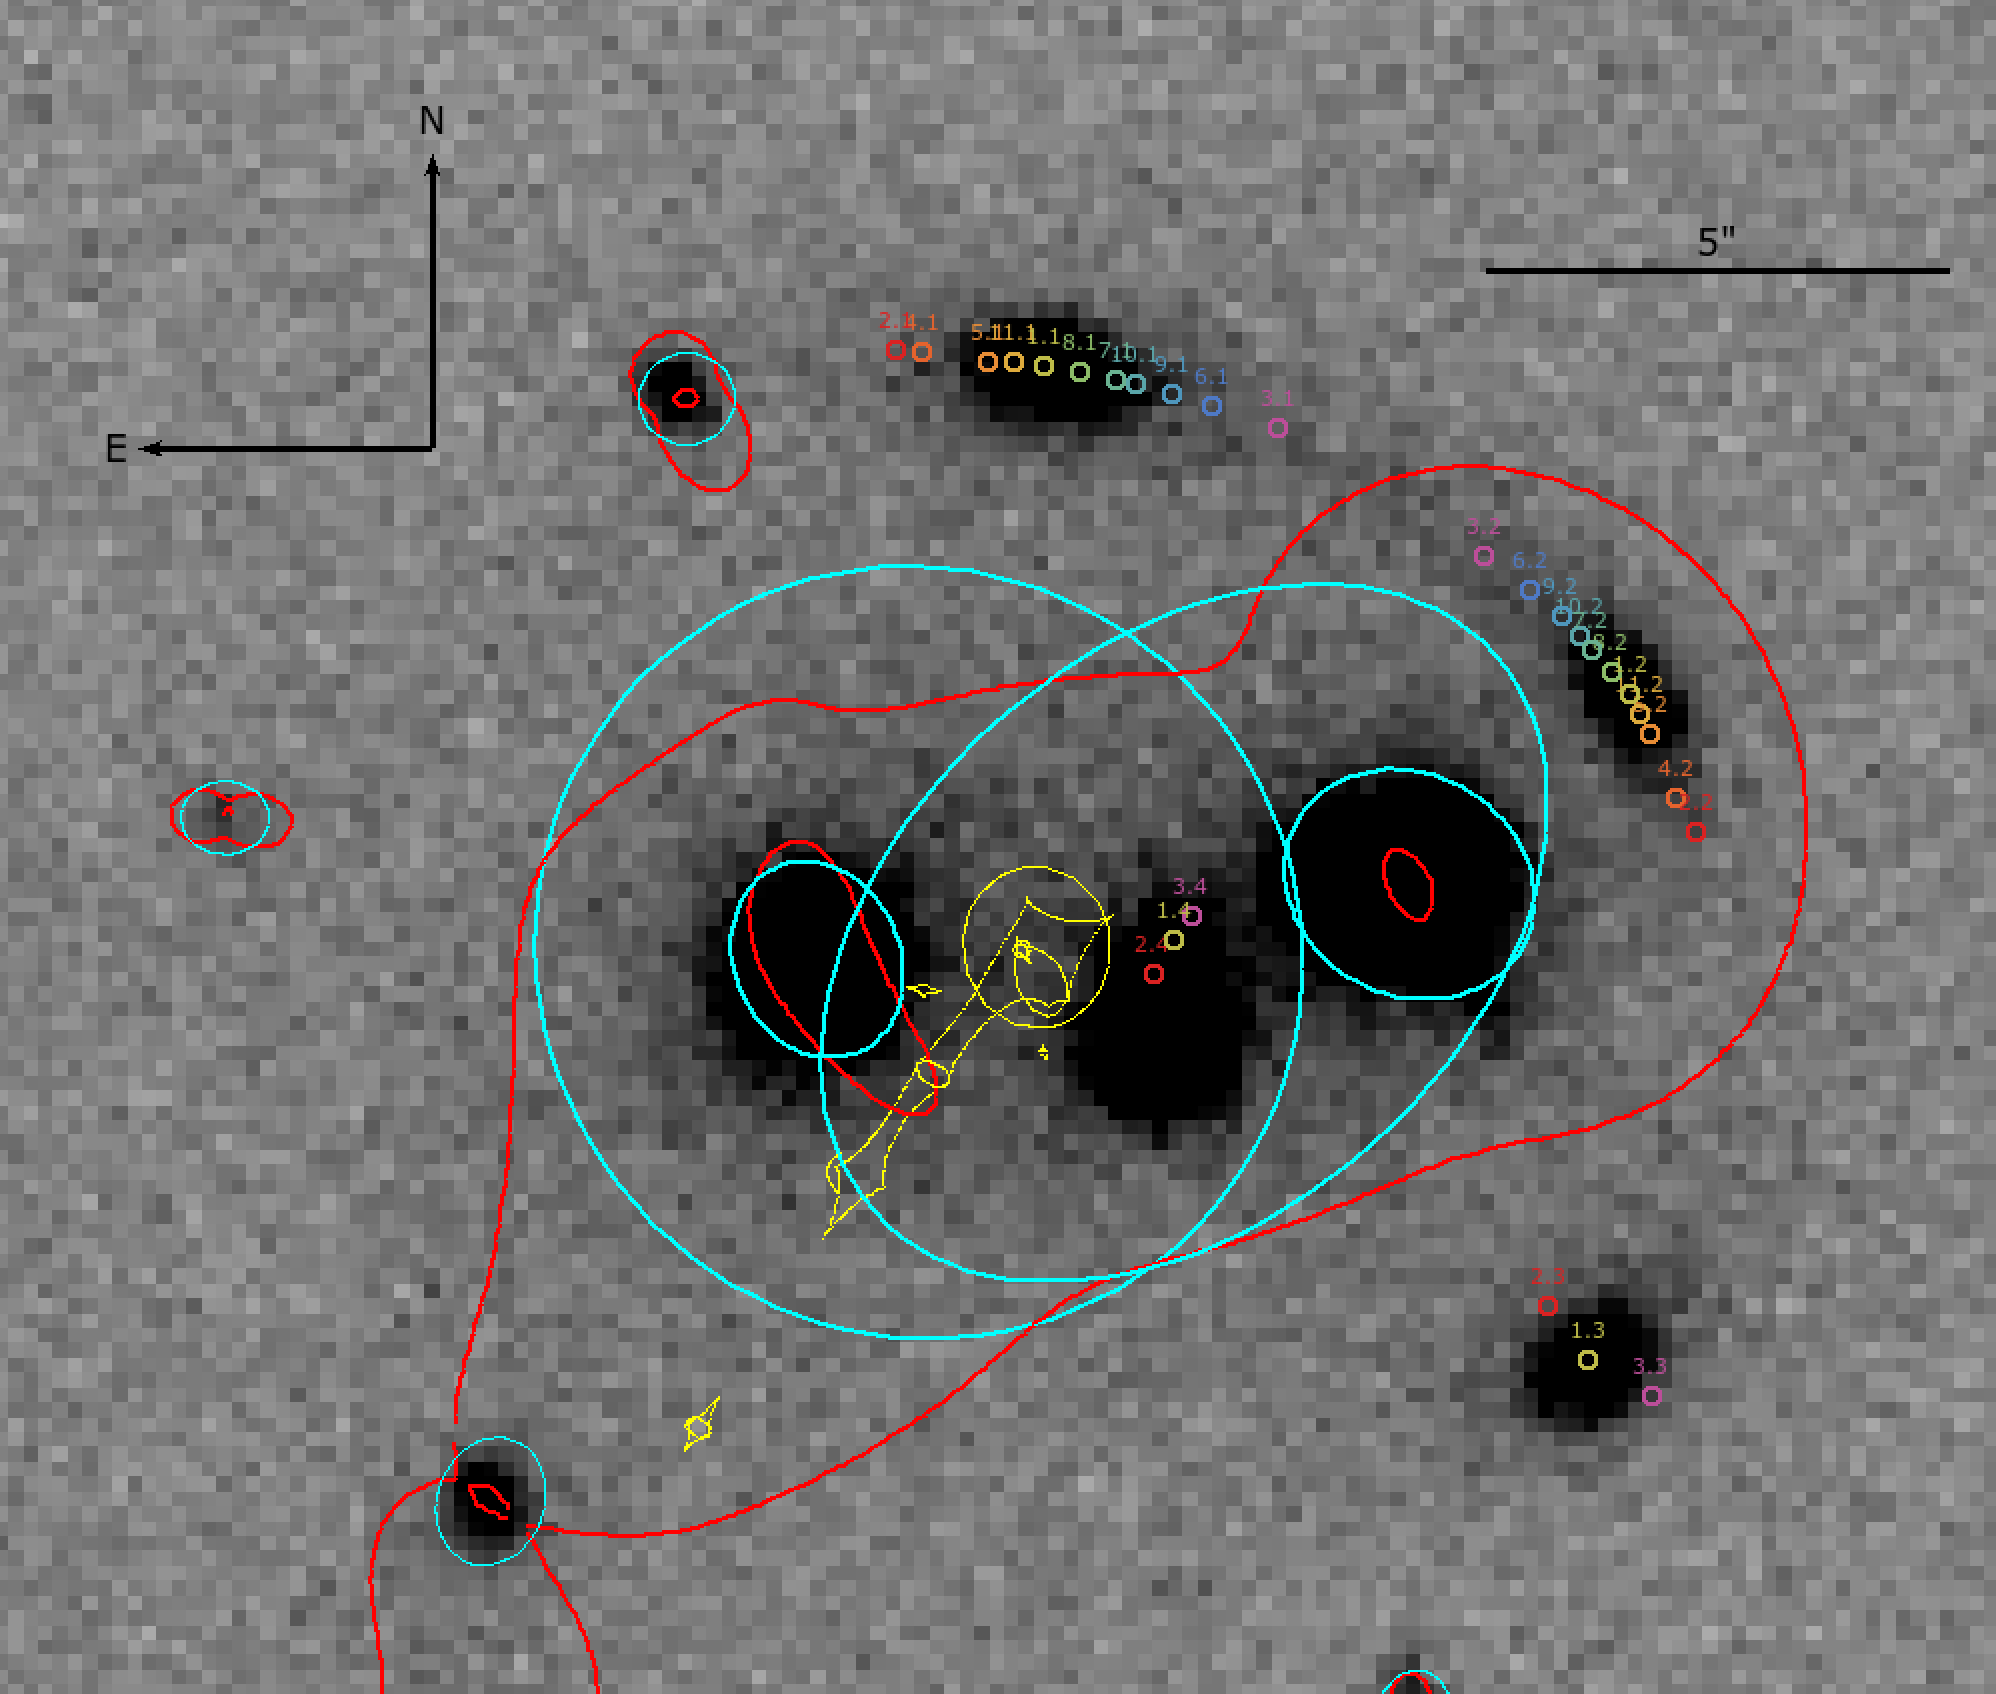
We modeled the mass distribution using LENSTOOL, a parametric lens modeling tool (Jullo et al., 2007). All halos were treated as pseudo isothermal ellipsoids (dPIEs, Elíasdóttir et al., 2007) with parameters and uncertainties estimated using MCMC sampling. The overall modeling process closely followed the process described in Sharon et al. (2020). Astrometric constraints on the lens model were derived from the GALFIT model of the -band image (the best seeing image available) without convolving the model with the PSF reference. This was essentially a parametric component deconvolution of the image. Astrometric reference points were placed on matching isophotes, which allowed us to use not just the centroid of each of the visible lensed images but also several locations along each image as constraints on the lens model. The appropriate configuration for these isophote-matched locations was guided by an initial simple model constructed using a single cluster-scale dPIE and smaller halos on each red-sequence cluster galaxy with positions, ellipticity, and position angles tied to the observed stellar light and the other parameters determined via scaling relations. Using the image labeling shown on the right panel of Figure 6, this initial model strongly suggests two key characteristics for this lensing configuration, namely that : 1) the primary magnification axis of image 3 is nearly orthogonal to images 1 and 2, and 2) that a fourth image should be present near the bright (and confounding) foreground star in the center of the field. While attempts to recover this fourth image from the initial DECaLS imaging were unsuccessful, additional optical imaging taken as described in Section 3.1 does clearly show the expected fourth image, once the stellar image was fit and removed using GALFIT (see the right panel of Figure 5).
The final lens model used four individually-described dPIE components—two fixed on the two visible bright central galaxies, and two cluster-scale halos allowed to vary about those positions. Other cluster-galaxy mass contributions were added via a scaling relation, as described above. The left panel of Figure 5 shows the caustic and critical curves for this final model, and the input constraints derived from the -band image that informs the model.
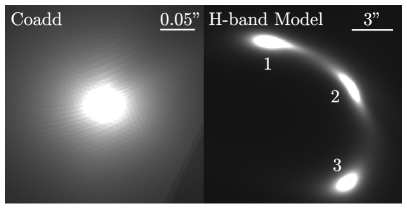
With a final lens model in hand, we reconstructed CJ1323 in the source plane with PyLenstool, a Python-based wrapper for LENSTOOL.333http://pylenstool.readthedocs.io/ The reconstructions were made with the un-convolved -band GALFIT model as described above. We added together the source plane reconstructions, centered on the brightest point as determined by a single Sérsic component GALFIT model. We show the combined image in the left panel of Figure 6. We then fit a Sérsic and sky component to the coadded image using GALFIT and report the effective radius, Sérsic index, and axis ratio in Table 2. To understand the variation in the source plane morphology of CJ1323 introduced by uncertainties in the model, we created combined images using the first 300 realizations of the lens model produced using the bayesCleanlens method in LENSTOOL. We report the median and uncertainty from the GALFIT models of these combined images in Table 2. We find that all source plane reconstructions had and , showing that our modeling is robust against degeneracies between and .
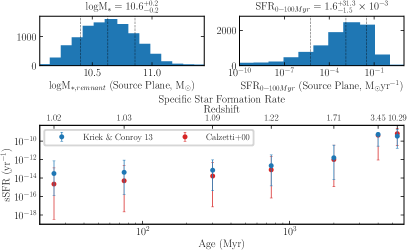
We projected a contour of the image plane half light area into the source plane using the lens model. The resulting area in the source plane divided by the original image plane area is the magnification. The best fit magnifications are , , and for image 1, 2, and 3 respectively. The best fit total magnification is = 113 and the median is . The magnification uncertainty was found using the same method on 300 realizations of the lens model. This gives a demagnified remnant median log = 10.63 and the demagnified best fit SFR = yr-1 (from 0-100 Myr) (the median SFR = yr-1). We calculated the errors on the demagnified remnant mass and SFR by sampling the posterior distribution in concert with magnifications from realizations of the lens model. The results are displayed in the top left and right plots in Figure 4.
| Image | Sérsic Index | Axis Ratio | |
|---|---|---|---|
| Best Fit | 0.49 | 2.3 | 0.88 |
| Posterior Distribution | 0.58 | 2.2 | 0.86 |
6 Discussion and Future Work
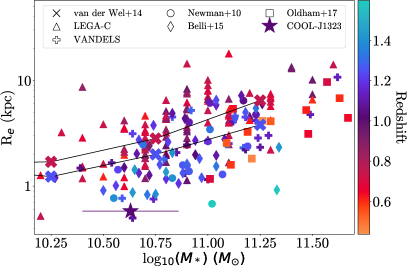
CJ1323 is a compact, intermediate mass quiescent galaxy at 1—an object difficult to observe without gravitational lensing. Its stellar mass is times the characteristic mass of the stellar mass function reported in Muzzin et al. (2013) for quiescent galaxies at . Compared with van der Wel et al. (2014)’s expected size evolution for an ETG with M, CJ1323 is small at 0.3 times the expected radius at its redshift, below the relation. Furthermore, the stellar density of CJ1323 is kpc-3, comparable to compact ETGs at (e.g., Kriek et al., 2008, van Dokkum et al., 2008). This size is consistent with it being an unmodified relic ETG, that is, an early-type galaxy that quenched before and has not grown since (e.g., Stockton et al., 2014, Hsu et al., 2014, Trujillo et al., 2014, Ferré-Mateu et al., 2017).
The Sérsic index of the combined source plane reconstructions is 2.3, indicating CJ1323 is more disky than a standard de Vaucouleurs profile. "Inside-out" growth leads disky ETGs at high redshifts to become elliptical in the local Universe as their outer envelopes build-up (van Dokkum et al., 2010). Most samples of intermediate redshift ETGs found that a significant portion of their objects are disky (e.g., Stockton et al., 2010, Stockton et al., 2014, Hsu et al., 2014). However, all the source galaxies in Oldham et al. (2017)’s survey of intermediate redshift, , early-type/early-type lens systems (EELs) had at least one component with . That is, they have a bulge and are not disky. As Oldham et al. (2017) noted, this could indicate that their targets are more evolved counterparts of objects like CJ1323 and the ETGs in previous studies. We caution that source plane reconstructions based on ground based data are quite uncertain, and the preliminary results on morphology presented here should not be over-interpreted. Nevertheless, the suggestion from the apparent morphology and size is that CJ1323 is at an early stage of its morphological evolution post-quenching.
The SFH makes it clear that CJ1323 has been quiescent for at least 1 Gyr before the epoch of observation. Man et al. (2021)’s deep spectroscopic study found all three lensed quiescent galaxies had short bursts of star formation and then quenched quickly, with all three lying on the Gyr quenching curve from Belli et al. (2019). Artificial U-V and V-J colors (1.67 and 0.88, respectively) from the best fit SED model for CJ1323 also lie on this curve. Deeper spectroscopy will reveal more about the SFH of CJ1323, including quenching time scale and age. While better resolution data is needed to fit a more granular SFH, CJ1323’s SFH, Sérsic index, radius, and stellar density suggest that it has not significantly changed since cosmic noon. If CJ1323 is an unmodified relic, it will give us the opportunity to study the initial conditions of ETGs in exquisite detail. If not, future studies could uncover evidence for the post-quenching evolutionary mechanisms that fuel the growth in radii of ETGs.
The results from this preliminary data make it clear that CJ1323 is a compelling target. Its total -band magnitude of 17 makes it one of the two brightest lensed ETGs known, comparable only to MRG-M0138 (Newman et al., 2018, Jafariyazani et al., 2020). CJ1323 can help probe the processes that cause ETG morphology to change so significantly. Resolved spectra—that are in principle possible because of CJ1323’s extreme magnification—would clarify how it quenched by providing a more detailed and better resolved SFH, both spatially and temporally. With sharper imaging, a more constrained lens model could be developed, yielding a more accurate and precise source-plane morphology of COOL J1323+0343, aided by near orthogonal magnifications provided by the different lensed images.
These observations are now being pursued for CJ1323 and several other lensed ETGs discovered by the COOL-LAMPS collaboration.
Acknowledgements
This work is supported by The College Undergraduate program at the University of Chicago, and the Department of Astronomy and Astrophysics at the University of Chicago.
This paper includes data gathered with the 6.5 meter Magellan Telescopes located at Las Campanas Observatory, Chile.
Based in part on observations made with the Nordic Optical Telescope, operated by the Nordic Optical Telescope Scientific Association at the Observatorio del Roque de los Muchachos, La Palma, Spain, of the Instituto de Astrofisica de Canarias. The data presented here were obtained in part with ALFOSC, which is provided by the Instituto de Astrofisica de Andalucia (IAA) under a joint agreement with the University of Copenhagen and NOTSA.
Funding for the SDSS and SDSS-II has been provided by the Alfred P. Sloan Foundation, the Participating Institutions, the National Science Foundation, the U.S. Department of Energy, the National Aeronautics and Space Administration, the Japanese Monbukagakusho, the Max Planck Society, and the Higher Education Funding Council for England. The SDSS Web Site is http://www.sdss.org/.
The SDSS is managed by the Astrophysical Research Consortium for the Participating Institutions. The Participating Institutions are the American Museum of Natural History, Astrophysical Institute Potsdam, University of Basel, University of Cambridge, Case Western Reserve University, University of Chicago, Drexel University, Fermilab, the Institute for Advanced Study, the Japan Participation Group, Johns Hopkins University, the Joint Institute for Nuclear Astrophysics, the Kavli Institute for Particle Astrophysics and Cosmology, the Korean Scientist Group, the Chinese Academy of Sciences (LAMOST), Los Alamos National Laboratory, the Max-Planck-Institute for Astronomy (MPIA), the Max-Planck-Institute for Astrophysics (MPA), New Mexico State University, Ohio State University, University of Pittsburgh, University of Portsmouth, Princeton University, the United States Naval Observatory, and the University of Washington.
Funding for SDSS-III has been provided by the Alfred P. Sloan Foundation, the Participating Institutions, the National Science Foundation, and the U.S. Department of Energy Office of Science. The SDSS-III web site is http://www.sdss3.org/.
SDSS-III is managed by the Astrophysical Research Consortium for the Participating Institutions of the SDSS-III Collaboration including the University of Arizona, the Brazilian Participation Group, Brookhaven National Laboratory, Carnegie Mellon University, University of Florida, the French Participation Group, the German Participation Group, Harvard University, the Instituto de Astrofisica de Canarias, the Michigan State/Notre Dame/JINA Participation Group, Johns Hopkins University, Lawrence Berkeley National Laboratory, Max Planck Institute for Astrophysics, Max Planck Institute for Extraterrestrial Physics, New Mexico State University, New York University, Ohio State University, Pennsylvania State University, University of Portsmouth, Princeton University, the Spanish Participation Group, University of Tokyo, University of Utah, Vanderbilt University, University of Virginia, University of Washington, and Yale University.
The Legacy Surveys consist of three individual and complementary projects: the Dark Energy Camera Legacy Survey (DECaLS; NSF’s OIR Lab Proposal ID # 2014B-0404; PIs: David Schlegel and Arjun Dey), the Beijing-Arizona Sky Survey (BASS; NSF’s OIR Lab Proposal ID # 2015A-0801; PIs: Zhou Xu and Xiaohui Fan), and the Mayall z-band Legacy Survey (MzLS; NSF’s OIR Lab Proposal ID # 2016A-0453; PI: Arjun Dey). DECaLS, BASS and MzLS together include data obtained, respectively, at the Blanco telescope, Cerro Tololo Inter-American Observatory, The NSF’s National Optical-Infrared Astronomy Research Laboratory (NSF’s OIR Lab); the Bok telescope, Steward Observatory, University of Arizona; and the Mayall telescope, Kitt Peak National Observatory, NSF’s OIR Lab. The Legacy Surveys project is honored to be permitted to conduct astronomical research on Iolkam Du’ag (Kitt Peak), a mountain with particular significance to the Tohono O’odham Nation.
The NSF’s NOIR Lab is operated by the Association of Universities for Research in Astronomy (AURA) under a cooperative agreement with the National Science Foundation.
This project used data obtained with the Dark Energy Camera (DECam), which was constructed by the Dark Energy Survey (DES) collaboration. Funding for the DES Projects has been provided by the U.S. Department of Energy, the U.S. National Science Foundation, the Ministry of Science and Education of Spain, the Science and Technology Facilities Council of the United Kingdom, the Higher Education Funding Council for England, the National Center for Supercomputing Applications at the University of Illinois at Urbana-Champaign, the Kavli Institute of Cosmological Physics at the University of Chicago, Center for Cosmology and Astro-Particle Physics at the Ohio State University, the Mitchell Institute for Fundamental Physics and Astronomy at Texas A&M University, Financiadora de Estudos e Projetos, Fundacao Carlos Chagas Filho de Amparo, Financiadora de Estudos e Projetos, Fundacao Carlos Chagas Filho de Amparo a Pesquisa do Estado do Rio de Janeiro, Conselho Nacional de Desenvolvimento Cientifico e Tecnologico and the Ministerio da Ciencia, Tecnologia e Inovacao, the Deutsche Forschungsgemeinschaft and the Collaborating Institutions in the Dark Energy Survey. The Collaborating Institutions are Argonne National Laboratory, the University of California at Santa Cruz, the University of Cambridge, Centro de Investigaciones Energeticas, Medioambientales y Tecnologicas-Madrid, the University of Chicago, University College London, the DES-Brazil Consortium, the University of Edinburgh, the Eidgenossische Technische Hochschule (ETH) Zurich, Fermi National Accelerator Laboratory, the University of Illinois at Urbana-Champaign, the Institut de Ciencies de l’Espai (IEEC/CSIC), the Institut de Fisica d’Altes Energies, Lawrence Berkeley National Laboratory, the Ludwig-Maximilians Universitat Munchen and the associated Excellence Cluster Universe, the University of Michigan, the National Optical Astronomy Observatory, the University of Nottingham, the Ohio State University, the University of Pennsylvania, the University of Portsmouth, SLAC National Accelerator Laboratory, Stanford University, the University of Sussex, and Texas A&M University.
The Legacy Surveys imaging of the DESI footprint is supported by the Director, Office of Science, Office of High Energy Physics of the U.S. Department of Energy under Contract No. DE-AC02-05CH1123, by the National Energy Research Scientific Computing Center, a DOE Office of Science User Facility under the same contract; and by the U.S. National Science Foundation, Division of Astronomical Sciences under Contract No. AST-0950945 to NOAO.
This research has made use of the NASA/IPAC Extragalactic Database (NED), which is funded by the National Aeronautics and Space Administration and operated by the California Institute of Technology.
References
- Akhshik et al. (2020) Akhshik, M., Whitaker, K. E., Brammer, G., et al. 2020, ApJ, 900, 184
- Akhshik et al. (2021) Akhshik, M., Whitaker, K. E., Leja, J., et al. 2021, ApJ, 907, L8
- Astropy Collaboration et al. (2013) Astropy Collaboration, Robitaille, T. P., Tollerud, E. J., et al. 2013, A&A, 558, A33
- Belli et al. (2014) Belli, S., Newman, A. B., & Ellis, R. S. 2014, ApJ, 783, 117
- Belli et al. (2015) —. 2015, ApJ, 799, 206
- Belli et al. (2019) —. 2019, ApJ, 874, 17
- Bertin & Arnouts (1996) Bertin, E., & Arnouts, S. 1996, A&AS, 117, 393
- Bezanson et al. (2009) Bezanson, R., van Dokkum, P. G., Tal, T., et al. 2009, ApJ, 697, 1290
- Bezanson et al. (2018) Bezanson, R., van der Wel, A., Pacifici, C., et al. 2018, ApJ, 858, 60
- Bocquet & Carter (2016) Bocquet, S., & Carter, F. W. 2016, The Journal of Open Source Software, 1
- Calzetti et al. (2000) Calzetti, D., Armus, L., Bohlin, R. C., et al. 2000, ApJ, 533, 682
- Carnall et al. (2019) Carnall, A. C., McLure, R. J., Dunlop, J. S., et al. 2019, MNRAS, 490, 417
- Carollo et al. (2013) Carollo, C. M., Bschorr, T. J., Renzini, A., et al. 2013, ApJ, 773, 112
- Cassata et al. (2011) Cassata, P., Giavalisco, M., Guo, Y., et al. 2011, ApJ, 743, 96
- Conroy & Gunn (2010) Conroy, C., & Gunn, J. E. 2010, ApJ, 712, 833
- Daddi et al. (2005) Daddi, E., Renzini, A., Pirzkal, N., et al. 2005, ApJ, 626, 680
- Dawson et al. (2013) Dawson, K. S., Schlegel, D. J., Ahn, C. P., et al. 2013, AJ, 145, 10
- Dey et al. (2019) Dey, A., Schlegel, D. J., Lang, D., et al. 2019, AJ, 157, 168
- Eisenstein et al. (2011) Eisenstein, D. J., Weinberg, D. H., Agol, E., et al. 2011, AJ, 142, 72
- Elíasdóttir et al. (2007) Elíasdóttir, Á., Limousin, M., Richard, J., et al. 2007, arXiv e-prints, arXiv:0710.5636
- Fagioli et al. (2016) Fagioli, M., Carollo, C. M., Renzini, A., et al. 2016, ApJ, 831, 173
- Fan et al. (2010) Fan, L., Lapi, A., Bressan, A., et al. 2010, ApJ, 718, 1460
- Feldmann et al. (2016) Feldmann, R., Hopkins, P. F., Quataert, E., Faucher-Giguère, C.-A., & Kereš, D. 2016, MNRAS, 458, L14
- Ferré-Mateu et al. (2017) Ferré-Mateu, A., Trujillo, I., Martín-Navarro, I., et al. 2017, MNRAS, 467, 1929
- Foreman-Mackey et al. (2013) Foreman-Mackey, D., Hogg, D. W., Lang, D., & Goodman, J. 2013, PASP, 125, 306
- Garg et al. (2007) Garg, A., Stubbs, C. W., Challis, P., et al. 2007, AJ, 133, 403
- Gladders & Yee (2000) Gladders, M. D., & Yee, H. K. C. 2000, AJ, 120, 2148
- Hao et al. (2010) Hao, J., McKay, T. A., Koester, B. P., et al. 2010, ApJS, 191, 254
- Harris et al. (2020) Harris, C. R., Millman, K. J., van der Walt, S. J., et al. 2020, Nature, 585, 357
- Hilton et al. (2021) Hilton, M., Sifón, C., Naess, S., et al. 2021, ApJS, 253, 3
- Hilz et al. (2013) Hilz, M., Naab, T., & Ostriker, J. P. 2013, Monthly Notices of the Royal Astronomical Society, 429, 2924
- Hinshaw et al. (2013) Hinshaw, G., Larson, D., Komatsu, E., et al. 2013, ApJS, 208, 19
- Hopkins et al. (2009) Hopkins, P. F., Bundy, K., Murray, N., et al. 2009, MNRAS, 398, 898
- Hsu et al. (2014) Hsu, L.-Y., Stockton, A., & Shih, H.-Y. 2014, ApJ, 796, 92
- Huang et al. (2020) Huang, X., Storfer, C., Ravi, V., et al. 2020, ApJ, 894, 78
- Huang et al. (2021) Huang, X., Storfer, C., Gu, A., et al. 2021, ApJ, 909, 27
- Hunter (2007) Hunter, J. D. 2007, Computing in Science Engineering, 9, 90
- Jafariyazani et al. (2020) Jafariyazani, M., Newman, A. B., Mobasher, B., et al. 2020, ApJ, 897, L42
- Johnson & Leja (2017) Johnson, B., & Leja, J. 2017, bd-j/prospector: Initial release
- Joye & Mandel (2003) Joye, W. A., & Mandel, E. 2003, in Astronomical Society of the Pacific Conference Series, Vol. 295, Astronomical Data Analysis Software and Systems XII, ed. H. E. Payne, R. I. Jedrzejewski, & R. N. Hook, 489
- Jullo et al. (2007) Jullo, E., Kneib, J. P., Limousin, M., et al. 2007, New Journal of Physics, 9, 447
- Khullar et al. (2021) Khullar, G., Gozman, K., Lin, J. J., et al. 2021, ApJ, 906, 107
- Kriek & Conroy (2013) Kriek, M., & Conroy, C. 2013, ApJ, 775, L16
- Kriek et al. (2008) Kriek, M., van Dokkum, P. G., Franx, M., et al. 2008, ApJ, 677, 219
- Lanusse et al. (2018) Lanusse, F., Ma, Q., Li, N., et al. 2018, MNRAS, 473, 3895
- Leja et al. (2019) Leja, J., Carnall, A. C., Johnson, B. D., Conroy, C., & Speagle, J. S. 2019, ApJ, 876, 3
- Leja et al. (2017) Leja, J., Johnson, B. D., Conroy, C., van Dokkum, P. G., & Byler, N. 2017, ApJ, 837, 170
- Man et al. (2021) Man, A. W. S., Zabl, J., Brammer, G. B., et al. 2021, ApJ, 919, 20
- Miknaitis et al. (2007) Miknaitis, G., Pignata, G., Rest, A., et al. 2007, ApJ, 666, 674
- Muzzin et al. (2013) Muzzin, A., Marchesini, D., Stefanon, M., et al. 2013, ApJ, 777, 18
- Naab et al. (2009) Naab, T., Johansson, P. H., & Ostriker, J. P. 2009, ApJ, 699, L178
- Newman et al. (2018) Newman, A. B., Belli, S., Ellis, R. S., & Patel, S. G. 2018, ApJ, 862, 125
- Newman et al. (2012) Newman, A. B., Ellis, R. S., Bundy, K., & Treu, T. 2012, ApJ, 746, 162
- Newman et al. (2010) Newman, A. B., Ellis, R. S., Treu, T., & Bundy, K. 2010, ApJ, 717, L103
- Nipoti et al. (2012) Nipoti, C., Treu, T., Leauthaud, A., et al. 2012, MNRAS, 422, 1714
- Oldham et al. (2017) Oldham, L., Auger, M. W., Fassnacht, C. D., et al. 2017, MNRAS, 465, 3185
- Peng et al. (2002) Peng, C. Y., Ho, L. C., Impey, C. D., & Rix, H.-W. 2002, AJ, 124, 266
- Peng et al. (2010) —. 2010, AJ, 139, 2097
- Persson et al. (2008) Persson, S. E., Barkhouser, R., Birk, C., et al. 2008, in Society of Photo-Optical Instrumentation Engineers (SPIE) Conference Series, Vol. 7014, Ground-based and Airborne Instrumentation for Astronomy II, 70142V
- Rest et al. (2005) Rest, A., Stubbs, C., Becker, A. C., et al. 2005, ApJ, 634, 1103
- Rykoff et al. (2014) Rykoff, E. S., Rozo, E., Busha, M. T., et al. 2014, ApJ, 785, 104
- Salim et al. (2018) Salim, S., Boquien, M., & Lee, J. C. 2018, ApJ, 859, 11
- Schlafly & Finkbeiner (2011) Schlafly, E. F., & Finkbeiner, D. P. 2011, ApJ, 737, 103
- Sharon et al. (2020) Sharon, K., Bayliss, M. B., Dahle, H., et al. 2020, The Astrophysical Journal Supplement Series, 247, 12
- Skrutskie et al. (2006) Skrutskie, M. F., Cutri, R. M., Stiening, R., et al. 2006, AJ, 131, 1163
- Stockton et al. (2010) Stockton, A., Shih, H.-Y., & Larson, K. 2010, ApJ, 709, L58
- Stockton et al. (2014) Stockton, A., Shih, H.-Y., Larson, K., & Mann, A. W. 2014, ApJ, 780, 134
- Strauss et al. (2002) Strauss, M. A., Weinberg, D. H., Lupton, R. H., et al. 2002, AJ, 124, 1810
- Tody (1986) Tody, D. 1986, in Society of Photo-Optical Instrumentation Engineers (SPIE) Conference Series, Vol. 627, Instrumentation in astronomy VI, ed. D. L. Crawford, 733
- Tody (1993) Tody, D. 1993, in Astronomical Society of the Pacific Conference Series, Vol. 52, Astronomical Data Analysis Software and Systems II, ed. R. J. Hanisch, R. J. V. Brissenden, & J. Barnes, 173
- Trujillo et al. (2007) Trujillo, I., Conselice, C. J., Bundy, K., et al. 2007, MNRAS, 382, 109
- Trujillo et al. (2014) Trujillo, I., Ferré-Mateu, A., Balcells, M., Vazdekis, A., & Sánchez-Blázquez, P. 2014, ApJ, 780, L20
- Trujillo et al. (2006) Trujillo, I., Feulner, G., Goranova, Y., et al. 2006, MNRAS, 373, L36
- van der Wel et al. (2014) van der Wel, A., Franx, M., van Dokkum, P. G., et al. 2014, ApJ, 788, 28
- van der Wel et al. (2016) van der Wel, A., Noeske, K., Bezanson, R., et al. 2016, ApJS, 223, 29
- van Dokkum et al. (2008) van Dokkum, P. G., Franx, M., Kriek, M., et al. 2008, ApJ, 677, L5
- van Dokkum et al. (2010) van Dokkum, P. G., Whitaker, K. E., Brammer, G., et al. 2010, ApJ, 709, 1018
- Virtanen et al. (2020) Virtanen, P., Gommers, R., Oliphant, T. E., et al. 2020, Nature Methods, 17, 261
- Wellons et al. (2015) Wellons, S., Torrey, P., Ma, C.-P., et al. 2015, MNRAS, 449, 361
- Whitaker et al. (2012) Whitaker, K. E., Kriek, M., van Dokkum, P. G., et al. 2012, ApJ, 745, 179
- Whitaker et al. (2021) Whitaker, K. E., Williams, C. C., Mowla, L., et al. 2021, Nature, 597, 485
- Wuyts et al. (2010) Wuyts, E., Barrientos, L. F., Gladders, M. D., et al. 2010, ApJ, 724, 1182
- York et al. (2000) York, D. G., Adelman, J., Anderson, John E., J., et al. 2000, AJ, 120, 1579