Zoom Out and Observe:
News Environment Perception for Fake News Detection
Abstract
Fake news detection is crucial for preventing the dissemination of misinformation on social media. To differentiate fake news from real ones, existing methods observe the language patterns of the news post and “zoom in” to verify its content with knowledge sources or check its readers’ replies. However, these methods neglect the information in the external news environment where a fake news post is created and disseminated. The news environment represents recent mainstream media opinion and public attention, which is an important inspiration of fake news fabrication because fake news is often designed to ride the wave of popular events and catch public attention with unexpected novel content for greater exposure and spread. To capture the environmental signals of news posts, we “zoom out” to observe the news environment and propose the News Environment Perception Framework (NEP). For each post, we construct its macro and micro news environment from recent mainstream news. Then we design a popularity-oriented and a novelty-oriented module to perceive useful signals and further assist final prediction. Experiments on our newly built datasets show that the NEP can efficiently improve the performance of basic fake news detectors.111https://github.com/ICTMCG/News-Environment-Perception/
1 Introduction
The wide spread of fake news on online social media has influenced public trust Knight Foundation (2018) and poses real-world threats on politics Fisher et al. (2016), finance ElBoghdady (2013), public health Naeem and Bhatti (2020), etc. Under such severe circumstances, automatically detecting fake news has been an important countermeasure in practice.
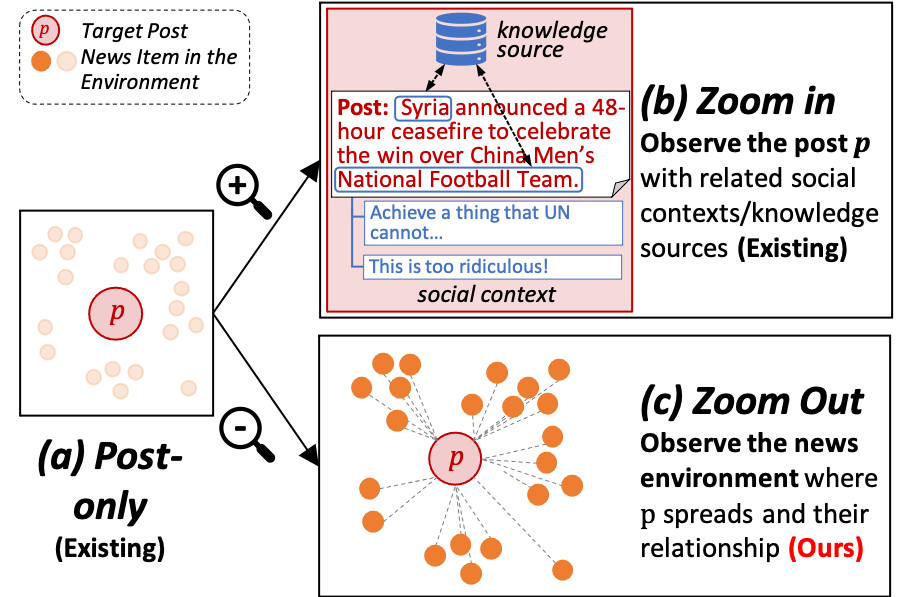
Besides directly observing the post’s content patterns Volkova et al. (2017); Wang et al. (2018) (Figure 1(a)), most existing methods for fake news detection “zoom in” for finding richer post-level signal by checking user replies to the post Shu et al. (2019a); Zhang et al. (2021) and verifying the claim with knowledge sources Popat et al. (2018); Wang et al. (2020) (Figure 1(b)). However, these methods neglect a different line of “zooming out” to observe the external news environment where a fake news post is created and disseminated. Our starting point is that a news environment, which represents recent mainstream media opinion and public attention, is an important inspiration of the fabrication of contemporary fake news. Since any gains of fake news achieve only if it widely exposes and virally spreads, a fake news creator would carefully design how to improve the post’s visibility and attract audiences’ attention in the context (environment) of recently published news. Such intentional design connects fake news with its news environment and conversely, we might find useful signals from the news environment to better characterize and detect fake news.
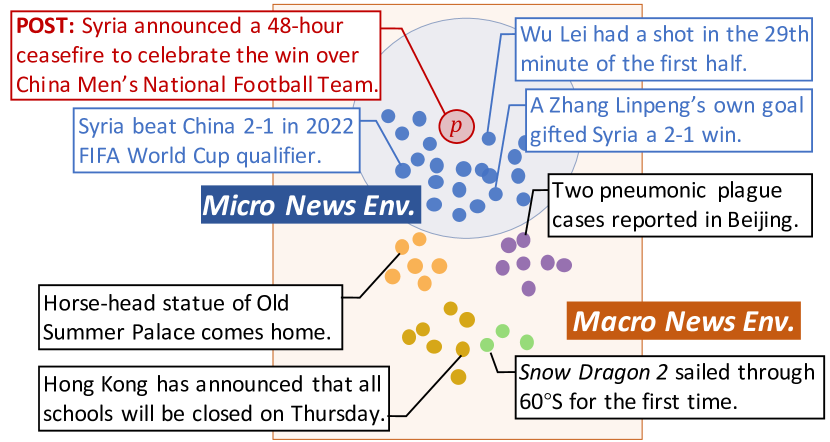
Figure 2 shows an example, where we name the whole set of recent news items the macro news environment and the event-similar subset as the micro news environment. For the fake news post on Syria’s ceasefire thanks to a win over China in a football match, we observe two important signals from its news environments:
1) Popularity. In the macro news environment that contains all recent news items, is related to a relatively popular event (Syria-China football match) among the five events in different domains. This would bring greater exposure and further greater impact.
2) Novelty. In the micro news environment, the items mostly focus on the game itself (e.g., “Wu Lei had a shot”), while provides novel side information about Syria’s unusual celebration. This would help catch audiences’ attention and boost the spread of Vosoughi et al. (2018).
Unfortunately, these potentially useful signals could be hardly considered by post-only and “zoom-in” methods, as they focus on digging in the direction towards inherent properties of a single post (e.g., styles, emotions and factual correctness), rather than observing the surrounding environments of the post.
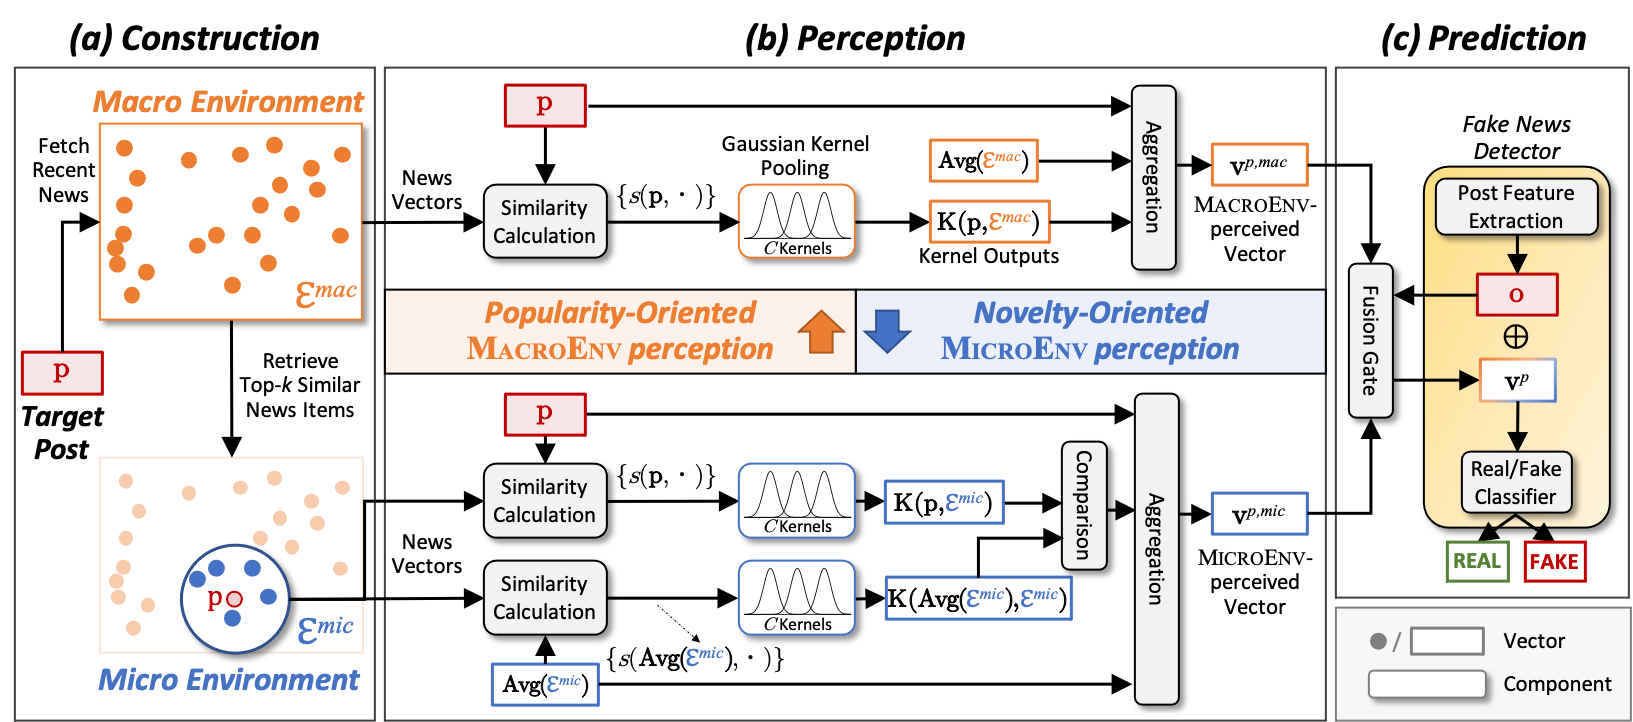
To enable fake news detection systems to exploit information from news environments, we propose the News Environment Perception Framework (NEP). As presented in Figure 3, for the post , we construct two news environments, MacroEnv and MicroEnv, using recent mainstream news data to facilitate the perception from different views. We then design a popularity-oriented and a novelty-oriented perception module to depict the relationship between and these recent news items. The environment-perceived vectors are fused into an existing fake news detector for prediction.
Our contributions are as follows:
-
•
Problem: To the best of our knowledge, we are the first to incorporate news environment perception in fake news detection.
-
•
Method: We propose the NEP framework which exploits the perceived signals from the macro and micro news environments of the given post for fake news detection.
-
•
Data & Experiments: We construct the first dataset which includes contemporary mainstream news data for fake news detection. Experiments on offline and online data show the effectiveness of NEP.
2 Related Work
Fake news detection is mostly formulated as a binary classification task where models are expected to accurately judge the given post as real or fake. Existing works focus on discovering distinctive features in the post from various aspects as Figure 2 shows, which we roughly group them as:
Post-only methods aim at finding shared patterns in appearances across fake news posts (Figure 1(a)). Text-based studies focus on better constructing features based on sentiment Ajao et al. (2019), writing style Przybyla (2020), language use Volkova et al. (2017), discourse Karimi and Tang (2019), etc. Other works rely on deep neural models to encode contents and handle certain scenarios, such as visual-based Qi et al. (2019); Cao et al. (2020), multi-modal Wang et al. (2018); Qi et al. (2021) and multi-domain Nan et al. (2021) detection. Our NEP provides additional news environmental information and can coordinate with post-only methods (will show in Section 4).
“Zoom-in” methods introduce related sources to understand the post delicately. One line is to use social contexts (bottom of Figure 1(b)). Some directly analyze the network information to find patterns shaped by user relationship and information diffusion Shu et al. (2019b); Zhou and Zafarani (2019); Nguyen et al. (2020); Silva et al. (2021), and others leverage collective wisdom reflected by user responses Ma et al. (2018); Kochkina et al. (2018); Shu et al. (2019a); Zhang et al. (2021). For example, a refuting reply saying “FYI, this is false” would be an important reference to make a prediction. Another line refers to knowledge sources (top of Figure 1(b)) and aims at verifying the post with retrieved evidence for detection. The knowledge sources can be webpages Popat et al. (2018); Ma et al. (2019); Vo and Lee (2021); Wu et al. (2021); Sheng et al. (2021b), knowledge graphs Cui et al. (2020), online encyclopedias Thorne et al. (2018); Aly et al. (2021), fact-checking article bases Augenstein et al. (2019); Shaar et al. (2020), etc. Our NEP starts from a different view, for it “zooms out” to observe the news environment where the post spreads. Note that our method is not equivalent to a knowledge-based method that uses news environments as evidence bases, as it does not pick evidential news items to prove or disprove the given post, but aims at reading the news “atmosphere” when the post is published. In that sense, “zoom-in” and “zoom-out” methods can actually be integrated for comprehensively detecting fake news (will also show in Section 4).
3 Proposed Method
Figure 3 overviews our proposed framework NEP, whose goal is to empower fake news detectors with the effective perception of news environments. Given a post , we first construct its macro and micro environment (MacroEnv and MicroEnv) using recent news data. Then we model the post-environment relationships to generate environment-perceived vectors and . Finally, the two vectors are fused with post representation derived from the fake news detector to predict if is real or fake.
3.1 News Environment Construction
The environment is the objects, circumstances, or conditions by which one is surrounded Merriam-Webster (2021). Accordingly, a news environment should contain news reports which can reflect the present distribution of mainstream focuses and audiences’ attention. To this end, we collect news items published by mainstream media outlets as basic environmental elements, in that their news reports generally face a large, common audience.
Let be the set of all collected news items published earlier than . We construct a macro environment (MacroEnv) and a micro environment (MicroEnv), which are defined as follows:
-
•
MacroEnv is the set of news items in released within days before is published:
(1) where and respectively denote the publication date of and the news item .
-
•
MicroEnv is the set of news items in that are relevant to . Here, we query using and obtain the top as the set:
(2) where and determines the proportion.
Intuitively, the time-constrained environment MacroEnv provides a macro perspective of what the mass audience read and focus on recently, while the further relevance-constrained one MicroEnv describes the distribution of items about similar events. We use a pretrained language model (e.g., BERT Devlin et al. (2019)) to obtain the post/news representation. For or each item in the macro/micro environment , the initial representation is the output of for the token:
| (3) |
3.2 News Environment Perception
The perception of news environments of is to capture useful signals from existing mainstream news items. The signals are expected to discover unique post-environment interactive patterns of fake news. Starting from the motivation of fake news creators to widely diffuse fabricated information to the whole online news ecosystem, we guide the model to perceive from two important diffusion-related perspectives, i.e., popularity and novelty, in the MacroEnv and the MicroEnv.
Popularity-Oriented MacroEnv Perception. A fabricated post would be more likely to go viral and thus gain more influence when it is related to trending news. Thus, a fake news creator might consider how to chase clouts of hot events during writing a fake news post. Here we consider how popular the main event of is in the MacroEnv. We transform the perception of popularity into the similarity estimation between and individual news items. That is, if many items in the MacroEnv are similar to , then might be also popular in such an environment. Following Reimers and Gurevych (2019), we first calculate cosine similarity between and each news item (say, ) in :
| (4) |
The similarity list of variable length does not work well with networks mostly taking fixed-dimensional vectors as inputs. Thus, the list requires a further transformation, where we expect the transformed environment-perceived vector to reflect how similar is to the environment without much information loss. Following Xiong et al. (2017); Liu et al. (2020), we here choose to calculate a soft counting on the list to obtain a distribution that mimics a hard bin plot. Specifically, we employ a Gaussian Kernel Pooling proposed in Xiong et al. (2017) across the range of cosine similarity to get soft counting values. Assuming that we use kernels , the output of -th kernel is:
| (5) |
| (6) |
where and is the mean and width of the -th kernel. In Eq. (5), if the similarity between and is close to , the exponential term will be close to 1; otherwise to 0. We then sum the exponential terms with Eq. (6). This explains why a kernel is like a soft counting bin of similarities. We here scatter the means of the kernels in to completely and evenly cover the range of cosine similarity. The widths are controlled by . Appendix B.1 provides the details. A -dim similarity feature in the MacroEnv is obtained by concatenating all kernels’ outputs and normalizing with the summation of the outputs:
| (7) |
where is the concatenation operator and denotes the normalization.
By calculating , we obtain a soft distribution of similarities between and the MacroEnv as the perception of popularity. To enrich the perceived information, we generate the MacroEnv-perceived vector for by fusing the similarity and semantic information. Specifically, we aggregate the post vector, the center vector of the MacroEnv (by averaging all vectors), and the similarity feature using an MLP:
| (8) |
Novelty-Oriented MicroEnv Perception. Different from MacroEnv, MicroEnv contains mainstream news items close to , which indicates that they are likely to share similar events. However, even in a popular event, a post may still be not attended if it is too similar to others. Vosoughi et al. (2018) found that false news was more novel than true news on Twitter with the reference to the tweets that the users were exposed to (could be regarded as a user-level news environment). This might explain why fake news spread “better”. We thus consider how novel is in the event-similar MicroEnv.222We perceive the novelty in the MicroEnv rather than the MacroEnv to mitigate the effects of event shift.
If the content of a post is novel, it is expected to be an outlier in such an event. Here, we use the center vector of MicroEnv as a reference. Specifically, we again use Eqs. (5) to (7), but here, calculate two similarity features and . The latter serves as a reference for the former and facilitates the model “calibrate” its perception. The generation of the MicroEnv-perceived vector for is as follows:
| (9) |
| (10) |
| (11) |
where the comparison function and is the Hadamard product operator. and respectively aggregate the semantic and similarity information. The s are individually parameterized. We omit their index numbers in the above equations for brevity.
3.3 Prediction under Perceived Environments
As our environment perception does not necessarily depend on a certain detection model, we expect our NEP to have a good compatibility with various fake news detectors. In our NEP, we achieve this by gate fusion. Take a post-only detector as an example. We apply the gate mechanism for adaptively fusing and according to :
| (12) |
where the gating vector , is to constrain the value of each element in , and denotes the last-layer feature from a post-only detector.333Empirically, we take the output of one of the last few dense layers whose dimensionality is moderate. and are further fed into an MLP and a layer for final prediction:
| (13) |
When working with more complex detectors that rely on other sources besides the post, we can simply concatenate those feature vectors in Eq. (13). For example, we can concatenate with the post-article joint representation if the fake news detector is knowledge-based. During training, we minimize the cross-entropy loss.
4 Experiment
We conduct experiments to answer the following evaluation questions:
-
•
EQ1: Can NEP improve the performance of fake news detection?
-
•
EQ2: How effective does the NEP model the macro and micro news environments?
-
•
EQ3: In what scenarios do news environments help with fake news detection?
4.1 Datasets
We integrated existing datasets in Chinese and English and then collected news items released in the corresponding time periods. The reasons why we do not use a single, existing dataset include 1) no existing dataset provides the contemporary news items of verified news posts to serve as the elements in news environments; 2) most datasets were collected in a short time period and some suffer from a high class imbalance across years.444For example, Weibo-20 Zhang et al. (2021) is roughly balanced as a whole but has a ratio of 5.2:1 between real and fake news samples in 2018. The statistics are shown in Table 1 and the details are as follows:
| Dataset | Chinese | English | ||||||
| Train | Val | Test | Train | Val | Test | |||
| #Real | 8,787 | 5,131 | 5,625 | 1,976 | 656 | 661 | ||
| #Fake | 8,992 | 4,923 | 5,608 | 1,924 | 638 | 628 | ||
| Total | 17,779 | 10,054 | 11,233 | 3,900 | 1,294 | 1,289 | ||
| #News Items | 583,208 | 1,003,646 | ||||||
|
41 / 505 / 1,563 | 308 / 1,614 / 2,211 | ||||||
| Model | Chinese | English | |||||||
|---|---|---|---|---|---|---|---|---|---|
| Acc. | macF1 | F1fake | F1real | Acc. | macF1 | F1fake | F1real | ||
| Post-Only | Bi-LSTM | 0.727 | 0.713 | 0.652 | 0.775 | 0.705 | 0.704 | 0.689 | 0.719 |
| +NEP | 0.776 | 0.771 | 0.739 | 0.803 | 0.718 | 0.718 | 0.720 | 0.716 | |
| EANNT | 0.732 | 0.718 | 0.657 | 0.780 | 0.700 | 0.699 | 0.683 | 0.714 | |
| +NEP | 0.776 | 0.770 | 0.733 | 0.807 | 0.722 | 0.722 | 0.722 | 0.722 | |
| BERT | 0.792 | 0.785 | 0.744 | 0.825 | 0.709 | 0.709 | 0.701 | 0.716 | |
| +NEP | 0.810 | 0.805 | 0.772 | 0.837 | 0.718 | 0.718 | 0.720 | 0.715 | |
| BERT-Emo | 0.812 | 0.807 | 0.776 | 0.838 | 0.718 | 0.718 | 0.719 | 0.718 | |
| +NEP | 0.831 | 0.829 | 0.808 | 0.850 | 0.728 | 0.728 | 0.728 | 0.728 | |
| “Zoom-In” | DeClarE | 0.764 | 0.758 | 0.720 | 0.795 | 0.714 | 0.714 | 0.709 | 0.718 |
| +NEP | 0.800 | 0.797 | 0.773 | 0.822 | 0.717 | 0.716 | 0.718 | 0.714 | |
| MAC | 0.755 | 0.751 | 0.717 | 0.784 | 0.706 | 0.705 | 0.708 | 0.701 | |
| +NEP | 0.764 | 0.760 | 0.732 | 0.789 | 0.716 | 0.716 | 0.716 | 0.716 | |
Chinese Dataset
Post: We merged the non-overlapping parts of multiple Weibo datasets from Ma et al. (2016) (excluding those unverified), Song et al. (2019), Zhang et al. (2021) and Sheng et al. (2021a) to achieve a better coverage of years and avoid spurious correlation to specific news environments (e.g., one full of COVID-19 news). To balance the post amount of real/fake classes across the years, we added news posts verified by a news verification system NewsVerify555https://newsverify.com/ and resampled the merged set. The final set contains 39,066 verified posts on Weibo ranging from 2010 to 2021.
News Environment: We collected the news items from the official accounts of six representative mainstream news outlets that have over 30M followers on Weibo (see sources in Appendix A). The further post-processing resulted in 583,208 news items from 2010 to 2021.
English Dataset
Post: Similarly, we merged the datasets from Kochkina et al. (2018) (excluding unverified), Augenstein et al. (2019) (excluding those without claim dates), and Shaar et al. (2020). For posts or claims from fact-checking websites, we used the provided claim dates instead of the publication dates of the fact-checking articles, to avoid potential data contamination where the later news environment is more likely to contain corresponding fact-checking news and support direct fact verification. We obtained 6,483 posts from 2014 to 2018 after dropping the posts labeled as neutral and re-sampling.
News Environment: We use news headlines (plus short descriptions if any) from Huffington Post, NPR, and Daily Mail as the substitute of news tweets due to the Twitter’s restriction (see sources in Appendix A). The bias rates of the three outlets are respectively left, center, and right according to AllSides Media Bias Chart666https://www.allsides.com/media-bias/media-bias-ratings, for enriching the diversity of news items. We preserved the news headlines from 2014 to 2018 and obtained a set of 1,003,646 news items.
4.2 Experimental Setup
Base Models Technically, our NEP could coordinate with any fake news detectors that produce post representation. Here we select four post-only methods and two “zoom-in” (knowledge-based) methods as our base models.777We do not select social context-based methods because it would be impractical to integrate our NEP with them at the cost of timeliness, for the model has to wait for the accumulation of user responses/reposts. We suppose that an asynchronous integration at the system level (using post-only/knowledge-based methods with NEP to obtain instant predictions, and update the results later) would be an option, which is beyond our scope.
Post-Only: 1) Bi-LSTM Graves and Schmidhuber (2005) which is widely used to encode posts in existing works Shu et al. (2019a); Karimi and Tang (2019); 2) EANNT Wang et al. (2018) which uses adversarial training to remove event-specific features obtained from TextCNN Kim (2014); 3) BERT Devlin et al. (2019); 4) BERT-Emo Zhang et al. (2021) which fuses a series of emotional features with BERT encoded features for classification (publisher emotion version).888As our work is based on the post text, we use the text-only variant of the original EANN that excludes the image modality and the publisher-emotion-only variant in Zhang et al. (2021) that excludes the social emotion features.
“Zoom-in”: 1) DeClarE Popat et al. (2018) which considers both the post and retrieved documents as possible evidence; 2) MAC Vo and Lee (2021) which build a hierarchical multi-head attention network for evidence-aware detection.
| Model | Chinese | English | ||||||
|---|---|---|---|---|---|---|---|---|
| Acc. | macF1 | F1fake | F1real | Acc. | macF1 | F1fake | F1real | |
| MacroEnv | 0.689 | 0.659 | 0.557 | 0.761 | 0.693 | 0.693 | 0.696 | 0.689 |
| MicroEnv | 0.666 | 0.626 | 0.503 | 0.748 | 0.695 | 0.695 | 0.694 | 0.696 |
| MacroEnv+MicroEnv | 0.694 | 0.666 | 0.569 | 0.763 | 0.696 | 0.696 | 0.694 | 0.697 |
| BERT-Emo + NEP | 0.831 | 0.829 | 0.808 | 0.850 | 0.728 | 0.728 | 0.728 | 0.728 |
| w/o MacroEnv | 0.822 | 0.819 | 0.794 | 0.843 | 0.726 | 0.726 | 0.726 | 0.725 |
| w/o MicroEnv | 0.824 | 0.820 | 0.795 | 0.845 | 0.723 | 0.723 | 0.715 | 0.731 |
| DeClarE + NEP | 0.797 | 0.800 | 0.773 | 0.822 | 0.717 | 0.716 | 0.718 | 0.714 |
| w/o MacroEnv | 0.776 | 0.771 | 0.735 | 0.806 | 0.712 | 0.711 | 0.709 | 0.713 |
| w/o MicroEnv | 0.778 | 0.773 | 0.736 | 0.809 | 0.709 | 0.709 | 0.719 | 0.698 |
Implementation Details We obtained the sentence representation from SimCSE Gao et al. (2021) based on pretrained BERT models in the Transformers package Wolf et al. (2020)999bert-base-chinese and bert-base-uncased and were post-trained on collected news items. We frozed SimCSE when training NEP. For DeClarE and MAC, we prepared at most five articles in advance as evidence for each post by retrieving against fact-checking databases.101010We attempted to collect webpages using our posts as queries as Popat et al. (2018) did but rare ones could serve as evidence except fact-checking articles. As an alternative, we directly used articles from Sheng et al. (2021a) for Chinese and collected ~8k articles from a well-known fact-checking website Snopes.com for English. In environment modeling, , , and . We limit . We implemented all methods using PyTorch Paszke et al. (2019) with AdamW Loshchilov and Hutter (2019) as the optimizer. We reported test results w.r.t. the best validation epoch. Appendix B provides more implementation details.
Evaluation Metrics. As the test sets are roughly balanced, we here report accuracy (Acc.), macro F1 score (macF1) and the F1 scores of fake and real class (F1fake and F1real). We will use a new metric for skewed test data (see Section 5).
4.3 Performance Comparison (EQ1)
Table 2 shows the performance of base models with and without the NEP on the two datasets. We have the following observations:
First, with the help of our NEP, all six base models see an performance improvement in terms of accuracy and macro F1. This validates the effectiveness and compatibility of NEP.
Second, for post-only methods, F1fake generally benefits more than F1real when using NEP, which indicates that news environments might be more helpful in highlighting the characteristics of fake news. This is a practical property of the NEP as we often focus more on the fake news class.
Third, the “zoom-in” knowledge-based methods outperform their corresponding post-only base model (here, Bi-LSTM) with the help of relevant articles, but the improvement is small. This might be led by the difficulty of finding valuable evidence. Our NEP brings additional gains, indicating that the information perceived from news environments is different from verified knowledge, and they play complementary roles.
4.4 Evaluation on Variants of NEP (EQ2)
Ablation Study. We have two ablative groups as shown in Table 3:
w/o Fake News Detector: We directly use one of the two environment-perceived vectors or both to see whether they can work when not cooperating with the fake news detector’s output . The macro F1 scores on both datasets indicate their moderate effectiveness as sole inputs, and that coordinating with a post-only detector is a more practical setting.
w/o Environment Perception Modules: By respectively removing MacroEnv and MicroEnv from the best-performing models BERT-Emo+NEP and DeClarE+NEP, we see a performance drop in macro F1 when removing either of them, indicating that the two environments are both necessary and play complementary roles in detection.
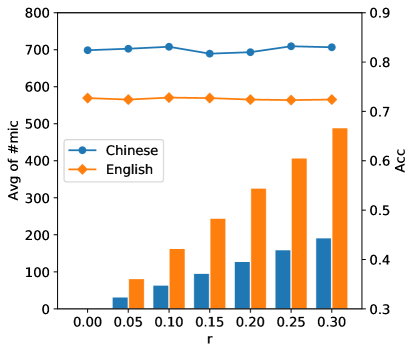
Effects of the proportion factor for the MicroEnv. We adjusted from 0.05 to 0.30 with a step of 0.05 on BERT-Emo+NEP to see the impact of the scale of the MicroEnv (). As Figure 4(a) shows, the change of leads to an increase on the size of the MicroEnv, but only fluctuations w.r.t. the accuracy. We do not see significant improvement after . We speculate that a too small may hardly cover enough event-similar items while a large may include much irrelevant information, bringing little gains (e.g., in Chinese) or even lowering the performance (e.g., for both datasets).
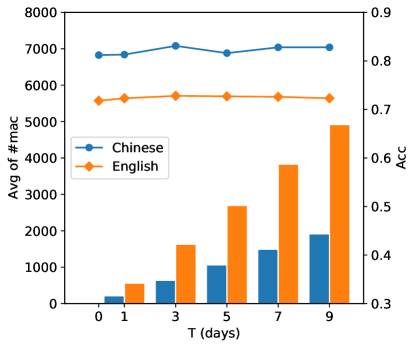
Effects of the day difference for the MacroEnv. We set on BERT-Emo+NEP to see how many days of news items to be considered is proper ( exactly corresponds to the base model). Figure 4(b) shows a tendency similar to (a). We find the highest accuracy when on both of the two datasets. This is reasonable as the popularity should be considered in a moderately short time interval to allow the events to develop but not to be forgotten.
4.5 Environment Analysis (EQ3)
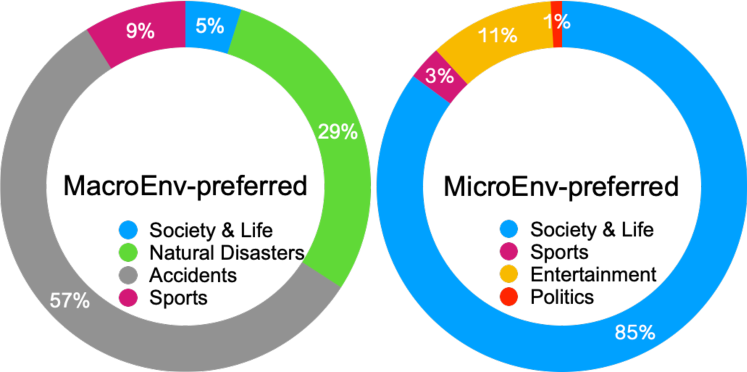
Categorization of macro- and micro-preferred samples. We selected the top 1% of Chinese fake news samples which NEP relies more on MacroEnv or MicroEnv according to the gate vectors. Then we manually categorized these samples to probe what information the macro/micro environment might provide. From Figure 5, we see that MacroEnv is more useful for samples about natural disasters and accidents (e.g., earthquakes and air crashes), while MicroEnv works effectively in Society & Life (e.g., robbery and education). This is in line with our intuition: MacroEnv-preferred fake news posts are often related to sensational events, so the popularity in MacroEnv would help more; and MicroEnv-preferred ones are often related to common events in daily news, and thus its novelty in MicroEnv would be highlighted. This analysis would deepen our understanding on the applicability of different news environments.
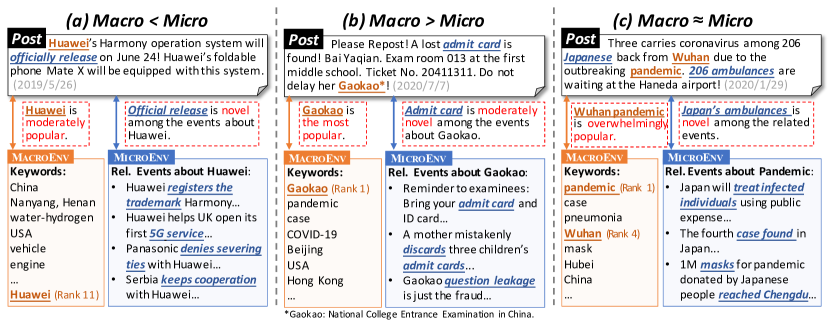
Case study. Figure 6 shows three fake news cases in different scenarios. Case (a) relies more on MicroEnv than MacroEnv. We can see moderate popularity of its event about Huawei but the message about HarmonyOS is novel among the items on the 5G and cooperations. In contrast, the admit card in case (b) is moderately novel but Gaokao is the most popular event, so the NEP puts higher weight on MacroEnv. Case (c) is a popular and novel fake news about Japan’s great healthcare for citizens coming back from Wuhan which is posted during the first round of COVID-19 pandemic in China. The exploitation of both-side information makes a tie between the two environments. These cases intuitively show how NEP handles different scenarios. We incorporate further analysis on the case that the news environment might be ineffective in Appendix D.
5 Discussion in Practical Systems
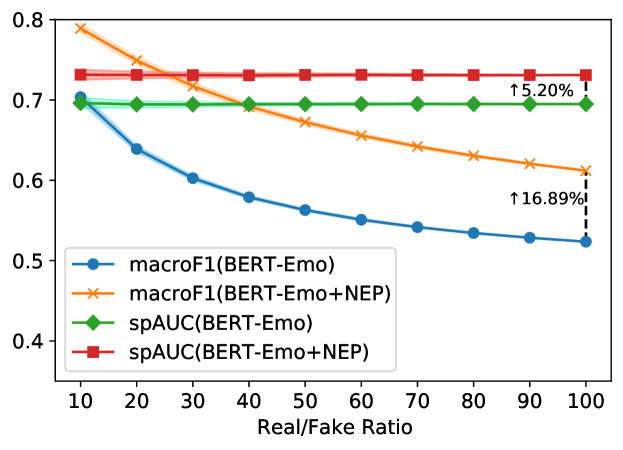
Evaluation on skewed online data. We tested BERT-Emo and BERT-Emo+NEP on a dump of seven-month data from a Chinese fake news detection system. Different from offline datasets, this real-world set is highly skewed (30,977 real vs. 309 fake, roughly 100:1).111111The online test set and the offline sets do not intersect. Under such skewed circumstance, some metrics we used in Tables 2 and 3 could hardly show the differences of performances among models (e.g., a model predicting all samples as real will have an incredible accuracy of 0.990). Here, we report macro F1 and standardized partial AUC with false positive rate of at most 0.1 (spAUCFPR≤0.1, McClish, 1989, see Appendix C for the calculation detail) under different real/fake ratios (from 10:1 to 100:1). As shown in Figure 7, NEP brings relative improvements of 16.89% and 5.20% in macF1 and spAUCFPR≤0.1, showing its effectiveness in skewed, real scenarios.
Friendliness to Practical Systems. The NEP is not only a new direction for fake news detection but also inherently friendly to practical systems: 1) Timeliness. Our NEP works instantly as it only requires the post and mainstream news published a few days before. In practice, a system would not construct the required collection on demand but prepare it ahead by maintaining a queue of news items. 2) Compatibility. Our perception module can be integrated with existing methods, which we validated on six representative ones (Table 2). 3) Data Accessibility. The data to construct news environments is easy to access, especially compared with obtaining credible knowledge sources. The advantages may encourage the deployment of NEP into practical systems.
6 Conclusion and Future Work
We proposed the NEP to observe news environments for fake news detection on social media. We designed popularity- and novelty-oriented perception modules to assist fake news detectors. Experiments on offline and online data show the effectiveness of NEP in boosting the performance of existing models. We drew insights on how NEP help to interpret the contribution of macro and micro environment in fake news detection.
As this is the first work on the role of news environments for fake news detection, we believe further exploration is required for a deeper understanding of the effects of news environments and beyond. In the future, we plan to explore: 1) including historical news or background to handle posts weakly related to the present environment; 2) modeling post-environment relationships with diverse similarity metrics or even from other perspectives; 3) investigating the effects of different news environments (e.g., biased vs. neutral ones) to make the environment construction more principled; 4) extending this type of methodology from the text-only detection to multi-modal and social graph-based detection.
Acknowledgements
The authors thank Guang Yang, Peng Qi, Zihao He, and anonymous reviewers for their insightful comments. This work was supported by the Zhejiang Provincial Key Research and Development Program of China (No. 2021C01164).
Ethical Considerations
Application. Our framework does not present direct societal consequence and is expected to benefit the defense against the fake news issue. It can serve as a detection module for fake news detection systems, especially when the given post is closely related to the events that happened recently, with no need to wait for the accumulation of user responses or query to knowledge sources. Due to the requirement of real-time access to open news sources (source list can be determined as needed), it might be easier to deploy for service providers (e.g., news platforms) and media outlets.
Data. Our data is mostly based on existing datasets, except the news items for constructing news environments. All news items (or headlines) are open and accessible to readers and have no issues with user privacy. The media outlets in the English dataset might be considered “biased”, so we carefully select a left, a center, and a right outlet (whose headlines are available) according to the AllSides Media Bias Chart. In China, a media outlet might be state-run (e.g., CCTV News), local-government-run (e.g., The Paper), or business-run (e.g., Toutiao News). With no widely recognized bias chart of Chinese media as a reference, we select media outlets based on their influence (e.g., number of followers) on Weibo from the three categories for the sake of representativeness.
References
- Ajao et al. (2019) Oluwaseun Ajao, Deepayan Bhowmik, and Shahrzad Zargari. 2019. Sentiment aware fake news detection on online social networks. In 2019 IEEE International Conference on Acoustics, Speech and Signal Processing, pages 2507–2511. IEEE.
- Aly et al. (2021) Rami Aly, Zhijiang Guo, Michael Sejr Schlichtkrull, James Thorne, Andreas Vlachos, Christos Christodoulopoulos, Oana Cocarascu, and Arpit Mittal. 2021. FEVEROUS: Fact extraction and VERification over unstructured and structured information. In Proceedings of the 35th Conference on Neural Information Processing (NeurIPS 2021).
- Atanasova et al. (2018) Pepa Atanasova, Lluís Màrquez, Alberto Barrón-Cedeño, Tamer Elsayed, Reem Suwaileh, Wajdi Zaghouani, Spas Kyuchukov, Giovanni Da San Martino, and Preslav Nakov. 2018. Overview of the CLEF-2018 checkthat! lab on automatic identification and verification of political claims. task 1: Check-worthiness. In Working Notes of CLEF 2018 - Conference and Labs of the Evaluation Forum, volume 2125 of CEUR Workshop Proceedings. CEUR-WS.org.
- Augenstein et al. (2019) Isabelle Augenstein, Christina Lioma, Dongsheng Wang, Lucas Chaves Lima, Casper Hansen, Christian Hansen, and Jakob Grue Simonsen. 2019. MultiFC: A real-world multi-domain dataset for evidence-based fact checking of claims. In Proceedings of the 2019 Conference on Empirical Methods in Natural Language Processing and the 9th International Joint Conference on Natural Language Processing (EMNLP-IJCNLP), pages 4685–4697, Hong Kong, China. Association for Computational Linguistics.
- Bird (2006) Steven Bird. 2006. NLTK: The Natural Language Toolkit. In Proceedings of the COLING/ACL 2006 Interactive Presentation Sessions, pages 69–72. Association for Computational Linguistics.
- Cao et al. (2020) Juan Cao, Peng Qi, Qiang Sheng, Tianyun Yang, Junbo Guo, and Jintao Li. 2020. Exploring the role of visual content in fake news detection. In Disinformation, Misinformation, and Fake News in Social Media: Emerging Research Challenges and Opportunities, pages 141–161. Springer.
- Cui et al. (2020) Limeng Cui, Haeseung Seo, Maryam Tabar, Fenglong Ma, Suhang Wang, and Dongwon Lee. 2020. DETERRENT: Knowledge guided graph attention network for detecting healthcare misinformation. In Proceedings of the 26th ACM SIGKDD International Conference on Knowledge Discovery & Data Mining, pages 492–502. Association for Computing Machinery.
- Devlin et al. (2019) Jacob Devlin, Ming-Wei Chang, Kenton Lee, and Kristina Toutanova. 2019. BERT: Pre-training of deep bidirectional transformers for language understanding. In Proceedings of the 2019 Conference of the North American Chapter of the Association for Computational Linguistics: Human Language Technologies, Volume 1 (Long and Short Papers), pages 4171–4186, Minneapolis, Minnesota. Association for Computational Linguistics.
- ElBoghdady (2013) Dina ElBoghdady. 2013. Market quavers after fake ap tweet says obama was hurt in white house explosions. The Washington Post.
- Fisher et al. (2016) Marc Fisher, John Woodrow Cox, and Peter Hermann. 2016. Pizzagate: From rumor, to hashtag, to gunfire in dc. The Washington Post.
- Gao et al. (2021) Tianyu Gao, Xingcheng Yao, and Danqi Chen. 2021. SimCSE: Simple contrastive learning of sentence embeddings. In Proceedings of the 2021 Conference on Empirical Methods in Natural Language Processing, Punta Cana, Dominican Republic. Association for Computational Linguistics.
- Graves and Schmidhuber (2005) Alex Graves and Jürgen Schmidhuber. 2005. Framewise phoneme classification with bidirectional LSTM and other neural network architectures. Neural networks, 18(5-6):602–610.
- Hartigan and Wong (1979) J. A. Hartigan and M. A. Wong. 1979. Algorithm AS 136: A K-Means Clustering Algorithm. Journal of the Royal Statistical Society. Series C (Applied Statistics), 28(1):100–108.
- Hassan et al. (2017) Naeemul Hassan, Fatma Arslan, Chengkai Li, and Mark Tremayne. 2017. Toward Automated Fact-Checking: Detecting Check-Worthy Factual Claims by ClaimBuster. In Proceedings of the 23rd ACM SIGKDD International Conference on Knowledge Discovery and Data Mining, page 1803–1812. Association for Computing Machinery.
- Karimi and Tang (2019) Hamid Karimi and Jiliang Tang. 2019. Learning hierarchical discourse-level structure for fake news detection. In Proceedings of the 2019 Conference of the North American Chapter of the Association for Computational Linguistics: Human Language Technologies, Volume 1 (Long and Short Papers), pages 3432–3442, Minneapolis, Minnesota. Association for Computational Linguistics.
- Kim (2014) Yoon Kim. 2014. Convolutional neural networks for sentence classification. In Proceedings of the 2014 Conference on Empirical Methods in Natural Language Processing (EMNLP), pages 1746–1751. Association for Computational Linguistics.
- Knight Foundation (2018) Knight Foundation. Perceived accuracy and bias in the news media [online]. 2018.
- Kochkina et al. (2018) Elena Kochkina, Maria Liakata, and Arkaitz Zubiaga. 2018. All-in-one: Multi-task learning for rumour verification. In Proceedings of the 27th International Conference on Computational Linguistics, pages 3402–3413, Santa Fe, New Mexico, USA. Association for Computational Linguistics.
- Li et al. (2018) Shen Li, Zhe Zhao, Renfen Hu, Wensi Li, Tao Liu, and Xiaoyong Du. 2018. Analogical Reasoning on Chinese Morphological and Semantic Relations. In Proceedings of the 56th Annual Meeting of the Association for Computational Linguistics (Volume 2: Short Papers), pages 138–143, Melbourne, Australia. Association for Computational Linguistics.
- Liu et al. (2020) Zhenghao Liu, Chenyan Xiong, Maosong Sun, and Zhiyuan Liu. 2020. Fine-grained fact verification with kernel graph attention network. In Proceedings of the 58th Annual Meeting of the Association for Computational Linguistics, pages 7342–7351, Online. Association for Computational Linguistics.
- Loshchilov and Hutter (2019) Ilya Loshchilov and Frank Hutter. 2019. Decoupled Weight Decay Regularization. In International Conference on Learning Representations.
- Ma et al. (2019) Jing Ma, Wei Gao, Shafiq Joty, and Kam-Fai Wong. 2019. Sentence-level evidence embedding for claim verification with hierarchical attention networks. In Proceedings of the 57th Annual Meeting of the Association for Computational Linguistics, pages 2561–2571, Florence, Italy. Association for Computational Linguistics.
- Ma et al. (2016) Jing Ma, Wei Gao, Prasenjit Mitra, Sejeong Kwon, Bernard J Jansen, Kam-Fai Wong, and Meeyoung Cha. 2016. Detecting rumors from microblogs with recurrent neural networks. In Proceedings of the Twenty-Fifth International Joint Conference on Artificial Intelligence, pages 3818–3824. AAAI Press.
- Ma et al. (2018) Jing Ma, Wei Gao, and Kam-Fai Wong. 2018. Rumor detection on Twitter with tree-structured recursive neural networks. In Proceedings of the 56th Annual Meeting of the Association for Computational Linguistics (Volume 1: Long Papers), pages 1980–1989, Melbourne, Australia. Association for Computational Linguistics.
- McClish (1989) Donna Katzman McClish. 1989. Analyzing a portion of the roc curve. Medical decision making, 9(3):190–195.
- Merriam-Webster (2021) Merriam-Webster. Definition of environment by merriam-webster [online]. 2021.
- Mihalcea and Tarau (2004) Rada Mihalcea and Paul Tarau. 2004. TextRank: Bringing Order into Text. In Proceedings of the 2004 Conference on Empirical Methods in Natural Language Processing, pages 404–411, Barcelona, Spain. Association for Computational Linguistics.
- Misra (2018) Rishabh Misra. 2018. News category dataset.
- Misra and Grover (2021) Rishabh Misra and Jigyasa Grover. 2021. Sculpting Data for ML: The first act of Machine Learning.
- Naeem and Bhatti (2020) Salman Bin Naeem and Rubina Bhatti. 2020. The covid-19 ‘infodemic’: a new front for information professionals. Health Information & Libraries Journal, 37(3):233–239.
- Nan et al. (2021) Qiong Nan, Juan Cao, Yongchun Zhu, Yanyan Wang, and Jintao Li. 2021. MDFEND: Multi-domain fake news detection. In Proceedings of the 30th ACM International Conference on Information and Knowledge Management. Association for Computing Machinery.
- Nguyen et al. (2020) Van-Hoang Nguyen, Kazunari Sugiyama, Preslav Nakov, and Min-Yen Kan. 2020. FANG: Leveraging social context for fake news detection using graph representation. In Proceedings of the 29th ACM International Conference on Information & Knowledge Management, pages 1165–1174. Association for Computing Machinery.
- Paszke et al. (2019) Adam Paszke, Sam Gross, Francisco Massa, Adam Lerer, James Bradbury, Gregory Chanan, Trevor Killeen, Zeming Lin, Natalia Gimelshein, Luca Antiga, Alban Desmaison, Andreas Kopf, Edward Yang, Zachary DeVito, Martin Raison, Alykhan Tejani, Sasank Chilamkurthy, Benoit Steiner, Lu Fang, Junjie Bai, and Soumith Chintala. 2019. PyTorch: An imperative style, high-performance deep learning library. In Advances in Neural Information Processing Systems, volume 32. Curran Associates, Inc.
- Pennington et al. (2014) Jeffrey Pennington, Richard Socher, and Christopher Manning. 2014. GloVe: Global Vectors for Word Representation. In Proceedings of the 2014 Conference on Empirical Methods in Natural Language Processing (EMNLP), pages 1532–1543, Doha, Qatar. Association for Computational Linguistics.
- Popat et al. (2018) Kashyap Popat, Subhabrata Mukherjee, Andrew Yates, and Gerhard Weikum. 2018. DeClarE: Debunking fake news and false claims using evidence-aware deep learning. In Proceedings of the 2018 Conference on Empirical Methods in Natural Language Processing, pages 22–32, Brussels, Belgium. Association for Computational Linguistics.
- Przybyla (2020) Piotr Przybyla. 2020. Capturing the style of fake news. In Proceedings of the AAAI Conference on Artificial Intelligence, volume 34, pages 490–497. AAAI Press.
- Qi et al. (2021) Peng Qi, Juan Cao, Xirong Li, Huan Liu, Qiang Sheng, Xiaoyue Mi, Qin He, Yongbiao Lv, Chenyang Guo, and Yingchao Yu. 2021. Improving fake news detection by using an entity-enhanced framework to fuse diverse multimodal clues. In Proceedings of the 29th ACM International Conference on Multimedia, pages 1212–1220, Virtual Event, Chengdu, China. Association for Computing Machinery.
- Qi et al. (2019) Peng Qi, Juan Cao, Tianyun Yang, Junbo Guo, and Jintao Li. 2019. Exploiting multi-domain visual information for fake news detection. In 2019 IEEE International Conference on Data Mining (ICDM), pages 518–527. IEEE.
- Reimers and Gurevych (2019) Nils Reimers and Iryna Gurevych. 2019. Sentence-BERT: Sentence Embeddings using Siamese BERT-Networks. In Proceedings of the 2019 Conference on Empirical Methods in Natural Language Processing and the 9th International Joint Conference on Natural Language Processing (EMNLP-IJCNLP), pages 3982–3992, Hong Kong, China. Association for Computational Linguistics.
- Shaar et al. (2020) Shaden Shaar, Nikolay Babulkov, Giovanni Da San Martino, and Preslav Nakov. 2020. That is a known lie: Detecting previously fact-checked claims. In Proceedings of the 58th Annual Meeting of the Association for Computational Linguistics, pages 3607–3618, Online. Association for Computational Linguistics.
- Sheng et al. (2021a) Qiang Sheng, Juan Cao, Xueyao Zhang, Xirong Li, and Lei Zhong. 2021a. Article reranking by memory-enhanced key sentence matching for detecting previously fact-checked claims. In Proceedings of the 59th Annual Meeting of the Association for Computational Linguistics and the 11th International Joint Conference on Natural Language Processing (Volume 1: Long Papers), pages 5468–5481, Online. Association for Computational Linguistics.
- Sheng et al. (2021b) Qiang Sheng, Xueyao Zhang, Juan Cao, and Lei Zhong. 2021b. Integrating pattern-and fact-based fake news detection via model preference learning. In Proceedings of the 30th ACM International Conference on Information & Knowledge Management, pages 1640–1650, Virtual Event, Queensland, Australia. Association for Computing Machinery.
- Shu et al. (2019a) Kai Shu, Limeng Cui, Suhang Wang, Dongwon Lee, and Huan Liu. 2019a. dEFEND: Explainable Fake News Detection. In Proceedings of the 25th ACM SIGKDD International Conference on Knowledge Discovery & Data Mining, pages 395–405, Anchorage, AK, USA. Association for Computing Machinery.
- Shu et al. (2019b) Kai Shu, Suhang Wang, and Huan Liu. 2019b. Beyond News Contents: The Role of Social Context for Fake News Detection. In Proceedings of the twelfth ACM International Conference on Web Search and Data Mining, pages 312–320. Association for Computing Machinery.
- Silva et al. (2021) Amila Silva, Yi Han, Ling Luo, Shanika Karunasekera, and Christopher Leckie. 2021. Propagation2Vec: Embedding partial propagation networks for explainable fake news early detection. Information Processing & Management, 58(5):102618.
- Song et al. (2019) Changhe Song, Cheng Yang, Huimin Chen, Cunchao Tu, Zhiyuan Liu, and Maosong Sun. 2019. CED: Credible early detection of social media rumors. IEEE Transactions on Knowledge and Data Engineering.
- Thorne et al. (2018) James Thorne, Andreas Vlachos, Oana Cocarascu, Christos Christodoulopoulos, and Arpit Mittal. 2018. The Fact Extraction and VERification (FEVER) Shared Task. In Proceedings of the First Workshop on Fact Extraction and VERification (FEVER), pages 1–9. Association for Computational Linguistics.
- Vo and Lee (2021) Nguyen Vo and Kyumin Lee. 2021. Hierarchical multi-head attentive network for evidence-aware fake news detection. In Proceedings of the 16th Conference of the European Chapter of the Association for Computational Linguistics: Main Volume, pages 965–975, Online. Association for Computational Linguistics.
- Volkova et al. (2017) Svitlana Volkova, Kyle Shaffer, Jin Yea Jang, and Nathan Hodas. 2017. Separating facts from fiction: Linguistic models to classify suspicious and trusted news posts on Twitter. In Proceedings of the 55th Annual Meeting of the Association for Computational Linguistics (Volume 2: Short Papers), pages 647–653, Vancouver, Canada. Association for Computational Linguistics.
- Vosoughi et al. (2018) Soroush Vosoughi, Deb Roy, and Sinan Aral. 2018. The spread of true and false news online. Science, 359(6380):1146–1151.
- Wang et al. (2018) Yaqing Wang, Fenglong Ma, Zhiwei Jin, Ye Yuan, Guangxu Xun, Kishlay Jha, Lu Su, and Jing Gao. 2018. EANN: Event adversarial neural networks for multi-modal fake news detection. In Proceedings of the 24th ACM SIGKDD International Conference on Knowledge Discovery & Data Mining, pages 849–857, London, United Kingdom. Association for Computing Machinery.
- Wang et al. (2020) Youze Wang, Shengsheng Qian, Jun Hu, Quan Fang, and Changsheng Xu. 2020. Fake news detection via knowledge-driven multimodal graph convolutional networks. In Proceedings of the 2020 International Conference on Multimedia Retrieval, pages 540–547, Dublin, Ireland. Association for Computing Machinery.
- Wolf et al. (2020) Thomas Wolf, Lysandre Debut, Victor Sanh, Julien Chaumond, Clement Delangue, Anthony Moi, Pierric Cistac, Tim Rault, Remi Louf, Morgan Funtowicz, Joe Davison, Sam Shleifer, Patrick von Platen, Clara Ma, Yacine Jernite, Julien Plu, Canwen Xu, Teven Le Scao, Sylvain Gugger, Mariama Drame, Quentin Lhoest, and Alexander Rush. 2020. Transformers: State-of-the-art natural language processing. In Proceedings of the 2020 Conference on Empirical Methods in Natural Language Processing: System Demonstrations, pages 38–45, Online. Association for Computational Linguistics.
- Wu et al. (2021) Lianwei Wu, Yuan Rao, Yuqian Lan, Ling Sun, and Zhaoyin Qi. 2021. Unified dual-view cognitive model for interpretable claim verification. In Proceedings of the 59th Annual Meeting of the Association for Computational Linguistics and the 11th International Joint Conference on Natural Language Processing (Volume 1: Long Papers), pages 59–68, Online. Association for Computational Linguistics.
- Xiong et al. (2017) Chenyan Xiong, Zhuyun Dai, Jamie Callan, Zhiyuan Liu, and Russell Power. 2017. End-to-end neural ad-hoc ranking with kernel pooling. In Proceedings of the 40th International ACM SIGIR Conference on Research and Development in Information Retrieval, pages 55–64, Shinjuku, Tokyo, Japan. Association for Computing Machinery.
- Zhang et al. (2021) Xueyao Zhang, Juan Cao, Xirong Li, Qiang Sheng, Lei Zhong, and Kai Shu. 2021. Mining dual emotion for fake news detection. In Proceedings of the Web Conference 2021, pages 3465–3476, Ljubljana, Slovenia. Association for Computing Machinery.
- Zhou and Zafarani (2019) Xinyi Zhou and Reza Zafarani. 2019. Network-based Fake News Detection: A Pattern-Driven Approach. ACM SIGKDD Explorations Newsletter, 21(2):48–60.
Appendix A Sources of News Items as the Environmental Elements
Table 4 shows the selected news outlets that provides news items as the elements for news environment construction in Chinese and English. The Huffington Post part was derived from the Kaggle page (Misra, 2018; Misra and Grover, 2021) and we crawled the other parts.
| News Outlet | URL |
|---|---|
| Chinese | |
| People’s Daily | https://weibo.com/u/2803301701 |
| Xinhua Agency | https://weibo.com/u/1699432410 |
| Xinhua Net | https://weibo.com/u/2810373291 |
| CCTV News | https://weibo.com/u/2656274875 |
| The Paper | https://weibo.com/u/5044281310 |
| Toutiao News | https://weibo.com/u/1618051664 |
| English | |
| Huffington Post | https://www.kaggle.com/rmisra/news-category-dataset/ |
| NPR | https://www.npr.org/sections/news/archive |
| Daily Mail | https://www.dailymail.co.uk/home/sitemaparchive/ |
Appendix B Supplementary Implementation Details
B.1 Kernel Settings
We use kernels for softly counting the cosine similarities. Following Xiong et al. (2017), we first determine 21 kernels whose s scatter in with an interval of 0.1 and s are all 0.05. Then we add a kernel with a of 0.99 and a of 0.01, specially for extremely similar situations. The final kernel list is [(-1.0, 0.1), (-0.9, 0.1),, (1.0,0.1), (0.99, 0.01)]
B.2 Post-Training SimCSE
We post-trained the BERT models for two epochs, with the temperature coefficient of 0.05, the dropout rate of 0.3 (Chinese, hereafter, C) and 0.1 (English, hereafter, E), and the maximum length of 256 (C) and 128 (E).
B.3 Implementation of Base Models
-
•
Bi-LSTM: The hidden dims are 128 (C) and 256 (E). The maximum lengths are 256 (C) and 128 (E). The number of layers are 1 (C) and 2 (E). We use sgns.weibo.bigram-char121212https://github.com/Embedding/Chinese-Word-Vectors Li et al. (2018) for Chinese and glove.840B.300d131313https://nlp.stanford.edu/projects/glove/ Pennington et al. (2014) for English to obtain the word embeddings. The Chinese texts are segmented using jieba141414https://github.com/fxsjy/jieba and the English texts are tokenized using NLTK Bird (2006).
-
•
EANNT: The hidden dims, maximum lengths, and word embeddings are the same as Bi-LSTM. The kernel size for both datasets are . The numbers of filters are 20 (C) and 30 (E). We ran K-means Hartigan and Wong (1979) in the scikit-learn package to gather the training samples into 300 clusters (corresponding to 300 events).151515https://scikit-learn.org/stable/modules/generated/sklearn.cluster.KMeans.html
-
•
BERT and BERT-Emo: We use bert-base-chinese and bert-based-uncased for Chinese and English, respectively. The maximum lengths are 256 (C) and 128 (E). The dimension of each token representation is 768.
-
•
DeClarE and MAC: The Bi-LSTM component keeps the same settings as the post-only Bi-LSTM. The maximum lengths of articles are 100 (C) and 256 (E).
Appendix C Calculation of spAUC
Real-world fake news detection systems inevitably face a challenge of high imbalance of data (#real#fake), even if pre-screening procedures like check-worthiness estimation Hassan et al. (2017); Atanasova et al. (2018) are equipped. In the online test, we use the standardized partial AUC (spAUC) McClish (1989) for evaluation. It is suitable to our scenario where we expect the method to find fake news posts as many as possible with an acceptable misclassification rate of real ones. The partial AUC over the false positive rate is:
| (14) |
where is the Receiver Operating Characteristic curve. The spAUC is calculated as
| (15) |
In our experiment, we use the implementation in the scikit-learn package.161616https://scikit-learn.org/stable/modules/generated/sklearn.metrics.roc_auc_score.html
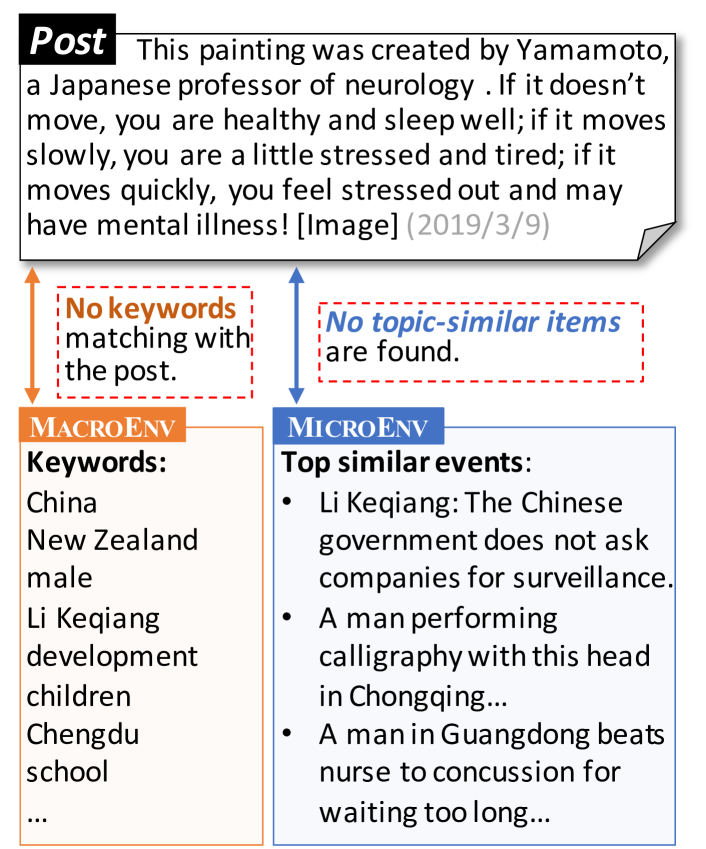
Appendix D Analysis on the Case Weakly Related to News Environments
Figure 8 shows a case that is weakly related to its news environment. Its words have no intersection with the keywords in the macro environment and the top similar events seem not very related. In this case, our NEP has limited utility as its nature of recency. That might explain why the performances were mostly lower than the post-only methods when we evaluated the NEP alone. For this case, it actually has some novelty (a novel and simple test of personal stress) but is involved with a long-lasting discussed topic—mental health, instead of a hot event being discussed at the very moment. This inspires us to explore how to incorporate more historical and background references to build a comprehensive understanding of the connection between a fake news post and broader societal environments in the future.