Multipolar social systems:
Measuring polarization beyond dichotomous contexts
Abstract
Social polarization is a growing concern worldwide, as it strains social relations, erodes trust in institutions, and thus threatens democratic societies. Academic efforts to understand this phenomenon have traditionally approached it from a one-dimensional perspective, focusing on bipolar or dichotomous systems. However, political conflicts often involve not only two, but multiple potentially dissenting factions. The most representative examples are multi-party democracies, where the multilateral tensions among different parties often lead to gridlock and uncertainty. Despite the prevalence of these multipolar systems, there is still a lack of suitable analytical tools to study their intricate polarization patterns. In this work, we develop an analytical framework consisting of an inherently multipolar model for unbiased ideological spaces, a method to infer multidimensional opinions from interaction networks, and novel multidimensional polarization metrics that quantify several aspects of ideological polarization and bring new insights into the analysis of high-dimensional opinion distributions. Crucially, our multidimensional framework does not assume the underlying ideological structure, such as conservative vs progressive, liberal vs authoritarian, etc. Instead, it reveals the natural space that best describes the social landscape, which does not necessarily correspond to traditional categories. We illustrate the application of this framework in quadripolar and pentapolar real-world democratic processes, finding non-trivial ideological structures with clear connections to the underlying social context. Our methodology offers a comprehensive perspective of multilateral social tensions, as it incorporates complementary aspects of polarization: network segregation, opinion extremeness, and issue alignment.
Introduction
Social polarization is a pervasive phenomenon [1] that has been observed in a wide variety of contexts like elections [2, 3], referenda [4] and around controversial issues [5, 6, 7, 8]. It has been argued that polarization exerts a negative influence over democracy [9], undermining social and economic relationships [10, 11], causing legislative gridlocks [12, 13], and even posing health risks [14, 5, 15]. However, it has also been found that some level of polarization can have healthy effects, as it produces clearer party choices [16, 17] and more constructive, focused and linguistically diverse debates [18]. In any case, to fully understand social dynamics we need tools to detect and measure polarization [19], as it is a core feature of many systems. In this work we develop a multidimensional opinion inference framework for networked systems and tools to measure and characterize the polarization patterns of the inferred opinion distributions.
Polarization is usually defined as the division of a population into two conflicting or contrasting groups [20, 21]. This intuitive notion coincides with one of the aspects of polarization: opinion extremeness, which is quantified by measuring how concentrated is the distribution of attitudes of the population towards some issue at two polar opposite positions (for example, immigration, abortion, or cannabis legalization). Although one-dimensional (or bipolar) aspects of polarization like opinion extremeness are by far the most studied [22, 23], there are other fundamental facets that can only be understood from a multidimensional perspective [20, 24, 25]. For instance, in a polarized context the policy preferences of the population on different issues are often correlated (a person that is in favor of strong immigration controls may also be against free abortion and cannabis legalization, and vice versa). This means that the individuals’ opinions get aligned along multiple lines of potential disagreement, exacerbating tensions and leading to a new kind of polarization: issue constraint [26, 27]. If a system is highly polarized in the sense of issue constraint, one can infer the ideological positions of an individual towards several issues by knowing her position on only one of them. A typical example is a highly partisan democracy [24, 28], where party identification determines many of the ideological positions of individuals. Societies with strong partisanship can also present affective polarization [10], meaning that supporters of the different parties dislike or even loathe each other.
Issue constraint is usually measured by analyzing the correlation between one-dimensional attitude distributions (one per issue or topic) built from opinion polls. These polls ask dichotomous questions about topics such as public health insurance, treatment of minorities or abortion [24]. The answers are typically organized in a Likert-like scale, ranging from complete agreement with something to complete disagreement. While this approach offers a multidimensional perspective, it is still fundamentally bipolar, as it consists in a combination of dichotomous issues. However, there are social contexts whose ideological space can not be modeled as a combination of bipolar axes: scenarios where opinions about a given issue are divided into more than two qualitatively different positions [29, 30, 31, 32, 33]. We call these contexts multipolar systems. The most representative examples are multi-party democracies, in which more than two parties have a realistic chance of obtaining significant representation. We model these systems by considering each party as an opinion pole. The intrinsic complexity of reaching multilateral government agreements sometimes leads to political instability and gridlock, causing recurrent repetition of elections and long periods of interim executives. Recent examples are found in Belgium [34], Israel [35], or Spain [36]. Understanding multipolar systems [37] is critical to identify the main lines of disagreement and address these issues, but their multidimensional polarization patterns are still largely unexplored. In this paper we model the ideological space of multipolar systems with opinion poles by placing each pole (for example, the parties in a multi-party democracy) at the vertex of a regular simplex of dimension (a multidimensional generalization of an equilateral triangle, which would correspond to a tripolar system). This way every pole is at the same distance of the others, avoiding the introduction of a priori biases.
Polarization is also closely linked to the way individuals from different social groups interact, so to get a complete understanding of polarization, it is necessary to consider not only the ideological stances of the polarized set of individuals or parties, but also the relationships among them [38, 39, 40]. After all, the formation of social ties between individuals is often related to their ideological affinity [41], potentially leading to network polarization [42, 43]; that is, the organization of a social network in highly connected subgroups (or clusters) with weak inter-group connectivity [44, 21, 45]. Taking this into account, we use an opinion inference framework based on networks of user interactions in online social media [46] (although the framework can be applied to any networked system). This methodology allows us to estimate the opinion distribution of the users and circumvents the common drawbacks of attitude inference techniques based on the content of user messages, such as the dependence on context and language [21].
To characterize and measure the polarization of the inferred opinion distribution we propose different metrics based on the covariance matrix, which is the multidimensional generalization of the variance, a quantity often adopted as a one-dimensional measure of polarization [22, 23]. In particular, we use the trace of the covariance matrix (the total variation) as a global measure of opinion extremeness, and its eigendecomposition to quantify pole constraint (a multipolar analogue of issue constraint), obtaining the direction of maximum polarization in the ideological space [47].
Summarizing, our multipolar framework is composed of three main elements: a multipolar ideological space, an opinion inference technique based on user interactions that yields a multidimensional opinion distribution and a set of polarization measures that are applied to that distribution. This approach synthesizes the ideological and networked perspectives of polarization and provides means to study multipolar analogues of both opinion extremeness and issue constraint. To illustrate our new framework in practice, we apply it to Twitter data of two multipolar electoral contexts, the Spanish general elections of the 20 of December 2015, with four poles, and the Spanish general elections of the 28 of April 2019, with five poles.
Results
We will begin this section by laying out the foundations of the multidimensional opinion inference methodology, the ideological space built from pole vectors and the multi-polarization measures we will use on the opinion distributions. Then, we will apply this framework to two empirical systems, showing how our results can be easily interpreted in terms of the underlying social context and illustrating the usefulness of this methodology to characterize multipolar systems. To help build an intuition about the methodological framework and facilitate the analysis of the data, we have prepared interactive visualizations that can be found at https://vis.csh.ac.at/multipolar-viz.
Opinion inference and polarization measurement
The multidimensional opinion model
Our multidimensional opinion inference technique is a generalization of a bipolar (one-dimensional) methodology [46] based on models of opinion dynamics. But instead of using a model to understand how opinions are disseminated and adopted [48, 49], we use it as an inference tool. The process consists in building a network of social interactions from empirical data, identifying the opinion leaders and their respective ideological positions. Then, we use the model to propagate the leaders’ opinions throughout the rest of the nodes. Finally, we take the model’s outputs (the converged opinions) as the inferred opinions of the nodes. Therefore, the opinion inference technique requires:
-
•
A network of interactions: we build it using data from social networking sites.
-
•
The elite: small disjoint subsets of nodes assigned to each of the opinion poles to be used as opinion seeds. The nodes of each subset should have different and extreme opinions about the topic under study. We will choose them using contextual information.
-
•
An opinion learning mechanism: An iterative opinion updating procedure to infer the opinions of the rest of the nodes (the listeners).
For the learning mechanism, we have adopted a modified version of the DeGroot linear learning model [50]. In this model, each elite node is assigned a fixed opinion depending on the option they support. Then, the opinion of the remaining nodes of the network (the listeners) is computed by iteratively averaging the opinions of their neighbors. This modified version of the DeGroot model including nodes with fixed opinions was originally developed by Friedkin and Johnsen [51] and has been extensively applied in bipolar contexts [46, 6, 3]. A multidimensional extension of the Friedkin-Johnsen (FJ) model has been proposed and thoroughly characterized by Parsegov et al. [52], so we will draw on their results for our inference technique.
In the FJ model a node’s opinion is not only influenced by its neighbors, but also by the node’s own prejudices. The relative influence of the prejudices and the neighbors’ opinions is controlled by a stubbornness parameter that can be different for every node. We consider a particular version of the FJ model with only two kinds of nodes (two possible values for the stubbornness parameter): stubborn nodes that only trust their prejudices (elite) and nodes with no prejudices (listeners).
Formally, let be a directed and weighted network with a set of nodes, a set of links and an adjacency matrix with the weight of the link . We adopt the convention that when there is a link from to , is being influenced by (’s opinion will pass onto during the inference process)111In addition to simplifying the notation, this convention also enables a straight forward analysis of retweet networks, which we will use to illustrate this methodology. In a retweet network, when user retweets user , we make a link , and since is broadcasting ’s message, she being influenced by .. Let be the set of opinion seeds or elite nodes and , the set of listeners. Each elite node is assigned an opinion vector that will remain constant throughout the iterative learning process. We call those extreme opinion vectors the opinion poles, and they will be defined below. The listener nodes are initially assigned a neutral opinion vector of the corresponding dimension. The opinion of the listeners is inferred by iteratively averaging the opinion of their neighbors, such that at each time step the opinion of a given listener is given by:
| (1) |
With the element of a modified adjacency matrix defined in such a way that elite nodes do not change opinion throughout the learning process. This is done by replacing all their outgoing links by a single self-loop (their rows are changed by vectors of s with a in the diagonal, so we use the Kronecker delta ):
| (2) |
This averaging process is iterated until convergence, which is guaranteed (and the solution is unique) as long as every listener is connected to at least one elite node through a directed path [52]. If is the matrix whose rows are the opinion vectors of the listeners, such that in a -dimensional opinion space , we consider that has converged when , where is the entrywise -norm of the matrix . We have set the tolerance to .
Pole vectors and the opinion simplex
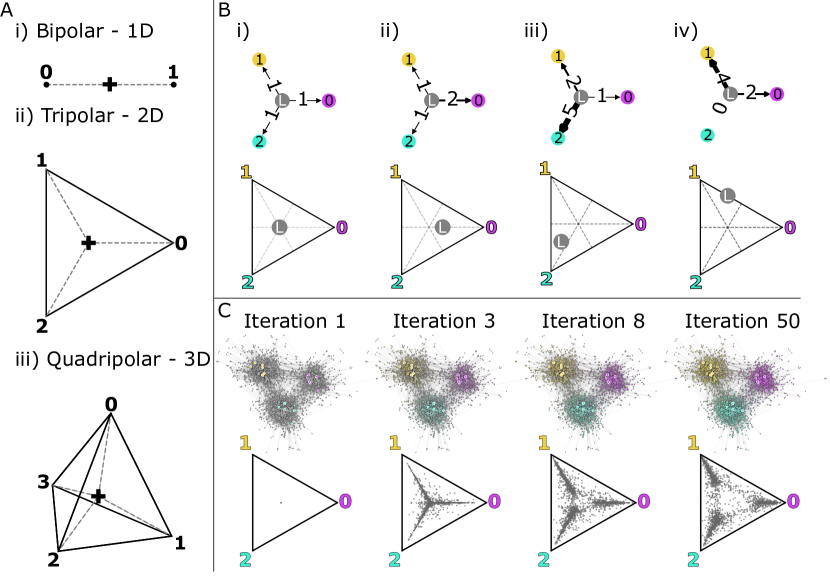
The cornerstone of our multipolar methodology are the elite opinion vectors or poles, as they determine the structure of the ideological space. In bipolar settings [46], a scalar value of or is assigned to the nodes of the two opposing elite subsets, placing the poles at a symmetrical position around zero. To generalize this idea for mutipolar systems, we need to place the poles at a fixed distance from the neutral ideological position (say ) and in such a way that the distance between any two poles is the same. A geometrical object that fulfills these requirements is the regular simplex222A regular -simplex is a generalization of the concept of equilateral triangle (which is a regular -simplex) to dimensions.. For a system with poles we build a regular simplex and place the poles on its vertices (therefore, ). In particular, we have chosen a regular simplex centered at the origin with the vertices at distance from the origin. We detail the computational process to obtain the coordinates of the pole vectors for an opinion space of arbitrary dimension in Supplementary Section 1. In Figure 1A we show the opinion spaces of dimension and . Notice that the distance between poles is different for opinion spaces of different dimension [53] (see Table 1).
| Number of dimensions | Distance between poles | ||||
|---|---|---|---|---|---|
We set the same distance between every pair of poles to adopt the most neutral, unbiased, or uninformative configuration. In some contexts it may seem more appropriate to place certain poles closer together; for example, in an election certain political parties may be more ideologically aligned between each other than with the rest. However, parties that share ideology also compete for the same electoral base, often leading to even greater antagonism between them. With our parsimonious approach, we impose no a priori bias and infer the affinity between poles from the opinion distribution obtained from interactions between individuals.
It is worth noting that the opinion assigned to any node will always be located withing the convex hull of the opinion poles, as the opinion updating mechanism is a convex combination and the pole vectors form a regular simplex. Therefore, if a node updates its opinion by increasing its support to a given pole (getting closer to it), her support for the remaining poles will decrease in the same proportion (will get equally away from the others). This implies that each node has the same constant opinion budget that it allocates among the different poles (see Supplementary Section 2 for a formal derivation).
In Figure 1B we illustrate how the opinion simplex works in a simple tripolar system consisting of a network composed of one listener node connected to three elite nodes, each associated to a different pole. If all the links have the same weight, the opinion of the listener node is neutral (see panel B.i); but if the weight of one of the links increases, the listener’s opinion gets closer to the corresponding pole and, importantly, gets equally away from the others (see panel B.ii). Panel B.iii shows a situation with different weights for every pole and panel B.iv shows that when the listener is only connected to two of the poles (the remaining weight is 0), its opinion lies on the edge that joins the two poles.
The previous simple example only required one iteration of Eq. (1) to obtain the opinion vector of the listener node. In larger networks it takes several iterations to achieve convergence. To better illustrate the process we will use a tripolar synthetic network built with the Lancichinetti-Fortunato-Radichi (LFR) method [54]. This method generates scale-free modular networks with a given number of nodes (we have chosen 1300), a given number of communities (we have chosen 3, to simulate a tripolar system), and a certain probability of each node to be connected to nodes of other communities rather than their own. The higher this probability, the more mixed is the network and less distinguishable are the modules. We have set this parameter to . For the opinion inference process, we have built the three subsets of elite nodes of the three poles by ranking the nodes according to their degrees and choosing the top 6 nodes of each community as the opinion seeds of each pole. In Figure 1C we show the iterative opinion inference process on this network.
Measures of multi-polarization
To study polarization in multipolar contexts we propose several metrics based on the covariance matrix, which is the natural multidimensional extension of the variance, one of the most common measures of social (bi)polarization [55, 56, 57]. Firstly, we define a multipolar generalization of the notion of opinion extremeness; secondly, we propose a way to compute the directions along which polarization is maximal, allowing us to measure pole constraint.
The covariance matrix of a random vector with expected value is defined as follows:
| (3) |
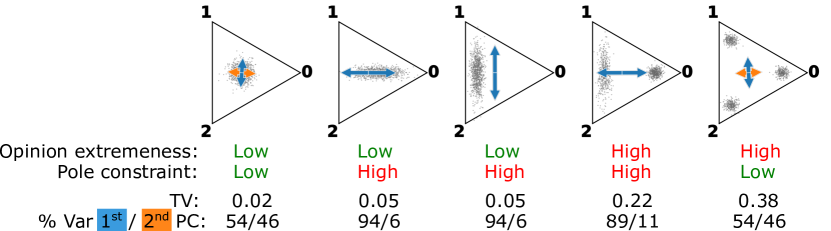
The trace of the covariance matrix can be interpreted as a measure of multidimensional variance, usually called total variation [58] (). Moreover, as we show in Methods, when the distance between the barycenter of the opinion simplex and the poles is , the maximum attainable is , so this metric is normalized by design. Crucially, the maximum is achieved when there are only extreme opinions and they are uniformly distributed among all the poles. Therefore, the can be used as a measure of global polarization combining the aspects of opinion extremeness and community fragmentation [56]; that is, it not only measures how extreme the opinions are but also how evenly is the population divided into the considered factions.
To characterize and quantify pole constraint we compute the eigen-decomposition of the covariance matrix, a technique commonly referred to as Principal Component Analysis (PCA) [58]. The eigenvectors (or Principal Components - PCs) form an orthogonal basis of the opinion space and their corresponding eigenvalues are the variances of the opinion distribution projected onto the direction of their associated eigenvector. Therefore, the eigenvector with the largest eigenvalue (or first Principal Component) corresponds to the direction of maximum variance; that is, the direction of maximum polarization [59]. We will show that the projections of the opinion distribution onto the directions of maximum polarization reveal the latent ideological space of the system. The proportion of variance explained by the first PCs provides a measure of pole constraint. If it is high, it means that the system’s ideological structure has a lower dimensionality than the considered space (it is constrained to a subspace). PCA allows us to extract the natural ideological dimensions that organize the social tensions of the system.
To help build an intuition of these polarization metrics, in Figure 2 we present synthetic opinion distributions on a tripolar system with different levels of opinion extremeness and pole constraint, respectively measured by their and the relative amount of variance explained by the PCs.
Empirical study of multipolar systems
In this section we illustrate the application of our opinion inference and multi-polarization measurement methodology to two real-world scenarios, one with four poles (3D opinion space) and another with five poles (4D opinion space).
We analyze these systems using Twitter data. We use the retweet networks of the Twitter users who participate in the conversation as the interaction networks on which the opinion inference process is performed. Retweets can be considered as a proxy of influence because they are a broadcasting mechanism that usually imply that the retweeting user agrees with the original tweet and has enough interest to perform the retweet action [60, 61, 62, 63]. Hence, whenever user retweets a message originally posted by user , is being influenced by ’s ideas and we make a directed link from to . The weight of the link is the number of times has retweeted within a given time interval.
Here we will focus on the multipolar analysis of the multidimensional opinion distributions, but the preliminary computations to obtain those distributions are detailed in Supplementary Sections 4 and 5, including the selection of the elite and the listeners. Throughout the analysis, we will show that the emergent patterns are consistent with the underlying sociopolitical reality and can be interpreted taking into account their context, highlighting the usefulness of the methodology for the study of multipolar social systems.
Quadripolar system: Spanish General Elections of 2015
We begin by analyzing the Spanish general elections of the 20 of December 2015, with four poles corresponding to the four main political parties. For this study we have worked with Twitter data retrieved during the electoral campaign of 4/12/2015 - 21/12/2015 by searching for messages that include a set of keywords relevant to the context, like EleccionesGenerales2015 or EleccionesGenerales28A. The details of the dataset can be found in Supplementary Section 6, and in Supplementary Section 7 we provide an overview of the sociopolitical context. The elite of this electoral context are politicians and supporters of PP, PSOE, Podemos and Cs. An elite node is required to have at least retweets and a participation ratio of at least . Additionally, it must belong to one of the communities associated with one of the poles (see Supplementary section 4):
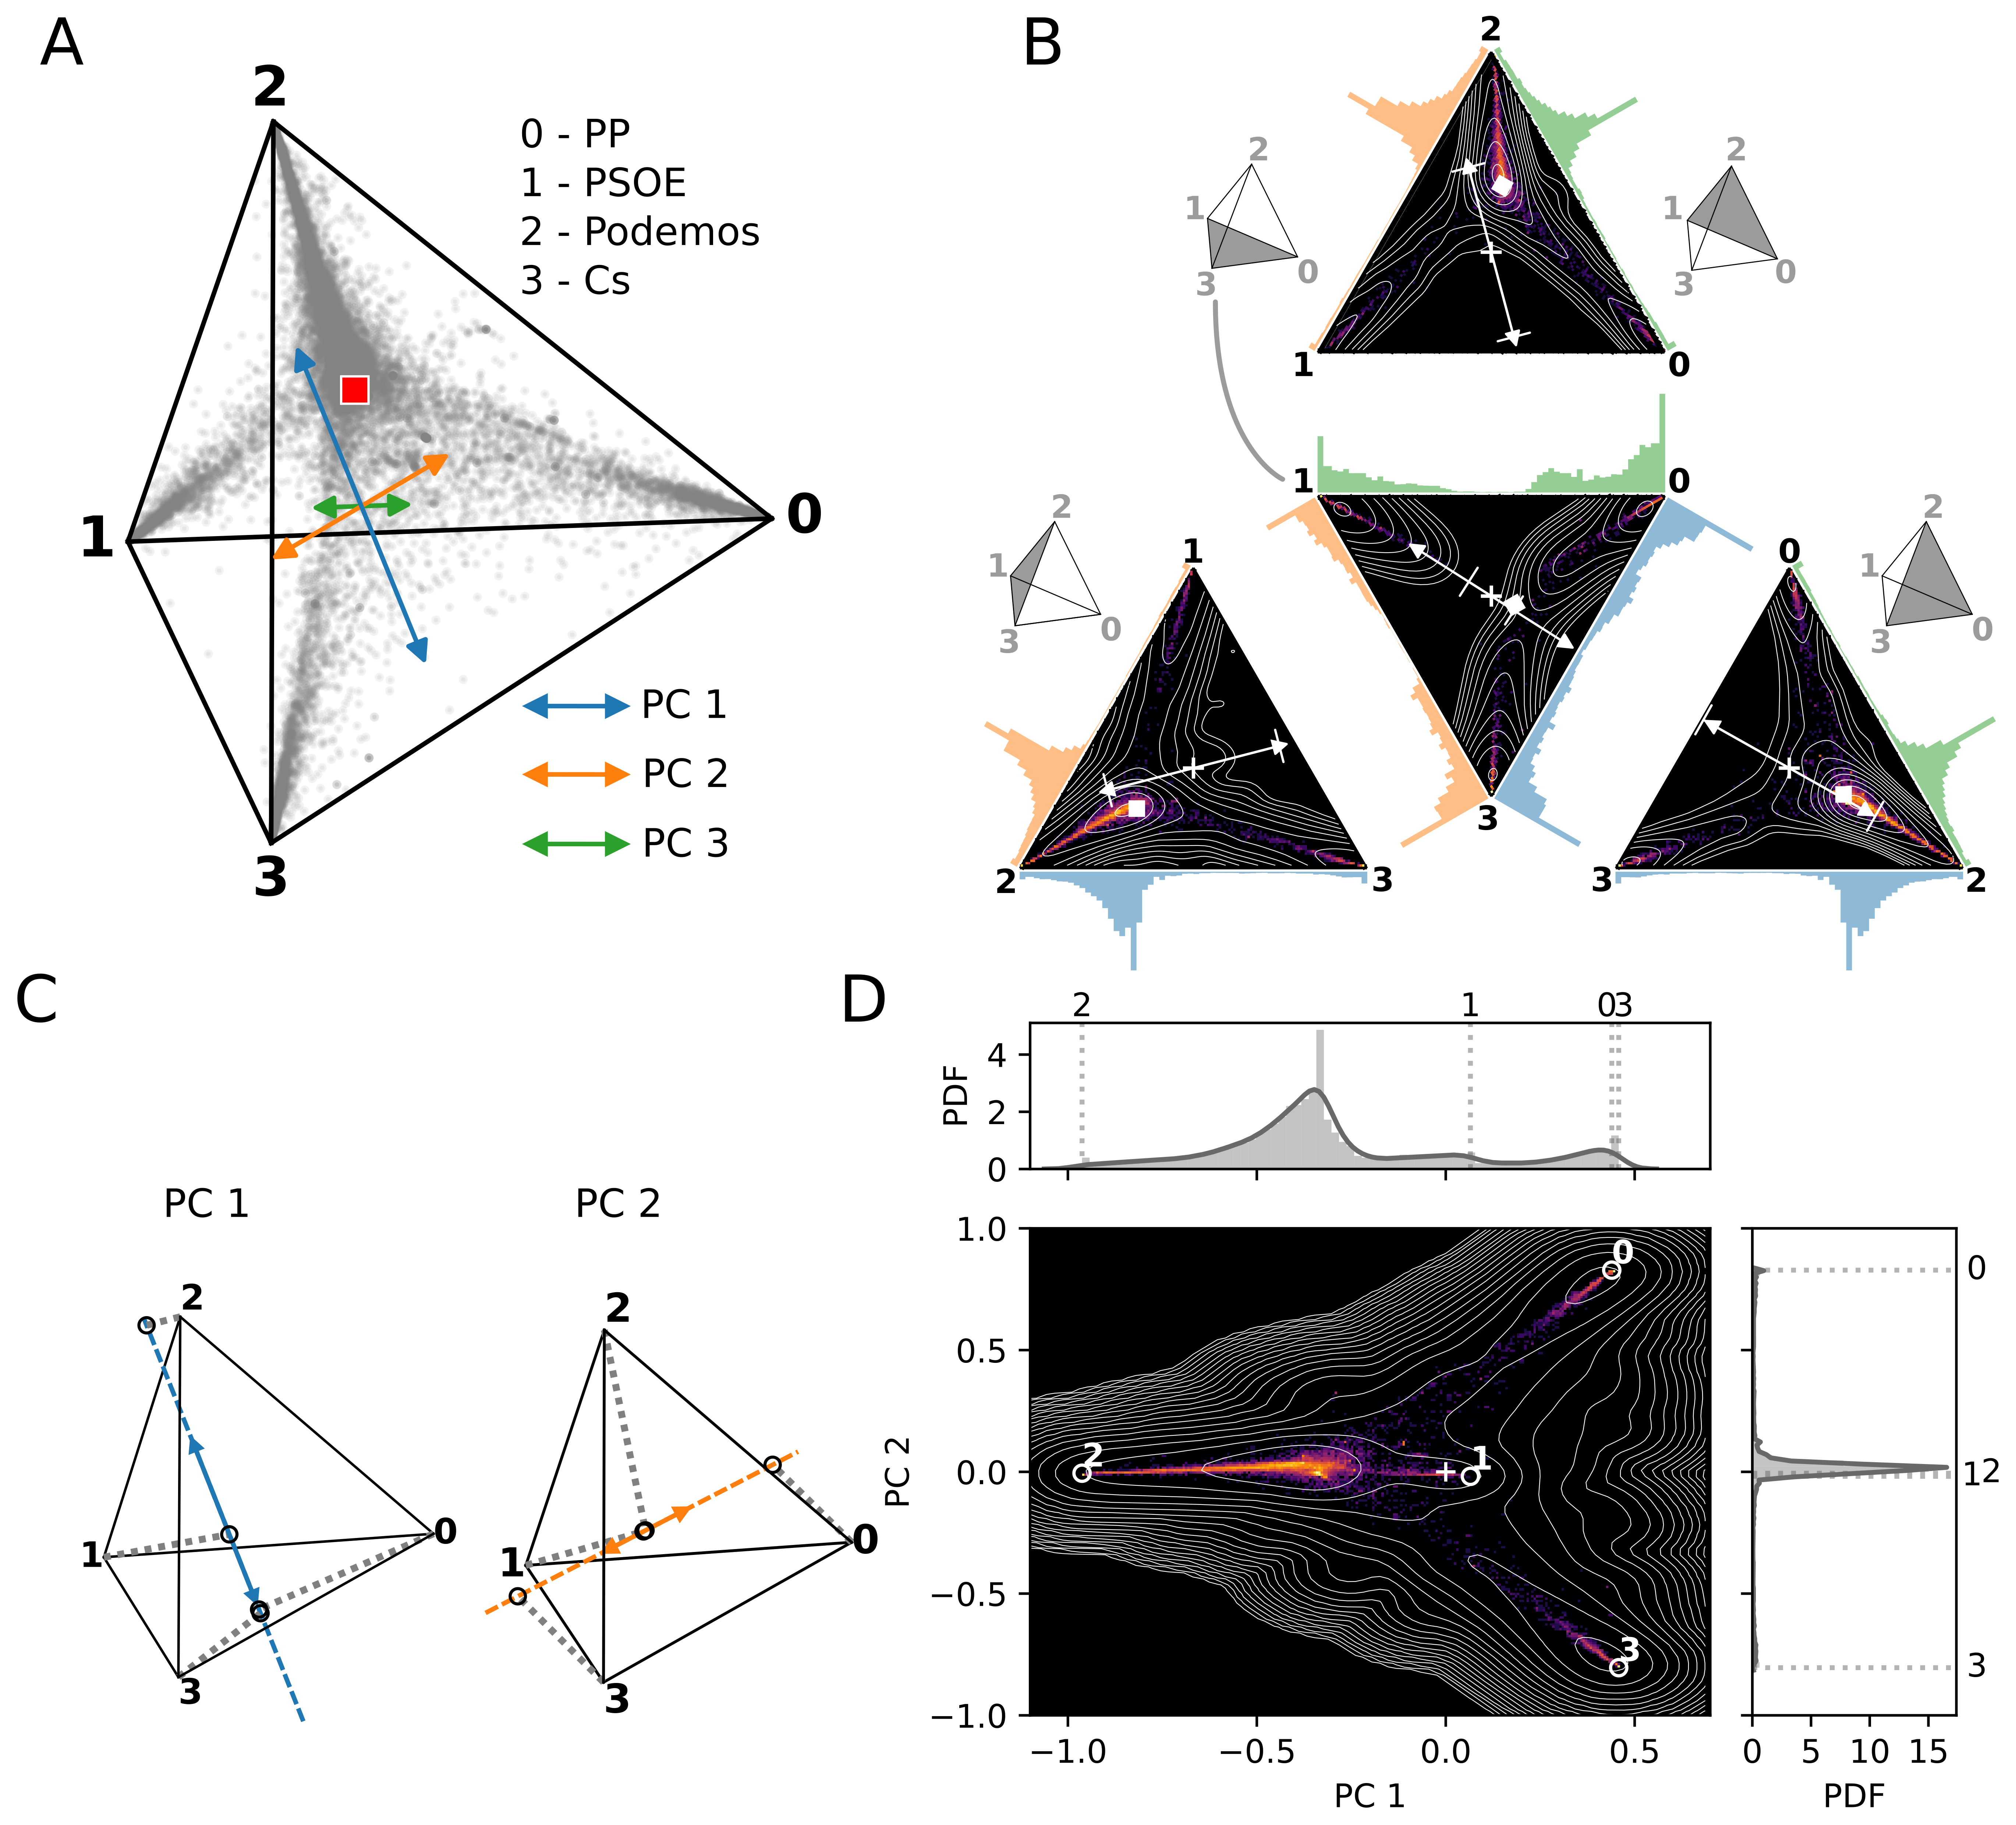
In a quadripolar context, the opinion space is a three-dimensional simplex (a tetrahedron). Since the original 3D opinion distribution is difficult to visualize in detail (see Figure 3A), we have projected it onto the faces of the simplex, as shown in Figure 3B. To avoid noise, we have filtered out users with low activity (tweets ). Additionally, in each projection, we only show the opinions of the users that are closer to the poles of interest (the vertices of the face in 2D projections and the vertices of the edge in 1D projections), i.e., opinions within the Voronoi cells of the corresponding poles. As explained in Supplementary Section 3, we do this to provide the most relevant information for each projection.
Figure 3 shows that users’ opinions are mainly concentrated near the poles, with filaments emerging from them and stretching towards the point of highest density. This maximum is found halfway between the Podemos pole (2) and the barycenter (marked in the projections with a cross), with the center of mass (marked with a square) very close to that maximum. The location of this maximum also causes the direction of maximum polarization (the first Principal Component, PC 1) to be mostly oriented with Podemos on one side and the other parties on the other. This can be explained both by the ideology (which will be discussed below) and the popularity of Podemos. In 2015 it was an emergent party that had achieved a moderate success in the previous European elections of 2014 (their first election), and had even reached first place in some electoral polls [64, 65]. Podemos’ popularity in Twitter has been also reported in other studies [66]. Since our multi-polarization measures are based on the variance of the opinion distribution, it is natural that a pole with high support (which concentrates a lot of opinion points in its vicinity) drives polarization.
The white double arrows shown in the projections mark the direction of maximum polarization projected onto each face. PC 1 explains of the total variation, which is as a sign of moderate to high pole constraint, meaning that opinions are aligned along a 1D axis to a certain extent. The total variation is , so this system presents moderate overall polarization in the sense of opinion extremeness.
The length of the segment delimited by the two short lines that crosses each white arrow is proportional to the size of the projection of PC 1 in the corresponding face. So when the segment is long, PC 1 is mostly parallel to the face, while when it is short, PC 1 is mostly orthogonal to it. The most orthogonal face to the direction of maximum polarization is , corresponding to PP, PSOE and Cs. This result can be explained because, since Podemos is on the left of PSOE (center-left) and Cs was defined as a center party [67], is the pole triplet with highest ideological affinity. This can also be observed in Supplementary Figure 6A, which shows the ideological location of the parties according to Spanish citizens’ perceptions.
Since the principal components reveal the directions along which social tensions are organized, we can also use them to extract the structure of the latent ideological space. In that space, the distances between the parties will no longer be fixed, but determined by their respective affinity according to the opinion distribution. We expose this latent space by projecting the opinion distribution and the positions of the poles onto the PCs. For the sake of visualization we do this for PC1 and PC2, which together explain of the variance. Figure 3C schematizes the projection process and Figure 3D shows the resulting distribution.
By looking at the projection along PC 1, we see that the parties are spontaneously divided into left-wing and right-wing. Therefore, even without imposing any such structure on the ideological space a priori, this information is encoded in the opinion distribution. But ideology is not the only driver of antagonism; for instance, parties that support similar policies also compete for the same electoral base, so they tend to emphasize their doctrinal differences [16, 68]. This secondary source of conflict is manifested in the distance between Podemos and PSOE. These two parties have some ideological affinity: they negotiated to reach a government agreement in 2015 and formed a joint executive after the elections of the 10 of November 2019. However, they also competed to be the leading party on the left, which triggered frictions between them [69]. In the case of the right-wing parties, this phenomenon does not manifest itself in PC 1, but it appears very clearly in PC 2, where they are located at opposite extremes.
Pentapolar system: Spanish General Elections of 2019
In this section, we analyze the Spanish General Elections of the 28 of April 2019 as a pentapolar case study. During this election, the support for the four main parties (PP, PSOE, Podemos and Cs) remained high, but a previously minority far-right party called Vox had attracted much attention, causing a transition towards a pentapolar system. In Supplementary Section 7 we give more details about the context in which this transition took place.
For this analysis we have worked with Twitter data retrieved during the period 11/4/2019 - 29/4/2019 (see Supplementary Section 6 for more details). The elite sets for this electoral context have been selected from the communities of influential and engaged users (at least retweets and a participation ratio equal or greater than ) associated to the five relevant parties (see Supplementary section 4):
In a pentapolar system the analysis grows considerably in complexity, as the opinion simplex has 10 faces. The 2D projections of the opinion distribution onto those faces are shown in Figure 4A.
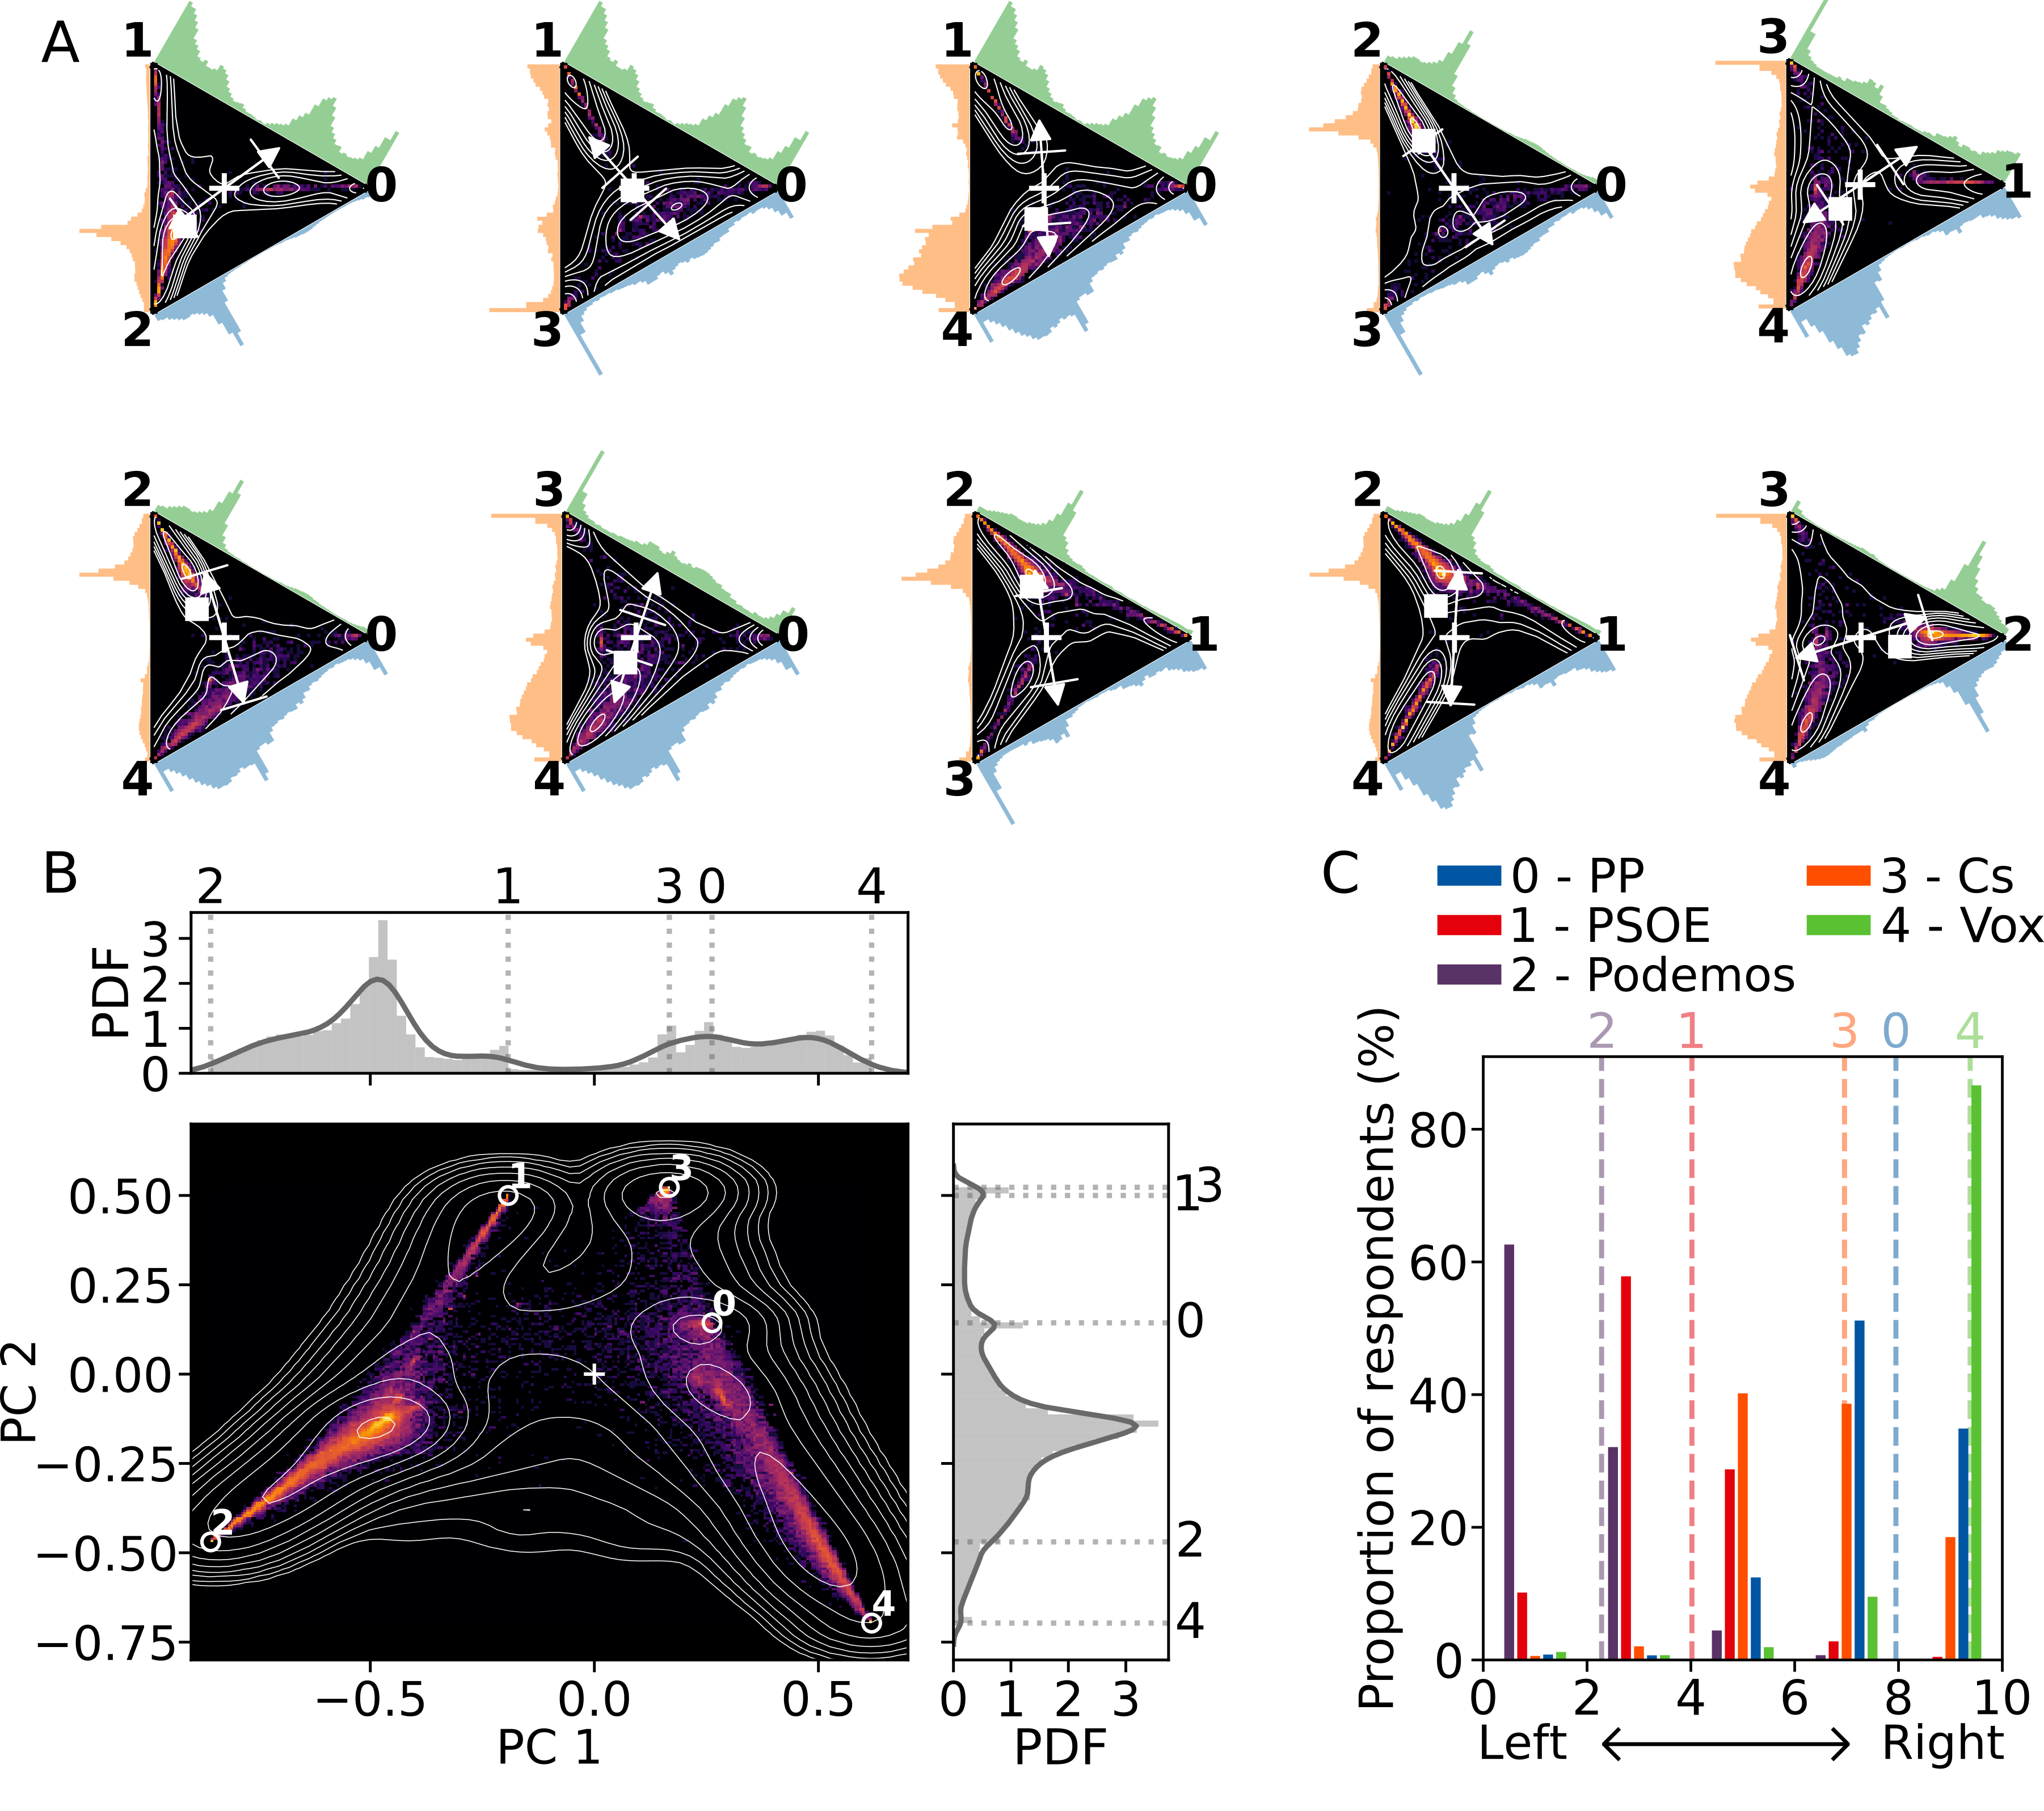
The highest concentration of users can be found near Podemos and Vox, although Podemos is more popular according to the position of the center of mass (see the projections where poles or appear). Additionally, high density areas appear near the edges shared by the two left-wing parties (Podemos and PSOE), as can be appreciated in projections , and . Similar concentrations are also found near the edges shared by two right-wing parties (Cs, PP and Vox) in the projections of 28A, like , , or .
With respect to the behavior of PC 1, faces and are the most orthogonal to the direction of maximum polarization, which can be explained by ideological affinity, as poles -(Cs, PP), -(Cs, PSOE) and -(PP, Vox) have formed coalitions in some regional governments. PC 1 explains of the total variance, indicating a high polarization in the sense of pole constraint. Notice that, if the variance was evenly distributed between the four PCs, each would account for , and PC 1 is responsible for more than double that value in this case. With a total variation of , this system is moderately polarized in the sense of opinion extremeness.
In Figure 4B we show the projection of the opinion distribution onto the first two principal components, which account for of the variance. As in the 2015 elections, in PC 1 the poles are spontaneously divided into left-wing and right-wing parties. And beyond that, their order strikingly matches their ideological positions according to the citizens’ perceptions (see Figure 4C). Therefore, in this context the left-wing / right-wing axis completely controls the direction of maximum polarization. The polarization along this axis is so strong that the projected distribution presents a gap (a global density minimum) between the two groups. These results are a quantitative validation of the classical notion of left/right ideological axis that has been extensively used to study party systems [16].
Once the effects of the left/right tensions have been discounted, in PC 2 the parties get split into extremist and moderate, with poles Podemos (2) and Vox (4) on one side and the rest on the other. Moreover, the relative distances of the poles to the endogenous ideological center matches their order in PC 2. We define the endogenous ideological center as the middle point between the two extreme parties; that is, the intermediate point between Podemos’ and Vox’s averages in Figure 4C, which is . The average position () and the distance of each party to the center () are presented in Table 2.
| Vox (4) | Podemos (2) | PP (0) | PSOE (1) | Cs (3) | |
|---|---|---|---|---|---|
| 9.38 | 2.28 | 7.95 | 4.02 | 6.96 | |
| 3.55 | 3.55 | 2.12 | 1.81 | 1.13 |
Discussion
In this work we have developed a framework to infer multidimensional opinions and measure different aspects of polarization in multipolar systems. These kinds of systems are common (the most representative example being multi-party democracies), but despite the increasing interest in modeling multidimensional polarization dynamics [71, 72, 59, 37], an analytical framework for characterizing real-world mutlipolar systems was lacking.
One caveat about the datasets used to illustrate the application of this framework is that Twitter data may contain some biases due to the type of audience using it.Two potential de-biasing strategies could be (i) using complementary data from other online social networks and / or (ii) calibrating the results using surveys. However, we have shown that even without applying any de-biasing, we obtain meaningful results with a clear sociological interpretation.
As for the method itself, it is worth emphasizing that opinion inference and polarization measurement are two independent processes. Therefore, the opinion inference technique can be used on its own in any networked system to obtain a cloud of multidimensional opinion points. This opens the door to the application of any multivariate statistical techniques and machine learning models. In our case studies, for example, clustering techniques like Gaussian mixture models could be used to identify probability density maxima, which can be interepreted as endogenous opinion poles. On the other hand, the multipolar analysis based on the covariance matrix is of course not restricted to opinion distributions obtained with our method, but can be used for any opinion distribution [59]. The flexibility of our framework makes it suitable to address pressing societal issues.
De-escalation of social tensions and working towards consensus.
As discussed in the Introduction, there is a growing concern about the pernicious influence of polarization on democracy. It has been argued that multipolarity could be a possible pathway towards reducing polarization through a more complex information space and greater diversity [73]. But does the diversity of multipolar societies actually alleviate opinion extremeness? Does it help cross-cutting cleavages? As our empirical results show, our analytical framework can significantly contribute to answer these questions. Beyond their use as descriptive tools, our polarization measures could be used to find the main lines of disagreement in a given context. This could help policymakers devise de-escalation interventions by addressing the issues that cause the strongest tensions.
Mis- and disinformation spreading by bots and trolls.
It has been argued that the pervasive use of (semi)automatic accounts to spread disinformation is undermining democratic processes by fostering doubt and destabilizing democratic societies [74]. In some cases, a majority of users, unaware of their role, amplify messages that polarize communities. Our opinion inference technique could help to tackle this issue by evaluating the influence of bots and trolls. Once these accounts have been identified, they can be used as the opinion seeds (the elite) of the inference process. Then, their influence over other users can be compared to that of human actors [75].
From a wider perspective, our results have implications not only for the measurement of polarization, but also for the characterization of party systems.
Comprehensive measurement of polarization.
In line with the literature [56, 20], we argue that polarization is a multi-faceted phenomenon. Its multiple potential meanings complicate its adequate characterization and measurement. Therefore, specifying the notion of polarization under study and its particular operationalization is of utmost importance. Additionally, to fully characterize a system, different measures for complementary aspects of polarization should be used. As we have shown, sometimes it is the less intuitive facets that provide the most relevant information.
Characterization of party systems.
The overlapping collections of policy preferences and ideological identities of parties shape the multipolar opinion distribution. As our analyses of real-world multipolar contexts show, this distribution can be used to infer the structure of the underlying ideological space, including, but not being limited to, the usual left-wing / right-wing axis. This is one of the most commonly used notions to characterize party systems [16]. Although we have validated the employment of the left/right axis for such analyses, our findings demonstrate that a rigid classification of parties into pre-defined dimensions (left/right, authoritarian/libertarian, etc.) may not paint the most complete or accurate picture. Each context has its own structure, and even within the same democratic system, this structure may and do change. Instead of imposing any structure, our parsimonious approach is flexible and adaptive, finding the most significant dimensions for each context in a principled way.
Conclusions
To summarize, we have presented an opinion inference technique, an ideological space model, and a set of multi-polarization measures to characterize multipolar systems. We perform the opinion inference using networks of social interactions. After building the network, we select a small set of elite nodes (opinion leaders) divided into disjoint subsets, each with a strong affinity for one of the poles of the system. Then, we use the elite nodes as opinion seeds to estimate the opinion of the remaining nodes (the listeners) with the multidimensional FJ model (an extension of the DeGroot model).
A key contribution of this work is the abstraction of opinions as dimensional vectors, with the opinion poles placed at the vertices of an regular simplex. The pole vectors defined this way endow the opinion points with the properties of unbiasedness and interdependence. They are unbiased because the poles are placed at a fixed distance from the neutral point and the distance between any two poles is the same. They are interdependent because for an opinion point to get closer to a given pole, it simultaneously must get away from the others.
From the application of the opinion inference technique we get an dimensional opinion distribution, which we analyze with multidimensional polarization measures based on the covariance matrix. We use the trace of the covariance matrix as a multidimensional metric for opinion extremeness and its eigendecomposition to get the direction of maximum polarization and quantify pole constraint.
We have applied this framework to empirical data from multi-party elections, revealing meaningful and complex properties of the systems with direct links to their sociological background. We have found that the ideological differences and affinities between the parties are clearly reflected in the obtained opinion distribution. Those parties with higher affinity tend to form subspaces that are orthogonal to the direction of maximum polarization. Furthermore, the parties’ positions along that direction coincide with their location in the left-wing / right-wing axis. However, despite its central role in shaping the opinion space, ideology is not the only driver of polarization. In one of the studied systems, competition between parties of similar ideology was another relevant source of tension. In the other, the perceived extremism of the parties acted as a secondary differentiating axis. Therefore, our approach extracts the drivers of polarization specific to each system. This adaptability makes our framework suitable for the study of democratic systems undergoing political transitions, where the traditional methods based on qualitative sociopolitical analysis may fail to reveal all the relevant information.
Materials and methods
Total variation as aggregate multidimensional variance
To show that the trace of the covariance matrix (the total variation) can be interpreted as a measure of aggregate multidimensional variance, let us take the definition of variance:
| (4) |
And replace the random variable by a random vector , such that the difference between the variable and its expected value is replaced by the Euclidean distance . Then, define the total variation as:
| (5) | ||||
Maximum variance of an opinion distribution
Opinion distributions are embedded in a regular -simplex with distance between the barycenter of the simplex and the vertices. This means that the diameter of an opinion distribution, which coincides with the distance between any two vertices of the simplex, is:
| (6) |
Now, let us take into account this theorem proven in a recent work by Lim and McCann [76], where they use the term variance instead of total variation for the quantity of Eq. (5):
Theorem: Isodiametric variance bound. If the support of a Borel probability measure on has diameter no greater than , then . Equality holds if and only if assigns mass to each vertex of a regular -simplex having diameter .
That is, the maximum variance of a probability distribution embedded in a regular -simplex is:
| (7) |
So, since we have set for our computations, . And this value is achieved when there are only extreme opinions (at the vertices of the simplex) and they are uniformly distributed among the poles.
Data and codes
The interactive visualizations elaborated by Liuhuaying Yang and Johannes Sorger from the visualization team of the Complexity Science Hub Vienna are hosted in https://vis.csh.ac.at/multipolar-viz. The data and python codes to reproduce the results of the paper are hosted in https://github.com/samuel-mg/multipolar_paper. The data have been pseudonymized and protected with a code that will be made available by the authors upon reasonable request. We have also prepared easy-to-use python scripts so that researchers can apply the multipolar framework to analyze their own datasets https://github.com/samuel-mg/multipolar.
Acknowledgements
This work has been supported by the Spanish Ministry of Science, Innovation and Universities (MICIU) under Contract No. PGC2018-093854-B-I00, by Spanish Ministry of Education, Culture and Sport (Grant No. FPU15/01461), and by the Austrian research agency (FFG) under project No. 873927. The authors would like to thank Liuhuaying Yang and Johannes Sorger, from the visualization team of the Complexity Science Hub Vienna, for their outstanding visualizations.
References
- [1] S. A. Levin, H. V. Milner, and C. Perrings, “The dynamics of political polarization,” Proceedings of the National Academy of Sciences, vol. 118, no. 50, p. e2116950118, 2021.
- [2] P. Grover, A. K. Kar, Y. K. Dwivedi, and M. Janssen, “Polarization and acculturation in US Election 2016 outcomes – Can twitter analytics predict changes in voting preferences,” Technological Forecasting and Social Change, vol. 145, pp. 438–460, Aug. 2019.
- [3] G. Olivares, J. P. Cárdenas, J. C. Losada, and J. Borondo, “Opinion Polarization during a Dichotomous Electoral Process,” Complexity, vol. 2019, p. e5854037, Feb. 2019.
- [4] S. B. Hobolt, “The Brexit vote: A divided nation, a divided continent,” Journal of European Public Policy, vol. 23, pp. 1259–1277, Oct. 2016.
- [5] A. Gollwitzer, C. Martel, W. J. Brady, P. Pärnamets, I. G. Freedman, E. D. Knowles, and J. J. Van Bavel, “Partisan differences in physical distancing are linked to health outcomes during the COVID-19 pandemic,” Nature Human Behaviour, vol. 4, pp. 1186–1197, Nov. 2020.
- [6] J. Atienza-Barthelemy, S. Martin-Gutierrez, J. C. Losada, and R. M. Benito, “Relationship between ideology and language in the Catalan independence context,” Scientific Reports, vol. 9, p. 17148, Nov. 2019.
- [7] R. J. Antonio and R. J. Brulle, “The Unbearable Lightness of Politics: Climate Change Denial and Political Polarization,” The Sociological Quarterly, vol. 52, pp. 195–202, May 2011.
- [8] J. Török, G. Iñiguez, T. Yasseri, M. San Miguel, K. Kaski, and J. Kertész, “Opinions, conflicts, and consensus: Modeling social dynamics in a collaborative environment,” Phys. Rev. Lett., vol. 110, p. 088701, Feb 2013.
- [9] D. Baldassarri and S. E. Page, “The emergence and perils of polarization,” Proceedings of the National Academy of Sciences, vol. 118, no. 50, p. e2116863118, 2021.
- [10] S. Iyengar, Y. Lelkes, M. Levendusky, N. Malhotra, and S. J. Westwood, “The Origins and Consequences of Affective Polarization in the United States,” Annual Review of Political Science, vol. 22, pp. 129–146, May 2019.
- [11] A. J. Stewart, J. B. Plotkin, and N. McCarty, “Inequality, identity, and partisanship: How redistribution can stem the tide of mass polarization,” Proceedings of the National Academy of Sciences, vol. 118, no. 50, p. e2102140118, 2021.
- [12] E. J. Finkel, C. A. Bail, M. Cikara, P. H. Ditto, S. Iyengar, S. Klar, L. Mason, M. C. McGrath, B. Nyhan, D. G. Rand, L. J. Skitka, J. A. Tucker, J. J. V. Bavel, C. S. Wang, and J. N. Druckman, “Political sectarianism in America,” Science, vol. 370, pp. 533–536, Oct. 2020.
- [13] J. R. Bond, R. Fleisher, and J. E. Cohen, “Presidential-Congressional Relations in an Era of Polarized Parties and a 60-Vote Senate,” in American Gridlock: The Sources, Character, and Impact of Political Polarization (A. Yoshinaka and J. A. Thurber, eds.), pp. 133–151, Cambridge: Cambridge University Press, 2015.
- [14] M. W. Macy, M. Ma, D. R. Tabin, J. Gao, and B. K. Szymanski, “Polarization and tipping points,” Proceedings of the National Academy of Sciences, vol. 118, no. 50, p. e2102144118, 2021.
- [15] J. J. V. Bavel, K. Baicker, P. S. Boggio, V. Capraro, A. Cichocka, M. Cikara, M. J. Crockett, A. J. Crum, K. M. Douglas, J. N. Druckman, J. Drury, O. Dube, N. Ellemers, E. J. Finkel, J. H. Fowler, M. Gelfand, S. Han, S. A. Haslam, J. Jetten, S. Kitayama, D. Mobbs, L. E. Napper, D. J. Packer, G. Pennycook, E. Peters, R. E. Petty, D. G. Rand, S. D. Reicher, S. Schnall, A. Shariff, L. J. Skitka, S. S. Smith, C. R. Sunstein, N. Tabri, J. A. Tucker, S. van der Linden, P. van Lange, K. A. Weeden, M. J. A. Wohl, J. Zaki, S. R. Zion, and R. Willer, “Using social and behavioural science to support COVID-19 pandemic response,” Nature Human Behaviour, vol. 4, pp. 460–471, May 2020.
- [16] R. J. Dalton, “The Quantity and the Quality of Party Systems: Party System Polarization, Its Measurement, and Its Consequences,” Comparative Political Studies, vol. 41, pp. 899–920, July 2008.
- [17] M. S. Levendusky, “Clearer Cues, More Consistent Voters: A Benefit of Elite Polarization,” Political Behavior, vol. 32, pp. 111–131, Mar. 2010.
- [18] F. Shi, M. Teplitskiy, E. Duede, and J. A. Evans, “The wisdom of polarized crowds,” Nature Human Behaviour, vol. 3, pp. 329–336, Apr. 2019.
- [19] I. Waller and A. Anderson, “Quantifying social organization and political polarization in online platforms,” Nature, vol. 600, pp. 264–268, Dec. 2021.
- [20] S. Schweighofer, F. Schweitzer, and D. Garcia, “A Weighted Balance Model of Opinion Hyperpolarization,” Journal of Artificial Societies and Social Simulation, vol. 23, no. 3, p. 5, 2020.
- [21] P. C. Guerra, W. Meira, C. Cardie, and R. D. Kleinberg, “A Measure of Polarization on Social Media Networks Based on Community Boundaries,” in ICWSM, 2013.
- [22] A. Bramson, P. Grim, D. J. Singer, W. J. Berger, G. Sack, S. Fisher, C. Flocken, and B. Holman, “Understanding Polarization: Meanings, Measures, and Model Evaluation,” Philosophy of Science, vol. 84, pp. 115–159, Aug. 2016.
- [23] P. DiMaggio, J. Evans, and B. Bryson, “Have American’s Social Attitudes Become More Polarized?,” American Journal of Sociology, vol. 102, pp. 690–755, Nov. 1996.
- [24] D. Baldassarri and A. Gelman, “Partisans without Constraint: Political Polarization and Trends in American Public Opinion,” AJS; American journal of sociology, vol. 114, pp. 408–446, Jan. 2008.
- [25] P. E. Converse, “The nature of belief systems in mass publics,” Critical Review, vol. 18, no. 1-3, pp. 1–74, 1964.
- [26] M. Kawakatsu, Y. Lelkes, S. A. Levin, and C. E. Tarnita, “Interindividual cooperation mediated by partisanship complicates madison’s cure for “mischiefs of faction”,” Proceedings of the National Academy of Sciences, vol. 118, no. 50, p. e2102148118, 2021.
- [27] J. McCoy, T. Rahman, and M. Somer, “Polarization and the Global Crisis of Democracy: Common Patterns, Dynamics, and Pernicious Consequences for Democratic Polities,” American Behavioral Scientist, vol. 62, pp. 16–42, Jan. 2018.
- [28] M. P. Fiorina and S. J. Abrams, Disconnect: The Breakdown of Representation in American Politics. Norman: University of Oklahoma Press, 2009.
- [29] A. Reina, J. A. R. Marshall, V. Trianni, and T. Bose, “Model of the best-of-N nest-site selection process in honeybees,” Physical Review E, vol. 95, p. 052411, May 2017.
- [30] A. F. Siegenfeld and Y. Bar-Yam, “Negative representation and instability in democratic elections,” Nature Physics, vol. 16, pp. 186–190, Feb. 2020.
- [31] A. Franci, M. Golubitsky, A. Bizyaeva, and N. E. Leonard, “A model-independent theory of consensus and dissensus decision making,” arXiv:1909.05765 [physics, q-bio], Sept. 2020.
- [32] P. Reverdy, “Dynamical, value-based decision making among N options,” arXiv:2003.03874 [cs, eess, math], Mar. 2020.
- [33] A. Bizyaeva, A. Franci, and N. E. Leonard, “A General Model of Opinion Dynamics with Tunable Sensitivity,” arXiv:2009.04332 [cs, eess, math], Oct. 2020.
- [34] J. Rankin, “Belgium agrees on government nearly two years after previous one fell.” The Guardian, http://www.theguardian.com/world/2020/sep/30/belgium-agrees-on-government-nearly-two-years-after-previous-one-fell, Sept. 2020. Date posted: 30-9-2020, last accessed 20-12-2021.
- [35] Y. Serhan, “What is the point of repeat elections?.” The Atlantic, https://www.theatlantic.com/international/archive/2019/11/israel-peril-repeat-elections/602575/, Nov. 2019. Date posted: 26-11-2019, last accessed 20-12-2021.
- [36] “Spain’s upper house approves first full-year budget since 2016.” Reuters, https://www.reuters.com/article/spain-budget-idINL8N2J246P, Dec. 2020. Date posted: 22-12-2020, last accessed 20-12-2021.
- [37] P. Manshour and A. Montakhab, “Dynamics of social balance on networks: The emergence of multipolar societies,” Phys. Rev. E, vol. 104, p. 034303, Sep 2021.
- [38] D. Garcia, A. Abisheva, S. Schweighofer, U. Serdült, and F. Schweitzer, “Ideological and Temporal Components of Network Polarization in Online Political Participatory Media,” Policy & Internet, vol. 7, no. 1, pp. 46–79, 2015.
- [39] D. Baldassarri and P. Bearman, “Dynamics of political polarization,” American Sociological Review, vol. 72, no. 5, pp. 784–811, 2007.
- [40] M. Conover, J. Ratkiewicz, M. Francisco, B. Goncalves, F. Menczer, and A. Flammini, “Political polarization on twitter,” Proceedings of the International AAAI Conference on Web and Social Media, vol. 5, pp. 89–96, Aug. 2021.
- [41] A. FLACHE and M. W. MACY, “Small Worlds and Cultural Polarization,” The Journal of Mathematical Sociology, vol. 35, pp. 146–176, Jan. 2011.
- [42] C. K. Tokita, A. M. Guess, and C. E. Tarnita, “Polarized information ecosystems can reorganize social networks via information cascades,” Proceedings of the National Academy of Sciences, vol. 118, no. 50, p. e2102147118, 2021.
- [43] F. P. Santos, Y. Lelkes, and S. A. Levin, “Link recommendation algorithms and dynamics of polarization in online social networks,” Proceedings of the National Academy of Sciences, vol. 118, no. 50, p. e2102141118, 2021.
- [44] K. Garimella, G. D. F. Morales, A. Gionis, and M. Mathioudakis, “Quantifying Controversy on Social Media,” ACM Transactions on Social Computing, vol. 1, pp. 3:1–3:27, Jan. 2018.
- [45] A. Asikainen, G. Iñiguez, J. Ureña-Carrión, K. Kaski, and M. Kivelä, “Cumulative effects of triadic closure and homophily in social networks,” Science Advances, vol. 6, no. 19, p. eaax7310, 2020.
- [46] A. J. Morales, J. Borondo, J. C. Losada, and R. M. Benito, “Measuring political polarization: Twitter shows the two sides of Venezuela,” Chaos: An Interdisciplinary Journal of Nonlinear Science, vol. 25, p. 033114, Mar. 2015.
- [47] P. Barberá, J. T. Jost, J. Nagler, J. A. Tucker, and R. Bonneau, “Tweeting From Left to Right: Is Online Political Communication More Than an Echo Chamber?,” Psychological Science, Aug. 2015.
- [48] H. Sayama, “Enhanced ability of information gathering may intensify disagreement among groups,” Physical Review E, vol. 102, p. 012303, July 2020.
- [49] L. Böttcher, P. Montealegre, E. Goles, and H. Gersbach, “Competing activists—Political polarization,” Physica A: Statistical Mechanics and its Applications, vol. 545, p. 123713, May 2020.
- [50] M. H. Degroot, “Reaching a Consensus,” Journal of the American Statistical Association, vol. 69, pp. 118–121, Mar. 1974.
- [51] N. E. Friedkin and E. C. Johnsen, “Social influence networks and opinion change,” Advances in Group Processes, vol. 16, pp. 1–29, 1999.
- [52] S. E. Parsegov, A. V. Proskurnikov, R. Tempo, and N. E. Friedkin, “Novel Multidimensional Models of Opinion Dynamics in Social Networks,” IEEE Transactions on Automatic Control, vol. 62, pp. 2270–2285, May 2017.
- [53] M. Hajja, M. Hayajneh, B. Nguyen, and S. Shaqaqha, “Distances from the Vertices of a Regular Simplex,” Results in Mathematics, vol. 72, pp. 633–648, Sept. 2017.
- [54] A. Lancichinetti, S. Fortunato, and F. Radicchi, “Benchmark graphs for testing community detection algorithms,” Physical Review E, vol. 78, p. 046110, Oct. 2008.
- [55] P. DiMaggio, J. Evans, and B. Bryson, “Have american’s social attitudes become more polarized?,” American Journal of Sociology, vol. 102, pp. 690–755, Nov. 1996.
- [56] A. Bramson, P. Grim, D. J. Singer, S. Fisher, W. Berger, G. Sack, and C. Flocken, “Disambiguation of social polarization concepts and measures,” The Journal of Mathematical Sociology, vol. 40, pp. 80–111, Apr. 2016.
- [57] S. Banisch and E. Olbrich, “Opinion polarization by learning from social feedback,” The Journal of Mathematical Sociology, vol. 43, pp. 76–103, Apr. 2019.
- [58] I. T. Jolliffe and Springer-Verlag, Principal Component Analysis. Springer Series in Statistics, Springer, 2002.
- [59] S. Schweighofer, D. Garcia, and F. Schweitzer, “An agent-based model of multi-dimensional opinion dynamics and opinion alignment,” Chaos: An Interdisciplinary Journal of Nonlinear Science, vol. 30, p. 093139, Sept. 2020.
- [60] P. Metaxas, E. Mustafaraj, K. Wong, L. Zeng, M. O’Keefe, and S. Finn, “What Do Retweets Indicate? Results from User Survey and Meta-Review of Research,” Proceedings of the International AAAI Conference on Web and Social Media, vol. 9, no. 1, pp. 658–661, 2015.
- [61] U. Yaqub, S. A. Chun, V. Atluri, and J. Vaidya, “Analysis of political discourse on twitter in the context of the 2016 US presidential elections,” Government Information Quarterly, vol. 34, pp. 613–626, Dec. 2017.
- [62] S. Martin-Gutierrez, J. C. Losada, and R. M. Benito, “Recurrent Patterns of User Behavior in Different Electoral Campaigns: A Twitter Analysis of the Spanish General Elections of 2015 and 2016,” Complexity, vol. 2018, p. e2413481, Dec. 2018.
- [63] J. Borondo, A. J. Morales, J. C. Losada, and R. M. Benito, “Characterizing and modeling an electoral campaign in the context of Twitter: 2011 Spanish Presidential election as a case study,” Chaos: An Interdisciplinary Journal of Nonlinear Science, vol. 22, p. 023138, June 2012.
- [64] A. Kassam, “Podemos hopes to cement rise of citizen politics in Spain after election success.” The Guardian, https://www.theguardian.com/politics/2014/may/27/podemos-citizen-politics-spain-elections-indignados-movement, May 2014. Date posted: 27-5-2014, last accessed 20-12-2021.
- [65] E. O’Leary, “Spain’s podemos surges ahead in voter poll: El pais.” Reuters, https://www.reuters.com/article/us-spain-politics/spains-podemos-surges-ahead-in-voter-poll-el-pais-idUSKBN0KK0DJ20150111, Jan. 2015. Date posted: 11-1-2015, last accessed 20-12-2021.
- [66] F. Guerrero-Solé, “Interactive behavior in political discussions on twitter: Politicians, media, and citizens’ patterns of interaction in the 2015 and 2016 electoral campaigns in spain,” Social Media + Society, vol. 4, p. 2056305118808776, Oct. 2018.
- [67] R. Minder, “In spain, new political party makes gains from surprising place — the center.” The New York times, https://www.nytimes.com/2015/11/29/world/europe/in-spain-new-political-party-makes-gains-from-surprising-place-the-center.html, Nov. 2015. Date posted: 29-11-2015, last accessed 20-12-2021.
- [68] A. Downs, An Economic Theory of Democracy. New York: Harper and Row, 1957.
- [69] P. Simón, “The challenges of the new spanish multipartism: Government formation failure and the 2016 general election,” South European Society and Politics, vol. 21, pp. 493–517, Oct. 2016.
- [70] “Escala de ubicación ideológica de partidos políticos (ideological location scale of political parties).” Centro de Investigaciones Sociológicas, http://www.cis.es/cis/opencms/EN/index.html - https://www.analisis.cis.es/cisdb.jsp, 2021.
- [71] R. Axelrod, J. J. Daymude, and S. Forrest, “Preventing extreme polarization of political attitudes,” Proceedings of the National Academy of Sciences, vol. 118, no. 50, p. e2102139118, 2021.
- [72] F. Baumann, P. Lorenz-Spreen, I. M. Sokolov, and M. Starnini, “Emergence of Polarized Ideological Opinions in Multidimensional Topic Spaces,” Physical Review X, vol. 11, p. 011012, Jan. 2021.
- [73] J. Bednar, “Polarization, diversity, and democratic robustness,” Proceedings of the National Academy of Sciences, vol. 118, no. 50, p. e2113843118, 2021.
- [74] K. Starbird, “Disinformation’s spread: Bots, trolls and all of us,” Nature, vol. 571, pp. 449–449, July 2019.
- [75] S. González-Bailón and M. D. Domenico, “Bots are less central than verified accounts during contentious political events,” Proceedings of the National Academy of Sciences, vol. 118, Mar. 2021.
- [76] T. Lim and R. J. McCann, “Isodiametry, variance, and regular simplices from particle interactions,” arXiv:1907.13593 [math-ph, stat], Feb. 2021.